Factionalized democracy, oil and economic growth in Iran ... · PDF fileFactionalized...
42
1/42 Factionalized democracy, oil and economic growth in Iran: Where is the curse? Mohammad Reza Farzanegan (Corresponding author) Centre for European Economic Research (ZEW) Address: Centre for European Economic Research (ZEW) Environmental and Resource Economics, Environmental Management Department L 7, 1 68161 Mannheim, Germany Tel.: 0049-621-1235-337 Fax: 0049-621 1235-226 E-Mail: [email protected] (Dr. M. R. Farzanegan) Internet: www.zew.de, www.zew.eu and Friedrich Schneider Johannes Kepler University of Linz Address: Department of Economics, Institute of Economic Policy, Johannes Kepler University of Linz, A 4040 Linz Auhof, Austria Tel: 0043-732-2468-8210 Fax: 0043-732-2468 -8209 Email: [email protected] (Prof. Dr. F. Schneider) Internet: http://www.econ.jku.at/schneider
Transcript of Factionalized democracy, oil and economic growth in Iran ... · PDF fileFactionalized...

1/42
Factionalized democracy, oil and economic growth in Iran: Where is the curse?
Mohammad Reza Farzanegan (Corresponding author)
Centre for European Economic Research (ZEW)
Address: Centre for European Economic Research (ZEW)
Environmental and Resource Economics, Environmental Management Department L 7, 1
68161 Mannheim, Germany
Tel.: 0049-621-1235-337 Fax: 0049-621 1235-226
E-Mail: [email protected] (Dr. M. R. Farzanegan) Internet: www.zew.de, www.zew.eu
and
Friedrich Schneider
Johannes Kepler University of Linz
Address:
Department of Economics, Institute of Economic Policy, Johannes Kepler University of Linz, A 4040 Linz Auhof, Austria
Tel: 0043-732-2468-8210 Fax: 0043-732-2468 -8209
Email: [email protected] (Prof. Dr. F. Schneider) Internet: http://www.econ.jku.at/schneider

2/42
Factionalized Democracy, Oil and Economic Growth in Iran: Where is the Curse?
Summary
This study examines the phenomenon of the “natural resource curse” in the rentier economy
of Iran. The paper shows that an increasing factionalized democracy in an oil economy is a
curse for economic growth. We find a positive and significant direct association between
natural resource wealth and economic growth in Iran from 1960-2007. However, this positive
effect is moderated by the factional politics. For the maximum level of factionalized
democracy, one standard deviation increase in the share of oil rents in the government budget
reduces real economic growth per capita by 9 percentage points.
Key words: natural resource curse, factionalized democracy, economic growth, Middle East, Iran

3/42
Acknowledgments
We wish to thank Anne-Kathrin Koch, Daniel Meierrieks, Annabel Payne, Marcel Thum, the
Editor, five referees, and participants at the Brown Bag seminar of TU Dresden, and the
Annual Congress of Vereins für Socialpolitik (2009, Germany) for their useful comments.

4/42
1. INTRODUCTION
Political power struggles among reformers, conservatives, and dozens of other factions are a
main characteristic for Iran after the Islamic Revolution of 1979. The lack of political
organization to manage the struggles of power among the revolution leaders led to the
emergence of factional politics. Oil rents in Iran are the major factor in the calculations of
political factions in their competition for executive power. The arising question is to what
extent competition among the political factions shapes the role of oil revenues in the context
of economic growth in Iran. We aim to re-visit the natural resource curse hypothesis in a
highly politically factionalized country such as Iran. The Iranian political environments
before and after the Islamic revolution and the existence of significant oil rents in both
periods provide a unique opportunity to test Bjorvatn and Selvik’s (2008) theoretical
predictions empirically (see section 2). This paper is the first empirical effort to re-examine
the natural resource curse hypothesis, taking into consideration the structural changes in
political power and the factionalized democracy in Iran, providing empirical support for the
predictions of Bjorvatn and Selvik. This study analyses the link between oil revenues and
economic growth in Iran from 1960s up to the present. The main finding is that there is a
positive effect of oil revenues on economic growth. However, this effect is moderated by the
factionalized democracy.
Iranian political history observed a significant event in the 1979 when the autocracy of
Pahlavi changed to an Islamic Republic. While in the former system, the Shah was the most
powerful person and the head of the political and economic system, the latter does not carry
the same significance in political life. Kenneth Pollack, former director of Persian Gulf affairs
at the US National Security Council, illustrates the situation in the factionalized Islamic
Republic as follows: “There are fourteen dozen different positions on each issue, and it is

5/42
very difficult to say with any certainty which of the insiders support which position” (see
Klein, 2002). Such factionalism of course needs a certain degree of democracy which was
lacking in the autocracy system of Pahlavi.1
The struggle for power is greater when there is some improvement in democracy indicators
such as Polity for the case of Iran. A clear example is the period of 1997-2004 which was
associated with the governance of reformists and the improvement of democracy indices of
Iran. Gheissari and Nasr (2006) highlighted the main properties of political factions after the
revolution in Iran: informality, absence of real organization, charter, rule or clear platform for
defining their political and economic views and memberships, and lack of any party structure.
These factions with changing boundaries and missions behaved like semi-parties within
revolutionary powers. The battlegrounds of these factions have been the parliament,
government agencies, media and different religious ceremonies such as the Friday prayer
ceremony. Gheissari and Nasr believe that factionalism dominated Iranian politics in the
1980s.
The contemporary political economic history of Iran shows that the economic system had
performed better during strong autocracies. More specifically, the GDP per capita increased at
an exceptional rate of 8% per year from 1963-1976. The non-oil GDP per capita growth was
8.6% per year (Esfahani and Pesaran, 2009). Esfahani and Pesaran discussed that one of the
main reasons behind this economic success was the concentration of power in the hands of the
Shah. This politically monopolized system implemented the constructive economic policies
such as the Second Seven Year Plan (1956-1962), limiting the power of landlords (White
Revolution), and rapid industrialization and investments in human resources. The Polity index
of Iran from 1955-1978 was -10, indicating a maximum degree of autocracy.

6/42
Figure 1 shows the trend of GDP per capita growth and Polity index under autocracy and
Islamic Republic governments in Iran. We have divided this time span over four sub-periods,
e.g. 1965- 1978 (autocracy of Shah), 1979-1988 (Islamic revolution and Iraq-Iran war), 1989-
1996 (presidency of Hashemi Rafsanjani and reconstruction of the economy), 1997-2005
(presidency of Khatami and social-political reforms). The highest records of GDP per capita
growth are observed under the strong autocracy of the Shah from 1965-1978 in Figure 1. Oil
rents have existed in all of these different polities and have played an important role in the
economic system (see Appendix A for the trend of oil revenues and share of oil revenues in
total revenues, and growth rate of oil revenues in Iran). However, the system’s outcomes are
different. Destructive competition, especially in the post-revolutionary factionalized system,
has eroded the effectiveness of oil revenues in economic growth process. Figure 2 also shows
the relative superior performance of autocracy in a term of industrialization and investment
compared to the post-revolutionary factionalized system.2
Figure 1 here
Figure 2 here
The post-revolutionary period in Iran has been the ground of competition among different
conservative and reformist factions (see Bjorvatn and Selvik, 2008 and Gheissari and Nasr,
2006 for an excellent discussion on this issue). The political power structure and competition
of different political factions in a rentier economy3 is a critical issue for the transformation of
resource wealth to a curse or blessing. This study focuses on the case of Iran to investigate the
role of natural resource wealth in economic growth, taking into consideration the
development of factionalism and political competition.

7/42
The paper is organized as follows. In section 2, we discuss the natural resource curse debates
in literature. The main hypotheses, data and empirical model are presented in section 3.
Section 4 presents the empirical results. Finally, section 5 concludes.
2. REVIEW OF LITERATURE
Our study is mainly related to natural resource curse literature. The disappointing
performance of resource rich economies (especially those with a point resource such as oil)
draws our attention to the natural resource curse hypothesis. Resource curse literature is about
the puzzling role of natural resources in economic growth. It is a common wisdom that those
countries rich in natural resources, especially oil, are suffering from a lower economic growth
compared to those without such resources (see Sachs and Warner, 19954 and 2001). The
question is what really causes such disappointing results from richness in natural resources?
Do oil revenues and resources in themselves hinder economic growth? The blessing and the
curse of oil wealth needs to be analyzed in both a realistic and practical way. “To an optimist,
the possession of oil reserves is an unqualified blessing. To a pessimist, the possession of oil
is a predictable curse. To a realist, oil, as anything else in life, can be blessing or curse, it all
depends what is done with it” (Askari, 2006, p.8). What is done with oil should be traced
through the political economy of oil exporting countries. Political factionalism in young and
fragile democracies and destructive competition among these factions for oil rents in oil rich
economies might be a key for a “resource curse” black box.
Besides examining the direct effect of resource wealth on growth, economists have also paid
attention to interactions between institutions with resource wealth in their analysis of the
natural resource curse. In their theoretical model, Robinson et al. (2006), show that the final
impact of the resource booms on the growth depends on the quality of institutions. Based on

8/42
their model, the lack of institutions promoting accountability and state competence is the main
cause of the natural resource curse.
Bjorvatn and Selvik (2008) explicitly modeled the role of the political power structure in a
rentier economy using descriptive evidence of the Iranian society. The theoretical model of
Bjorvatn and Selvik (2008) which explains the role of political power distribution and
factionalism on oil-growth nexus has inspired the empirical strategy of our paper. Their
theoretical model predicts that resources are wasted during competition for rents and the
structure of a political system or factionalism significantly affects the allocation of oil rents
among entrepreneurs. Indeed, in their model, the combination of political power structure and
oil rents is critical for explaining growth. They conclude that given a high level of oil rents, an
increasing dominance of one political group reduces welfare loss. This is because of a fall in
rent-seeking intensity with asymmetry in political power. Thus, in their analysis, higher
political competition reducing the dominance of one group in the politics of a rentier economy
is not an optimum. They emphasize the lack of state autonomy after the Islamic Revolution of
1979, in contrast to the autocracy of Mohammad Reza Shah which intensified rent-seeking
among different political factions. Such destructive competitions for oil rents have
transformed the oil wealth into a curse in Iran. They conclude that to improve the economic
performance of Iran, it is necessary to move toward a more autonomous state. Our empirical
investigation provides evidence for their theoretical predictions in the case of Iran.
There are several empirical studies on the growth-natural resource nexus which take the
institutional quality into account. Most of these studies are cross-country analyses (see, for
example, Boschini et al., 2007; Mehlum et al., 2006; Brunnschweiler and Bulte, 2008;
Brunnschweiler, 2008 and Iimi, 2007). However, how the institutions influence the
relationship between natural resources and growth is country specific (Bjorvatn and Selvik,

9/42
2008). After all, oil rich economies vary considerably in terms of their institutions, political
economy structure, demographic and social norms which make it difficult to address in
cross-country analyses.5
Theoretically, natural resource abundance could increase growth because it provides
necessary funds for investment in infrastructures and human development (Sachs and Warner,
1999 and Murphy et al., 1989). Negative side-effects of natural resource abundance or
dependence may not crowd out completely the positive effects on growth.6 However, most
cross-country studies, even after controlling for interaction terms, have estimated a negative
and significant association between a natural resource abundance or dependence variable and
economic growth (see, for example, Sachs and Warner, 2001 (using natural resource exports
in GDP as a proxy for resource abundance), and Iimi, 2007 (using mineral exports per capita
as a proxy for resource abundance). Boschini et al. (2007) and Mehlum et al. (2006) show that
this negative association is stronger for minerals than general resources. Furthermore, based
on their estimations, the role of institutions is more important for the effect of minerals than
other resources on growth. Boschini et al. (2007) discussed the concept of appropriability of
natural resources. By appropriability, they mean the likelihood that natural resources lead to
rent-seeking, corruption or conflicts. Determinants of appropriability of a resource in their
view are the type of resource and the quality of institutions.
Using natural resource wealth data of the World Bank (1997, 2005), Brunnschweiler (2008)
carried out a cross-country analysis, showing a positive direct association between the World
Bank measure of resource wealth and economic growth, even after controlling for the quality
of institutions. She suggests that the findings are highly significant when concentrated on
mineral resources. Brunnschweiler concludes that the results are in contrast to most of the
natural resource-growth literature. She suggests that the frequent observed negative

10/42
association can be due to the use of a specific natural resource abundance variable (i.e. a share
of primary exports in GDP).
In a theoretical model, Mehlum et al. (2006) introduced the concepts of “production friendly”
and “grabber friendly” institutions in the natural resource-growth nexus. They test their model
empirically by using the Sachs and Warner (1997) natural resource variable (a share of
primary export in GNP). Their institutional quality index is an unweighted average of six
indicators of ICRG: a rule of law index, a bureaucratic quality index, a corruption in
government index, a risk of expropriation index, and a government repudiation of contracts
index. Their resource abundance coefficient is always negative and significant which is
moderated by the quality of institutions. They conclude that the natural resource curse can
only be observed in the countries with “grabber friendly” institutions. Torvik (2002)
theoretically investigated the effect of natural resources on entrepreneurs’ activities. He
suggests that increasing natural resource rents motivates the entrepreneurs’ activity in rent-
seeking, diverting them from the productive part of the economy. He concludes that fall of
income due to this re-allocation of entrepreneurs outweighs the benefits of natural resource
rents.
The role of natural resources on domestic instability and civil war among different factions
has been investigated as well. For instance, Collier and Hoeffler (1998) show, that the
ownership of natural resources has a non-linear effect on the initiation and the duration of a
civil war. The effect of natural resources on growth is more crucial in polarized societies.
Montalvo and Reynal-Querol (2005) show that polarized societies with large rivalling groups
have a greater potential for rent-seeking, corruption, and conflict.
Esfahani (2007) emphasizes the negative indirect effects of democratization and factionalism
for countries rich in natural resources. He discusses that since in these countries the public

knows about the direct access of the government to resource rents, they expect and demand to
have a share in these rents. This usually leads to inefficient mass subsidies with negative
market distortion effects. In a republic state with rich oil resources such as Iran, the local
interest groups put pressure on the elected government to distribute these oil rents through
different protectionist policies and subsidies.7 Torvik (2009) has summarized more details on
the recent developments in the resource curse literature.
3. EMPIRICAL MODEL AND DATA
The main hypothesis of this study is that the “oil resources revenues” have a direct positive
effect on economic growth.8 However, the interaction of a factionalized democracy with oil
rents has a negative effect on economic growth. The final impact of oil rents, therefore, varies
with changes in the factionalized democracy. These hypotheses will be tested by using
different factionalized democracy indicators, and oil dependency and abundance variables.
(a) Econometric specification
We modified the cross-country specification of Boschini et al. (2007), applying the following
specification for our time series analysis:
tttttttt facnrfacnrGG ).(... . 32121-1 (1)
where G is the real per capita GDP growth rate, X is a vector of control variables including
investment as a ratio of the real GDP (Inv_gdp), changes in oil prices (Oil_g; as a proxy for
changes in terms of trade), inflation rate (Inf; as a measure of macroeconomic instability),
real government consumption as a ratio of real GDP (Govex_gdp; a proxy for size of
government distortions in the economy), real per capita GDP growth rate of OECD countries
(OECD_GDPPCG; a proxy for external demand of Iran major trade partners), a dummy
variable for Iran-Iraq war (Wardummy; for period of 1980-1988), and the lag of the dependent
11/42

12/42
variable (Gt-1; to control for the dynamic path of economic growth).9 nr is the natural resource
abundance and dependence.
The main proxy for oil dependency in this study is the share of oil revenues in total revenues
of government (oilrev_trev). The proxy for oil abundance is per capita daily oil production
(pcoil_produc).10 The fac variable refers to factionalism and the degree of political groups’
competition. nrt×fact is an interaction term of oil dependence and/or abundance variable with
an index of factionalism and ε is the error term which is assumed to be independent from
other regressors.
The model will be estimated with Dynamic Ordinary Least Squares (DOLS) and 2SLS
methods. The marginal impact of a unit increase in the oil rent variable on economic growth
is β1+β3fac. Based on the theoretical predictions of Bjorvatn and Selvik (2008), the sign of β1
should be positive and the sign of β3 should be negative. This means that increasing factional
politics (increasing fac) and oil rents lead to “destructive competition” and intensive rent-
seeking. Thus, the final effect of oil rents on growth is conditional on the level of
factionalized democracy.
The expected effects of control variables are straightforward. The share of real investment in
real GDP in the neoclassical growth model is an indicator of saving rates. A higher level of
this ratio, therefore, has a positive effect on growth. An increase in government consumption
in the economy is expected to result in crowed-out private investment and increases of the
regulatory burden. This argument is more significant considering the role of the state in the
Iranian economy. Thus, it should have a negative effect on growth. Improving terms of trade
(export prices/import prices) which is proxied by the growth rate of oil prices is expected to
have positive effects on growth. Since the major export products of Iran are oil and refinery
products, this variable is a valid indicator in the fluctuations of the terms of trade. We also

13/42
expect that a higher growth in the major trading partners of Iran (OECD region) will
positively influence the economic growth of Iran.
In summary, the main hypotheses are as follows:
H1: The direct effect of oil revenues on the real growth rate of Iranian economy is positive,
ceteris paribus.
H2: The final (overall) effect of oil revenues on the real growth rate of Iranian economy
depends on the degree of factionalized democracy. A higher symmetry of political power (i.e.
higher factionalized democracy or lower degree of dominance of one group) besides higher
oil rents has a negative effect on real growth rates. Table 1 shows the hypothesized effects of
independent variables on the real per capita GDP growth rate of the Iranian economy.
Table 1 here
(b) Measuring factionalized democracy
Factionalism is not directly observable. Zariski (1960, p.33) defined a faction as “any intra-
party combination, clique, or grouping whose members share a sense of common identity and
common purpose and are organized to act collectively – as a distinct bloc within the party –
to achieve their goals”. Beller and Belloni (1978, p.419) defined factions as “any relatively
organized group that exists within the context of some other group and which (as a political
faction) competes with rivals for power advantages within the larger group of which it is a
part”. Factionalism usually happens in new democracies and in the transit period from
autocracy to democracy. Young partial democracies usually have weak party systems and
political participation is realized through traditional and factional networks (Goldstone et al.,
2005). Goldstone et al. believe that factionalized democracies arise as a part of transition from
autocracy to partial democracy. Based on their study, the most unstable environment is a
14/42
partial democracy with a high degree of factionalism, while the most stable system is a strong
autocracy.
Türsan (1995) investigated factionalism in Turkey, mentioning that factionalism is a product
of frequent interruptions to democracy and it is the main cause of party system instability.
Corkill (1995) explains the key factor for emergence of factionalism in theory. He emphasizes
that “a nascent and weakly institutionalized political system, where party discipline and
organization are weak, should provide optimum conditions for boosting factionalism”.
Marshall and Jaggers (2007, p.3) have separated fragmentation from factionalism. They
explain that “factionalism occurs inside the political arena of a polity, whereas fragmentation
occurs when groups operate outside the political system and in direct opposition to state
authority”.
Basedau and Köllner (2005) summarized the main characteristics of political factions. In their
analysis, a faction is any intra-party grouping which exists for a certain period of time, has an
organization, shares common goals and pursues them actively. All these approaches to
factionalism show that it requires a certain degree of democracy to flourish. It is mostly a
phenomenon of countries in transit from an autocracy or dictatorship to an established
democracy. Factionalism is in close tie with political instability. We can call such systems
under transition factionalized democracies.11
There are some quantified indices which we can use as proxies for factionalized democracies.
We consider the following variables as indicators of factionalized democracy in Iran:
Polity2 (Marshall and Jaggers, 2007): As measured by Polity (Parcomp; the
competitiveness of participation), factionalism happens when the political competition
is dominated by ethnic or other parochial groups that regularly compete for political
influence in order to promote particularistic agendas and favor group members instead

15/42
of national favors. The Parcomp index categorizes the competitiveness of
participation12 in different groups: (1) repressed, (2) suppressed, (3) factional, (4)
transitional and (5) competitive. The “repressed” category refers to those countries in
which no significant oppositional activity is permitted outside the ranks of the regime
or ruling party. Systems such as totalitarian party systems, military dictatorships, and
despotic monarchies are in this category. In the second category, the suppressed
systems, some organized political competition happens outside of the government
without serious factionalism. However, these political competitions are under the
control of the regime and censorship is a common practice. In this category, the
government prohibits some kinds of political organization and some political actions.
The opposition leaders are under strict monitoring or frequent political pressures by
the ruling government. The third category is the factional system (see above
definition). The next stage is the transitional system. These are any arrangements for
transit from a factional system to a fully competitive system. Finally, the competitive
system closes these categories. It is relatively stable and enduring. In this stage, small
parties and groups may be restricted in the competitive pattern.
The Parcomp index for the most years of Mohammad Reza Shah codes as 1
(repressed), while for the most years of post-revolution codes as 2 (suppressed). The
exception is the reformist government of Khatami period which shows the value of 3
(factional). Since Parcomp has some missing values for the initial years of Islamic
Republic system, we use the polity2 as an alternative indicator. Polity2 scores are
between -10 and +10. A +10 refers to “strongly democratic” state and -10 to “strongly
autocratic”. The Polity2 and Parcomp indices are perfectly correlated.13 Thus, using
polity2 instead of Parcomp captures the concept of factionalized democracy
adequately.

16/42
Van_index: This index combines two basic dimensions of democracy – competition
and participation – measured as the percentage of votes cast for parties other than the
largest (competition) times the percentage of the population who actually voted in the
election (participation). This product is divided by 100 to form an index that in
principle could vary from 0 (no democracy) to 100 (full democracy). Higher levels of
this index reflect more competition of factions within political power and the
participation of their supporters. This index seems to show the symmetric or
asymmetric degree of political power better. As Marshal and Jaggers (2007)
mentioned, in the final stage of transit toward an established democracy (e.g. stage 5:
competitive system) small parties or political groups may be restricted in the
competitive pattern. Thus, an increasing Van_index shows a transit way toward the
last stage of the democracy cycle. Increasing the percentage of votes cast for parties
other than the largest means higher competition of smaller parties or factions in a
country showing more characteristics of a factionalized democracy than an established
one.
Van_comp: This variable portrays the electoral success of smaller parties, i.e. the
percentage of votes gained by the smaller parties in parliamentary and/or presidential
elections. The variable is calculated by subtracting from 100 the percentage of votes
won by the largest party (the party which wins most votes) in parliamentary elections
or by the party of the successful candidate in presidential elections. The variable thus
theoretically ranges from 0 (only one party received 100 % of votes) to 100 (each
voter cast a vote for a distinct party).
Van_part: The percentage of the total population who actually voted in the election.
The group of Van indicators introduced by Vanhanen (2000).

17/42
More details on variables and sources are presented in Appendix A. Table 2 shows the
correlation among different proxies of factionalized democracy. The correlation among these
indicators is statistically significant.
Table 2 here
4. EMPIRICAL RESULTS
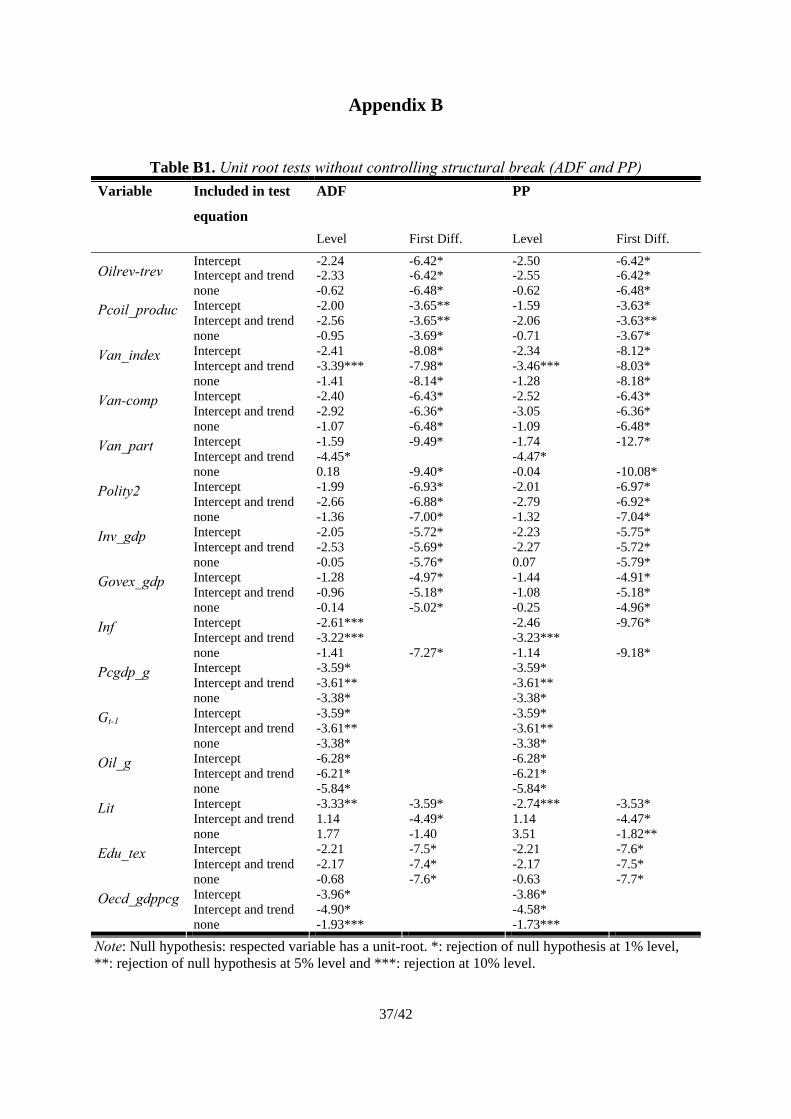
The first step before running regressions is checking the time-series properties of the variables
in the model. Since the time period of our study covers different political regimes before and
after the Islamic Revolution of 1979, then structural break is a possibility within our variables.
In such a case, the most common unit-root tests, namely Augmented Dickey-Fuller (ADF)
and Phipps-Perron (PP) tests may not be efficient.14 We should control for the possibility of
structural breaks. Thus, we apply the ZA unit root test introduced by Zivot and Andrews
(1992). Through the Zandrews test we have examined for a single structural break in the
intercept and/or in the trend of the time series. The optimal lag length was selected by a t-test.
There are some minor contradictions between ZA unit-root results with those not controlling
for a structural break. Thus, we relied on the outcome of the ZA unit-root tests for further
analysis of our hypotheses.
The ZA test results show that, except for van_part (Vanhanen participation index), inf
(inflation), pcgdp_g (per capita GDP growth rate), oil_g (growth rate of oil prices), and
oecd_gdppcg (per capita GDP growth of OECD) which are I (0) at 1% or 5% levels, the
remaining variables are I (1). Thus, the I (1) variables are entered into regression models after
taking the first difference. The unit root tests of variables without controlling for structural
break (ADF and PP tests) and with controlling break (ZA test) are presented in Tables B1 and
B2 (Appendix B), respectively.

18/42
In order to examine the effects of different natural resource abundance and dependence
variables on the Iranian economic growth and role of a factionalized democracy, we set up a
dynamic ordinary least squares (DOLS). In this framework, it is also possible that
factionalism and natural resource related variables are affected by economic growth. Thus, the
independent variables may be contemporaneously correlated with the error term. To address
this problem, we use 1 to 4 years’ lags of independent variables as instruments. Usually, there
is no significant correlation between lagged variables and disturbance. Furthermore, there can
be another concern about the effect of “oil-rent” specific variables and factionalism which in
turn influence economic growth. In this case, we still have a correct model but it may not be
an efficient specification. We can show that this issue is a not a source of concern for our
case. The correlation of “oil-rent” dependency and abundance variables with factionalism
variables is not statistically different from zero.
Tables 3 and 4 show the direct and indirect effects of “oil dependency and abundance” on real
economic growth. We have separated these tables by using different natural resource variables
in order to provide more insight into specific differences in the interaction of factionalized
democracy with resource rents.
As is evident in Tables 3 and 4, even after controlling for the most important variables in
growth literature and interaction effects, we cannot identify a direct negative effect from
higher oil rents on the economic growth of Iran. The oil rent in itself is not a curse for the
economy, but a blessing. It provides necessary resources for financing the process of
economic growth. Nevertheless, the final effect of oil dependency and abundance depends on
the changes of factionalized democracy indicators.
The negative and significant sign of interaction terms (β3) in most specifications shows that an
increasing struggle of political groups for power and increasing oil rents reduce economic

19/42
growth. Destructive competition of factions and directly unproductive activities aiming to
capture a part of oil revenues increases inefficiency and consequently wastes scarce resources
within the economy. This can be compared with the classification of institutions to “grabber
friendly” and “productive friendly” as discussed by Mehlum et al. (2006). Benevolent
autocrats design economic institutions to increase the economic growth and consequently the
size of their own benefits (see Lambsdorff, 2007, p.86). These productive friendly institutions
were weakened significantly under a factionalized democracy in post-revolution. Grabber
friendly institutions boosted during this period and are reflected in historical black market
premium, illegal trade, and the increasing presence of military bodies in the national economy
(Farzanegan, 2009).
It seems, at least in the short term, that young democracies with a fragile and factional nature
in a rentier economy experience poor growth. Of course, this observation does not undermine
the long term benefits of an established democracy. The main puzzle is how a government in
an oil economy should manage the transit path from a fragile and factional democracy to an
established one with minimum negative side effects on the economy.
The effects of other control variables are consistent with our expectations and economic
theory. The share of investment in GDP has a positive, significant and stable effect on growth
over all specifications. An increase in government consumptions in GDP has a negative and
significant effect on growth in most specifications, especially in 2SLS estimations. Inflation
as an indicator of macroeconomic instability has negative effects on growth. The lagged term
of real economic growth has a positive effect on current growth, but it is not statistically
significant in most specifications. It seems that its effects are reduced by contributions from
other main control variables. The oil price growth rate has positive and significant effects on
growth when we use an oil abundance variable. It seems that the growth rate of OECD

economies has no significant effect on the Iranian economy when we control for other
variables. This might be due to a lower degree of integration of the Iranian economy in the
global markets. In order to control for the effects of eight years’ war with Iraq on growth rates
we included a dummy variable. The effect of a war dummy is significantly negative in all
specifications.
The Ramsey test indicates that we do not have a serious problem with an omitted variable bias
in any specifications. Also based on the LM test, we can accept that in most specifications our
main findings are immune to the possible autocorrelation of residuals. Normality assumption
is required in order to conduct single or joint hypothesis tests about the model parameters.
The Jarque-Bera tests in all specifications cannot reject the null hypothesis of residual
normality, increasing the confidence in the inferences that we make about the coefficient
estimates. The R-squared criteria show that a significant portion of changes in the real
economic growth of Iran can be explained by included explanatory variables in
specifications.15
Table 3 here
Table 4 here
Since natural resource dependence variables have a different unit of measurement (%) than
natural resource abundance variables (per capita daily production of oil), comparing their
direct and indirect effects may not be very precise. To get a better picture of the size and
interpretation of effects, we calculate the marginal effects of one standard deviation increase
in a related natural resource variable at different levels of factionalized democracy on the real
per capita GDP growth. For illustration, we use coefficients in Tables 3 and 4 for Van_index
variable (S1 (2SLS), and S5 (2SLS)). Using Eq. 2, we calculate these marginal effects.
)(. 31 nrstdDDfacG (2)
20/42

21/42
Where G is the real per capita GDP growth rate, fac is Van_index, and std(nr) is a standard
deviation of the first difference of natural resource abundance (per capita daily oil production)
and dependence (share of oil revenues in total revenues of government) and D is the
differencing operator. Table 5 presents the effect of one standard deviation increase in the
natural resource variables, taking into consideration the maximum, minimum and mean value
of D (van_index) on the real GDP per capita growth rate.
Table 5 here
Table 5 shows that an increase of one standard deviation in the share of oil revenues in the
total revenues of the government (D (oilrev_trev)) has a significant dampening effect on the
real growth when we have the maximum level of factionalized democracy (D (van_index)). In
other words, ceteris paribus, with a maximum level of factionalized democracy, the Iranian
real per capita income growth rate decreases by about 9 percentage points, if the shares of oil
revenues in the total revenues of state increase by one standard deviation.16 By having the
minimum level of factionalized democracy or higher dominance of one political group, the
Iranian real per capita income growth rate increases by about 8 percentage points, if
D(oilrev_trev) increases by one standard deviation. This result supports our initial hypothesis,
asserting that factionalized democracy and the reduction of dominance of one political group
intensify political strugglers for oil rents in the government budget. The share of oil revenues
in the total revenues of the government in annual budgets shows exactly the available oil rents
for political groups.
On the other hand, per capita daily oil production, more or less, shows the abundance of oil
resources. Yet we see that by a maximum level of factionalized democracy, the positive
effects of oil abundance on growth are significantly lower than the minimum level of

22/42
factionalized democracy option. However, it is still positive. In other words, by having a
maximum factionalized democracy, Iranian real per capita income growth rate increases just
by 0.88 percentage point, if daily oil production per capita increases by one standard
deviation. Such a low positive effect could be changed to a more significant rise of about 5
percentage points if we were in the minimum level of factionalized democracy.
5. CONCLUSION
This paper re-examines the phenomenon of the natural resource curse, using the Iranian
economy as a case study. The paper discussed that oil rents are not de facto harmful for the
economy. What is detrimental is the “destructive competition” within the political power
structure for these rents. The pre-revolution monopolized political power was more growth
friendly than the post-revolution factionalized semi-democracy. Controlling for indirect
effects of oil rents on the economic growth through changes of political competition, we
conclude that higher levels of factionalism in the political system and bolder competition
among different political factions in a semi-democracy system like Iran reduce the positive
effects of oil wealth on growth. This is mainly due to instability of the system under a
factionalized democracy. The period of reformist government from 1997-2004 is a clear
example of the severe tension and confrontation between reformist and conservative factions.
According to one of Khatami’s famous statements at the end of his first term, his government
faced a crisis every nine days.17
Our findings are robust after controlling for possible endogeneity. The empirical results of
this study are in line with the theoretical predictions of Bjorvatn and Selvik (2008). It is
important to recall that the unstable nature of a factionalized democracy is a curse for an oil
rich economy. In those countries such as Norway with a long history of established

23/42
democracy we should not expect such an outcome. It will be interesting to examine the effect
of factionalized democracy on the economic growth in other resource rich countries in future.
NOTES
1 “Within the modernization paradigm, factionalism precedes the formation of modern parties which develop as
channels of mass participation and thus act as important agencies of eventual democratization”.(Lewis, 1995,
page 105). Indeed, factionalism may refer to a primitive and immature form of democracy which is a property of
political systems in transition to democracy.
2 It is obvious that a change in the Polity index is not the only factor behind fluctuations of economic growth in
Iran for the past decades. The Islamic revolution of 1979, eight years war with Iraq (1980-1988), fluctuations of
oil prices, macroeconomic instability and volatile inflation, the government interventions in the economy, the
size of investment in domestic economy and the economic growth of the Iran’s main trading partners should also
be taken into account (see section 3 for further details).
3 Rentier economies are those in which resource wealth provides a high proportion of government revenue; e.g. a
high resource-to-revenue ratio (see Herb 2005, p.8). Not any kind of resource wealth makes such a rentier state.
Usually, oil resources which are geographically concentrated where the extraction is highly capital-intensive and
requires complex and expensive technology. This imposes severe barriers for entrance of private companies in
this industry providing the flow of rents to the state (see Farzanegan and Markwardt, 2009 for detailed analysis
of the Iranian oil-based economy).
4 Sachs and Warner (1995) made a major contribution when they showed a negative link between natural
resource abundance and growth in a cross-country analysis.
5 The approach of this paper is in line with a collection of case studies in Rodrik (2007), shedding light on the
critical role of factionalism for economic growth by studying country specific experiences. “I believe in the need
for both cross-country regressions and detailed country studies. Any cross-country regression giving results that
are not validated by case studies needs to be regarded with suspicion...” (Rodrik, 2007, p.4).
6 These negative side-effects such as the Dutch disease, the lack of economic diversification, rent-seeking and
civil conflicts, corruption and weak political institutions are well documented and explained in the literature (for
more details see Iimi, 2007). We thank an anonymous referee for raising this point.
7 The mass subsidies and inefficient protectionism through popular macroeconomic policies in post-
revolutionary Iran resulted in a significant amount of smuggling. For more details see Farzanegan (2009).

24/42
8 The positive role of natural resources in economic growth is discussed by Habakkuk (1962). In his analysis,
one of the main reasons behind the surpassing of England by the United States in the 19th century was the greater
natural resource endowment.
9 According to Sachs and Warner (2001), it might be difficult to observe the omitted variable affecting growth.
Thus, they suggest as a solution that one should control for previous growth rates in regressions. Based on those,
the lagged growth rates would be correlated with the omitted variables and therefore also be a proxy for them.
10 Besides oil production per capita, we can use oil reserves per capita as a measure of oil abundance. These two
measures capture exogenous oil wealth. We use oil production because of its availability for a longer period.
Another reason motivating us to use production data rather than reserve figures is the uncertainty about the
accuracy and reliability of oil reserves within the OPEC countries. Oil dependency, on the other side, captures
materialized rents in the government budget. Political factions are more interested in these more tangible rents
rather than oil reserves or production.
11 Factionalism is a post-revolutionary characteristic of the political economy of Iran. Currently, there are 240
legal political groups, communities and factions in Iran competing inside the Islamic Republic’s accepted norms
(see Iranian Ministry of Interior list of political groups, communities or factions at:
http://www.moi.ir/Portal/File/ShowFile.aspx?ID=10446318-e7d0-436c-8e57-18dc55b5245d ).
12 “The competitiveness of participation refers to the extent to which alternative preferences for policy and
leadership can be pursued in the political arena.” (Marshall and Jaggers, 2007, page 25).
13 The correlation between polity2 and Parcomp from 1959-2007 is 0.96 with a t statistics of 24.1, implying a
high comovement between these two indicators. This correlation from 1800-2008 is 0.66 with t statistics of
12.08.
14 We thank Daniel Meierrieks for raising this point.
15 For the robustness test, we have also excluded the observation under the Shah monarchy (1959-1979). It might
be interesting to see whether the interaction term remains significant with the post-revolution observations. In
addition, it may be also important to control for human capital. Investment in basic and higher education has
increased significantly since the revolution (see Jbili et al., 2007). However, as Farzanegan (2009), Pritchett
(2001) and Benhabib, and Spiegel (1994) have shown, higher education levels may have no effect on aggregates,
so long as other bottlenecks remain. The results of these estimations are presented in Appendix C.
25/42
16 For example, this figure is obtained through specification 1(2SLS) of Table 3: (0.32-0.22*6.1)*8.79= -8.98.
Since we are using the differenced transformation of fac, nr, and G in our calculations, thus the unit of standard
deviation is in percentage points and not percent.
17 http://www.rferl.org/content/pressrelease/1499795.html

26/42
x
REFERENCES Askari, H. (2006). Middle East oil exporters: What happened to economic development? Cheltenham:
Edward Elgar.
Basedau, M., & Köllner, P. (2005). Factionalism in political parties: an analytical framework for
comparative studies. German Overseas Institute (DÜI) working paper no.12.
Beller, D., & Belloni, F. (1978). Party and faction: modes of political competition. In F. Belloni., & D.
Beller (Eds.), Factions politics: Political parties and factionalism in comparative
perspective (pp. 417-450). Santa Barbara, CA: ABC CLIO.
Benhabib, J. & Spiegel, M.M. (1994). The role of human capital in economic development evidence
from aggregate cross-country data. Journal of Monetary Economics, 34(2), 143-173.
Bjorvatn, K. & Selvik, K. (2008). Destructive competition: Factionalism and rent-seeking in Iran.
World Development, 36(11), 2314-2324.
Boschini, A.D., Pettersson, J. & Roine, J. (2007). Resource curse or not: A question of appropriability.
Scandinavian Journal of Economics, 109(3), 593-617.
Brunnschweiler, C.N. (2008). Cursing the blessing? Natural resource abundance, institutions and
economic growth. World Development, 36(3), 399-419.
Brunnschweiler, C.N., Bulte E.H. (2008). The resource curse revisited and revised: A tale of
paradoxes and red herrings. Journal of Environmental Economics and Management, 55(3),
248-264.
CBI (2009). Central Bank of Iran time series economic database (first edition). Available at:
UUhttp://tsd.cbi.ir/IntTSD/EnDisplay/Display.asp
Collier, P. & Hoeffler, A. (1998). On economic causes of civil war. Oxford Economic Papers,
50(4), 563-573.
Corkill, D. (1995). Party factionalism and democratization in Portugal. In R.Gillespie, M.Waller &
L.,L.Nieto (Eds.), Factional politics and democratization (pp. 64-77). Oregon: Frank
Cass & Co. Ltd.

27/42
Esfahani, S.H. (2007). A reexamination of the political economy growth in MENA countries. In H.
Pesaran & J.B. Nugent (Eds.), Explaining growth in the Middle East (pp. 61-101). North
Holland: Elsevier.
Esfahani, H.S. & Pesaran, H. (2009). Iranian economy in the twentieth century: A global perspective.
Iranian Studies, 42 (2), 177-211.
Farzanegan, M.R. (2009). Illegal trade in the Iranian economy: Evidence from a structural model.
European Journal of Political Economy, 25(4), 489-507.
Farzanegan, M.R. & Markwardt, G. (2009). The effects of oil price shocks on the Iranian economy.
Energy Economics, 31(1), 134-151.
Gheissari, A. & Nasr, V. (2006). Democracy in Iran: History and the quest for liberty. New York:
Oxford University Press.
Goldstone, J.A., Bates, R., Gurr, T.R., Lustik, M., Marshall, M.G., Ulfelder, J., & Woodward, M.
(2005). A global forecasting model of political instability. Paper prepared for the annual
meeting of the American Political Science Association, Washington, D.C.. Available at:
http://globalpolicy.gmu.edu/pitf/pitfp5.htm (Access: 17 December 2009).
Habakkuk, H. J. (1962). American and British technology in the nineteenth century. Cambridge, MA:
Cambridge University Press.
Herb, M. (2005). No taxation without representation? Rents, development and democracy.
Comparative Politics, 37(3), 297-317.
IFS (2009). International financial statistics (online database). Washington, D.C.: International
Monetary Fund.
Iimi, A. (2007). Escaping from the resource curse: Evidence from Botswana and the rest of the world.
IMF Staff Papers, 54(4), 663-699.
Jbili, A., Kramarenko, V. & Bailen, J. (2007). Islamic Republic of Iran: Managing the transition to
market economy. Washington, D.C.: International Monetary Fund.
Klein, J. (2002). Shadow Land. New Yorker. (18 February 2002)

28/42
Lambsdorff, J.G. (2007). The institutional economics of corruption and reform theory, evidence,
and policy. Cambridge: Cambridge University Press.
Lewis, P.G. (1995). Poland and Eastern Europe: Perspectives on party factions and factionalism. In
R.Gillespie, M.Waller & L.,L.Nieto (Eds.), Factional politics and democratization (pp.
102-124). Oregon: Frank Cass & Co. Ltd.
Marshall, M.G. & Jaggers. K. (2007). Polity IV project: Political regime characteristics and
transactions, 1800–2002. University of Maryland.
Mehlum, H., Moene, K. & Torvik, R. (2006). Institutions and resource curse. Economic Journal,
116(508), 1-20.
Montalvo, J. G. & Reynal-Querol, M. (2005). Ethnic polarization, potential conflict, and civil wars.
The American Economic Review, 95(3), 796-816.
Murphy, K., Shleifer, A. & Vishny, R. (1989). Industrialization and the big push. Journal of Political
Economy, 97(5), 1003-10026.
Pritchett, L. (2001). Where has all the education gone? The World Bank Economic Review, 15(3),
367-391.
Robinson, J.A., Torvik, R. & Verdier, T. (2006). Political foundations of the resource curse. Journal of
Development Economics, 79(2), 447-468.
Rodrik, D. (2007). One economics, many recipes: Globalization, institutions, and economic growth.
Princeton NJ: Princeton University Press.
Sachs, J.D. & Warner, A.M. (1995). Natural resource abundance and economic growth. NBER
working paper, no. 5398.
Sachs, J.D. & Warner, A.M. (1997). Sources of slow growth in African economies. Journal of African
Economies, 6(3), 335-376.
Sachs, J.D. & Warner, A.M. (1999). The big push, natural resource booms and growth. Journal of
Development Economics, 59(1), 43-76.
Sachs, J.D. & Warner, A.M. (2001). The curse of natural resources. European Economic Review,
45(4-6), 827-838.

29/42
Torvik, R. (2002). Natural resources, rent-seeking and welfare. Journal of Development Economics
67(2), 455-470.
Torvik, R. (2009). Why do some resource abundant countries succeed while others do not? Oxford
Review of Economic Policy 25 (2), 241-256.
Türsan, H. (1995). Pernicious party factionalism as a constant of transitions to democracy in
Turkey. In R. Gillespie, M. Waller & L. L. Nieto (Eds.), Factional politics and
democratization (pp. 168-184). Oregon: Frank Cass & Co. Ltd.
Vanhanen, T. (2000). A new dataset for measuring democracy, 1810-1998. Journal of Peace
Research, 37(2), 251-265.
World Bank. (1997). Expanding the measure of wealth: Indicators of environmentally sustainable
development. Environmentally sustainable development studies and monographs series, no.
17.
World Bank. (2005). Where is the wealth of nations? Measuring capital for the XXI century.
IBRD/World Bank, Washington, DC.
World Bank. (2008). World development indicators CD-Rom.
Zariski, R. (1960). Party factions and comparative politics: some preliminary observations. Midwest
Journal of Political Science, 4(1), 26-51.
Zivot, E. & Andrews, D. (1992). Further evidence on the Great Crash, the oil price shock, and the
unit-root hypothesis. Journal of Business and Economic Statistics, 10(3), 251-70.

30/42
Table 1. Hypothesized effects of independent variables
Independent variable Expected sign
Natural resource (nr) proxies:
Oil revenues / total revenues +
Per capita daily oil production +
Factionalized democracy
variables (fac)
Van_index +/-
Van_comp +/-
Van_part +/-
Polity2 +/-
fac × nr -
Investment /GDP (Inv_gdp) +
Gov_expenditure/GDP
(Govex_gdp) -
Inflation (inf) -
Oil price growth (oil_g) +
OECD_gdppcg +
Wardummy -
Lag of dependent variable (Gt-1) +
Table 2.Correlation Matrix
Correlation van_comp van_index van_part polity2
van_comp 1.000
van_index .94 (18.3) 1.000
van_part 61 (5.22) .76 (7.92) 1.000
polity2 .67 (6.13) .81 (9.47) .85 (10.8) 1.000
Note: t statistics are in parenthesis. Adjusted sample is from 1959-2004

31/42
Table 3. OLS & 2SLS results for oil revenues/total revenues
Variable S1(OLS) S1(2SLS) S2(OLS) S2(2SLS) S3(OLS) S3(2SLS) S4(OLS) S4(2SLS)
D(oilrev_trev) 0.20 (3.10)*** 0.32 (2.66)*** 0.23 (3.15)*** 0.47 (2.31)** 0.47 (1.70)* 0.99 (1.94)* 0.24 (3.32)*** 0.42 (2.98)***
D(Van_index) 1.13 (1.24) 0.94 (0.87)
D(Van_comp) -0.02 (-0.22) 0.04 (0.30)
(Van_part) -0.15 (-1.37) -0.10 (-0.46)
D(polity) -0.41 (-1.79)* -0.75 (-1.72)*
D(van_index)*D(oilrev_trev) -0.26 (-2.17)** -0.22 (-1.72)*
D(van_comp)*D(oilrev_trev) -0.02 (-2.24)** -0.01 (-0.91)
(van_part)*D(oilrev_trev) -0.01 (-0.99) -0.04 (-1.48)
Dpolity*D(oilrev_trev) -0.05 (-1.55) -0.09 (-1.81)*
D(inv_gdp) 0.42 (2.11)** 0.46 (2.09)** 0.43 (2.20)** 0.54 (1.86)* 0.44 (2.42)** 0.42 (1.31) 0.38 (1.85)* 0.49 (2.31)**
D(govex_gdp) -1.36 (-2.66)*** -1.05 (-1.34) -1.45 (-2.57)*** -1.00 (-1.16) -1.64 (-3.22)*** -1.89 (-2.92)*** -1.47 (-2.83)*** -1.36 (-1.75)*
Inf -0.19 (-2.09)** -0.18 (-1.56) -0.18 (-2.04)** -0.15 (-1.10) -0.15 (-1.78)* -0.14 (-1.04) -0.19 (-2.15)** -0.24 (-1.58)
Gt-1 0.22 (1.93)* 0.22 (1.41) 0.20 (1.60) 0.25 (1.41) 0.13 (1.17) 0.12 (0.77) 0.15 (1.29) 0.07 (0.49)
Oil_g 0.02 (1.49) 0.003 (0.16) 0.01 (1.00) -0.004 (-0.08) 0.004 (0.25) 0.03 (0.75) 0.02 (1.47) 0.005 (0.26)
OECD_gdppcg 0.83 (1.20) 1.05 (1.24) 1.09 (1.32) 1.29 (1.24) 0.77 (1.06) 0.64 (0.62) 1.02 (1.31) 1.17 (1.14)
Wardummy -4.03 (-1.84)* -4.02 (-1.45) -5.77 (-2.65)*** -4.40 (-1.38) -6.63 (-3.92)*** -6.49 (-2.54)*** -6.69 (-3.92)*** -6.88 (-2.36)**
R2 0.71 0.70 0.68 0.62 0.69 0.60 0.69 0.61
LM 0.45 0.09 0.47 0.01 0.04 0.04 0.13 0.01
Jarque-Bera P-value 0.66 0.46 0.88 0.66 0.95 0.80 0.78 0.43
RESET 0.74 0.68 0.97 0.95 0.74 0.56 0.93 0.50
Obs (after adjustments) 41 37 41 37 41 37 41 37
Note: Dependent variable: real per capita GDP growth rate. Period: 1959-2007 (effective sample: 1968-2004); t value within () brackets; Newey-West HAC standard errors & covariance, LM is Breusch-Godfrey Serial Correlation LM Test (F form, p-value for OLS & Obs*R2, p-value for TSLS) which shows the probability of null hypothesis (no auto-correlation in residuals) acceptance (p-values larger than 0.05 means acceptance of null hypothesis); Jarque-Bera P-value shows the acceptance probability of null hypothesis of residual normality; RESET is Ramsey test (using powers of the independent variables) for omitted variables. The p-value of RESET tests the H0: model has no omitted variables (p-values larger than 0.05 means acceptance of null hypothesis (model has no omitted variables). Instruments consist of 1-4 years lagged values of “oil dependency”, different factionalism proxies, government expenditures /GDP, investment/GDP, and interactions terms, as well as 2 year lagged values of inflation and oil price growth rate. Constant term is included but not reported.
***: Significant at 1%, **: Significant at 5%, *: Significant at 10%.

32/42
Table 4. OLS & 2SLS results for per capita daily oil production
Variable S5(OLS) S5(2SLS) S6(OLS) S6(2SLS) S7(OLS) S7(2SLS) S8(OLS) S8(2SLS)
D(pcoil_produc) 337.8 (6.77)*** 378.2 (6.70)*** 348.0 (5.04)*** 390.1 (5.66)*** 394.3 (2.68)*** 682.7 (3.46)*** 352.4 (5.99)*** 451.07 (6.42)***
D(Van_index) -0.02 (-0.06) -0.43 (-0.57)
D(Van_comp) -0.06 (-0.80) -0.13 (-0.88)
(Van_part) 0.06 (0.76) 0.17 (0.93)
D(polity) -0.06 (-0.30) -0.46 (-1.12)
D(van_index)*D(pcoil_produc) -38.7 (-3.28)*** -47.55 (-2.76)***
D(van_comp)*D(pcoil_produc) -11.3 (-2.60)*** -12.5 (-2.19)**
(van_part)*D(pcoil_produc) -7.29 (-1.00) -22.2 (-2.15)**
Dpolity*D(pcoil_produc) -26.7 (-3.09)*** -51.05 (-2.5)***
D(inv_gdp) 0.60 (4.84)*** 0.67 (5.18)*** 0.60 (4.20)*** 0.56 (2.92)*** 0.49 (3.59)*** 0.59 (4.17)*** 0.59 (5.26)*** 0.66 (3.38)***
D(govex_gdp) -0.36 (-1.03) -0.79 (-1.67)* -0.38 (-1.05) -0.79 (-1.44) -0.63 (-1.62) -0.59 (-0.86) -0.28 (-0.81) -0.37 (-0.43)
Inf -0.08 (-1.37) -0.15 (-1.25) -0.07 (-1.33) -0.13 (-1.01) -0.10 (-1.56) -0.13 (-0.89) -0.07 (-1.33) -0.04 (-0.32)
Gt-1 0.07 (0.96) -0.01 (-0.08) 0.07 (0.96) 0.01 (0.08) 0.05 (0.67) 0.02 (0.26) 0.07 (0.95) 0.07 (0.83)
Oil_g 0.02 (3.73)*** 0.03 (2.95)*** 0.02 (3.38)*** 0.03 (2.38)** 0.03 (4.44)*** 0.03 (2.21)** 0.02 (3.44)*** 0.01 (0.86)
OECD_gdppcg 0.18 (0.36) 0.24 (0.40) 0.30 (0.58) 0.38 (0.60) 0.38 (0.70) 0.46 (0.64) 0.19 (0.40) 0.15 (0.25)
Wardummy -4.10 (-2.89)*** -4.77 (-3.11)*** -4.64 (-3.20)*** -5.35 (-3.11)*** -5.31 (-4.09)*** -4.77 (-3.95)*** -4.33 (-3.16)*** -3.97 (-3.01)***
R2 0.82 0.81 0.81 0.81 0.80 0.75 0.82 0.77
LM 0.11 0.28 0.15 0.40 0.16 0.65 0.08 0.007
Jarque-Bera P-value 0.92 0.37 0.99 0.48 0.83 0.38 0.93 0.21
RESET 0.23 0.49 0.04 0.27 0.02 0.21 0.12 0.85
Obs (after adjustments) 43 40 43 40 43 40 43 40
Note: Dependent variable: real per capita GDP growth rate. Period: 1959-2007 (effective sample: 1965-2004); t value within () brackets; Newey-West HAC standard errors & covariance; LM is Breusch-Godfrey Serial Correlation LM Test (F form, p-value for OLS & Obs*R2, p-value for TSLS) which shows the probability of null hypothesis (no auto-correlation in residuals) acceptance (p-values larger than 0.05 means acceptance of null hypothesis); Jarque-Bera P-value shows the acceptance probability of null hypothesis of residual normality; RESET is Ramsey test (using powers of the independent variables) for omitted variables. The p-value of RESET tests the H0: model has no omitted variables (p-values larger than 0.05 means acceptance of null hypothesis (model has no omitted variables). Instruments consist of 1- 4 years lagged values of “oil abundance”, different factionalism proxies, government expenditures /GDP, investment/GDP, and interactions terms, as well as 2 year lagged values of inflation and oil price growth rate. Constant term is included but not reported.
***: Significant at 1%, **: Significant at 5%, *: Significant at 10%.

33/42
Table 5. Marginal effects of oil rents on growth (at different levels of factionalised democracy)
Factionalised democracy D(Oilrev_Trev) D(pcoil_produc)
Mean D(van_index) 2.68 3.75
Maximum D(van_index) -8.98 0.88
Minimum D(van_index) 8.22 5.11
Note: Mean (dvan_index): 0.06, Max (dvan_index) = 6.1 Min (dvan_index) = -2.80, std (doilrev_trev) = 8.79, std (dpcoil_produc) = 0.01. D is differencing operator. Thus descriptive statistics of, for example, dvan_index are different than van_index.

-10
-8
-6
-4
-2
0
2
-15
-10
-5
0
5
10
1966
1968
1970
1972
1974
1976
1978
1980
1982
1984
1986
1988
1990
1992
1994
1996
1998
2000
2002
2004
2006
GDP per capita growth (annual %)- Right axisPolity2 index (-10 to 10)- Left axis
Figure 1. GDP per capita growth of Iran under different polities (1965-2006) Source: World Bank (2008), Marshall and Jaggers (2007)
-10
-8
-6
-4
-2
0
2
4
10
20
30
40
50
60
70
1966
1968
1970
1972
1974
1976
1978
1980
1982
1984
1986
1988
1990
1992
1994
1996
1998
2000
2002
2004
2006
Gross fixed capital formation (% of GDP)-Right axisIndustry value added (% of GDP)-Right axisPolity Index-Left axis
Hash
emi
Revolu
tion &
war
Au
tocracy
Kh
atami
Figure 2. Industry value added and fixed investment of Iran under different polities (1965-2006). Source: World Bank (2008), Marshall and Jaggers (2007)
34/42

35/42
Appendix A
Table A. Data description and sources
Variable Description Source
G Real per capita GDP growth rate % CBI (2009)
Oilrev_trev Share of oil revenues in total revenues of
government (oil dependency)
CBI (2009)
Pcoil_produc Per capita daily oil production (oil
abundance)
EIA. http://www.eia.doe.gov
Polity2 Polity2 index, -10: fully non-democratic, 10:
fully democratic
Marshall and Jaggers (2007)
Van_index Index of democratization Vanhanen (2000)
Van_comp Index of political competition Vanhanen (2000)
Van_part Index of participation in elections by people Vanhanen (2000)
Inv_gdp Share of real investment in real GDP CBI (2009)
Govex_gdp Share of real government expenditures in real
GDP
CBI (2009)
Inf CPI inflation CBI (2009)
Lit Literacy rate (%) CBI (2009)
Edu_tex Share of education expenditures in total
government expenditures (constant prices, %)
CBI (2009)
Oil_g Growth rate of global average oil prices IFS (2009)
Gt-1 Lag of per capita GDP growth rate
OECD_gdppcg Real growth rate of OECD per capita GDP World Bank (2008)
Wardummy Dummy variable for Iraq-Iran war 1=1980-1988; otherwise 0

40,000
80,000
120,000
160,000
1966
1968
1970
1972
1974
1976
1978
1980
1982
1984
1986
1988
1990
1992
1994
1996
1998
2000
2002
2004
2006
Figure A1. Trend of oil revenues in Iran (billion Rials) Source: CBI (2009)
20
30
40
50
60
70
80
90
1966
1968
1970
1972
1974
1976
1978
1980
1982
1984
1986
1988
1990
1992
1994
1996
1998
2000
2002
2004
2006
Figure A2. Trend of oil revenues share in total revenues in Iran (%) Source: CBI (2009)
36/42
37/42
Appendix B
Table B1. Unit root tests without controlling structural break (ADF and PP)
Included in test
equation
ADF PP Variable
Level First Diff. Level First Diff.
Intercept -2.24 -6.42* -2.50 -6.42* Intercept and trend -2.33 -6.42* -2.55 -6.42* Oilrev-trev none -0.62 -6.48* -0.62 -6.48* Intercept -2.00 -3.65** -1.59 -3.63* Intercept and trend -2.56 -3.65** -2.06 -3.63**
Pcoil_produc
none -0.95 -3.69* -0.71 -3.67* Intercept -2.41 -8.08* -2.34 -8.12* Intercept and trend -3.39*** -7.98* -3.46*** -8.03*
Van_index
none -1.41 -8.14* -1.28 -8.18* Intercept -2.40 -6.43* -2.52 -6.43* Intercept and trend -2.92 -6.36* -3.05 -6.36*
Van-comp
none -1.07 -6.48* -1.09 -6.48* Intercept -1.59 -9.49* -1.74 -12.7* Intercept and trend -4.45* -4.47*
Van_part
none 0.18 -9.40* -0.04 -10.08*Intercept -1.99 -6.93* -2.01 -6.97* Intercept and trend -2.66 -6.88* -2.79 -6.92*
Polity2
none -1.36 -7.00* -1.32 -7.04* Intercept -2.05 -5.72* -2.23 -5.75* Intercept and trend -2.53 -5.69* -2.27 -5.72*
Inv_gdp
none -0.05 -5.76* 0.07 -5.79* Intercept -1.28 -4.97* -1.44 -4.91* Intercept and trend -0.96 -5.18* -1.08 -5.18*
Govex_gdp
none -0.14 -5.02* -0.25 -4.96* Intercept -2.61*** -2.46 -9.76* Intercept and trend -3.22*** -3.23***
Inf
none -1.41 -7.27* -1.14 -9.18* Intercept -3.59* -3.59* Intercept and trend -3.61** -3.61**
Pcgdp_g
none -3.38* -3.38* Intercept -3.59* -3.59* Intercept and trend -3.61** -3.61**
Gt-1
none -3.38* -3.38* Intercept -6.28* -6.28* Intercept and trend -6.21* -6.21*
Oil_g
none -5.84* -5.84* Intercept -3.33** -3.59* -2.74*** -3.53* Intercept and trend 1.14 -4.49* 1.14 -4.47*
Lit
none 1.77 -1.40 3.51 -1.82**Intercept -2.21 -7.5* -2.21 -7.6* Intercept and trend -2.17 -7.4* -2.17 -7.5*
Edu_tex
none -0.68 -7.6* -0.63 -7.7* Intercept -3.96* -3.86* Intercept and trend -4.90* -4.58*
Oecd_gdppcg
none -1.93*** -1.73***
Note: Null hypothesis: respected variable has a unit-root. *: rejection of null hypothesis at 1% level, **: rejection of null hypothesis at 5% level and ***: rejection at 10% level.

38/42
Table B2. Zivot and Andrews unit-root tests with structural break in intercept and trend
Variable t-statistics Break year Oilrev-trev -2.84 1974 Pcoil_produc -4.57* 1978 Van_index -4.58 1996 Van-comp -4.35 1979 Van_part -5.62 1979 Polity2 -3.14* 1997 Inv_gdp -3.62 1985 Govex_gdp -3.97 ** 1976 Inf -5.14 1993 Pcgdp_g -5.77 1975 Pcgdp_g(-1) -5.77 1975 Oil_g -7.36 1979 Lit -3.16 1990 Edu_tex -3.40 1978 Oecd_gdppcg -6.20 1972
Note: Critical values: 1%: -5.57 5%: -5.08. If the test statistic (e.g. -7.36 for oil_g variable) is smaller than the critical values (e.g. for breaks in trend and intercept -5.5 and -5.0), then we have an I (0) series with a trend and a break. If the test reports otherwise, we have an I (1) series.*: break in intercept, (Critical values: 1%: -5.43 5%: -4.80) **: break in trend (Critical values: 1%: -4.93 5%: -4.42).

39/42
Appendix C In this appendix, we test for two issues. First, we exclude the observations before the Islamic
revolution of 1979. We aim to examine the significance of interaction of factionalized
democracy and natural resource dependency or abundance variable. Second, we include some
proxies for human capital and the investment of government in the education system. We use
the literacy rate (as a proxy for basic education) and the share of government expenditures on
education in total government expenditures.
As we can observe from Tables C1 and C2, the natural resource wealth variables (oilrev_trev
and pcoil_produc) remain positive and significant after controlling for human capital and
limiting sample to post-revolution period. The interaction of factionalized democracy (to save
the space, just reporting van_index and van_com indicators) with the natural resource variable
stays negative and significant except for the period from 1980-2004 in Table C1 and from
1979-2004 for S15 in Table C2. However, its sign is still negative. The loss of significance
for the post-revolution period may be due to a lower number of observation and reduction of
power of the test. The sign of other control variables are as expected in theory. A higher
share of investment in GDP increases the growth rate and a higher share of government size
in the economy crowed out the private investors, leading to lower growth. Higher inflation
rates destabilize the macroeconomy. Past growth rates usually explain the current one. The
effect of oil price changes is not significant. It seems that most of its effect on growth is
absorbed by other control variables. The Iranian economy is not very integrated into the
global economy. Thus the business cycles in its main trading partner (OECD region) have no
significant effect on it. Basic education (literacy rate) has a positive effect on growth rate but
its effect is mostly insignificant. The education expenditures share in total government
expenditures has a negative and significant effect on real growth rates. This shows partly the

40/42
lack of a strong link between the education system and the productive part of the economy
(see endnote 16 for further references). In sum, factionalized democracy has a negative effect
on economic growth rate when the country is rich in natural resources. These results are
obtained after controlling for the other key factors which have affected the Iranian political
economy since 1960s. The diagnostics tests such as R2, LM (serial auto correlation test),
Jarque-Bera (residual normality test) and RESET (model specification stability test) show the
reliability of the results.

41/42
Table C1. OLS & 2SLS results for oil revenues/total revenues (with education variables)
Variable S9(OLS) S9(2SLS) S10(OLS) S10(2SLS) S11(OLS) S11(2SLS) S12(OLS) S12(2SLS)
D(oilrev_trev) 0.21 (2.99)*** 0.24 (3.02)*** 0.17 (2.66)*** 0.34 (2.03)** 0.23 (2.41)** 0.25 (2.44)** 0.21 (2.55)** 0.21 (2.65)***
D(Van_index) 0.17 (1.21) 1.14 (1.13) 1.09 (1.44) 0.82 (1.02) 0.90 (1.32) 0.78 (1.27) 1.10 (1.57) 1.12 (1.57)
D(van_index)*D(oilrev_trev) -0.25 (-1.98)** -0.22 (-1.87)* -0.24 (-2.53)*** -0.20 (-2.37)** -0.20 (-2.43)** -0.18 (-2.20)** -0.16 (-1.31) -0.16 (-1.29)
D(inv_gdp) 0.39 (1.88) * 0.42 (2.04) ** 0.44 (2.10)** 0.50 (1.79)* 0.23 (1.21) 0.20 (1.15) 0.21 (1.02) 0.22 (1.08)
D(govex_gdp) -1.43 (-3.06)*** -1.51 (-2.06)** -1.43 (-2.72)*** -0.96 (-1.15) -1.49 (-1.79)* -1.60 (-1.93)* -1.39 (-1.36) -1.35 (-1.39)
Inf -0.20 (-1.82)* -0.20 (-1.36) -0.21 (-2.17)** -0.20 (-1.72)* -0.16 (-1.26) -0.16 (-1.24) -0.17 (-1.28) -0.17 (-1.28)
Gt-1 0.23 (1.75)* 0.22 (1.67)* 0.21 (1.72)* 0.21 (1.25) 0.25 (1.74)* 0.25 (1.66) 0.24 (1.77)* 0.24 (1.82)*
Oil_g 0.01 (1.20) 0.01 (0.70) 0.02 (1.90)* 0.005 (0.18) -0.006 (-0.2) -0.01 (-0.42) 0.01 (0.17) 0.01 (0.18)
OECD_gdppcg 1.09 (1.36) 1.39 (1.65) 0.64 (0.85) 0.57 (0.60) 1.50 (1.42) 1.39 (1.14) 1.63 (1.34) 1.67 (1.35)
D(Lit) 0.75 (1.03) 0.85 (1.01) 0.89 (1.37) 0.72 (1.10) 0.95 (1.67)* 0.98 (1.88)*
D(eduex_tex) -0.25 (-1.16) -0.50 (-1.85)*
Wardummy -4.27 (-1.89)* -4.65 (-2.19)** -3.84 (-1.74)* -3.16 (-1.09) -5.4 (-3.1)*** -5.5 (-3.15)*** -5.57 (-2.96)*** -5.54 (-3.02)***
R2 0.72 0.70 0.72 0.66 0.77 0.77 0.76 0.76
LM 0.64 0.72 0.39 0.05 0.58 0.31 0.68 0.35
Jarque-Bera P-value 0.91 0.78 0.54 0.59 0.15 0.22 0.46 0.50
RESET 0.93 0.30 0.63 0.57 0.83 0.73 0.80 0.78
Sample (adjusted) 1968-2004 1972-2004 1964-2004 1968-2004 1979-2004 1979-2004 1980-2004 1980-2004
Note: a, b, and c imply that the coefficient is significantly different from zero at the 1%, 5%, and 10% levels, respectively. Dependent variable is the real GDP per capita growth rate. The sample period from 1979-2004 and 1980-2004 refer to post-revolution period. t value within () brackets; Newey-West HAC standard errors & covariance; LM is Breusch-Godfrey Serial Correlation LM Test (F form, p-value for OLS & Obs*R2, p-value for TSLS) which shows the probability of null hypothesis (no auto-correlation in residuals) acceptance (p-values larger than 0.05 means acceptance of null hypothesis); Jarque-Bera P-value shows the acceptance probability of null hypothesis of residual normality; RESET is Ramsey test (using powers of the independent variables) for omitted variables. The p-value of RESET tests the H0: model has no omitted variables (p-values larger than 0.05 means acceptance of null hypothesis (model has no omitted variables). Instruments consist of 1- 4 years lagged values of “oil abundance”, different factionalism proxies, government expenditures /GDP, investment/GDP, and interactions terms, as well as 2 year lagged values of inflation, education and oil price growth rate. Constant term is included but not reported.
***: Significant at 1%, **: Significant at 5%, *: Significant at 10%.

42/42
Table C2. OLS & 2SLS results for per capita daily oil production (with education variables)
Variable S13(OLS) S13(2SLS) S14(OLS) S14(2SLS) S15(OLS) S15(2SLS) S16(OLS) S16(2SLS)
D(oilrev_trev) 0.24 (3.14)*** 0.25 (2.81)*** 0.27 (2.75)*** 0.29 (2.72)***
D(pcoil_produc) 336.5 (4.62)*** 410.8 (4.86)*** 471.2 (4.92)*** 452.5 (4.43)***
D(Van_comp) -0.006 (-0.05) 0.03 (0.28) 0.001 (0.03) -0.10 (-0.71) -0.04 (-0.51) -0.07 (-0.70) 0.04 (0.45) 0.06 (0.63)
D(van_comp)*D(oilrev_trev) -0.02 (-2.01)** -0.02 (-1.81)* -0.01 (-1.08) -0.009 (-0.65)
D(van_comp)*D(pcoil_produ) -8.90 (-1.82)* -14.7 (-2.93)*** -12.87 (-2.64)*** -11.26 (-1.96)*
D(inv_gdp) 0.40 (2.01)** 0.56 (2.58)*** 0.55 (3.94)*** 0.58 (3.06)*** 0.31 (1.32) 0.27 (1.15) 0.50 (3.36)*** 0.44 (3.25)***
D(govex_gdp) -1.48 (-2.98)*** -1.47 (-1.80)* -0.54 (-1.44) -0.32 (-0.37) -1.56 (-1.86)* -1.63 (-1.92)* 0.16 (0.28) 0.07 (0.11)
Inf -0.19 (-1.81)* -0.16 (-1.38) -0.11 (-1.48) -0.06 (-0.94) -0.16 (-1.25) -0.16 (-1.24) -0.12 (-1.12) -0.09 (-1.09)
Gt-1 0.20 (1.48) 0.17 (1.32) 0.05 (0.63) 0.05 (0.60) 0.17 (0.98) 0.17 (0.95) 0.18 (1.48) 0.19 (1.59)
Oil_g 0.01 (0.70) 0.01 (0.52) 0.02 (3.08)*** 0.02 (1.42) -0.01 (-0.71) -0.02 (-0.84) 0.04 (1.40) 0.04 (1.42)
OECD_gdppcg 1.36 (1.40) 1.31 (1.32) 0.59 (0.90) 0.34 (0.42) 2.20 (1.66) 1.97 (1.35) 0.76 (0.76) 0.48 (0.46)
D(Lit) 0.51 (0.58) 0.11 (0.08) 0.73 (1.09) -0.26 (-0.21) 0.85 (1.30) 0.56 (0.77) 1.16 (2.48)*** 0.53 (0.65)
Wardummy -6.0 (-2.64)*** -5.7 (-2.23)** -5.22 (-3.18)*** -4.5 (-2.31)** -7.81 (-2.82)*** -7.72 (-2.89)*** -3.54 (-1.40) -3.26 (-1.39)
R2 0.69 0.67 0.83 0.79 0.74 0.74 0.88 0.87
LM 0.64 0.36 0.42 0.45 0.48 0.24 0.22 0.11
Jarque-Bera P-value 0.90 0.63 0.64 0.77 0.60 0.82 0.96 0.87
RESET 0.95 0.21 0.01 0.11 0.65 0.56 0.60 0.76
Sample (adjusted) 1968-2004 1970-2004 1968-2004 1970-2004 1979-2004 1979-2004 1979-2004 1979-2004
Note: a, b, and c imply that the coefficient is significantly different from zero at the 1%, 5%, and 10% levels, respectively. Dependent variable is the real GDP per capita growth rate. The sample period from 1979-2004 refers to post-revolution period. Dependent variable is the real GDP per capita growth rate. The sample period from 1979-2004 and 1980-2004 refer to post-revolution period. t value within () brackets; Newey-West HAC standard errors & covariance; LM is Breusch-Godfrey Serial Correlation LM Test (F form, p-value for OLS & Obs*R2, p-value for TSLS) which shows the probability of null hypothesis (no auto-correlation in residuals) acceptance (p-values larger than 0.05 means acceptance of null hypothesis); Jarque-Bera P-value shows the acceptance probability of null hypothesis of residual normality; RESET is Ramsey test (using powers of the independent variables) for omitted variables. The p-value of RESET tests the H0: model has no omitted variables (p-values larger than 0.05 means acceptance of null hypothesis (model has no omitted variables). Instruments consist of 1- 4 years lagged values of “oil abundance”, different factionalism proxies, government expenditures /GDP, investment/GDP, and interactions terms, as well as 2 year lagged values of inflation, education and oil price growth rate. Constant term is included but not reported.
***: Significant at 1%, **: Significant at 5%, *: Significant at 10%.