Fact, Fiction, and Momentum Investing - The Journal … FACT, FICTION, AND MOMENTUM INVESTING...
18
THE JOURNAL OF PORTFOLIO MANAGEMENT 75 SPECIAL 40TH ANNIVERSARY ISSUE Fact, Fiction, and Momentum Investing CLIFFORD ASNESS, ANDREA FRAZZINI, RONEN ISRAEL, AND T OBIAS MOSKOWITZ CLIFFORD ASNESS is managing principal at AQR Capital Management in Greenwich, CT. [email protected] ANDREA FRAZZINI is a principal at AQR Capital Management in Greenwich, CT. [email protected] RONEN ISRAEL is a principal at AQR Capital Management in Greenwich, CT. [email protected] TOBIAS MOSKOWITZ is the Fama Family Pro- fessor of Finance at the University of Chicago Booth School of Business in Chicago, IL. tobias.moskowitz@chicagobooth. edu M omentum is the phenomenon that securities that have per- formed well relative to peers (winners) on average con- tinue to outperform, and securities that have performed relatively poorly (losers) tend to continue to underperform. 1 The existence of momentum is a well-established empirical fact. The return premium is evident in 212 years (yes, this is not a typo, two hundred and twelve years of data from 1801 to 2012) of U.S. equity data, 2 dating back to the Victorian age in U.K. equity data, 3 in more than 20 years of out-of-sample evidence from its original discovery, in 40 other countries, and in more than a dozen other asset classes. 4 Some of this evidence predates academic research in financial economics, suggesting that the momentum premium has been a part of mar- kets since their very existence, well before researchers studied them as a science. The growth in popularity of momentum strategies has, not surprisingly, corresponded to an expanding body of research. 5 At the same time, myths around momentum have also proliferated. Some of the most common myths are that momentum is too small and sporadic a factor, works mostly on the short- side, works well only among small stocks, and doesn’t survive trading costs. Furthermore, some argue that momentum is best used as a screen, not as a regular factor in an invest- ment process. Others will go so far as to say that momentum investing is like a game of hot potato, implying that it isn’t a serious investment strategy, with no theory or rea- sonable explanation to back it up. Frankly, we’re a little irked (if that was not clear) by those who should know better but continue to repeat these myths, stretching the limits of credulity. In this article, we address and refute these myths using academic papers (that have been widely circulated throughout the academic and practitioner communities, have been presented and debated at top-level academic seminars and conferences, and have been published in peer-reviewed journals) and the simplest data taken from Kenneth French’s publicly available website, a standard data set used by both academics and practitio- ners. Anyone repeating these myths, in any dimension, after reading this piece is simply ignoring the facts. We make no claim that momentum works all the time. In fact, of late (the last few years), momentum as a strategy has had a more difficult time. Still, the fact is that momentum is a risky variable factor (as most investment factors are) with an impressive long-term average return that survives all the attacks (myths) hurled against it. In this article, we defend momentum, including its use, both stand-alone (especially as a substi- tute for growth investing) and in combina- tion with value, from these persistent attacks. We believe this—both myth busting and IT IS ILLEGAL TO REPRODUCE THIS ARTICLE IN ANY FORMAT Copyright © 2014
Transcript of Fact, Fiction, and Momentum Investing - The Journal … FACT, FICTION, AND MOMENTUM INVESTING...
THE JOURNAL OF PORTFOLIO MANAGEMENT 75SPECIAL 40TH ANNIVERSARY ISSUE
Fact, Fiction, and Momentum InvestingCLIFFORD ASNESS, ANDREA FRAZZINI, RONEN ISRAEL, AND TOBIAS MOSKOWITZ
CLIFFORD ASNESS
is managing principal at AQR Capital Management in Greenwich, [email protected]
ANDREA FRAZZINI
is a principal at AQR Capital Management in Greenwich, [email protected]
RONEN ISRAEL
is a principal at AQR Capital Management in Greenwich, [email protected]
TOBIAS MOSKOWITZ
is the Fama Family Pro-fessor of Finance at the University of Chicago Booth School of Business in Chicago, [email protected]
Momentum is the phenomenon that securities that have per-formed well relative to peers (winners) on average con-
tinue to outperform, and securities that have performed relatively poorly (losers) tend to continue to underperform.1 The existence of momentum is a well-established empirical fact. The return premium is evident in 212 years (yes, this is not a typo, two hundred and twelve years of data from 1801 to 2012) of U.S. equity data,2 dating back to the Victorian age in U.K. equity data,3 in more than 20 years of out-of-sample evidence from its original discovery, in 40 other countries, and in more than a dozen other asset classes.4 Some of this evidence predates academic research in financial economics, suggesting that the momentum premium has been a part of mar-kets since their very existence, well before researchers studied them as a science.
The growth in popularity of momentum strategies has, not surprisingly, corresponded to an expanding body of research.5 At the same time, myths around momentum have also proliferated. Some of the most common myths are that momentum is too small and sporadic a factor, works mostly on the short-side, works well only among small stocks, and doesn’t survive trading costs. Furthermore, some argue that momentum is best used as a screen, not as a regular factor in an invest-ment process. Others will go so far as to say
that momentum investing is like a game of hot potato, implying that it isn’t a serious investment strategy, with no theory or rea-sonable explanation to back it up.
Frankly, we’re a little irked (if that was not clear) by those who should know better but continue to repeat these myths, stretching the limits of credulity. In this article, we address and refute these myths using academic papers (that have been widely circulated throughout the academic and practitioner communities, have been presented and debated at top-level academic seminars and conferences, and have been published in peer-reviewed journals) and the simplest data taken from Kenneth French’s publicly available website, a standard data set used by both academics and practitio-ners. Anyone repeating these myths, in any dimension, after reading this piece is simply ignoring the facts.
We make no claim that momentum works all the time. In fact, of late (the last few years), momentum as a strategy has had a more diff icult time. Still, the fact is that momentum is a risky variable factor (as most investment factors are) with an impressive long-term average return that survives all the attacks (myths) hurled against it. In this article, we defend momentum, including its use, both stand-alone (especially as a substi-tute for growth investing) and in combina-tion with value, from these persistent attacks. We believe this—both myth busting and
JPM-ASNESS.indd 75JPM-ASNESS.indd 75 9/18/14 10:18:49 AM9/18/14 10:18:49 AM
IT IS IL
LEGAL TO REPRODUCE THIS A
RTICLE IN
ANY FORMAT
Copyright © 2014
76 FACT, FICTION, AND MOMENTUM INVESTING SPECIAL 40TH ANNIVERSARY ISSUE
focusing on the long term—is especially important given momentum’s recent performance which only wrongly reinforces the resilience of its attackers. At the same time, our goal is not to denigrate other factors, most specifically value. Although we occasionally note the irony that many of the myths we dispel come from value investors attempting to discredit momentum, several of these myths actually apply better to value investing itself. However, as we’ll show in this article, value and momentum work better when used as complements, and it is the combination of the two we stress and most-strongly recommend. We are fans of both momentum and value but bigger fans of their combination (and not fans of myths at all).
Now, on to the myth busting.
MYTH NO. 1: MOMENTUM RETURNS ARE TOO SMALL AND SPORADIC
Although we have already cited some dispelling evidence, given that this precisely worded myth has been used in print, further exploration of this most basic issue is called for. We start with gross of costs, long-short portfolios to establish baseline results. In later sections we debunk the myths surrounding shorting, transactions costs, and the general implementability of momentum for traditional long-only investors.
Momentum’s presence and robustness are remark-ably stable. By this we don’t mean that it doesn’t have long stretches of poor performance, as does any factor, or short stretches of extreme performance; we mean the overall evidence across very long periods of time and in many places. Again, momentum is present in U.S. stocks over very long time periods and, following its academic discovery in the early 1990s, has been shown to be robust out-of-sample (an important exercise we will repeat here), in the individual stocks of other coun-tries, for stock markets, and for completely different asset classes, such as bond markets, currencies, commodities,
and others. It has become one of the preeminent empir-ical regularities studied by academics and practitioners. To see why, we will provide evidence that anyone can replicate. Most of the analysis is based on factors from Professor Kenneth French’s website and focuses on momentum within U.S. stocks. Some definitions are needed and we follow Professor French here:
• RMRF represents the equity market risk pre-mium, or aggregate equity return minus the risk free (U.S. Treasury bill) rate. It is the return from simply being long equities at market-capitalization weights and, unlike the other factors, is not a spread return between one set of stocks and another but between all stocks and cash.
• SMB (small minus big) represents a portfolio that is long small stocks and short big stocks to capture the size effect.
• HML (high minus low) represents a portfolio that is long high book-to-price stocks and short low book-to-price stocks representing value investing.
• UMD (up minus down) represents a portfolio that is long stocks that have high relative past one-year returns and short stocks that have low relative past one-year returns6 to capture momentum.7
For all factors, Kenneth French’s data library pro-vides returns of the long and short sides separately, for both large- and small-capitalization securities separately, all of which we use in this article. Most of our analysis focuses on UMD and its components.8
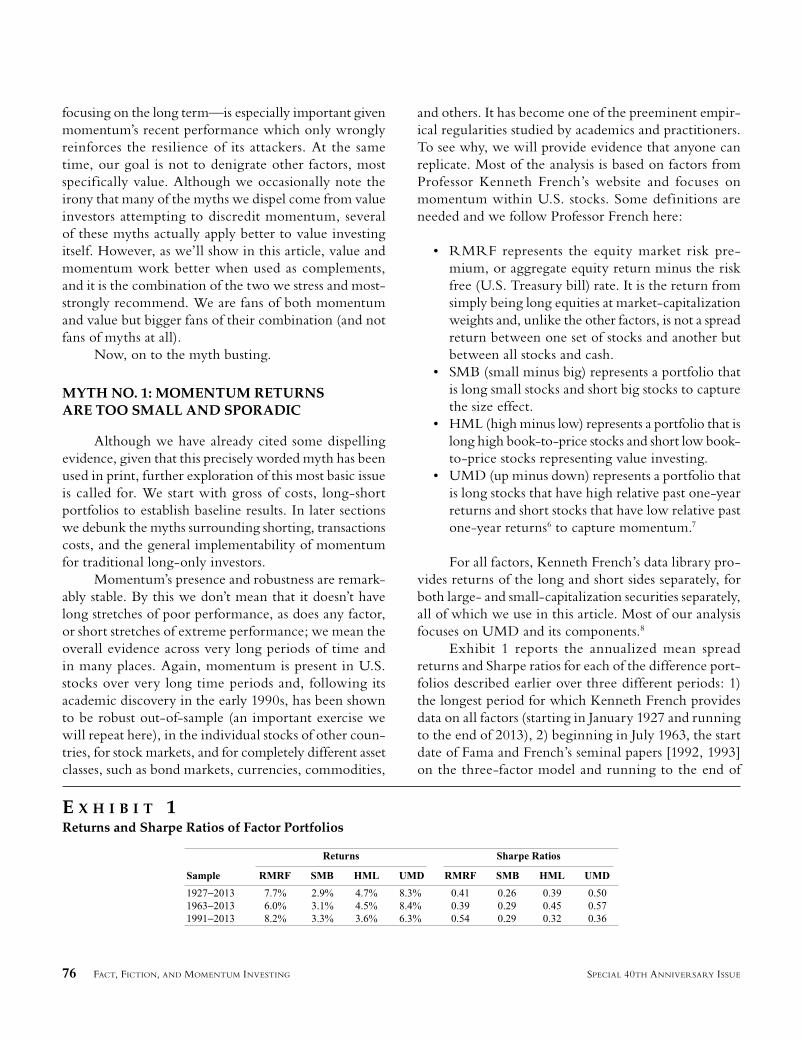
Exhibit 1 reports the annualized mean spread returns and Sharpe ratios for each of the difference port-folios described earlier over three different periods: 1) the longest period for which Kenneth French provides data on all factors (starting in January 1927 and running to the end of 2013), 2) beginning in July 1963, the start date of Fama and French’s seminal papers [1992, 1993] on the three-factor model and running to the end of
E X H I B I T 1Returns and Sharpe Ratios of Factor Portfolios
JPM-ASNESS.indd 76JPM-ASNESS.indd 76 9/18/14 10:18:49 AM9/18/14 10:18:49 AM
THE JOURNAL OF PORTFOLIO MANAGEMENT 77SPECIAL 40TH ANNIVERSARY ISSUE
2013, and 3) the out-of-sample period since the original momentum papers ( Jegadeesh and Titman [1993] and Asness [1994]), beginning January 1991 and running to the end of 2013.9 Gross returns and Sharpe ratios for momentum (UMD) are large and, in fact, larger than both value and size. This is true over the full-sample period of 87-plus years of data, from 1963 onward and in the out-of-sample period from 1991 to 2013.
Critics of momentum who complain it is vola-tile may be pointing to some of the evidence implied in Exhibit 1. Momentum’s advantage over the other factors is somewhat smaller in Sharpe ratio terms than in raw spread returns. But even considering its higher volatility, momentum still comes out on top. Stepping back and explaining a bit more, and focusing on the full period from 1927–2013, the spread of small stocks over large stocks averaged 2.9% a year, the spread of cheap stocks over expensive stocks averaged 4.7% a year, and the spread of recent winners over recent losers aver-aged 8.3% a year, all calculated using analogous methods (and these correspond to Sharpe ratios of 0.26, 0.39, and 0.50, respectively). This ordering, by return or Sharpe ratio, is the same over the much shorter out-of-sample period, too.
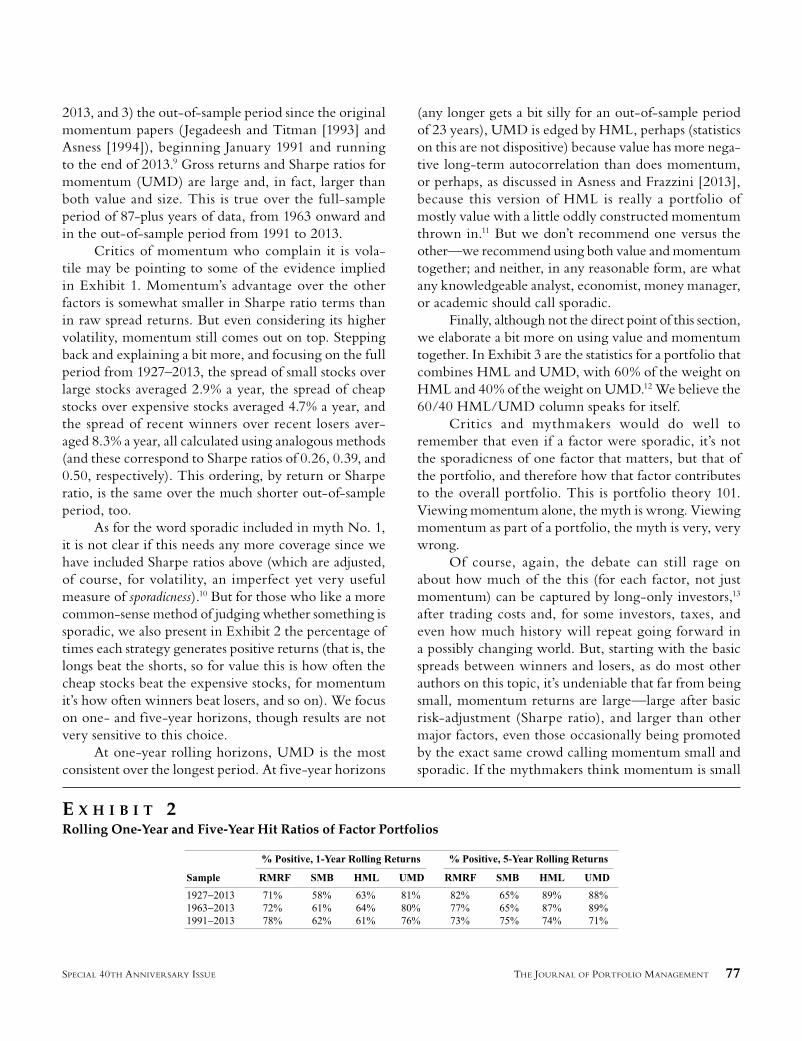
As for the word sporadic included in myth No. 1, it is not clear if this needs any more coverage since we have included Sharpe ratios above (which are adjusted, of course, for volatility, an imperfect yet very useful measure of sporadicness).10 But for those who like a more common-sense method of judging whether something is sporadic, we also present in Exhibit 2 the percentage of times each strategy generates positive returns (that is, the longs beat the shorts, so for value this is how often the cheap stocks beat the expensive stocks, for momentum it’s how often winners beat losers, and so on). We focus on one- and five-year horizons, though results are not very sensitive to this choice.
At one-year rolling horizons, UMD is the most consistent over the longest period. At five-year horizons
(any longer gets a bit silly for an out-of-sample period of 23 years), UMD is edged by HML, perhaps (statistics on this are not dispositive) because value has more nega-tive long-term autocorrelation than does momentum, or perhaps, as discussed in Asness and Frazzini [2013], because this version of HML is really a portfolio of mostly value with a little oddly constructed momentum thrown in.11 But we don’t recommend one versus the other—we recommend using both value and momentum together; and neither, in any reasonable form, are what any knowledgeable analyst, economist, money manager, or academic should call sporadic.
Finally, although not the direct point of this section, we elaborate a bit more on using value and momentum together. In Exhibit 3 are the statistics for a portfolio that combines HML and UMD, with 60% of the weight on HML and 40% of the weight on UMD.12 We believe the 60/40 HML/UMD column speaks for itself.
Critics and mythmakers would do well to remember that even if a factor were sporadic, it’s not the sporadicness of one factor that matters, but that of the portfolio, and therefore how that factor contributes to the overall portfolio. This is portfolio theory 101. Viewing momentum alone, the myth is wrong. Viewing momentum as part of a portfolio, the myth is very, very wrong.
Of course, again, the debate can still rage on about how much of the this (for each factor, not just momentum) can be captured by long-only investors,13 after trading costs and, for some investors, taxes, and even how much history will repeat going forward in a possibly changing world. But, starting with the basic spreads between winners and losers, as do most other authors on this topic, it’s undeniable that far from being small, momentum returns are large—large after basic risk-adjustment (Sharpe ratio), and larger than other major factors, even those occasionally being promoted by the exact same crowd calling momentum small and sporadic. If the mythmakers think momentum is small
E X H I B I T 2Rolling One-Year and Five-Year Hit Ratios of Factor Portfolios
JPM-ASNESS.indd 77JPM-ASNESS.indd 77 9/18/14 10:18:49 AM9/18/14 10:18:49 AM
78 FACT, FICTION, AND MOMENTUM INVESTING SPECIAL 40TH ANNIVERSARY ISSUE
and sporadic, then size, value, and even the equity pre-mium must appear tiny and positively f lighty to them.
So, to sum up, who you calling small and sporadic?
MYTH NO. 2: MOMENTUM CANNOT BE CAPTURED BY LONG-ONLY INVESTORS BECAUSE MOMENTUM CAN BE EXPLOITED ONLY ON THE SHORT SIDE
In other words, the UMD factor is long win-ners and short losers, and those repeating this myth are asserting that most or all of the returns we showed ear-lier for UMD come from being short the losers. This is patently and clearly false, which somehow does not stop it from being among the most-repeated momentum myths.
First, even if it were true (it’s not), for a long-only investor, being underweight a security relative to the market is economically similar to being short the secu-rity (albeit with the constraint that your largest under-weight can only be as large as a stock’s weight in the benchmark or market). So, asking how much of a factor return comes from the long and short side is already only partially relevant. But, admittedly, if all of the returns came from the short-side, it would certainly weaken the factor’s utility for long-only investors, because this con-straint on the size you can underweight a stock could, depending on goals, be binding.
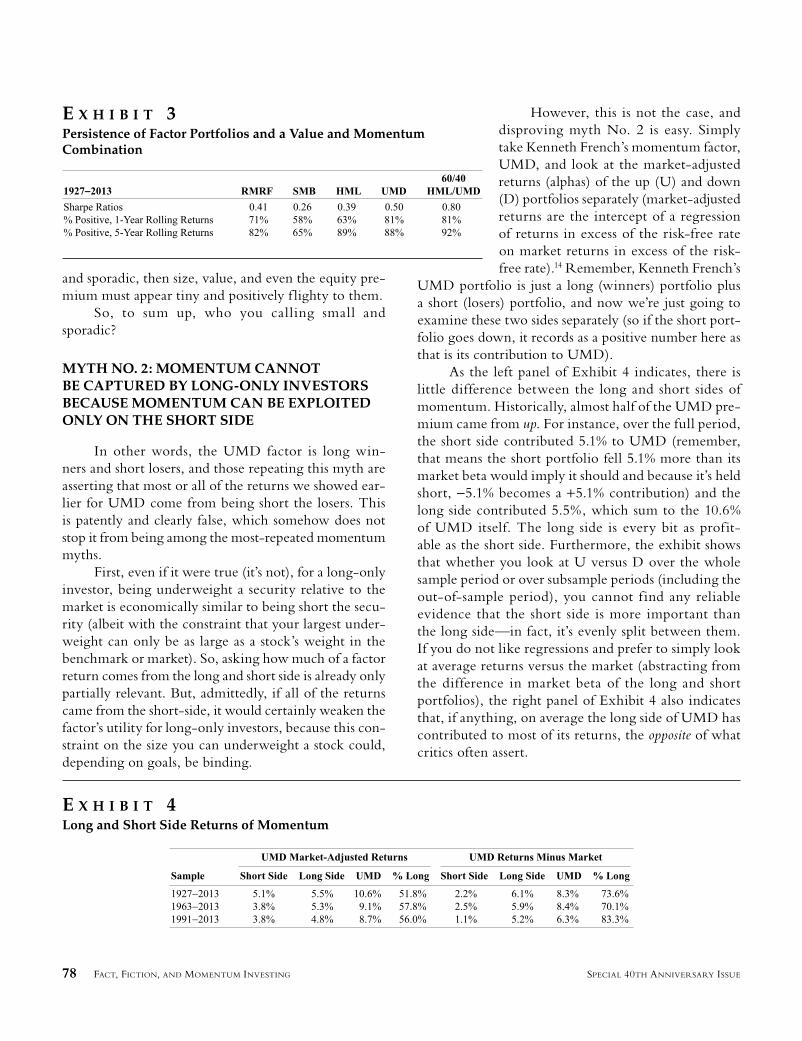
However, this is not the case, and disproving myth No. 2 is easy. Simply take Kenneth French’s momentum factor, UMD, and look at the market-adjusted returns (alphas) of the up (U) and down (D) portfolios separately (market-adjusted returns are the intercept of a regression of returns in excess of the risk-free rate on market returns in excess of the risk-free rate).14 Remember, Kenneth French’s
UMD portfolio is just a long (winners) portfolio plus a short (losers) portfolio, and now we’re just going to examine these two sides separately (so if the short port-folio goes down, it records as a positive number here as that is its contribution to UMD).
As the left panel of Exhibit 4 indicates, there is little difference between the long and short sides of momentum. Historically, almost half of the UMD pre-mium came from up. For instance, over the full period, the short side contributed 5.1% to UMD (remember, that means the short portfolio fell 5.1% more than its market beta would imply it should and because it’s held short, −5.1% becomes a +5.1% contribution) and the long side contributed 5.5%, which sum to the 10.6% of UMD itself. The long side is every bit as prof it-able as the short side. Furthermore, the exhibit shows that whether you look at U versus D over the whole sample period or over subsample periods (including the out-of-sample period), you cannot f ind any reliable evidence that the short side is more important than the long side—in fact, it’s evenly split between them. If you do not like regressions and prefer to simply look at average returns versus the market (abstracting from the difference in market beta of the long and short portfolios), the right panel of Exhibit 4 also indicates that, if anything, on average the long side of UMD has contributed to most of its returns, the opposite of what critics often assert.
E X H I B I T 4Long and Short Side Returns of Momentum
E X H I B I T 3Persistence of Factor Portfolios and a Value and Momentum Combination
JPM-ASNESS.indd 78JPM-ASNESS.indd 78 9/18/14 10:18:50 AM9/18/14 10:18:50 AM
THE JOURNAL OF PORTFOLIO MANAGEMENT 79SPECIAL 40TH ANNIVERSARY ISSUE
We present only the data for momentum within U.S. stocks here. More formally, and with a plethora of tests and specifications, Israel and Moskowitz [2013a] show that the long and short side of momentum are equally profitable using 86 years of U.S. data as well as 40 years of international equity data, and another 40 years of data from five other asset classes outside of equities. Everywhere they looked and in every way, they could not find any evidence that the short side profits were sys-tematically larger or more important than the long side. In other words, long-only momentum is quite profit-able, equally so with the short side of momentum.
If you don’t like what Israel and Moskowitz [2013a] do in their paper (or don’t have time to read it), you can download Kenneth French’s data and try it yourself as we have done. You will find what we find: momentum does not work better, or only, on the short side.
MYTH NO. 3: MOMENTUM IS MUCH STRONGER AMONG SMALL-CAP STOCKS THAN LARGE CAPS
Like the other myths, this is often claimed even more histrionically as “momentum exists only among small caps.” And, like the other myths, it is false. But what it lacks in truth it makes up for with the amusing quality of being backward at least when uttered (as is often the case) by fans of value investing—this myth happens to be true if you replace the word “momentum” with “value” (yes, we still love value, despite its weak-ness among large caps).
For the most detailed study to date on this topic, see Israel and Moskowitz [2013a]. In their paper, they f ind little to no evidence that momentum is related to size; it is almost equally as strong among large caps as it is among small caps. However, in an interesting twist, they find that though the value premium is strong among small caps, it’s virtually nonexistent among large caps. Although we ourselves are big proponents of value investing (we just believe the ubiquitous data that it is better alongside momentum), to argue that momentum is all about small stocks is completely inconsistent with the facts, and far more of an argument to lay at the feet of pure value investing. To promote this myth about momentum while simulta-neously advocating value investing borders on absurd.
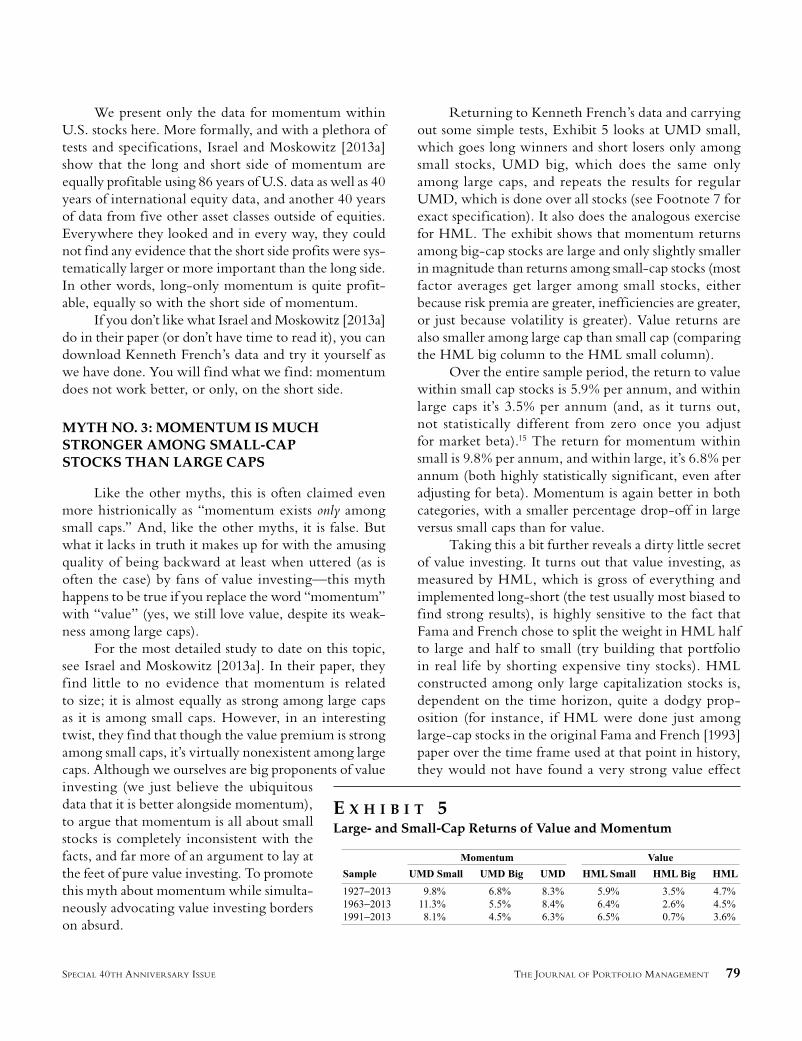
Returning to Kenneth French’s data and carrying out some simple tests, Exhibit 5 looks at UMD small, which goes long winners and short losers only among small stocks, UMD big, which does the same only among large caps, and repeats the results for regular UMD, which is done over all stocks (see Footnote 7 for exact specification). It also does the analogous exercise for HML. The exhibit shows that momentum returns among big-cap stocks are large and only slightly smaller in magnitude than returns among small-cap stocks (most factor averages get larger among small stocks, either because risk premia are greater, inefficiencies are greater, or just because volatility is greater). Value returns are also smaller among large cap than small cap (comparing the HML big column to the HML small column).
Over the entire sample period, the return to value within small cap stocks is 5.9% per annum, and within large caps it’s 3.5% per annum (and, as it turns out, not statistically different from zero once you adjust for market beta).15 The return for momentum within small is 9.8% per annum, and within large, it’s 6.8% per annum (both highly statistically significant, even after adjusting for beta). Momentum is again better in both categories, with a smaller percentage drop-off in large versus small caps than for value.
Taking this a bit further reveals a dirty little secret of value investing. It turns out that value investing, as measured by HML, which is gross of everything and implemented long-short (the test usually most biased to find strong results), is highly sensitive to the fact that Fama and French chose to split the weight in HML half to large and half to small (try building that portfolio in real life by shorting expensive tiny stocks). HML constructed among only large capitalization stocks is, dependent on the time horizon, quite a dodgy prop-osition (for instance, if HML were done just among large-cap stocks in the original Fama and French [1993] paper over the time frame used at that point in history, they would not have found a very strong value effect
E X H I B I T 5Large- and Small-Cap Returns of Value and Momentum
JPM-ASNESS.indd 79JPM-ASNESS.indd 79 9/18/14 10:18:50 AM9/18/14 10:18:50 AM
80 FACT, FICTION, AND MOMENTUM INVESTING SPECIAL 40TH ANNIVERSARY ISSUE
at all). Even over what we call the full out-of-sample period, 1991–2013, HML among only large stocks is a paltry 0.06 Sharpe ratio versus 0.51 within small stocks. In contrast, UMD over this period among large stocks is a 0.24 Sharpe versus 0.45 in small stocks (yes, not as big in large caps, but much closer for momentum than for value). Momentum, unlike value, is far more robust among large versus small stocks (and again makes others getting this backward really odd—people who live in houses made of cheap stocks shouldn’t …).
Putting it starkly: in-sample, out-of-sample, cal-culated in Greenwich Connecticut, Chicago, Boston, Palo Alto, Santa Monica, Austin, or in the library with a candlestick, wherever or however you want to look, along any dimension, those who make the claim that momentum fails for large caps, yet being supporters of value investing, are not simply mistaken, they have it backward.
You might wonder how myths No. 2 and No. 3 orig-inated. Well, two papers in particular helped contribute to these myths, with one of the papers co- authored by an author of this article. In Hong et al. [2000] and Grin-blatt and Moskowitz [2004], the authors, using a more limited sample period predominantly from the 1980s and 1990s, show that momentum is stronger among small stocks and on the short side (though to be clear, neither article ever claimed momentum was nonexistent among large caps or on the long side; somehow the original evi-dence became twisted into something more extreme). We also showed above that over an overlapping period from 1991-2013 momentum worked better in small than large caps (0.45 versus 0.24 Sharpe ratios, respectively), but it held up in large cap and fared far better than value did. It turns out even this difference, which is still a victory for momentum, is anomalously weak. These results have proven not to be robust out-of-sample by Israel and Moskowitz [2013a]. As we’ve shown, over the much longer out-of-sample period from 1927 to 2013, and Israel and Moskowitz [2013a] have shown in international markets and other asset classes, the returns to momentum are really no stronger on the short side and are not related to size. The only evidence Israel and Moskowitz [2013a] find for size and momentum is a slightly stronger effect for small-cap winners versus large-cap winners, but even that is shown to be pretty weak. There is very little effect for size among losers and a negligible effect overall for size on momentum returns. So, if one of the authors of the original papers
claiming these facts can admit that they do not hold up out-of-sample, certainly those without their names on these papers should accept the facts.
This sample-specific effect of size on momentum also explains other results in the literature that claim the same facts. For example, Fama and French [2012] look at momentum internationally and conclude that it is stronger among small-cap stocks (again their evi-dence does show a healthy momentum premium among large caps, just not as strong as among small caps). How-ever, their sample period is from 1989 to 2011, which is essentially the same period over which these other short-period papers, and our out-of-sample test, f ind a stronger small-cap momentum effect in the United States. Over the longer sample period, there is little statistical evidence that momentum is much stronger among small-cap stocks. And, most important, over no reasonable length sample period is there any evidence that momentum actually fails among large-cap stocks.
Finally, these two myths—that momentum is dominated by the short side and mostly among small caps—are often voiced together. The motivation (we think) being to convey that it will be practically difficult and costly to implement. First, even if this were true, a long-only investor would still benefit from under-weighting small-cap losers as mentioned above. Second, and far more important, it isn’t true or even close to true. This leads us to the next myth.
MYTH NO. 4: MOMENTUM DOES NOT SURVIVE, OR IS SERIOUSLY LIMITED BY, TRADING COSTS
Momentum is a higher turnover strategy than some other strategies (for example, value) and hence the question arises as to whether the premium for momentum covers trading costs (a reasonable question for any strategy). Plus, if you believed in the myth that momentum was dominated by shorting small stocks, then trading costs might seem to be an even larger potential impediment. However, just like these previous myths, the statement that momentum does not survive trading costs is false.
Although much of our other myth-dispelling can be done with Kenneth French’s data, disproving this particular myth requires real-world, net-of-costs data. To the best of our knowledge, the most comprehensive work to date that analyzes real-world trading costs of
JPM-ASNESS.indd 80JPM-ASNESS.indd 80 9/18/14 10:18:50 AM9/18/14 10:18:50 AM
THE JOURNAL OF PORTFOLIO MANAGEMENT 81SPECIAL 40TH ANNIVERSARY ISSUE
factors is Frazzini et al. [2013], (FIM), which uses trades from a large institutional investor (AQR Capital) over a long period of time. Using a unique data set containing more than a trillion dollars of live trades from 1998 to 2013 across 19 developed equity markets, the authors estimate real-world trading costs for momentum, value, and size-based strategies. Their conclusion is that per dollar trading costs for momentum are quite low, and thus, despite the higher turnover, momentum easily sur-vives transactions costs.
Unlike testing real-world strategies as in FIM, most academic studies examine portfolios that do not consider transactions costs in their design and do not allow for tradeoffs that could lead to a reduction in trading costs. They simply rebalance as automatons ignoring costs. Trading patiently (by breaking orders up into small sizes and setting limit order prices that pro-vide, not demand, liquidity) and allowing some tracking error to a theoretical style portfolio can significantly reduce trading costs without changing the nature of the strategy. FIM show that allowing both innovations can result in trading cost estimates (and break-even fund sizes) that are significantly smaller (larger) relative to naïve implementations.
Where did this myth come from? Several academic papers (for example, Korajczyk and Sadka [2004] and Lesmond et al. [2003]) using trading cost estimates from daily or intradaily data found much larger effects from transaction costs on the viability of momentum strat-egies. However, two key differences can explain the different results. First, the studies that find much larger trading costs do so because they estimate costs for the average investor using aggregated daily or transaction-level data for all trades in the market, which turn out to be about ten times larger than the costs of a large institutional manager, which are the costs FIM implic-itly measure. Second, as discussed above, these other studies examine portfolios that do not consider transac-tions costs in their design, which can significantly reduce turnover and therefore trading costs further. Both factors result in trading cost estimates (and break-even fund sizes) that are an order of magnitude smaller (larger) than previous studies suggest.
History provides an analogous myth. Decades ago, when the first academic studies on the size premium came out, many declared, “You can’t trade it; the trading costs would wipe out any return premium.” These state-ments were made without realistic trading-costs data and
without allowing for cost minimization through real-world, practical implementation. Similar to FIM, a paper by Keim [1999] that used real-world transactions costs from a large institutional investor—Dimensional Fund Advisors (DFA)—showed that these previous studies were f lawed and had grossly overestimated transactions costs. A firm like DFA would never face the same costs as the average investor and is far smarter than to trade blindly to a set of dynamically changing strategy weights when even small modifications can greatly reduce costs. As the industry has proven for decades after these papers, small-cap portfolios can indeed be traded in an efficient manner that does not wipe out their returns. Since the premium for momentum is much higher than it is for size, and the costs to trading momentum are slightly lower than those for size (momentum is higher turnover but small caps are more expensive to trade than other stocks), you don’t have to do much math to realize that momentum can easily survive trading costs.
MYTH NO. 5: MOMENTUM DOES NOT WORK FOR A TAXABLE INVESTOR
This myth is related to momentum’s higher turn-over relative to other strategies (for example, value), so at face value it may seem reasonable. However, high turnover does not necessarily equal high taxes.
Papers by Israel and Moskowitz [2013b]; Berg-stresser and Pontiff [2013]; and Sialm and Zhang [2013] show that momentum, despite having five to six times the annual turnover as value, actually has a similar tax burden as value. At f irst blush this seems counterin-tuitive, until you realize the following two facts: First, momentum actually has turnover that is biased to be tax advantageous—it tends to hold on to winners and sell losers—thus avoiding realizing short-term capital gains in favor of long-term capital gains and realizing short-term capital losses. From a tax perspective this is efficient and effectively lowers the tax burden of momentum strategies. Second, value strategies, despite their low turnover, have very high dividend income exposure, which is (in most tax regimes in history) tax inefficient. Momentum, on the other hand, more often than not has low dividend exposure. On net, this makes value and momentum roughly equally tax efficient. Since the premium for momentum is quite a bit higher than for value, yet they face similar tax rates, the after-tax returns to momentum are also higher than for value.
JPM-ASNESS.indd 81JPM-ASNESS.indd 81 9/18/14 10:18:50 AM9/18/14 10:18:50 AM
82 FACT, FICTION, AND MOMENTUM INVESTING SPECIAL 40TH ANNIVERSARY ISSUE
One more twist is worth mentioning. The analysis above didn’t consider any smart trading, but just implic-itly implemented the strategies from Kenneth French’s data. Israel and Moskowitz [2013b] also look into tax-optimized versions of these strategies by designing portfolios that attempt to minimize taxes while not incurring meaningful style drift. The authors find that tax optimization is much easier to achieve through cap-ital gains than through dividend income, which makes intuitive sense. Pushing the realization of gains from short-term to long-term status (which may often require only delaying a trade by a month) has a very small effect on the portfolio, but a large tax effect given the differ-ence in tax rates between short- and long-term capital gains. There is a similar tradeoff between short- and long-term loss realizations. But the only way to reduce dividend income is to not hold dividend paying stocks, which has a much more significant impact on a value portfolio and induces substantial style drift. Hence, tax optimization considerably improves the tax efficiency of a momentum strategy, whose tax burden comes mostly from capital gains, whereas it has a more limited effect on a value strategy, whose tax burden is driven primarily by dividend exposure.
The bottom line is that momentum survives taxes and has a tax burden roughly equal to or smaller than lower-turnover strategies such as value, especially if run optimally. Even for a taxable investor, momentum offers a healthy after-tax return premium and larger than what is provided by other strategies.
MYTH NO. 6: MOMENTUM IS BEST USED WITH SCREENS RATHER THAN AS A DIRECT FACTOR
A stronger form of this myth, and wording that has been used publicly, states “momentum is not useful as a factor in portfolio construction.” Yet those who say this, including those who demean momentum as a hot potato, often leave the door open to use momentum in some other, ancillary way, typically as a screen.
Though a little confusing, we presume the position summed up as “momentum screens, yes; direct factor, no” means you wouldn’t want to treat momentum like value (that is, use both value and momentum to come up with a method of evaluating companies on both measures). But under this particular myth, it still makes sense to use momentum as a screen where after
deciding, based on value, what to buy or sell, momentum is allowed some inf luence over the implementation of this rebalance. This seems like an attempt to incorpo-rate momentum, as anyone looking at the literature and wealth of evidence (or the results noted earlier) should want to do, but not quite being willing to admit that it’s a real factor.
It is, in our opinion, an attempt to have your cake but denounce it too!16
What’s strange about using momentum as a screen but not a “real factor” is that it still requires a belief in momentum, albeit perhaps a milder one than ours. In other words, despite not giving it due credit, per-haps for fear it detracts from the value story or perhaps detracts from an efficient-markets-only point of view (we are believers that both risk-based efficient market and behavioral reasons likely contribute to the success of all of these factors), advocates of the screen approach want to f ind a way to use a little bit of it because of the strong evidence in its favor. The problem is (as the saying goes) you can’t be a little bit pregnant. Either you believe in momentum and acknowledge the data, or you don’t.
Now, there is one possible way to save the screen story and indeed claim to be just partially with child. In some sense, the fable we are about to tell unifies a bunch of the myths we discuss under one untrue umbrella. The notion of using momentum as just a screen is consistent with some of the other myths we previously dispensed with: that momentum is mostly driven by the short side, works only among small-cap stocks, and doesn’t survive trading costs. If all three of these hold, using momentum only as a trading screen becomes more valid (how valid would depend on how strong these effects were). For example, imagine a long-only investor who believed in momentum but thought (wrongly) that it worked only to underweight securities (that is, the short side), believed (wrongly) that it worked only in very small cap stocks, and believed (wrongly) that it would be too costly to implement alone. That investor might still look to avoid, or screen out, very small-cap stocks that had poor momentum from his purchase list, since not buying something is free (that is, no transactions costs), and still believe momentum has efficacy for shorting small stocks (the signal momentum is giving here). Using the momentum factor in a long-only context at low weight would also achieve a similar outcome as a screen, namely, not owning these stocks, but also have
JPM-ASNESS.indd 82JPM-ASNESS.indd 82 9/18/14 10:18:50 AM9/18/14 10:18:50 AM
THE JOURNAL OF PORTFOLIO MANAGEMENT 83SPECIAL 40TH ANNIVERSARY ISSUE
more inf luence on what is purchased (not simply what is not purchased). So it’s possible, though still far from a certainty, that if all of these things were meaningfully true, a screen could be preferred.
But alas the mythmakers are batting 200 points below the Mendoza line across each of these three asser-tions (that’s 0.000 for you non-baseball fans).17 Since momentum is very strong, is just as strong on the long side as the short side, works equally well among large cap as it does among small-cap stocks, and is certainly prof-itable after trading costs, using momentum as a screen will be significantly suboptimal versus using momentum as a factor (there is no more reason to use a screen for momentum than for value; actually, there’s even less given value’s weakness among large-cap stocks). Frazzini et al. [2013] explore this issue empirically and show that a factor-based approach for momentum is superior to a screen-based approach.
MYTH NO. 7: ONE SHOULD BE PARTICULARLY WORRIED ABOUT MOMENTUM’S RETURNS DISAPPEARING
First, we find it odd that this is often said about momentum by supporters of other factors that also face this concern, since this concern can—and should—exist for any factor. We remember 1999–2000, when investors were abandoning value investing, many with the belief that it would never work again because the world had changed. Every investor worries that the future may not ref lect the past, and that return expectations may be too optimistic. When others get this admittedly valid question about the future returns of their favorite factor, again for instance the value factor, I’m sure they roll their eyes and think here we go again. That they’d turn around and unabashedly ask it only of momentum is odd to say the least, especially given the strength and stability of momentum’s historical record. No other factor, save perhaps the market itself (and that is far from clear), has nearly as long a track record (remember, there is evidence of momentum for the past 212 years), as much out-of-sample evidence (including across time, geog-raphy and even security type) or as strong and reliable a return premium as momentum (see Exhibit 1).
Our guesses as to why people ask this question more frequently about momentum are that 1) momentum is a newer factor in terms of academic attention than size or
value, and 2) behavioral explanations for its origin have been pushed more prominently (though not exclusively). The first reason does not make much sense once you’ve seen the data, since no other factor has as much evidence behind it. The second rationale is more plausible, yet it still requires a leap of faith in that it presumes that behavioral phenomena are somehow less likely to persist than risk-based ones, and that other factors are 100% risk versus behavioral based (we know few of even the most ardent believers in the risk story who thought, when NASDAQ hit 5,000 in the year 2000, that there was no behavioral component at all to the destruction being suffered by value). The idea is that if something is driven by investor behavior, then arbitrage forces may eventually eliminate it. This is, of course, possible, but it is far from certain, and a risk-based factor can also disap-pear if tastes for risk change or the price of risk changes (even supporters of a pure risk-based story readily admit that the price of risk can and does change substantially through time).
Moreover, since the average investor has to, by definition, own the market, not everyone can be tilted toward the same risk factors. That is, for every value investor, there has to be a growth investor. If money managers continue to push value on everyone, then prices for value stocks will have to rise and will eventu-ally eliminate the value premium.18 So, yes, any factor can fail to produce returns in the future, but that possi-bility of failure exists for behavioral factors and risk-based factors. And, remember, the jury is still out on whether momentum is a behavioral or risk-based factor (we have not given up hope on improving upon the risk-based explanations). Perhaps the most important point is that both theories—behavioral and risk-based—provide good reasons for why the premium should persist (more on this in myth No. 10). Considering the overwhelming long-term evidence for both value and momentum investing, the onus is on anyone claiming future risk premia or behavior will change to these factors’ detriment. This challenge has not been met, not even closely.
Having said that, we are of course interested in trying to answer whether momentum’s returns are likely to disappear. Israel and Moskowitz [2013a] take up this issue by looking at a host of out-of-sample periods for momentum (after the original momentum studies were published) to see if there was any degradation in its returns. They did not f ind any evidence of degrada-
JPM-ASNESS.indd 83JPM-ASNESS.indd 83 9/18/14 10:18:50 AM9/18/14 10:18:50 AM
84 FACT, FICTION, AND MOMENTUM INVESTING SPECIAL 40TH ANNIVERSARY ISSUE
tion. They also looked at whether momentum’s returns decreased with declines in trading costs (a proxy for the cost of arbitrageurs) and the growth in hedge fund and active mutual fund assets (a proxy for arbitrage activity). Again, the answer was no on both counts.
So there is no evidence that momentum has weak-ened since it has become well known and once many institutional investors embraced it and trading costs declined. This doesn’t mean momentum could never disappear, but at least in the more than 20 years since its original discovery, we’ve seen nothing to indicate that it is being arbitraged away. Israel and Moskowitz [2013a] also looked at value and size under the same light and found that these factors, especially size, had not fared as well as momentum out-of-sample (though, at the risk of repetition that annoys the reader, we mention again that we remain fans of combining value with momentum).
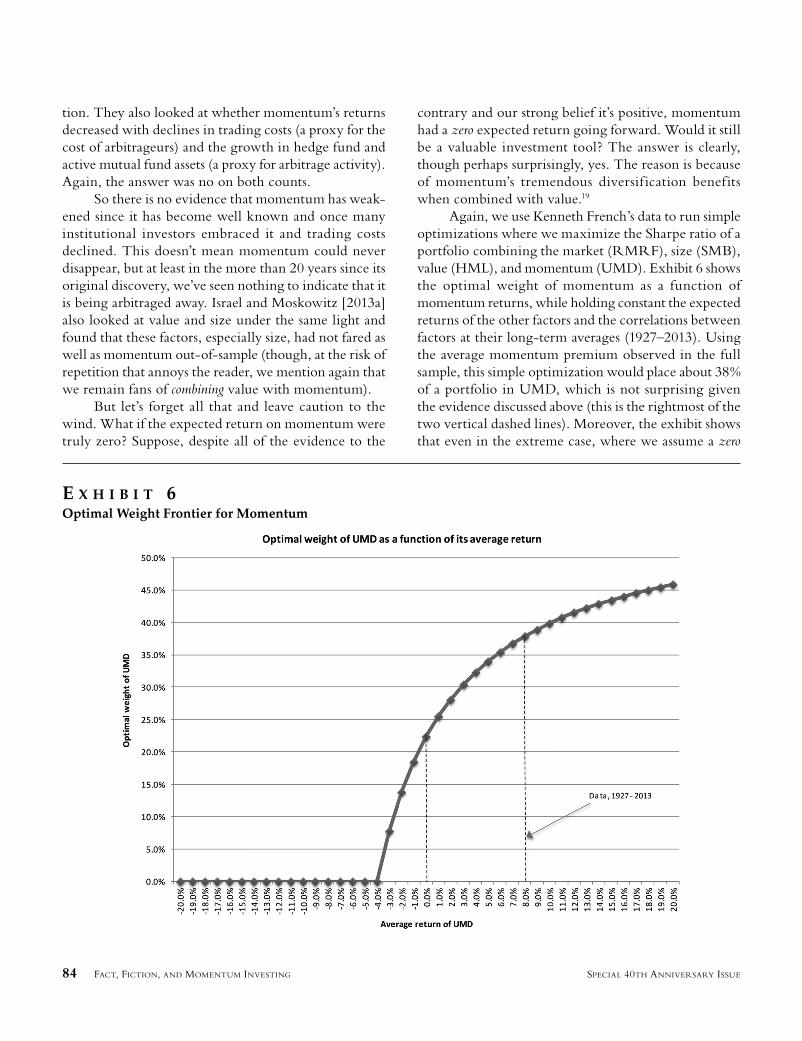
But let’s forget all that and leave caution to the wind. What if the expected return on momentum were truly zero? Suppose, despite all of the evidence to the
contrary and our strong belief it’s positive, momentum had a zero expected return going forward. Would it still be a valuable investment tool? The answer is clearly, though perhaps surprisingly, yes. The reason is because of momentum’s tremendous diversif ication benef its when combined with value.19
Again, we use Kenneth French’s data to run simple optimizations where we maximize the Sharpe ratio of a portfolio combining the market (RMRF), size (SMB), value (HML), and momentum (UMD). Exhibit 6 shows the optimal weight of momentum as a function of momentum returns, while holding constant the expected returns of the other factors and the correlations between factors at their long-term averages (1927–2013). Using the average momentum premium observed in the full sample, this simple optimization would place about 38% of a portfolio in UMD, which is not surprising given the evidence discussed above (this is the rightmost of the two vertical dashed lines). Moreover, the exhibit shows that even in the extreme case, where we assume a zero
E X H I B I T 6Optimal Weight Frontier for Momentum
JPM-ASNESS.indd 84JPM-ASNESS.indd 84 9/18/14 10:18:50 AM9/18/14 10:18:50 AM
THE JOURNAL OF PORTFOLIO MANAGEMENT 85SPECIAL 40TH ANNIVERSARY ISSUE
return for momentum, the optimal portfolio still places a significant positive weight on momentum. The diver-sification benefits are so great that even a zero expected return would be valuable to your portfolio. The logic is simple. Since value is a good strategy and momentum is -0.4 correlated with it, one should expect momentum to lose money based only on that information. Yet, the fact that it does not lose but in this assumed case breaks even makes it a valuable hedge.
Put simply, even if the expected return on momentum were to disappear to zero, the benefits of diversification would still push you to want a significant weight on momentum in your portfolio (though admit-tedly the above is a theoretical exercise maximizing Sharpe ratio on gross of costs, long-short portfolios). Although we believe in momentum as a stand-alone factor, we’ve always advocated combining it into a broader portfolio, particularly with value.20,21 And, of course, we emphatically believe the going-forward expected premium is positive, not zero.
MYTH NO. 8: MOMENTUM IS TOO VOLATILE TO RELY ON
Yep, they say it this way, too. Since this might just be the sporadic myth again, and since volatility is fully accounted for in momentum’s reported Sharpe ratios (in fact, that’s what a Sharpe ratio does), we’ll interpret this often-repeated myth as a different sort of attack, which it probably is, because it’s sometimes separately included by the same people at the same time attacking momentum. To the extent we are wrong and the mythmakers were just being repetitive, please consider this extra credit. But we think when people say something like this, they don’t mean regular old volatility but the admitted empirical tendency for momentum to suffer some very bad short-term periods, in particular and most recently for a few months in 2009.
As with any factor, momentum does not make money all the time and occasionally suffers large losses, and historically this has been somewhat worse for stand-alone momentum than the other factors discussed here. Spring 2009 was one of these times. But although more extreme, this isn’t unlike other factors. Every factor has its dark times. Witness value investing in the late 1990s (back then we vigorously defended value from its ubiquitous critics). Unfortunately, since this particular momentum episode was recent, it has prompted some
of momentum’s critics to overemphasize it. We think this is a gross overreaction and mischaracterization of the facts.
Recall that momentum has a much higher Sharpe ratio than the size or value strategy, despite including this episode (again to emphasize, all of the numbers we have looked at above include the dark periods observed in the history for all of these factors, including the recent one for momentum). So, on a risk-return basis momentum still comes out on top. If momentum had a superior return but a vastly inferior, and even unac-ceptable, Sharpe ratio due to very high volatility, then it might have made sense to criticize it this way, but that’s just not close to true. In fact, it’s why we use Sharpe ratios.
Some critics of momentum use 2009 as a glaring example to imply that you don’t want to invest in some-thing that can ever have a really bad period. One promi-nent value manager, and prominent momentum myth spreader, says specifically, with no further explanation, as if none is needed, “Momentum is also quite vari-able; in 2009, it was sharply negative for U.S. stocks.” That is a fairly amazing thing for a student of these fac-tors to say. No doubt 2009 was a terrible year to be a momentum investor, particularly if momentum was all you did. However, so was 1999 for a value investor, and so was 2008 for passive equity investors. And, for those interested, 1932 was also very ugly for momentum, and 1930 ugly for value, and in each case the other came through and the 60/40 value/momentum portfolio results were reasonably calm (have we mentioned that we like value and momentum together, not as competi-tors?). We highlight this not to spend time analyzing Great Depression era long-short returns but to highlight the silliness of pointing to specif ic-period results for attractive but risky factors one is supposed to invest in for the long-term and as part of a diversified portfolio. Of course, any decent researcher knows far better than to point to one bad period for a factor with long-term success (success that, again, includes that bad period) and impugn it while letting other factors have a free pass regarding events in their own histories.22
Nevertheless, the fact that momentum can be vola-tile and experience large left tails, admittedly stand-alone larger left tails than some other factors, shouldn’t be ignored and deserves study. Daniel and Moskowitz [2013] look specifically at momentum crashes to try to understand these rare but turbulent times. They find that
JPM-ASNESS.indd 85JPM-ASNESS.indd 85 9/18/14 10:18:51 AM9/18/14 10:18:51 AM
86 FACT, FICTION, AND MOMENTUM INVESTING SPECIAL 40TH ANNIVERSARY ISSUE
these crashes typically occur after a long bear market (say, over the last two years) followed by an abrupt market upswing. This almost perfectly characterizes the spring of 2009 and also the other most extreme momentum crash in late summer of 1932. The authors dig into what happens to momentum at these times and f ind that conditional market exposure is the culprit. That is, by buying winners and selling losers, a momentum strategy following a bear market will be long low-beta stocks and short high-beta stocks. Then, when the market sud-denly upswings, being short high-beta stocks will be a bad strategy. In fact, Daniel and Moskowitz [2013] show that all of the crashes to momentum are driven by being short the losers; the winners actually fare well. So, ironically given our discussion in myth No. 2, this is one circumstance where shorting losers distinguishes itself—it fully explains the crash episodes of momentum. Since these episodes are driven by market exposure, the authors further devise a way to hedge much of this risk and significantly reduce the crashes. Whether one uses this hedging strategy or not, it is important to note that these two crashes (the worst ones) for momentum come during very sharp market upswings, periods during which the portfolios of most investors are doing well other-wise, thus making the losses potentially more tolerable. Indeed, surprising to many is that momentum’s long-term (1927-2013) average beta to the long-only stock market (RMRF in Kenneth French’s data) is non-triv-ially negative, presumably inf luenced by these periods, and value’s slightly positive, favoring momentum in a multifactor portfolio including the all-important market factor over this longest test period.
But there’s an even simpler and equally effective way to mitigate these crashes, as we mention repeatedly: combining momentum with value. This combination has effectively eliminated these crashes in our long-term sample evidence—and not just those for momentum but also the crashes that can occur for value investing. In other words, the diversification benefits of combining momentum with value don’t just appear during normal times, but also during these extreme times, which makes their combination even more valuable. For example, Asness and Frazzini [2013] show that the combination of value and momentum did not suffer as badly in 2009. Going the other way, in 1999 momentum helped ame-liorate value’s pain. Both factors have worked well over the long-term, but neither has a Sharpe ratio of ten, meaning that both will have hard times occasionally,
but when combined together they will have fewer hard times.
Using Kenneth French’s data, we can show simi-larly that these very poor episodes for momentum and value are ameliorated.23 The diversif ication benefits between momentum and value are evident, even during these extreme times. For example, the worst draw-down over the full sample is −43% for value, −77% for momentum,24 but only −30% for a 60/40 combination of value and momentum.
Pointing out one very bad period for momentum that doesn’t substantially change the long-term results (and was quite survivable especially if one also included a meaningful value tilt, as we advocate), and then saying “see, look, it can be really rough sometimes, you’d better avoid it” is just not an intellectually defensible argu-ment. There is a saying at the University of Chicago, “The plural of ‘anecdote’ is not ‘data’”. Neither 2009 for momentum nor 1999 for value are indicative of the overall health and strength of these strategies. Plus, again, their combination greatly mitigates these worst times.
MYTH NO. 9: DIFFERENT MEASURES OF MOMENTUM CAN GIVE DIFFERENT RESULTS OVER A GIVEN PERIOD
Okay, this isn’t a myth, it’s actually true, but it’s tritely obvious and yet still often hurled as a critique of momentum so we’ve chosen to include it. The myth, more properly stated, would say, “Different measures of momentum give different results over a given time period and that’s a terrible thing.” But that just sounds too silly so people don’t quite get that explicit (myth tellers often prefer their statements to be less obviously humorous). Yet, the statement is meant to imply that since different measures of momentum can give different results over a given period, momentum is not a stable process and possibly data mined. This is just false.
The notion that different measures can give dif-ferent results is true with any strategy, because there are often several valid ways of measuring the same phe-nomenon. For instance, value measures usually contain some form of fundamental value-to-market value such as earnings-to-price, cash-f low-to-price, or book-to-market value. And, guess what, although all are effec-tive over the long term, they give different results over any given period! In fact, Frazzini et al. [2013] show
JPM-ASNESS.indd 86JPM-ASNESS.indd 86 9/18/14 10:18:51 AM9/18/14 10:18:51 AM
THE JOURNAL OF PORTFOLIO MANAGEMENT 87SPECIAL 40TH ANNIVERSARY ISSUE
that combining multiple measures of value, instead of relying on just one, can lead to stronger results for the factor.
As with value, momentum can be measured in various ways. The idea is to capture relative past per-formance. Often Occam’s razor applies: the simplest measure is the best. For momentum, the past 12-month return, skipping the most recent month’s return (to avoid microstructure and liquidity biases) is the most frequently used measure and has been since Asness [1994]. Many other measures have been proposed, such as various return horizons ranging from 3–12 months,25 consistency of the past returns,26 or measures of fun-damental momentum related to earnings announce-ment returns or analysts revisions.27 Although each of these other measures may add some incremental per-formance, the overall momentum effect over the long term is very similar across measures as shown in Chan et al. [1996].
To guard against data mining, choosing the sim-plest measure or taking an average of all reasonable measures tends to yield better portfolios, as shown by Frazzini et al. [2013]. As a case in point that has oddly been used to impugn momentum’s stability, Novy-Marx [2012] argues that momentum in U.S. equities is better measured by past returns from seven to twelve months ago and that using the most recent six months of returns is not valuable. However, Goyal and Wahal [2013] rep-licate Novy-Marx’s results in 36 international equity markets and find that in 35 out of 36 countries (the only exception being the U.S.), his result does not hold up and the past 12-month return is a superior measure of momentum, with the most recent six months of returns contributing equally to performance as the more distant six months of returns. Both ways work but simplest is best.
The fact that different measures of momentum yield substantially similar results should rationally be taken as a sign of robustness, not as a critique.
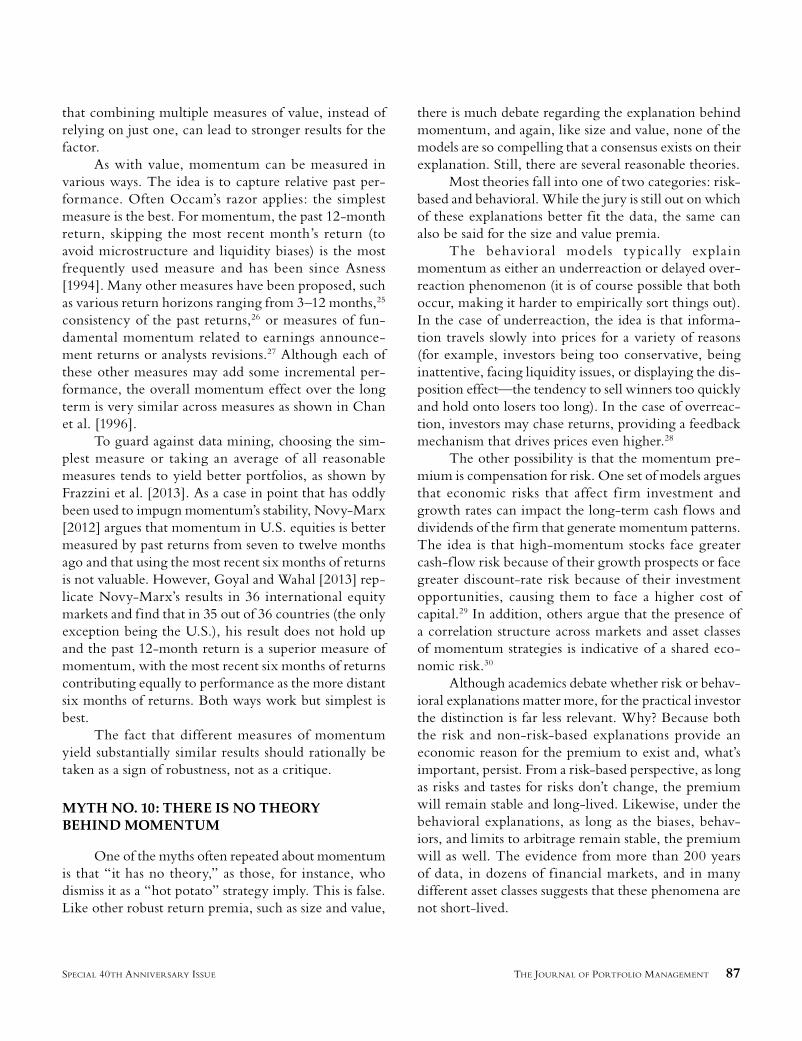
MYTH NO. 10: THERE IS NO THEORY BEHIND MOMENTUM
One of the myths often repeated about momentum is that “it has no theory,” as those, for instance, who dismiss it as a “hot potato” strategy imply. This is false. Like other robust return premia, such as size and value,
there is much debate regarding the explanation behind momentum, and again, like size and value, none of the models are so compelling that a consensus exists on their explanation. Still, there are several reasonable theories.
Most theories fall into one of two categories: risk-based and behavioral. While the jury is still out on which of these explanations better fit the data, the same can also be said for the size and value premia.
The behaviora l models typical ly explain momentum as either an underreaction or delayed over-reaction phenomenon (it is of course possible that both occur, making it harder to empirically sort things out). In the case of underreaction, the idea is that informa-tion travels slowly into prices for a variety of reasons (for example, investors being too conservative, being inattentive, facing liquidity issues, or displaying the dis-position effect—the tendency to sell winners too quickly and hold onto losers too long). In the case of overreac-tion, investors may chase returns, providing a feedback mechanism that drives prices even higher.28
The other possibility is that the momentum pre-mium is compensation for risk. One set of models argues that economic risks that affect f irm investment and growth rates can impact the long-term cash f lows and dividends of the firm that generate momentum patterns. The idea is that high-momentum stocks face greater cash-f low risk because of their growth prospects or face greater discount-rate risk because of their investment opportunities, causing them to face a higher cost of capital.29 In addition, others argue that the presence of a correlation structure across markets and asset classes of momentum strategies is indicative of a shared eco-nomic risk.30
Although academics debate whether risk or behav-ioral explanations matter more, for the practical investor the distinction is far less relevant. Why? Because both the risk and non-risk-based explanations provide an economic reason for the premium to exist and, what’s important, persist. From a risk-based perspective, as long as risks and tastes for risks don’t change, the premium will remain stable and long-lived. Likewise, under the behavioral explanations, as long as the biases, behav-iors, and limits to arbitrage remain stable, the premium will as well. The evidence from more than 200 years of data, in dozens of f inancial markets, and in many different asset classes suggests that these phenomena are not short-lived.
JPM-ASNESS.indd 87JPM-ASNESS.indd 87 9/18/14 10:18:51 AM9/18/14 10:18:51 AM
88 FACT, FICTION, AND MOMENTUM INVESTING SPECIAL 40TH ANNIVERSARY ISSUE
And remember, some of momentum’s biggest myth spreaders still want to use it in some capacity (as a screen or in an ancillary way). Although we’ve already dis-cussed this in depth, it’s important to again note this means they believe in momentum. Earlier we said you can’t be a little pregnant, so one wonders, since these folks are clearly expecting, was the father behavioral or risk-based?
Despite all this, there are still some that say, “The momentum premium is not large enough to trade profitably, because if it were, it would be an example of market mispricing.” This statement seems to be based mostly on religion rather than fact. The idea is that if the momentum pre-mium is really as large and robust as we show it to be, then it must be due to a market inefficiency and there-fore (and here’s where the religion comes in) it can’t be real, because markets are obviously perfectly efficient. This thinking implies that if markets are efficient, then the data on momentum must be wrong. Although we believe risk-based, eff icient market explanations play an important part in all of these factors’ returns, we also believe there is a role in each, perhaps at different degrees, for behavioral explanations. Some believe it’s all one or the other.31 But even if you believe that, the statement “What you’re saying can’t possibly be true despite the overwhelming evidence or my one-sided view of the world would be wrong” is not an argument but a tacit admission of defeat!
There are two alarming things with this myth. First, the data are undeniable, and (as history has shown repeatedly) rejecting data on the basis of theory can be dangerous (cf. Christopher Columbus 1492, Galileo Galilei 1615, and Salem Massachusetts 1692). Second, the statement denies any possible efficient markets stories for momentum, which, as discussed earlier, do indeed exist (and is ironic coming from the efficient-markets-only crowd).
Most important, although we can debate forever how eff icient or ineff icient markets are (indeed, the 2013 Nobel Prize committee couldn’t decide and split that year’s prize between the two camps), none of this debate should diminish momentum as a valuable invest-ment tool. The point is not to confuse the theoretical debate (which is ongoing, not just for momentum, but for other premia, like value, as well) with the empirical consensus on the efficacy of momentum. We discov-ered the world wasn’t f lat before we understood and agreed why.
CONCLUSION
Now that you’ve seen the evidence and know where to find it, those repeating the myths above regarding momentum should have a harder time maintaining credibility. They never had the facts on their side, but although the myths have been around piecemeal, no one ever assembled a detailed refutation before nor tied some of the myths together (for example, you need to believe myths about momentum’s lack of small-cap eff icacy, short- versus long-side efficacy, and transactions costs, to believe the myth about screens). There has now been so much work done addressing and testing these myths that repeating them means ignoring the data. Given that most of these myths can be shattered by a quick visit to Kenneth French’s website (like the infomercial says, “Don’t just take our word for it”), they should stop being repeated by those who want to be considered informed consumers of the research.
If one wants to challenge the evidence, that is fine, too. For instance, doing your own research and/or building your own database to attempt to establish even the slightest truth behind these myths, and explaining why you find a different result than those found to date, or picking apart the papers referenced earlier to come up with a story for why you don’t believe them is fine. Momentum, or any empirical regularity, should, of course, not be immune from criticism. Quite the oppo-site. But eventually you must confront the data. Barring new data or a new convincing interpretation you don’t get to repeat specific falsehoods pretending that there isn’t an abundance of research and evidence refuting your statements. If someone discovers something chal-lenging or enlightening versus what we have shown, we welcome it and wish to understand more. On the other hand, if someone creates new false myths to replace the old, we stand ready! At the very least, we hope that our thorough refutation finally puts a stop to momentum critics repeating these same old myths.
ENDNOTES
We thank Antti Ilmanen, Sarah Jiang, John Liew, Scott Richardson, Laura Serban, Rodney Sullivan, and Daniel Vil-lalon for useful comments and suggestions. Tobias Moskowitz has an ongoing consulting relationship with AQR Capital Management. The views and opinions expressed in this article are those of the authors and do not necessarily ref lect
JPM-ASNESS.indd 88JPM-ASNESS.indd 88 9/18/14 10:18:51 AM9/18/14 10:18:51 AM
THE JOURNAL OF PORTFOLIO MANAGEMENT 89SPECIAL 40TH ANNIVERSARY ISSUE
the views of AQR Capital Management, its aff iliates, or employees.
1The term relative is important. Momentum is sometimes confused with trend following—though related, they are not the same. The process behind momentum is to rank securi-ties relative to their peers; in contrast, trend following typi-cally focuses on absolute price changes. Unlike trends, which increase exposure during upswings and decrease exposure during downswings, momentum takes no explicit view on the market trend, but simply ranks securities relative to each other over the same time period (though in doing so some implicit, net directional market view may exist). Momentum’s winners and losers are defined no matter how the market overall is doing. For example, during 2008 a winner would have been down only a few percent relative to other stocks that on average were down more than 30 percent. During market upswings, losers would similarly be defined as stocks that were up only a few percentage points.
2See Geczy and Samonov [2013] for evidence of momentum in U.S. stocks from 1801 to 2012 in what the authors call, with some justifiable pride, “the world’s longest backtest.”
3See Chabot et al. [2009].4See Asness et al. [2013].5See, for instance, Asness [1997]; Booth [2013]; Erb
[2014]; Fama and French [2008]; Huij et al. [2014]; Larson [2013]; among others.
6Specif ically, this is def ined as the past 12-month return, skipping the most recent month’s return (to avoid microstructure and liquidity biases), as defined by Asness [1994] and now generally used as the standard definition of momentum.
7SMB and HML are formed by first splitting the uni-verse of stocks into two size categories (S and B) using NYSE market-cap medians and then splitting stocks into three groups based on book-to-market equity [highest 30% (H), middle 40% (M), and lowest 30% (L), using NYSE breakpoints]. The intersection of stocks across the six categories are value-weighed and used to form the portfolios SH (small, high BE/ME), SM (small, middle BE/ME), SL (small, low BE/ME), BH (big, high BE/ME), BM (big, middle BE/ME), and BL (big, low BE/ME), where SMB is the average of the three small stock portfolios (1/3SH+1/3SM+1/3SL) minus the average of the three big-stock portfolios (1/3BH+1/3BM+1/3BL) and HML is the average of the two high book-to-market portfolios (1/2SH+1/2BH) minus the average of the two low book-to-market portfolios (1/2SL+1/2BL). UMD is con-structed similarly to HML, in which two size groups and three momentum groups [highest 30% (U), middle 40% (M), lowest 30% (D)] are used to form six portfolios and UMD is the average of the small and big winners minus the average of the small and big losers.
8A link to Kenneth French’s data library can be found here if you want to use the data, update the series, or check the analysis yourself: http://mba.tuck.dartmouth.edu/pages/faculty/ken.french/data_library.html.
9Another of the never-ending attempts to knock down momentum is a vague comparison to some other effects that did not hold up out-of-sample (see, for example, http://www.dimensional.com/famafrench/questions-answers/qa-can-investors-profit-from-momentum.aspx). While examining out-of-sample results is always crucial, comments like this give us even more motivation to see if the analogy is valid.
10If that’s not a word, it should be.11See Asness and Frazzini [2013] for the argument that
value as defined by Fama and French, HML, was logical for its time, before momentum had been studied, but acciden-tally mixes about 80% of a pure value strategy with about 20% of a very odd (accidentally and thus poorly constructed) momentum strategy. Asness and Frazzini [2013] find that a small, logical change in how value is defined produces what they call “pure value.” This definition of value is positive 81% of the five-year periods, below momentum’s consistency.
12We chose the 60/40 weights deliberately in an attempt to build a balanced portfolio of the two. Part of the reason for choosing 60/40 and not 50/50, another possible balanced allocation, is found in Asness and Frazzini [2013] who show that the classic HML is best thought of as an approximately 80/20 combination of value and momentum. Thus, a 60/40 combination of these factors is actually closer to a real 50/50 combination of pure value and momentum. Results are not sensitive to this choice.
13The above are, again, long-short factors, which abso-lutely do indeed count as some trade this way directly. In fact, they were one of the original methodologies used by Fama and French [1993] to explore the value effect. But not all investors are able or willing to go long and short so we consider their situation as well.
14For this exercise, it is important to look at market-adjusted returns since we know that the market returns are generally positive and a stand-alone short momentum port-folio (losers) has a different market beta than a stand-alone long momentum portfolio (winners), which will average higher betas. Though, for completeness we also show the results without market-adjustment and they hold up as well (in fact, too well, because the lack of proper risk adjustment favors the long side).
15Note, as we are using Kenneth French’s data, value is defined here as simply book-to-price, yet there are mul-tiple ways of measuring value (see Israel and Moskowitz [2013a]), and some would argue that book-to-price is the wrong measure of value for relatively more mature, stable firms with lower expectations of subsequent earnings growth (see Penman et al. [2013]).
JPM-ASNESS.indd 89JPM-ASNESS.indd 89 9/18/14 10:18:51 AM9/18/14 10:18:51 AM
90 FACT, FICTION, AND MOMENTUM INVESTING SPECIAL 40TH ANNIVERSARY ISSUE
16We leave it to the reader as to why one would denounce a cake.
17Hitting below the Mendoza line has often been used in baseball to define incompetent hitting and is the threshold often used to claim that a player does not belong in major league baseball, regardless of his defensive prowess. It is named after Mario Mendoza, a good defensive shortstop who actu-ally hit 0.215 in his career.
18Obviously, even in this scenario, there are still limits, because it requires investors remaining patiently invested in these strategies. We are not predicting this will happen, as we are actually actively betting it doesn’t occur, but simply raising the analogous possibility here.
19The correlation between UMD and HML in Kenneth French’s data is −0.4 over the full sample period (1927–2013). We have used the definition of HML as per Kenneth French’s data for objectivity and to make it easy for the reader to repli-cate the results, but we note that using the definition of value in Asness and Frazzini [2013] dramatically increases the mag-nitude of this negative correlation (to −0.7) and the power of combining value and momentum. Following their method-ology, the results of this section would be far stronger.
20By the way, we fully recognize and acknowledge that the past ten years have not been great for momentum, with the ten-year return for UMD falling in the seventh percen-tile of rolling ten-year returns (going back to 1927). At the same time, the past ten years have not been great for value, either, with the ten-year return for HML falling in the fifth percentile of rolling ten-year returns. That, of course, makes the prior ten-year return of the 60/40 combination of the two low (second percentile), but still positive (12%). You know a strategy has a pretty great history when the second percentile return is still positive. As Exhibit 6 indicates, even with the lower-than-normal returns for UMD over the prior ten-year period, the optimal weight on momentum would still be high (that is, if you knew the returns on UMD would be as low as the past ten-years the ex post highest Sharpe ratio portfolio still wants a lot of it as it hedges value so well). Also, if investors are basing their concerns about momen-tum’s returns disappearing on the prior ten years, despite the longer-term evidence, it would seem odd that they wouldn’t similarly be concerned about value’s returns. For both value and momentum we, obviously, think the longer-term evi-dence is most convincing.
21Asness [2011] shows a very similar thing in Japan. Momentum for choosing stocks within Japan is one of the few places we’ve seen a zero historical momentum premium (albeit over the much shorter international versus USA sample). Asness shows, among other arguments including the significant chance this was a random occurrence, that even with this result, a Sharpe ratio optimizing investor with perfect knowledge of this zero premium future would
still put substantial weight on momentum for very similar diversif ication/hedging reasons to those discussed here in the hypothetical.
22By the way, for those students of the esoteric history of quant investing, in the period immediately before 2009 some quants (not the mythmakers we discuss in this piece but quantitative investors who had embraced both value and momentum) made the decision to overweight momentum versus value and other factors since before the painful 2009 episode the long- and in particular the short-term track record for momentum versus value was even stronger (this overweight was a misguided, in our opinion, attempt to use the momentum of momentum to time itself since momentum was stronger than value in the 2007–2008 financial crisis). We get plenty wrong, none of which we will volunteer here, but as in early 2000, when many argued for abandoning value and we yelled no, we also argued against this soon-to-be-disastrous overweight of momentum immediately prior to 2009. We are cheerleaders for giving momentum a balanced, significant weight in a process, not for trying to overweight it at the right time.
23Using value as defined by Asness and Frazzini [2013], which we do not do here since we stick with the normal for-mulation, this amelioration is dramatically more pronounced. Constructing value properly, and focusing on the returns of value and momentum together, something we always encourage as they form a system, shows 2009 to be only a modest event to the properly defined combination.
24This is a bigger drop than for value but not by as much because it appears as, again, momentum’s natural volatility is higher and value, as defined on Kenneth French’s website, contains about 20% momentum as we have discussed, which acts as a hedge.
25Jegadeesh and Titman [1993].26Grinblatt and Moskowitz [2004].27Chan et al. [1996].28Some behavioral models that deliver momentum:
DeLong et al. [1990]; Daniel et al. [1998]; Barberis et al. [1998]; Hong and Stein [1999]; Shefrin and Statman [1985]; Grinblatt and Han [2005]; and Frazzini [2006].
29Some risk-based models that deliver momentum: Berk et al. [1999]; Johnson [2002]; Sagi and Seasholes [2007]; and Zhang [2004].
30Asness et al. [2013].31Ironically, the myth-spreading supporters of value
come from both ends of the spectrum, some that believe value is purely a risk-based efficient markets effect, and some who believe value is instead only the product of noise in prices coming from inefficient markets (and, rather oddly, that they are the only ones to ever have advanced that possibility). Perhaps believing in extreme explanations is correlated with mythmaking?
JPM-ASNESS.indd 90JPM-ASNESS.indd 90 9/18/14 10:18:51 AM9/18/14 10:18:51 AM
THE JOURNAL OF PORTFOLIO MANAGEMENT 91SPECIAL 40TH ANNIVERSARY ISSUE
REFERENCES
Asness, C.S. “Variables That Explain Stock Returns.” Ph.D. Dissertation, University of Chicago, 1994.
——. “The Interaction of Value and Momentum Strategies.” Financial Analysts Journal, Vol. 53, No. 2 (1997) pp. 29-36.
——. “Momentum in Japan: The Exception that Proves the Rule.” The Journal of Portfolio Management, Vol. 37, No. 4 (2011), pp. 67-75.
Asness, C.S., and A. Frazzini. “The Devil in HML’s Details.” The Journal of Portfolio Management, Vol. 39, No. 4 (2013), pp. 49-68.
Asness, C.S., A. Ilmanen, R. Israel, and T. Moskowitz. “Investing with Style.” Journal of Investment Management, forthcoming, 2013.
Asness, C.S., T. Moskowitz, and L. Pedersen. “Value and Momentum Everywhere.” Journal of Finance, Vol. 68, No. 3 (2013) pp. 929-985.
Barberis, N., A. Shleifer, and R. Vishny. “A Model of Investor Sentiment.” Journal of Financial Economics, No. 49 (1998), pp. 307-334.
Bergstresser, D., and J. Pontiff. “Investment Taxation and Portfolio Performance.” Journal of Public Economics, No. 97 (2013), pp. 245-257.
Berk, J., R. Green, and V. Naik. “Optimal Investment, Growth Options, and Security Returns.” Journal of Finance, No. 54 (1999), pp. 1553-1607.
Booth, D. “The Evolution of Dimensional.” Equius Partners, Inc., Asset Class Newsletter, 2013.
Carhart, M. “On Persistence in Mutual Fund Performance.” Journal of Finance, No. 53, 1997.
Chabot, B., Ghysels, E., and Jagannathan, R. “Price Momentum in Stocks: Insights from Victorian Age Data.” National Bureau of Economic Research Working Paper 14500, 2009.
Chan, L., N. Jegadeesh, and J. Lakonishok. “Momentum Strategies.” Journal of Finance, No. 51 (1996), pp. 1681-1713.
Daniel, K., and T. Moskowitz. “Momentum Crashes.” Working paper, University of Chicago, 2013.
Daniel, K., D. Hirshleifer, and A. Subrahmanyam. “A Theory of Overconfidence, Self-Attribution, and Security Market Under- and Over-Reactions.” Journal of Finance, No. 53 (1998), pp. 1839-1885.
DeLong, J.B., A. Shleifer, L.H. Summers, and R.J. Wald-mann. “Positive Feedback Investment Strategies and Desta-bilizing Rational Speculation.” Journal of Finance, Vol. 45, No. 2 (1990), pp. 379-395.
Erb, C.B. “Momentum Has Not Been ‘Overgrazed’: A Visual Overview in 10 Slides.” Working paper, SSRN, 2014.
Fama, E.F., and K.R. French. “The Cross-Section of Expected Stock Returns.” Journal of Finance, No. 47 (1992), pp. 427-465.
——. “Common Risk Factors in the Returns on Stocks and Bonds.” Journal of Financial Economics, No. 33 (1993), pp. 3-56.
——. “Dissecting Anomalies.” Journal of Finance, No. 63 (2008).
——. “Size, Value, and Momentum in International Stock Returns.” Journal of Financial Economics, No. 105 (2012), pp. 457-472.
Frazzini, A. “The Disposition Effect and Underreaction to News.” Journal of Finance, No. 61 (2006).
Frazzini, A., R. Israel, and T.J. Moskowitz. “Trading Costs of Asset Pricing Anomalies.” Working paper, University of Chicago, 2013.
——. “A New Core Equity Paradigm.” White paper, AQR Capital Management, 2013.
Geczy, C., and M. Samonov. “212 Years of Price Momentum (the World’s Longest Backtest: 1801–2012).” Working paper, University of Pennsylvania the Wharton School, 2013.
Goyal, A., and S. Wahal. “Is Momentum an Echo?” Journal of Financial and Quantitative Analysis, forthcoming, 2013.
Grinblatt, M., and B. Han. “Prospect Theory, Mental Accounting, and Momentum.” Journal of Financial Economics, 2005.
Grinblatt, M., and T.J. Moskowitz. “Predicting Stock Price Movements from Past Returns: The Role of Consistency and Tax-Loss Selling.” Journal of Financial Economics, No. 71 (2004), pp. 541-579.
JPM-ASNESS.indd 91JPM-ASNESS.indd 91 9/18/14 10:18:52 AM9/18/14 10:18:52 AM

92 FACT, FICTION, AND MOMENTUM INVESTING SPECIAL 40TH ANNIVERSARY ISSUE
Hong, H., and J. Stein. “A Unified Theory of Underreaction, Momentum Trading and Overreaction in Asset Markets.” Journal of Finance, LIV, No. 6, 1999.
Hong, H., T. Lim, and J. Stein. “Bad News Travels Slowly: Size, Analyst Coverage, and the Profitability of Momentum Strategies.” Journal of Finance, No. 55 (2000), pp. 265-295.
Huij, H., S. Lansdorp, D. Blitz, and P. Stein. “Factor Investing: Long-Only versus Long-Short.” Working paper, Erasmus School of Economics, 2014.
Israel, R., and T. Moskowitz. “The Role of Shorting, Firm Size, and Time on Market Anomalies.” Journal of Financial Economics, Vol. 108, No. 2 (2013a), pp. 275-301.
——. “How Tax Efficient Are Equity Styles?” Working paper, University of Chicago Booth School of Business, 2013b.
Jegadeesh, N., and S. Titman. “Returns to Buying Winners and Selling Losers: Implications for Stock Market Efficiency.” Journal of Finance, 48 (1993), pp. 65-91.
Johnson, Timothy. “Rational Momentum Effects.” Journal of Finance, No. 57 (2002), pp. 585-608.
Keim, D.B. “An Analysis of Mutual Fund Design: The Case of Investing in Small-Cap Stocks.” Journal of Financial Eco-nomics, 51 (1999), pp. 173-194.
Korajczyk, R.A., and R. Sadka, “Are Momentum Profits Robust to Trading Costs?” Journal of Finance, 59 (2004), pp. 1039-1082.
Larson, R. “Hot Potato: Momentum as an Investment Strategy.” Research Aff iliates Fundamentals Newsletter, 2013.
Lesmond, D.A., M.J. Schill, and C. Zhou. “The Illusory Nature of Momentum Profits.” Journal of Financial Economics, 71 (2003), pp. 349-380.
Novy-Marx, R. “Is Momentum Really Momentum?” Journal of Financial Economics, Vol. 103, No. 3 (2012), pp. 429-453.
Penman, S., F. Reggiani, S. Richardson, and A.I. Tuna. “An Accounting-Based Characteristic Model for Asset Pricing.” Working paper, Columbia University, 2013.
Sagi, J., and M.S. Seasholes. “Firm-Specific Attributes and the Cross-Section of Momentum.” Journal of Financial Eco-nomics, 84 (2007), pp. 389-434.
Shefrin, H., and M. Statman. “The Disposition to Sell Win-ners Too Early and Ride Losers Too Long: Theory and Evi-dence.” Journal of Finance, 40 (1985), pp. 777-791.
Sialm, C., and H. Zhang. “Tax-Efficient Asset Management: Evidence from Equity Mutual Funds.” Working paper, Uni-versity of Texas at Austin, 2013.
Zhang, H. “Dynamic Beta, Time-Varying Risk Premium, and Momentum.” Yale ICF Working Paper No. 04–26, 2004.
To order reprints of this article, please contact Dewey Palmieri at [email protected] or 212-224-3675.
JPM-ASNESS.indd 92JPM-ASNESS.indd 92 9/18/14 10:18:52 AM9/18/14 10:18:52 AM