Fact Book Fiscal Year 2010 - Continental USA€¦ · North America among Top 5 Automotive hoses &...
68
Fact Book 2010 | © Continental AG 1 1 Fact Book Fiscal Year 2010 2 Topics Continental at a Glance I. Continental Strategy II. Continental Corporation III. Market Data IV. Automotive Group V. Rubber Group VI. Corporate Social Responsibility at Continental VII. Share & Bond Information VIII. Glossary IX.
Transcript of Fact Book Fiscal Year 2010 - Continental USA€¦ · North America among Top 5 Automotive hoses &...

Fact Book 2010 |
© Continental AG
1
1
Fact Book Fiscal Year 2010
2
Topics
A. Continental at a GlanceI.
B. Continental StrategyII.
C. Continental CorporationIII.
D. Market DataIV.
Automotive GroupV.
Rubber GroupVI.
Corporate Social Responsibility at ContinentalVII.
Share & Bond InformationVIII.
GlossaryIX.

Fact Book 2010 |
© Continental AG
2
3
Continental at a Glance
140 Years of Progress and Achievement
Merger with major companies of
the German rubber industry to
form Continental Gummi-Werke
AG.
Acquisition of a US company’s
Automotive Brake & Chassis
unit, the core of which is Alfred
Teves GmbH in Frankfurt.
Continental-Caoutchouc- and
Gutta-Percha Compagnie is
founded in Hanover, Germany.
Continental strengthens its
position in the ASEAN region
and Australia by establishing
its Continental Sime Tyre joint
venture.
Takeover of the European tire operations of Uniroyal,
the tire operations of the Austrian company Semperit,
the North American tire manufacturer General Tire.
Continental reinforces its activities by
acquiring Temic, the international
electronics specialist.
Continental acquires Siemens VDO
Automotive AG and advances to
among the top five suppliers in the
automotive industry worldwide, at the
same time boosting its market position
in Europe, North America and Asia.
Continental expands its activities in
telematics, among other fields, with
the acquisition of the automotive
electronics business from Motorola.
Through the acquisition of Phoenix
ContiTech becomes the world‟s largest
specialist for rubber and plastics
technology outside the tire industry.
1871
1929
1979
1985
1987 1998
2001
2003 2004
2006
2007
Continental acquires a majority interest in
the Slovak company Continental Matador
Rubber s.r.o. and expands its position for
the Tires and ContiTech divisions in central
and eastern Europe.
4
6,743
9,132
10,115
11,233 11,408 11,534
12,597
13,837
14,887
16,619
24,239
20,096
26,047
398 607 533
33
694 855 1,157
1,507 1,602 1,676
-296 -1,040
1,935
138 235 205 -258
226 314 716 930 982 1,021
-1,124 -1,649
576
0
5,000
10,000
15,000
20,000
25,000
1998 1999 2000 2001 2002 2003 2004 2005 2006 2007³ 2008 2009 2010
Sales
EBIT
NIAT2)
US GAAP IFRS
Continental at a Glance
Continental Corporation – Sales, EBIT & Net Income1)
1) From 1998 until 2003 US GAAP / from 2004 onwards IFRS
2) Net income attributable to the shareholders of the parent under IFRS since 2004
3) Since December 1, 2007, including Siemens VDO
(in € million)

Fact Book 2010 |
© Continental AG
3
5
Continental at a Glance
Executive Board – Together more than 170 Years of ExperienceA
UT
OM
OT
IVE
GR
OU
P
Supervisory Board headed by Prof. Dr. Wolfgang Reitzle
Chief Financial Officer
Finance; Controlling; Law; IT
24 years of experience
Passenger and Light Truck Tires Division
14 years of experience
Commercial Vehicle Tires Division
Purchasing
21 years of experience
ContiTech Division
Director of HR and Labor Relations
31 years of experience
Wolfgang Schäfer
Nikolai Setzer
Dr. Hans-Joachim Nikolin
Heinz-Gerhard Wente
RU
BB
ER
GR
OU
P
Chassis & Safety Division
15 years of experience
Dr. Ralf Cramer
Powertrain Division
26 years of experience
José Avila
Interior Division
24 years of experience
Helmut Matschi
Chairman of the Executive Board
Quality & Environment; Corp. Comm.
18 years of experience
Dr. Elmar Degenhart
6
Evolution 2000–2010
EU 27 road fatalities
CO2 targets EU, US & China (g/km)
(1) China fuel consumption standard III is estimated at 20% further
saving /Sources: GS Research, Gao Hua Securities Research
estimates
Safety - vision zero
Environment - clean power Information - always on
Affordable Cars - mobility for everyone
Infotainment
11.0
15.3
2010 2015E
A&B segment in BRIC (million units)
Multimedia
GPS / Galileo
Infrastructure Other Cars
75.426
70.731
65.44163.90363.155
59.40960.26758.982
57.69156.427
54.30253.342
50.351
47.29045.346
43.10442.500
38.900
34.500
54.302
51.285
48.268
45.252
42.235
39.218
36.201
33.185
30.168
27.151
1991 1992 1993 1994 1995 1996 1997 1998 1999 2000 2001 2002 2003 2004 2005 2006 2007 2008 2009 2010
EU road fatalities
EU fatalities EU target to halve the number of fatalities by 2010EU fatalities EU target to halve the number of fatalities by 2010
158130
95
198 198167
214
155 155
2008 2012E 2020E
EU US China
Source: CSM March 2011
Continental Strategy
Megatrends in the Automotive Industry

Fact Book 2010 |
© Continental AG
4
7
6.8
12.9
2008 2015E
Continental at a Glance
Leading Global Position in Key Automotive Electronics Applications
Source: Global Insight, The Freedonia Group
1) ESC: Electronic Stability Control is a type of electronic brake system
2) Source: Frost & Sullivan, December 2009
Actuation
Advanced driver assistance
systems
Airbag electronics
Electronic brake systems (EBS)
Foundation brake systems
Diesel injection systems
Gasoline injection systems
Transmission control units
Double clutch transmission
control units
Body & security products
CV interiors
Device connectivity & telematics
units
Instrumentation and displays &
human machine interfaces
Sales 2010 €5,775 mill.
% of total 22%
Sales 2010 €4,731 mill.
% of total 18%
Sales 2010 €5,518 mill.
% of total 21%
ESC1 installation rate by region (%)
Gasoline direct injection systems
installation rate by region (%) Telematics market2 (in $ billion)
Chassis & Safety Powertrain Interior
13%
28%
9%
33%
2010 2015E
EU NAFTA
63%
86%85%
98%
2010 2015E
EU NAFTA
8
Sales 2010 €3,095 mill.
% of total 12%
Continental at a Glance
Leading Global Position in Tire and Non-Tire Rubber
Sales breakdown (%)
Europe overall
Europe OE
Europe winter tires
North America among Top 5
Europe overall
Europe OE
Europe industrial tires
North America among Top 5
Automotive hoses & hose lines
Automotive interior trim
Conveyor belts
Marine & oil hoses & hose lines
Multiple V-ribbed belts & timing belts
Railway air springs
Truck & bus air springs
Sales 2010 €5,821 mill.
% of total 22%
Sales 2010 €1,428 mill.
% of total 5%
Passenger & Light Truck Tires Commercial Vehicle Tires ContiTech
Sales breakdown (%) Sales breakdown (%)
OE25%
Non-OE
75%
OE18%
Non-OE
82%OE
54%
Non-OE
46%

Fact Book 2010 |
© Continental AG
5
9
Continental at a Glance
Continental Corporation Worldwide
More than 194 sites for production and R&D in 38 countries. Headquarters in Hanover, Germany.
Status: March 2011
Europe
South-America
Brazil
Chile
Costa Rica
Ecuador
Asia
China
India
Japan
Malaysia
Philippines
Singapore
South Korea
Sri Lanka
Thailand
Tunisia
South Africa
AfricaAustralia
Austria
Belgium
Czech Republic
Finland
France
Germany
Greece
Hungary
Serbia
Slovakia
Spain
Sweden
Switzerland
Turkey
UK
North-America
Canada
Mexico
USA
Italy
Portugal
Romania
Russia
10
Continental at a Glance
Development of Consolidated Sales by Region
* Since December 2007 including Siemens VDO
32% 31%
31%29%
27%
37%37%
36%
34%
33%21%
21%
19%
18%
19%
7%
8%
10%
14%
16%
3%
3%
4%
5%
5%
14.9
16.6
24.2
20.1
26.0
2006 2007* 2008 2009 2010
(€ billion)
Germany Rest of Europe NAFTA Asia Other countries

Fact Book 2010 |
© Continental AG
6
11
Continental at a Glance
Development of Consolidated Sales by Division
* Since December 2007 including Siemens VDO
** Automotive Systems until 2006
9%
24%21%
21%7%
16%
17%
18%
28%
21%
22%
22%
40%
31%
29%
21%
23%
22%
10%
9%
6%
5%
5%
19%
18%
12%
12%
12%
14.9
16.6
24.2
20.1
26.0
2006 2007* 2008 2009 2010
(€ billion)
Interior Powertrain Chassis & Safety Automotive Systems** Passenger and Light Truck Tires Commercial Vehicle Tires ContiTech
12
35%
34%33% 33% 31%
32%
32%
33%33%
32%17%
17%
16%14%
14%
11%
12%
13%14%
16%
5%
5%
5%6%
7%
85,224
151,654
139,155134,434
148,228
2006 2007* 2008 2009 2010
Germany Rest of Europe NAFTA Asia Other Countries
Continental at a Glance
Number of Employees by Region
* Since December 2007 including Siemens VDO

Fact Book 2010 |
© Continental AG
7
13
Continental at a Glance
Number of Employees by Division
* Since December 2007 including Siemens VDO
** Automotive Systems until 2006
22% 22% 20% 20%
21%18%
18%18%
18%19%
20%
21%
35%
29%
17%19%
20%
19%
10%
6%6%
6%
5%
26%
16%
16%
16%
17%
151,654
139,155
134,434
2006 2007* 2008 2009 2010
Interior Powertrain Chassis & Safety Automotive Systems** Passenger and Light Truck Tires Commercial Vehicle Tires ContiTech
85,224
148,228
14
Topics
A. Continental at a GlanceI.
B. Continental StrategyII.
C. Continental CorporationIII.
D. Market DataIV.
Automotive GroupV.
Rubber GroupVI.
Corporate Social Responsibility at ContinentalVII.
Share & Bond InformationVIII.
GlossaryIX.

Fact Book 2010 |
© Continental AG
8
15
Continental Strategy
We Shape the Megatrends in the Automotive Industry
Information - Always on Affordable Cars - Mobility for everyone
Environment – Clean powerSafety – Vision zero
16
Continental Strategy – Megatrend Environment
Initiatives in EU, USA and Japan – Towards Cleaner Mobility
EU sets average CO2 emissions
from 2012 at 130 g/km (currently
160 g/km) by means of improvement
in vehicle technology
From 2020 onwards, the target is
95 g CO2/km for the new car fleet
From 2012 onwards, excess
emissions premium if not meeting
targets
EU1
1) Regulation (EC) No. 443/2009
2) Refers to the joint proposal of NHTSA and EPA, May 2009, and President Obama´s NFPE; The White House, May 19, 2009
3) Refers to “Law on Rationalization of Energy Use” of the Ministry of Economics, Trade and Industry
4) NHTSA: National Highway Traffic Safety Administration
5) EPA: Environmental Protection Agency
6) CAFE: Corporate Average Fuel Economy
7) ECCJ: Energy Conservation Center Japan
Emerging markets likely to follow Europe/USA/Japan on fuel efficiency standards
NHTSA4 and EPA5 to establish a
National Fuel Efficiency Policy (NFEP):
Increase CAFE6 from 25 mpg to
35.5 mpg by 2016 for passenger
cars and light trucks combined
Target is equivalent to a reduction in
CO2 from 210 g/km to 180 g/km
From 2020 onwards, the CAFE6
target is equivalent to 130g/km
USA2
ECCJ7 targets to improve fuel
efficiency standards by 23.5% by 2015
vs. 2004:
Increase average level of fuel
efficiency from 13.6 km/l to 16.8 km/l
for passenger cars
Target is equivalent to a reduction in
CO2 from 170 g/km to 140 g/km
Japan3

Fact Book 2010 |
© Continental AG
9
17
Continental Strategy – Megatrend EnvironmentReduction of CO2 Emissions1: Solutions by Continental
Hybrid electric vehicle
Piezo common rail injection
Gasoline direct injection
Engine downsizing and turbocharger
SCR² systems/DDS³
Telematics, ACC, ADAS
Energy management (AES⁴)
Tires (rolling resistance, TPMS)
Double clutch transmission
Transmission (POD⁵)
Energy management (POD⁵)
Brake systems Min Max
~25%
~25%
15-20%
~15%
5%
5%
2-5%
3%
3%
1-2%
1-2%
1) Saving potential compared with gasoline port fuel injection Euro 4
2) Selective Catalytic Reduction
3) DEKA injector for diesel dosing into exaust gas
4) Advanced Energy Supply
5) Power-on-demand
5%
18
Continental Strategy – Megatrend Environment
Roadmap towards “Clean Power”: Selection of Technologies
Turbo Charger
Downsizing
2010 20202015
CO2 Reduction
Start-
Stop
Hybrid
Technology
Range
Extender
Full EV
Injection
Technology
Variable
Compression
RatioExhaust
Heat
Recovery
Time

Fact Book 2010 |
© Continental AG
10
19
Continental Strategy – Megatrend Environment
ContiTech – Green Technologies
Pure printing
Designed
Green*
Lightweight
construction*
Perfect swing
for wind power
Ecological
pioneer*
Climate-
friendly
mining
SCR
technology:
Zero
emissions*
Energy
efficiency
in our
production
Tapping
regenerative
energies
Full power for
the solar
industry
* Technologies supplied to the automotive industry
20
Continental Strategy – Megatrend Safety
Initiatives in EU, USA and Japan – Towards Safer Mobility
Electronic stability control (ESC)
mandatory by •November 2011 for all new types of
passenger cars •November 2014 for all new passenger
cars1
Tire pressure monitoring system (TPMS)
mandatory by •November 2012 for all new types of
passenger cars •November 2014 for all new passenger
cars1
Advanced emergency braking system
and lane departure warning mandatory by •November 2013 for all new types of heavy
commercial vehicles and buses •November 2015 for all new heavy
commercial vehicles and buses2
Brake assist system mandatory for all new
passenger cars by November 20113
Framework to be established for the
deployment of intelligent transportation
systems4
EU
Electronic stability control (ESC)
mandatory by 2011 for all new light
vehicles5
Tire pressure monitoring system (TPMS)
mandatory for all new light vehicles since
September 20076
USA
Electronic stability control (ESC)
mandatory by
•October 2012 for all new types of
passenger cars
•October 2014 for all new passenger cars7
Advanced emergency braking system
and lane departure warning mandatory by
•November 2013 for all new types of heavy
commercial vehicles and buses
•November 2015 for all new heavy
commercial vehicles and buses
Japan
1) Regulation (EC) No. 661/2009
2) Regulation (EC) No. 661/2009
3) Regulation (EC) No. 78/2009; refers to passenger cars for maximum 8 passengers plus driver
4) Directive 2010/40/EU of the European Parliament and of the Council of July 2010
5) Federal Motor Vehicle Safety Standard No. 126 of the National Highway Traffic Safety Administration (NHTSA);
refers to vehicles with a gross vehicle weight of ≤4.536 t
6) Federal Motor Vehicle Safety Standard No. 138 of the National Highway Traffic Safety Administration (NHTSA);
refers to vehicles with a gross vehicle weight of ≤4.536 t
7) Source: Ministry of Land, Infrastructure, Transport and Tourism (MLIT) in Japan
Emerging markets likely to follow EU/USA on ESC regulation

Fact Book 2010 |
© Continental AG
11
21
75,426
70,731
65,44163,90363,155
59,40960,26758,982
57,69156,427
54,30253,342
50,351
47,29045,346
43,10442,500
38,900
34,500
54,302
51,285
48,268
45,252
42,235
39,218
36,201
33,185
30,168
27,151
1991 1992 1993 1994 1995 1996 1997 1998 1999 2000 2001 2002 2003 2004 2005 2006 2007 2008 2009 2010
EU road fatalities
EU fatalities EU target to halve the number of fatalities by 2010
Continental Strategy – Megatrend Safety
Development of Road Safety in Europe
Source: CARE (EU road accident database)
22
Continental Strategy – Megatrend Safety
ContiGuard®: 5 Cornerstones of Comprehensive Vehicle Safety
Active Safety Safety Telematics
Passive Safety
Sensor fusion (beam/camera)
Short range Lidar
Mid range radar 24 GHz
Long range radar 77GHz
Camera
Telematics control unit
E-Horizon
Car-to-X Communication
Electric power steering
Active rear axle kinematics
Chassis & safety controller
Electronic air suspension
Electronic stability control
Sensors
AFFP®
Accelarator
Force
Feedback
Pedal
Airbag control unit
Crash impact sound sensing
Pressure and acceleration satellites
Occupant classification systems
In crash
Pre crash Post crash
Traffic hazard
Vehicle Surrounding Sensors
HMI

Fact Book 2010 |
© Continental AG
12
23
Continental Strategy – Megatrend Safety
Winter Tire Regulation1
Austria
Estonia
Finland
Germany
Europe: Winter tires mandatory
Latvia
Lithuania
Romania
Sweden
Slovakia
Slovenia
November 1 to April 15 when winter weather conditions apply
December 1 to end of February
December 1 to end of February
December 1 to end of February
November 1 to April 1
December 1 to March 31
Mandatory when winter weather conditions apply
November 1 to March 31
November 15 to March 15 when winter weather conditions
apply (winter tires or radial tires with min. tread depth of 3 mm)
The snowflake symbol: This symbol can be displayed on a tire if it tests seven percent better than a reference standard tire with
M+S² marking when ABS-braking on snow.
November 15 to March 31 when roads are snowy/icy
Norway
Mandatory when winter weather conditions apply
Europe: Winter tires partly mandatory
Czech Republic
November 1 to March 31 on certain motorways
France
Mandatory on certain roads – marked with signs
Italy
Mandatory on certain roads – marked with signs
Switzerland
Driver may be held liable if they cause an accident with
summer tires mounted when winter weather conditions apply
Canada: Winter tires partly mandatory
1) Source: Continental AG and websites of country ministries and automobile associations 2) Mud + snow
Mandatory in Québec December 15 to March 15;
mandatory on certain roads in the mountains of Canada when winter weather conditions applyCanada
24
Continental Strategy – Megatrends Safety & Environment
Initiatives in EU, USA and Japan on Labeling of Tires1
EU² USA³ Japan⁴
Fuel
efficiency
Noise
performance
Wet
grip
1) Similar initiative present in South Korea
2) Regulation (EC) No 1222/2009
Starting November 2012, passenger and
van tires must be classified and labelled for
fuel efficiency, wet grip and noise
performance (external rolling noise)
EU member states are responsible for the
market surveillance and specification of
penalties for non-compliance and can
provide incentives for tires of class C or
better (wet grip and fuel efficiency)
EU Commission must review this
regulation within five years
The NHTSA** Tire Fuel Efficiency
Consumer Information Program proposes
to inform consumers about the effect of
tires on fuel efficiency, safety, and
durability
The program aims to implement a national
tire fuel efficiency rating system for
replacement tires, with the information
provided to consumers at the point of sale
and online
Following the establishment of a council by
the Japanese government to promote fuel
efficient tires in 2008, the Japan
Automobile Tyre Manufacturers
Association (JATMA) introduced a
voluntary tire labelling system in 2010.
The labelling applies to replacement
summer tires for passenger cars and has
information on rolling resistance and wet
grip performance
Tires with a grading of A and above for
rolling resistance performance are defined
as “fuel efficient tires” and are marked with
an additional symbol:
Rolling
resistance
Wet grip
The tire rating label proposed by NHTSA**
3) Source: National Highway Traffic Safety
Administration (NHTSA)
4) Source: Japan Automobile Tyre Manufacturers
Association

Fact Book 2010 |
© Continental AG
13
25
Continental Strategy – Megatrends Safety & Environment
Truck Tire Technology for Lowest Overall Driving Costs
*Compared to previous truck tire generation of the Continental brand
Savings thanks to low rolling resistance
Kilometers driven per year: 120,000
Diesel price (net):
€1.15 per literFuel savings* in total:
€2,584.1
In 2007 Continental started an initiative to launch new products
Latest truck tire generation of the Continental brand reduced rolling resistance significantly
Continental‟s focus is on overall driving costs
ContiCostCalculator (CCC) is a tool certified by DEKRA (a worldwide certification authority) to calculate the
overall operational costs for fleet customers
By taking into account mileage, retreads, fuel consumption and payload, the CCC tool shows that
Continental‟s new products lead to the lowest overall driving costs compared to competitors
26
Multimedia Devices
GPS / Galileo
Infrastructure
Other Cars
Infotainment
Continental Strategy – Megatrend Information
The Car will be Connected to its Environment!

Fact Book 2010 |
© Continental AG
14
27
Continental Strategy – Market Trend Affordable Cars
Definition of “Affordable Cars”
Western Europe Eastern Europe China India
Dacia Logan €7,000
Chery QQ €3,500
Tata Nano €1,700
Maruti 800 €3,430
Low Cost Car
Mature Market
Low Cost Car
Emerging Market
€5,000
€10,000
€1,700
VW Fox €10,725
28
CAGR Product portfolio of
Low-cost OEM embedded navigation 68% Interior
Selective catalytic reduction 65% Powertrain/ContiTech*
Battery propulsion systems 44% Powertrain
Synchronous motors 31% Powertrain
Start stop systems 31% Powertrain*
Mobile phone navigation 29% Interior
Variable valve train 23%
eCall 16% Interior
Gasoline direct injection 16% Powertrain
Turbocharger 15% Powertrain
Blind spot detection 15% Chassis & Safety
Adaptive cruise control 14% Chassis & Safety
Lane departure warning 14% Chassis & Safety
Curtain airbag 14% Chassis & Safety*
Stolen vehicle tracking 14% Interior
Ambient lighting 11% Interior*
Electric power steering 10% Chassis & Safety
*Multifunctional switches 10% Interior*
Xenon headlamps 10% Chassis & Safety**
Park assist systems 8% Chassis & Safety
Electric stability control 7% Chassis & Safety
TPMS 6% Interior
OEM embedded navigation 5% Interior
Semi active damping 5% Chassis & Safety
Anti-lock braking systems 4% Chassis & SafetySource: Frost & Sullivan, December 2009, based on 2008 data
* no complete system but electronics or components
** washer systems
AHigh growth
CAGR 16% -70%
BMedium growth
CAGR 10% -15%
CLow growth
CAGR 3% -10%
CA
GR
Expected worldwide revenue development in %
(CAGR 2008-2015)
Continental Strategy50% of the Automotive Products are amongst the 25 Fastest Growing Technologies

Fact Book 2010 |
© Continental AG
15
29
* Based on sales
**Based on units
Continental Strategy
Cost Consciousness – Production in Best-Cost Countries
27%
15%20%
60%69%
23%30%
13%
27%
68%
85%
26%32%
19%
32%
67%
100%
29%
Chassis & Safety * Powertrain * Interior * PLT ** CVT ** ContiTech *
Europe
57%
31%
65% 65%
23%
45%
62%
45%
72%68%
19%
51%
61%
45%
81%
65%
23%
57%
Chassis & Safety * Powertrain * Interior * PLT ** CVT ** ContiTech *
Rest of World
2008 2009 2010
30
Topics
A. Continental at a GlanceI.
B. Continental StrategyII.
C. Continental CorporationIII.
D. Market DataIV.
Automotive GroupV.
Rubber GroupVI.
Corporate Social Responsibility at ContinentalVII.
Share & Bond InformationVIII.
GlossaryIX.

Fact Book 2010 |
© Continental AG
16
31
(in € million) 2008 2009 2010
Sales 24,238.7 20,095.7 26,046.9
EBITDA 2,771.4 1,591.2 3,587.6
EBIT -296.2 -1,040.4 1,935.2
EBIT adjusted 1 1,180.5 2,516.8
in % of sales 1 5.9 9.7
Net interest expense -706.7 -720.8 -697.2
Income tax expense -75.0 154.3 -592.1
Non-controlling interests -45.6 -42.3 -69.9
NIAT² -1,123.5 -1,649.2 576.0
Undiluted earnings per share (in €) -6.84 -9.76 2.88
Operating Assets (avg.) 19,117.0 16,024.1 15,580.0
RoCE (avg.) in % -1.5 -6.5 12.4
R & D expense 1,498.2 1,356.3 1,450.4
in % of sales 6.2 6.7 5.6
Capex³ 1,595.2 860.1 1,296.4
in % of sales 6.6 4.3 5.0
Depreciation & amortization 4 3,067.6 2,631.6 1,652.4
in % of sales 12.7 13.1 6.3
thereof impairment⁵ 1,341.4 993.0 57.7
Free cash flow 628.5 1,640.3 566.9
1) EBIT before amortization of intangibles from PPA, consolidation and special effects; sales before changes in the scope of consolidation
2) Net income attributable to the shareholders of the parent
3) Capex including software
4) Excluding impairments on financial investments
5) 2008: including goodwill impairment of €1,230.0 mill.
2009: including goodwill impairment of €875.8 mill.
Continental Corporation
Consolidated Key Figures
31
32
6,639 6,615
5,892
5,093
4,3024,761
5,3375,696
5,997
6,658 6,4906,903
-37
285
419
513
605
701
485
726
Q1/08 Q2/08 Q3/08 Q4/08 Q1/09 Q2/09 Q3/09 Q4/09 Q1/10 Q2/10 Q3/10 Q4/10
Sales (in € million) adj. EBIT* (in € million)* Before amortization of intangibles from PPA, consolidation and special effects
Continental Corporation
Sales and Adjusted EBIT* by Quarter
Sales €24,239 mill. Sales €20,096 mill.
adj. EBIT* €1,181 mill.
Sales €26,047 mill.
adj. EBIT* €2,517 mill.

Fact Book 2010 |
© Continental AG
17
33Note: Trailing ROCE is calculated as reported EBIT for the last twelve month (LTM) divided by average Operating Assets (OA)
Continental Corporation
Back to Value Creation1
9,4
94
19
,53
8
19
,60
7
19
,11
7
18
,58
6
17
,78
0
16
,70
0
16
,02
4
15
,50
8
15
,35
3
15
,40
5
8.7% 8.6%7.2%
-1.5%-4.9%
-7.5%
-14.4%
-6.5%
-2.5%
0.6%
8.9%
12.4%
19.5%
Q1 Q2 Q3 Q4 Q1 Q2 Q3 Q4 Q1 Q2 Q3 Q4 Q4
2008 2009 2010 2010
trailing OA (in € million) Goodwill (in € million) trailing ROCE (in %)
15,58015,580
34
1) Amounts shown may contain rounding differences
2) Adjusted EBITDA before special effects excluding impairments
3) Includes change in inventory, trade receivables, trade payables and discounted notes
4) Includes dividends received, at-equity share in earnings of associates and income from other investments incl. impairments, gains and losses from disposals, other non-
cash items as well as changes in pension and post-employment provisions (including effects from transactions regarding contractual trust arrangements (CTA) in 2006
and 2009) and in other assets and liabilities
5) Adj. EBITDA to net cash interest paid
Continental Corporation
Key Historical Financials and Credit Metrics
(in € million )1 2006 2007 2008 2009 2010
Cash flow statement
Adjusted EBITDA2 2,339 2,568 3,001 2,354 3,662
Reported EBITDA 2,302 2,491 2,771 1,591 3,588
Net cash interest paid (78) (88) (519) (727) (703)
Tax paid (452) (484) (282) (205) (493)
Change in net working capital3 (184) (83) 275 595 (497)
Other 4 (765) 78 (360) 1,173 (46)
Cash flow provided by operating activites 823 1,914 1,885 2,427 1,849
Cash flow used for investing activities (1,464) (12,539) (1,256) (787) (1,282)
- thereof capex for PPE and intangibles (806) (904) (1,621) (911) (1,324)
Cash flow before financing actitivies (641) (10,626) 629 1,640 567
Balance sheet
Cash and cash equivalents 571 2,199 1,569 1,713 1,471
Derivative instruments and interest-bearing investments 33 71 64 104 202
Total indebtedness 1,785 13,127 12,117 10,713 8,991
Net indebtedness 1,181 10,856 10,484 8,896 7,317
Credit ratios
Net indebtedness / adj. EBITDA2 0.5x 4.2x 3.5x 3.8x 2.0x
Net cash interest paid coverage (ratio)5 30.1x 29.2x 5.8x 3.2x 5.2x

Fact Book 2010 |
© Continental AG
18
35
Continental Corporation
Development of Net Indebtedness and Gearing Ratio
618 518 525 33 30 28 20 7 0.4 0.1 0.1 14 0.1 1 0.2 7
2,601
1,899
1,169881 493
1,181
10
,85
6 10
,48
4
11
,04
2
9,7
47
9,4
65
8,8
96
8,2
32
8,0
17
8,0
92
7,3
17
168%
111%
59%
30%13%
25%
158%
190%
210%186%
226%219%
145%133%138%
118%
YE YE YE YE YE YE YE YE Q1 H1 9M YE Q1 H1 9M YE
2001 2002 2003 2004 2005 2006 2007 2008 2009 2010
Net indebtedness (in € million)
Off balance sheet debt (in € million)
Gearing Ratio (in %)
36
8,896 0
1,324611
443 564
1,652
684
1,056
7,317
Ne
t de
bt
(FY
20
09
)
Div
ide
nd
20
09
Ca
pe
x*
Ch
g. i
n
rece
iva
ble
s
Ch
g. i
nin
ve
nto
rie
s
Ch
g. i
np
aya
ble
s
De
pre
cia
tion
&
am
ort
iza
tio
n
Oth
er C
F
Ca
pita
lin
cre
ase
Ne
t de
bt
(FY
20
10
)Continental Corporation
Net Indebtedness Walk-down
€490 mill. burden from
change in working capital219%
118%
(in € million)
* According to CF statement including intangible assets

Fact Book 2010 |
© Continental AG
19
37
VDO facility
(Tranche C)Aug 2012,
3,985
VDO facility
(Tranche D,Revolver)
Aug 2012, 303
Bond
Jul 2015 (8.5%), 750
Bond
Jan 2016 (6.5%), 625
Bond
Sept 2017 (7.5%), 1,000
Bond
Oct 2018 (7.125%), 625
Various other
bank lines, 857
Other
indebtedness, 846
Continental Corporation
Gross Indebtedness by Sources
Gross indebtedness
at Dec. 31, 2010,
of €8,991 mill.
(PY: €10,713 mill.)
Cash of €1,471 mill.
(PY: €1,713 mill.)
Net indebtedness
at Dec. 31, 2010,
of €7,317 mill.
(PY: €8,896 mill.)
Available and fully
committed credit lines
of €2,774 mill.
(PY: €2,196 mill.)
(in € million)VDO facility
Bonds
Various other bank lines
Other indebtedness
Note: bond values and the values for the VDO facilities are nominal values, all others book values
38
1,238.1
4,596.3
71.3 15.8
768.3
2,300.7
2011* 2012 2013 2014 2015 later
Continental Corporation
Maturity Profile at December 31, 2010
(in € million)
* Including maturities under the revolving credit facility currently drawn at nominal €303 million,
Fact Book 2010 |
© Continental AG
20
39
100
100
87
25
18
54
13
75
82
46
Chassis & Safety(22% of total sales)
Powertrain(18% of total sales)
Interior(21% of total sales)
Passenger & Light Truck Tires
(22% of total sales)
Commercial Vehicle Tires(5% of total sales)
ContiTech(12% of total sales)
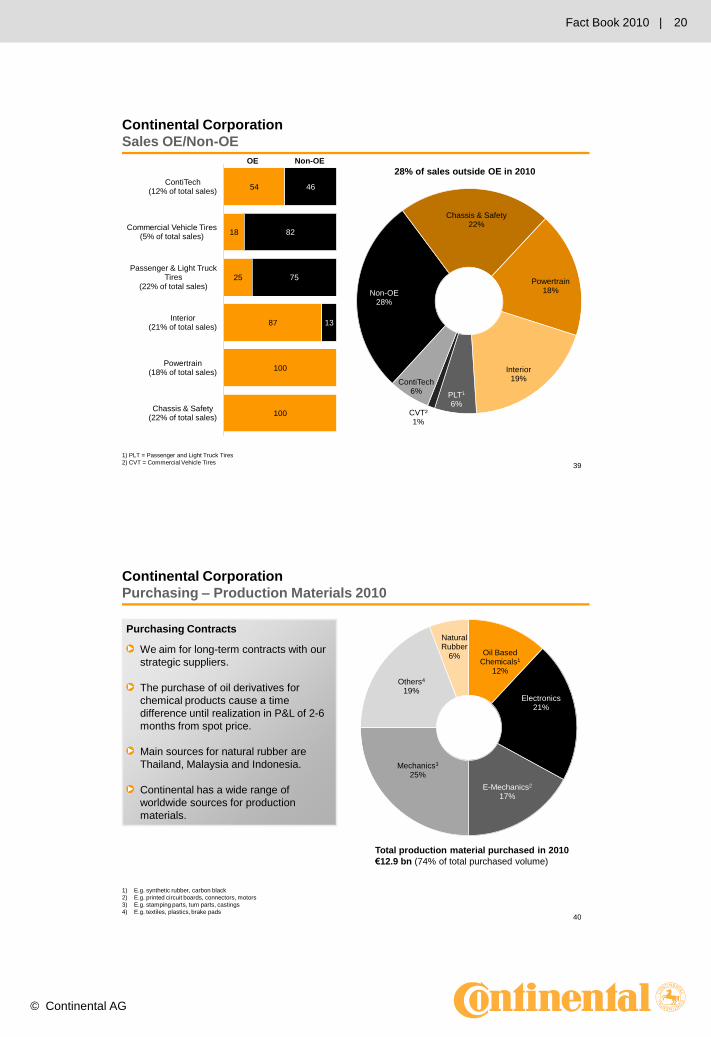
Continental Corporation
Sales OE/Non-OE
Non-OE28%
Chassis & Safety22%
Powertrain18%
Interior19%
PLT1
6%CVT²1%
ContiTech6%
28% of sales outside OE in 2010
1) PLT = Passenger and Light Truck Tires
2) CVT = Commercial Vehicle Tires
OE Non-OE
40
Continental Corporation
Purchasing – Production Materials 2010
Oil Based Chemicals1
12%
Electronics21%
E-Mechanics2
17%
Mechanics3
25%
Others4
19%
NaturalRubber
6%
Total production material purchased in 2010
€12.9 bn (74% of total purchased volume)
Purchasing Contracts
We aim for long-term contracts with our
strategic suppliers.
The purchase of oil derivatives for
chemical products cause a time
difference until realization in P&L of 2-6
months from spot price.
Main sources for natural rubber are
Thailand, Malaysia and Indonesia.
Continental has a wide range of
worldwide sources for production
materials.
1) E.g. synthetic rubber, carbon black
2) E.g. printed circuit boards, connectors, motors
3) E.g. stamping parts, turn parts, castings
4) E.g. textiles, plastics, brake pads

Fact Book 2010 |
© Continental AG
21
41
Topics
A. Continental at a GlanceI.
B. Continental StrategyII.
C. Continental CorporationIII.
D. Market DataIV.
Automotive GroupV.
Rubber GroupVI.
Corporate Social Responsibility at ContinentalVII.
Share & Bond InformationVIII.
GlossaryIX.
42
Market Data
Increasing Installation Rates of Electronic Brake Systems
Source: Continental estimates
ABS/TCS ESC Total EBS
0%
20%
40%
60%
80%
100%
Europe
North America
0%
20%
40%
60%
80%
100%
2008 2009 2010 2011 2012 2013 2014 2015
Japan
2008 2009 2010 2011 2012 2013 2014 2015
China

Fact Book 2010 |
© Continental AG
22
43
0%
20%
40%
60%
80%
100%Europe
Market Data
Installation Rates of Fuel Injection Systems*
Source: Continental estimates
*Based on production of diesel and gasoline engines for passenger cars & light vehicles
Gasoline direct injection Gasoline port fuel injection Diesel injection
2008 2009 2010 2011 2012 2013 2014 2015
China
North America
0%
20%
40%
60%
80%
100%
2008 2009 2010 2011 2012 2013 2014 2015
Japan
44
Market Data Increasing Installation Rates of Double Clutch Transmission*
Source: Continental estimates
0%
20%
40%
60%
80%
100%
0%
20%
40%
60%
80%
100%
2008 2009 2010 2011 2012 2013 2014 2015 2008 2009 2010 2011 2012 2013 2014 2015
Europe North America
Japan China
Double Clutch Transmission
Automated Manual Transmission
Continous Variable Transmission
Automatic Transmission
Manual Transmission
* Based on production of gearboxes for passenger cars and light vehicles

Fact Book 2010 |
© Continental AG
23
45
0%
10%
20%
30%
40%
2008 2009 2010 2011 2012 2013 2014 2015
Market Data
Increasing Installation Rates of Embedded Telematics*
Source: Continental estimates
*Based on sales (units)
JapanEurope North America China
46
Market Data
Increasing Installation Rates of Keyless Entry Systems*
Source: Strategy Analytics
*Based on sales (units)
0%
20%
40%
60%
80%
100%Europe North America
0%
20%
40%
60%
80%
2008 2009 2010 2011 2012 2013 2014 2015
Japan
2008 2009 2010 2011 2012 2013 2014 2015
China
Active keyless entry systems Passive keyless entry systems

Fact Book 2010 |
© Continental AG
24
47
Market Data
Increasing Installation Rates of Multimedia Systems*
Source: Continental estimates
* Navigation stand-alone system and navigation systems with enriched multimedia functions
Radio Multimedia
0%
20%
40%
60%
80%
100%Europe
0%
20%
40%
60%
80%
100%
2008 2009 2010 2011 2012 2013 2014 2015
Japan
North America
2008 2009 2010 2011 2012 2013 2014 2015
China
48
Source: Continental estimates
*Contains: adaptive cruise control, collision mitigation, lane departure warning, blind spot detection, intelligent lighting, night vision, traffic sign recognition
Market DataIncreasing Installation Rates of Advanced Driver Assistance Systems*
0%
5%
10%
15%
20%
25%
2008 2009 2010 2011 2012 2013 2014 2015
Europe NAFTA Japan

Fact Book 2010 |
© Continental AG
25
49
Market Data Production of Light Vehicles 2009 - 2012
Source: CSM
* Estimates for passenger cars and light trucks < 6 tons (including vans)
2009 2010* 2011* 2012*
Americas 12.3 16.0 17.3 18.5
NAFTA 8.6 11.9 12.9 13.9
South America 3.7 4.1 4.3 4.6
Europe 16.3 18.6 18.7 19.6
Western Europe 11.8 13.0 13.0 13.4
Eastern Europe 4.5 5.6 5.7 6.3
Asia 27.8 35.1 37.3 40.6
Africa & Middle East 1.8 2.1 2.2 2.4
Total 58.2 71.8 75.5 81.2
(in million units)
50
Source: Global Insight
* Estimates for trucks > 6 tons
Market Data
Production of Heavy Vehicles 2009 - 2012
2009 2010* 2011* 2012*
Americas 394 501 576 713
NAFTA 217 254 328 446
South America 177 247 248 267
Europe 270 395 550 707
Western Europe 205 283 402 514
Eastern Europe 65 112 148 193
Asia 1,554 2,342 2,332 2,485
Total 2,267 3,238 3,459 3,905
(in thousand units)

Fact Book 2010 |
© Continental AG
26
51
Market Data
World Passenger Light Vehicle Tire Sales Forecast 2009 - 2012
Source: LMC World Tyre Forecast Service 2010
* Estimates for OE and replacement
(in million units) 2009 2010* 2011* 2012*
Americas 350 380 405 429
NAFTA 283 306 326 346
South America 67 73 78 83
Europe 341 365 377 394
Western Europe 259 274 280 287
Central Europe 35 36 36 40
Eastern Europe 46 55 61 67
Asia 358 410 451 501
Oceania 20 21 22 23
Africa 32 34 36 38
Middle East & Turkey 62 69 75 81
Total 1,163 1,279 1,366 1,466
52
Source: LMC World Tyre Forecast Service 2010
* Estimates for OE and replacement
Market DataMedium and Heavy Truck Tire Sales 2009 - 2012
2009 2010* 2011* 2012*
Americas 31 34 38 40
NAFTA 19 21 24 25
South America 12 13 14 15
Europe 19 22 25 28
Western Europe 9 11 12 14
Central Europe 2 2 2 3
Eastern Europe 7 9 10 11
Asia 74 82 87 92
Oceania 2 2 2 2
Africa 5 6 6 7
Middle East & Turkey 10 11 12 12
Total 140 157 169 182
(in million units)

Fact Book 2010 |
© Continental AG
27
53
Source: LMC World Tyre Forecast Service 2010
* Estimates
Market Data
Replacement Passenger, Light Truck and 4x4 Tires 2009 - 2012
2009 2010* 2011* 2012*
Americas 292 307 321 335
NAFTA 243 255 266 276
South America 48 52 55 58
Europe 262 280 293 306
Western Europe 200 212 219 226
Eastern/Central Europe 62 68 74 80
Asia 215 239 268 299
Oceania 18 19 20 21
Africa 30 31 32 34
Middle East & Turkey 50 56 61 66
Total 866 933 994 1,060
(in million units)
54
Market Data
Replacement Truck Tires 2009 - 2012
Source: LMC World Tyre Forecast Service 2010 and Continental estimates
* Estimates
2009 2010* 2011* 2012*
Americas 27 30 31 33
NAFTA 16 18 19 20
South America 11 12 13 14
Europe 15 18 19 21
Western Europe 7 8 9 9
Eastern/Central Europe 8 10 11 12
Asia 60 66 71 75
Oceania 2 2 2 2
Africa 5 5 6 6
Middle East & Turkey 9 10 11 12
Total 117 131 140 149
(in million units)

Fact Book 2010 |
© Continental AG
28
55
Topics
A. Continental at a GlanceI.
B. Continental StrategyII.
C. Continental CorporationIII.
D. Market DataIV.
Automotive GroupV.
Rubber GroupVI.
Corporate Social Responsibility at ContinentalVII.
Share & Bond InformationVIII.
GlossaryIX.
56
Automotive Group
Key Figures
(in € million) 2008 2009 2010
Sales 14,900.0 12,042.4 15,917.0
EBITDA 1,428.8 608.9 1,779.1
in % of sales 9.6 5.1 11.2
EBIT -1,205.8 -1,561.6 567.9
in % of sales -8.1 -13.0 3.6
EBIT adjusted 1 203.7 1,068.6
in % of sales 1 1.7 6.7
Operating Assets (avg.) 14,734.3 12,015.9 11,512.0
RoCE (avg.) in % -8.2 -13.0 4.9
R & D expense 1,276.2 1,144.3 1,227.1
in % of sales 8.6 9.5 7.7
Capex 2 1,095.6 538.1 739.8
in % of sales 7.4 4.5 4.6
Depreciation & amortization 3 2,634.6 2,170.5 1,211.2
in % of sales 17.7 18.0 7.6
thereof impairment 4 1,327.5 949.0 35.6
1) EBIT before amortization of intangibles from PPA, consolidation and special effects; sales before changes in the scope of consolidation
2) Capex including software
3) Excluding impairments on financial investments
4) 2008: including goodwill impairment of €1,230.0 mill.
2009: including goodwill impairment of €875.8 mill.

Fact Book 2010 |
© Continental AG
29
57
5,775
4,731
5,518 107 15,917
C&S PT I cons. AutomotiveGroup
organic growth (%)
26.7%
36.2%
22.4% 28.0%
Automotive Group
Sales and Adjusted EBIT* by Division
Automotive Group Sales (in € million) Automotive Group adj. EBIT* (in € million)
-
* Before amortization of intangibles from PPA, consolidation and special effects
630
26
412 0 1,069
C&S PT I cons. AutomotiveGroup
adj. EBIT* margin (%)
10.9%
0.6%
7.5% 6.7%
58
Automotive Group
Sales by Region
Germany29%
Europe (excluding Germany)
26%
Asia21%
NAFTA20%
Other countries
4%
Sales in 2010: €15.9 bn
(2009: 5%)(2009: 18%)
(2009: 28%)
(2009: 31%)
(2009: 18%)

Fact Book 2010 |
© Continental AG
30
59
Topics
A. Continental at a GlanceI.
B. Continental StrategyII.
C. Continental CorporationIII.
D. Market DataIV.
Automotive Group – 1. Chassis & Safety Division V.
Rubber GroupVI.
Corporate Social Responsibility at ContinentalVII.
Share & Bond InformationVIII.
GlossaryIX.
60
Chassis & Safety
Business Unit Structure
Hydraulic electronic
control units (HECU)
ABS
ESC
Software functions
Adaptive cruise control
Regenerative brake
system
Active front steering
Hill start assist,
hill descent control
Deflation detection
system
Hydraulic brake assist
Trailer stability assist
Calipers and discs
Drum brakes
Brake hoses
Boosters
Tandem master cylinders
Electric parking brakes
Pedal modules
Brake pressure regulators
Electric vacuum pump
Steering angle and
torque sensors
Wheel speed sensors
Engine/transmission
speed and position
sensors
Chassis sensors
Acceleration sensor
Height sensor
Pedal angle sensor
Pedal travel sensor
Sensor clusters
Inertial measurement
unit (IMU)
Airbag control units
Crash sensors
Occupant classification
systems (OCS)
Driver assistance
systems
Radar
Lidar
Camera
Chassis electronics
Electronic components
Steering systems
Suspension systems
Washer systems
Electronic Brake Systems Hydraulic Brake Systems Sensorics Passive Safety & ADAS Chassis Components

Fact Book 2010 |
© Continental AG
31
61
India▐ Bangalore▐ Gurgaon
(New Delhi)▐ Manesar
Brazil▐ Salto▐ Varzea Paulista
China▐ Shanghai▐ Changchun▐ Changshu▐ Heihe▐ Lian Yun Gang
Chassis & Safety
Locations Worldwide
Mexico▐ Ayala Morelos (Cuautla)▐ Guadalajara▐ Las Colinas▐ Silao
USA▐ Auburn Hills▐ Brimley▐ Culpeper▐ Henderson▐ Morganton
Malaysia▐ Penang
Japan▐ Asahi▐ Hamakita▐ Hiroshima▐ Monbetsu▐ Yokohama
South Korea▐ Cheongwon▐ Icheon
Philippines▐ Calamba▐ Manila
▐ Korbach
▐ Lindau
▐ Nuremberg
▐ Regensburg
▐ Rheinböllen
▐ Schwalbach
Europe France▐ Boussens
▐ Toulouse
Hungary▐ Budapest
▐ Veszprém
Italy▐ Cairo Montenotte
Belgium▐ Mechelen
Czech Republic▐ Adrspach
▐ Frenstat
▐ Jicin
Portugal▐ Palmela
Romania▐ Iasi
▐ Sibiu
▐ Timişoara
Slovakia▐ Zvolen
Spain▐ Bergara
Sweden▐ Arvidsjaur
UK▐ Ebbw Vale
▐ Production
Germany▐ Alzenau
▐ Bebra
▐ Frankfurt
▐ Gifhorn
▐ Hanover
▐ Ingolstadt
▐ Karben
▐ Joint Ventures < 50%
57 sites for production and R&D in 19 countries. Divisional headquarters in Frankfurt/Main, Germany.
62
Chassis & Safety
Key Figures
(in € million) 2008 2009 2010
Sales 5,134.0 4,373.6 5,775.4
EBITDA 789.9 601.6 891.7
in % of sales 15.4 13.8 15.4
EBIT 303.1 -102.5 569.0
in % of sales 5.9 -2.3 9.9
EBIT adjusted 1 352.8 630.2
in % of sales 1 8.1 10.9
Operating Assets (avg.) 4,494.4 4,034.0 3,997.0
RoCE (avg.) in % 6.7 -2.5 14.2
R & D expense 423.6 380.8 422.3
in % of sales 8.3 8.7 7.3
Capex 2 336.0 159.5 247.1
in % of sales 6.5 3.6 4.3
Depreciation & amortization 3 486.8 704.1 322.7
in % of sales 9.5 16.1 5.6
thereof impairment 4 150.6 370.4 3.8
1) EBIT before amortization of intangibles from PPA, consolidation and special effects; sales before changes in the scope of consolidation
2) Capex including software
3) Excluding impairments on financial investments
4) 2008: including goodwill impairment of €145.2 mill.
2009: including goodwill impairment of €367.0 mill.

Fact Book 2010 |
© Continental AG
32
63
Chassis & Safety
Sales by Region
Germany30%
Europe (excluding Germany)
24%
NAFTA19%
Asia23%
Other countries
4%(2009: 20%)
(2009: 16%)
(2009: 26%)
Sales in 2010: €5.8 bn
(2009: 3%)
(2009: 35%)
64
Chassis & Safety
Market Position for Electronic Brake Systems 2010
Continental33%
Continental25%
Continental26%
Continental36%
Continental42%
Bosch30%
Bosch19%
Bosch49%
Bosch31%
Bosch42%
8%
3%
14%
13%
10%
Advics10%
Advics20%
Advics9%
5%
9%
5%
6%
9%
7%
4%
7%
5%
Others11%
2%
4%
Others6%
0% 20% 40% 60% 80% 100%
World
Asia/Pacific
South America
North America
Europe
TRW Mando Nissin Kogyo Mobis
Source: Continental estimates

Fact Book 2010 |
© Continental AG
33
65
Chassis & Safety
Market Position for Foundation Brake Systems 2010
Continental21%
Continental11%
Continental56%
Continental15%
Continental34%
Bosch9%
5%
Bosch9%
Bosch15%
Bosch12%
TRW25%
TRW12%
TRW32%
TRW20%
TRW45%
Advics10%
Advics17%
Advics12%
Mando6%
Mando10%
Mando6%
9%
12%
16%
Others20%
Others33%
3%
Others16%
Others9%
0% 20% 40% 60% 80% 100%
World
Asia/Pacific
South America
North America
Europe
Akebono
Source: Continental estimates
66
Chassis & Safety
Market Position for Actuation 2010
Continental25%
7%
Continental52%
Continental30%
Continental45%
Bosch20%
Bosch20%
Bosch22%
Bosch22%
Bosch20%
TRW13%
TRW5%
TRW24%
TRW14%
TRW22%
Advics10%
Advics16%
Advics11%
6%
13%
5%
5%
9%
4%
3%
5%
7%
3%
7%
Others15%
Others18%
2%
Others7%
Others13%
0% 20% 40% 60% 80% 100%
World
Asia/Pacific
South America
North America
Europe
Mando Akebono KDAC SABS
Source: Continental estimates

Fact Book 2010 |
© Continental AG
34
67
Chassis & Safety
Market Position for Airbag Electronics 2010
Continental27%
Continental21%
Continental43%
Continental22%
Continental38%
Bosch19%
Bosch16%
4%
Bosch12%
Bosch28%
TRW15%
TRW11%
TRW16%
TRW24%
TRW14%
Autoliv16%
Autoliv10%
Autoliv10%
Autoliv24%
Autoliv17%
12%
26%
6%
7%
8%
3%
7%
14%
Others8%
Others9%
Others6%
4%
3%
0% 20% 40% 60% 80% 100%
World
Asia/Pacific
South America
North America
Europe
Denso Delphi Keihin
Source: Continental estimates
68
Continental20%
6%
Continental10%
Continental39%
10%
Bosch23%
7%
7%
12%
6%
Denso18%
Denso51%
Denso9%
7%
4%
14%
6%
Gentex6%
Gentex8%
Gentex10%
5%
3%
9%
6%
17%
4%
4%
12%
3%
6%
23%
3%
Others11%
Others17%
4%
0% 20% 40% 60% 80% 100%
World
Asia/Pacific
North America
Europe
Autoliv Delphi Hella Hitachi Honda Elesys Valeo
Chassis & Safety
Market Position for Advanced Driver Assistance Systems 2010
Source: Continental estimates

Fact Book 2010 |
© Continental AG
35
69
ABS/TCS
ESC
0
5
10
15
20
25
Source: Continental estimates
Chassis & Safety Growing Sales Volume for Electronic Brake Systems
Europe
BMW 1 Series / 3 Series
Landrover Freelander
Mercedes C Class / S Class
Ford Focus / Fiesta
Opel Astra
VW Golf
Peugeot 207
Seat Altea
Volvo S80 / V70
NAFTA
Dodge Caravan / Voyager
Ford Explorer / Escape
Jeep Wrangler
GM Cruze / Equinox
Nissan Frontier
Toyota Tundra
VW Jetta / New Beetle
BMW X3
Asia
Daewoo Windstorm
Honda Accord
Mazda Axela
Suzuki Wagon R
Mitsubishi Lancer / Outlander
Subaru Legacy
Model Selection
(in million units)
70
Topics
A. Continental at a GlanceI.
B. Continental StrategyII.
C. Continental CorporationIII.
D. Market DataIV.
Automotive Group – 2. Powertrain DivisionV.
Rubber GroupVI.
Corporate Social Responsibility at ContinentalVII.
Share & Bond InformationVIII.
GlossaryIX.

Fact Book 2010 |
© Continental AG
36
71
Powertrain
Business Unit Structure
Engine management
systems and fuel
components for
Diesel piezo common
rail injection systems
Gasoline piezo direct
injection
Gasoline solenoid
direct injection
Gasoline port injection
Liquefied petroleum
gas (LPG) and
compressed natural
gas (CNG)
Aftertreatment
Engine management
systems /aftertreatment
products for commercial
vehicle applications
Turbocharger
Engine Systems Transmission Hybrid Electric Vehicle Sensors & Actuators Fuel Supply
Control units for
Automatic
transmission
Double clutch
transmission
Automated manual
transmission
Continuously variable
transmission
Control units for four-
and all wheel drive
applications
Transfer cases
Differentials
Limited slip coupling
Clutch systems
Actuators for powertrain
applications
Components and
modules for emission
management
Sensors for powertrain
applications
NOx, MAF,
transmission sensor
modules, position
sensors
Pressure,
temperature, knock,
cylinder pressure
Flexible fuel, oil
quality, oil level
Door handle sensors
Systems/ components
for hybrid and electric
vehicle applications
Power electronics
Electric motors
Battery systems
Energy management
Power net systems
Fuel supply units
Fuel level sensors
Fuel pumps
Control electronics for
fuel pumps
72
India▐ Bangalore▐ Pune▐ Manesar
Brazil▐ Guarulhos▐ Salto
China▐ Shanghai▐ Changchun▐ Tianjin▐ Wuhu
Powertrain
Locations Worldwide
Mexico▐ Ayala Morelos (Cuautla)▐ Guadalajara▐ Juarez
USA▐ Auburn Hills▐ Dearborn▐ Deer Park▐ Newport News▐ Seguin
Malaysia▐ Penang
Japan▐ Yokohama
South Korea▐ Cheongwon▐ Icheon
Australia▐ Bundoora
▐ Limbach-Oberfrohna/Stollberg
▐ Lohmar
▐ Nuremberg
▐ Regensburg
▐ Roding
▐ Schwalbach
Europe France▐ Boussens
▐ Foix
▐ Toulouse
Hungary▐ Budapest
Italy▐ Pisa
Czech Republic▐ Adrspach
▐ Brandys
▐ Frenstat
▐ Trutnov
Romania▐ Iasi
▐ Sibiu
▐ Timişoara
▐ Production, R&D
Germany▐ Bebra
▐ Berlin
▐ Dortmund
▐ Gifhorn
▐ Grünstadt
▐ Karben
▐ Joint Ventures < 50%
Philippines▐ Calamba
Canada▐ Chatham
Thailand▐ Amata City
Russia▐ Kaluga
60 sites for production and R&D in 22 countries. Divisional headquarters in Regensburg, Germany.

Fact Book 2010 |
© Continental AG
37
73
Powertrain
Key Figures
(in € million) 2008 2009 2010
Sales 4,040.0 3,399.2 4,730.8
EBITDA 81.6 -13.3 268.2
in % of sales 2.0 -0.4 5.7
EBIT -1,046.2 -943.2 -198.1
in % of sales -25.9 -27.7 -4.2
EBIT adjusted 1 -206.3 26.0
in % of sales 1 -6.2 0.6
Operating Assets (avg.) 4,610.8 3,401.8 3,112.2
RoCE (avg.) in % -22.7 -27.7 -6.4
R & D expense 420.1 328.8 396.9
in % of sales 10.4 9.7 8.4
Capex 2 494.4 247.2 301.5
in % of sales 12.2 7.3 6.4
Depreciation & amortization 3 1,127.8 929.9 466.3
in % of sales 27.9 27.4 9.9
thereof impairment 4 653.3 488.0 36.6
1) EBIT before amortization of intangibles from PPA, consolidation and special effects; sales before changes in the scope of consolidation
2) Capex including software
3) Excluding impairments on financial investments
4) 2008: including goodwill impairment of €609.6 mill.
2009: including goodwill impairment of €447.4 mill.
74
Germany26%
Europe (excluding Germany)
31%
NAFTA20%
Asia22%
Other countries
1%
(2009: 30%)
Powertrain
Sales by Region
Sales in 2010: €4.7 bn
(2009: 1%)
(2009: 28%)
(2009: 20%)
(2009: 21%)

Fact Book 2010 |
© Continental AG
38
75Source: Continental estimates
Powertrain
Market Position for Diesel Injection Systems* 2010
* For passenger cars & light trucks ** Japan, South Korea, China, India, Thailand
Continental16%
2%
Continental20%
Bosch55%
Bosch44%
Bosch58%
12%
33%
5%
Delphi14%
Delphi18%
Delphi14%
3%
3%
3%
0% 20% 40% 60% 80% 100%
World
Asia/Pacific**
Europe
Denso Others
76
Powertrain
Market Position for Gasoline Injection Systems* 2010
Source: Continental estimates * For passenger cars & light trucks ** Japan, South Korea, China, India, Thailand
Continental22%
Continental13%
4%
Continental27%
Continental33%
Bosch29%
Bosch26%
Bosch23%
Bosch16%
Bosch42%
17%
29%
18%
3%
5%
5%
20%
10%
6%
7%
14%
Hitachi10%
Hitachi9%
Hitachi9%
Hitachi9%
4%
34%
7%
Others7%
Others11%
Others19%
6%
Others6%
0% 20% 40% 60% 80% 100%
World
Asia/Pacific**
South America
North America
Europe
Denso Delphi Keihin Magneti Marelli

Fact Book 2010 |
© Continental AG
39
77
Powertrain
Market Position for Transmission Control Units* 2010
Source: Continental estimates * For passenger cars & light trucks ** Japan, South Korea, China, India
Continental45%
Continental29%
Continental35%
Continental70%
Bosch19%
Bosch10%
Bosch34%
Bosch16%
4%
9%
3%
5%
Delphi16%
6%
11%
4%
8%
19%
3%
11%
17%
5%
11%
2%
5%
3%
0% 20% 40% 60% 80% 100%
World
Asia/Pacific**
North America
Europe
Denso Delphi Keihin Hitachi Aisin Visteon Others
78
Topics
A. Continental at a GlanceI.
B. Continental StrategyII.
C. Continental CorporationIII.
D. Market DataIV.
Automotive Group – 3. Interior Division V.
Rubber GroupVI.
Corporate Social Responsibility at ContinentalVII.
Share & Bond InformationVIII.
GlossaryIX.

Fact Book 2010 |
© Continental AG
40
79
Interior
Business Unit Structure
Instrument clusters
Secondary displays
Head-up displays
Climate controls
Faceplates
Central input devices
Roof controls
Integrated centerstacks
Cockpit modules
Instrumentation & Driver HMI Infotainment & Connectivity Body & SecurityCommercial Vehicles & Aftermarket
Radios
Connected radio & entry
navigation
Multimedia systems
Embedded telematics
Device connectivity
Software & special solutions
Body control units
Exterior light control units
Power closures
Seat comfort systems
Battery & energy management
Access control systems
Tire information systems
Intelligent antenna modules
Tachographs, telematics &
services
Visual human machine
interface
Haptical human machine
interface
Connectivity solutions
Powertrain control
Transmission electronics
Chassis electronics
Body electronics
Wear parts, spare parts &
services for the independent
aftermarket
Original equipment services
80
Interior
Locations Worldwide
India▐ Bangalore▐ Chennai▐ Haryana▐ Manesar▐ Pune
Brazil▐ Barueri▐ Campinas ▐ Gravatai▐ Guarulhos
China▐ Hong Kong▐ Jinan▐ Shanghai▐ Changchun▐ Tianjin▐ Wuhu
Mexico▐ Ayala Morelos (Cuautla)
▐ Guadalajara▐ Nogales
USA▐ Allentown▐ Auburn Hills▐ Cedar Rapids▐ Deer Park▐ Elma▐ Huntsville▐ Seguin▐ Troy
Malaysia▐ Penang▐ Sha Alam
Japan▐ Yokohama
South Korea▐ Cheongwon-gun▐ Icheon-city▐ Seoul
Philippines▐ Manila
▐ Markdorf
▐ Nuremberg
▐ Regensburg
▐ Schwalbach am Taunus
▐ Villingen-Schwenningen
▐ Wetzlar
Europe France▐ Foix
▐ Guyancourt
▐ Hambach
▐ Rambouillet
▐ Toulouse
Hungary▐ Budapest
Austria▐ Vienna
Czech Rep.▐ Brandys
▐ Frenstat
Italy▐ Novate
Milanese
Netherlands▐ Eindhoven
Romania▐ Iasi
▐ Sibiu
▐ Timişoara
Spain▐ Alcobendas
▐ Rubi
Sweden▐ Arvidsjaur
Switzerland▐ Rüthi
UK▐ Birmingham
Germany▐ Babenhausen
▐ Eschborn
▐ Frankfurt a. M.
▐ Ingolstadt
▐ Karben
Costa Rica▐ Alajuela
▐ Manaus▐ Resende▐ Sao Bernardo
do Compo
Tunesia▐ Bizerte
▐ Singapore
Australia▐ Bundoora▐ Campbellfield
Thailand▐ Bangkok
Russia▐ Chistopol▐ Kaluga▐ Moscow
60 sites for production and R&D in 23 countries. Divisional headquarters in Regensburg, Germany.

Fact Book 2010 |
© Continental AG
41
81
Interior
Key Figures
(in € million) 2008 2009 2010
Sales 5,856.7 4,362.7 5,518.1
EBITDA 557.3 20.4 619.1
in % of sales 9.5 0.5 11.2
EBIT -462.6 -516.0 197.0
in % of sales -7.9 -11.8 3.6
EBIT adjusted 1 57.0 412.4
in % of sales 1 1.3 7.5
Operating Assets (avg.) 5,629.1 4,580.1 4,402.8
RoCE (avg.) in % -8.2 -11.3 4.5
R & D expense 432.5 434.7 407.9
in % of sales 7.4 10.0 7.4
Capex 2 265.2 131.3 191.3
in % of sales 4.5 3.0 3.5
Depreciation & amortization 3 1,019.9 536.4 422.1
in % of sales 17.4 12.3 7.6
thereof impairment 4 523.6 90.6 -4.8
1) EBIT before amortization of intangibles from PPA, consolidation and special effects; sales before changes in the scope of consolidation
2) Capex including software
3) Excluding impairments on financial investments
4) 2008: including goodwill impairment of €475.2 mill.
2009: including goodwill impairment of €61.4 mill.
82
Interior
Sales by Region
Sales in 2010: €5.5 bn
Germany31%
Europe (excluding Germany)
24%
NAFTA19%
Asia18%
Other countries
8%
(2009: 31%)
(2009: 7%) (2009: 14%)
(2009: 28%)
(2009: 20%)

Fact Book 2010 |
© Continental AG
42
83
Interior
Market Position for Body & Security 2010
Source: Continental estimates
Continental21%
Continental14%
Continental17%
Continental22%
Continental27%
5%
3%
Bosch7%
Bosch5%
Bosch7%
10%
18%
4%
9%
3%
8%
5%
18%
9%
9%
6%
4%
12%
3%
10%
6%
5%
8%
7%
3%
5%
6%
4%
8%
4%
3%
6%
4%
3%
6%
3%
3%
5%
Others28%
Others31%
Others32%
Others33%
Others31%
0% 20% 40% 60% 80% 100%
World
Asia/Pacific
South America
North America
Europe
Denso Delphi Hella Lear Valeo Omron Calsonic Kansei Sumitomo HACO
84
Interior
Market Position for Instrumentation & Driver HMI* 2010
Source: Continental estimates * Excluding cockpit modules
Continental19%
Continental13%
Continental29%
Continental14%
Continental25%
Denso12%
Denso19%
Denso13%
Denso16%
3%
JCI6%
JCI4%
JCI5%
JCI10%
3%
8%
3%
4%
4%
5%
16%
9%
6%
9%
3%
10%
3%
4%
4%
4%
6%
7%
5%
4%
5%
3%
Others41%
Others50%
Others25%
Others36%
Others35%
0% 20% 40% 60% 80% 100%
World
Asia/Pacific
South America
North America
Europe
Delphi Calsonic Kansei Magneti Marelli Nippon Seiki Valeo Visteon Yazaki

Fact Book 2010 |
© Continental AG
43
85
Interior
Market Position for Infotainment & Connectivity 2010
Source: Continental estimates
9%
2%
Continental16%
Continental12%
Continental17%
6%
Bosch9%
Bosch16%
7%
9%
9%
4%
4%
6%
9%
3%
8%
3%
6%
13%
10%
14%
6%
11%
5%
10%
3%
3%
23%
7%
5%
13%
6%
7%
11%
9%
Others34%
Others43%
Others55%
Others34%
Others23%
0% 20% 40% 60% 80% 100%
World
Asia/Pacific
South America
North America
Europe
Denso Delphi Magneti Marelli Aisin Panasonic Harman Alpine Clarion
86Source: Continental estimates
Interior
Market Position for Commercial Vehicle* 2010
* Market shares for commercial vehicle business as described in BU structure excluding automotive aftermarket
Continental37%
Continental16%
Continental58%
Continental25%
Continental34%
4%
Bosch9%
10%
6%
Stoneridge26%
10%
4%
9%
4%
9%
4%
Yazaki7%
Yazaki25%
9%
3%
Hella9%
9%
Phoenix9%
3% 4% 3%
Others31%
Others49%
Others36%
Others27%
Others11%
0% 20% 40% 60% 80% 100%
World
Asia/Pacific
South America
North America
Europe
Bosch Stoneridge Wabco Actia Ametek Yazaki Hella Phoenix Calsonic Kansei Harbin DETC

Fact Book 2010 |
© Continental AG
44
87
Topics
A. Continental at a GlanceI.
B. Continental StrategyII.
C. Continental CorporationIII.
D. Market DataIV.
Automotive Group V.
Rubber GroupVI.
Corporate Social Responsibility at ContinentalVII.
Share & Bond InformationVIII.
GlossaryIX.
88
(€ million) 2008 2009 2010
Sales 9,353.9 8,068.3 10,152.5
EBITDA 1,415.9 1,114.5 1,851.5
in % of sales 15.1 13.8 18.2
EBIT 984.9 655.7 1,413.1
in % of sales 10.5 8.1 13.9
EBIT adjusted 1 1,038.5 1,513.4
in % of sales 1 12.9 15.0
Operating Assets (avg.) 4,369.5 3,989.8 4,112.1
RoCE (avg.) in % 22.5 16.4 34.4
R & D expense 222.0 212.0 223.3
in % of sales 2.4 2.6 2.2
Capex 2 499.1 321.7 555.8
in % of sales 5.3 4.0 5.5
Depreciation & amortization 3 431.0 458.8 438.4
in % of sales 4.6 5.7 4.3
thereof impairment 13.9 44.0 22.1
1) EBIT before amortization of intangibles from PPA, consolidation and special effects; sales before changes in the scope of consolidation
2) Capex including software
3) Excluding impairments on financial investments
Rubber Group
Key Figures

Fact Book 2010 |
© Continental AG
45
89
3,095
5,821
1,428
191
10,153
CT PLT CVT cons. Rubber Group
organic growth (%)
26.4%
18.2%
25.8%20.7%-
397
1,031 86
0
1,513
CT PLT CVT cons. Rubber Group
adj. EBIT* margin (%)
12.9%
17.9% 6.1%15.0%
Rubber Group
Sales and Adjusted EBIT* by Division
Rubber Group Sales (in € million) Rubber Group adj. EBIT* (in € million)
* Before amortization of intangibles from PPA, consolidation and special effects
90
Rubber Group Sales by Region
Germany25%
Europe (excluding Germany)
43%
NAFTA17%
Asia8%
Other countries
7%
Sales in 2010: €10.2 bn
(2009: 26%)
(2009: 5%)
(2009: 8%)
(2009: 17%)
(2009: 44%)

Fact Book 2010 |
© Continental AG
46
91
Topics
A. Continental at a GlanceI.
B. Continental StrategyII.
C. Continental CorporationIII.
D. Market DataIV.
Automotive Group V.
Rubber Group – 1. Passenger and Light Truck Tires Division VI.
Corporate Social Responsibility at ContinentalVII.
Share & Bond InformationVIII.
GlossaryIX.
92
* Except NAFTA Region, Colombia, Peru
** Trademark rights for Malaysia, Singapore and Brunei
Passenger and Light Truck TiresBusiness Unit Structure
Tires for :
Compact, medium-size &
full-size cars
4x4 and SUVs
Vans, light trucks & RVs
Extended mobility systems:
SSR
CSR
ContiComfortKit
ContiMobilityKit
ContiSeal
NVH engineering services
Brands:
Tires for:
Compact, medium-size
and full-size cars
4x4 and SUVs
Vans, light trucks & RVs
High- and ultra-high-
performance tires
Brands:
Tires for:
Compact, medium-size
and full-size cars
4x4 and SUVs
Vans, light trucks & RVs
High- and ultra-high-
performance tires
Brands:
Tires for:
Compact, medium-size
and full-size cars
4x4 and SUVs
Vans, light trucks & RVs
High- and ultra-high-
performance tires
Brands:
Bicycle tires
High-performance
bicycle racing tires
Motorcycle and scooter
tires
High-performance
motorbike tires
Brands:
Original EquipmentReplacement Business
EMEA
Replacement Business
The Americas
Replacement Business
Asia-PacificTwo-Wheel Tires
*
**
**

Fact Book 2010 |
© Continental AG
47
93
(in € million) 2008 2009 2010
Sales 5,100.3 4,696.4 5,820.8
EBITDA 873.5 793.1 1,241.0
in % of sales 17.1 16.9 21.3
EBIT 626.4 536.4 993.3
in % of sales 12.3 11.4 17.1
EBIT adjusted 1 774.4 1,030.5
in % of sales 1 16.5 17.9
Operating Assets (avg.) 2,488.1 2,348.4 2,422.9
RoCE (avg.) in % 25.2 22.8 41.0
R & D expense 119.5 113.5 120.8
in % of sales 2.3 2.4 2.1
Capex 2 292.7 198.3 404.3
in % of sales 5.7 4.2 6.9
Depreciation & amortization 3 247.1 256.7 247.7
in % of sales 4.8 5.5 4.3
thereof impairment 13.1 24.6 7.2
1) EBIT before amortization of intangibles from PPA, consolidation and special effects; sales before changes in the scope of consolidation
2) Capex including software
3) Excluding impairments on financial investments
Passenger and Light Truck Tires
Key Figures
94
Passenger and Light Truck Tires Sales by Region
Germany21%
Europe (excluding Germany)
49%
NAFTA19%
Asia5%
Other countries
6%
Sales in 2010: €5.8 bn
(2009: 21%)
(2009: 52%)
(2009: 5%)
(2009: 4%)(2009: 18%)

Fact Book 2010 |
© Continental AG
48
95
6%
Continental21%
Michelin19%
Michelin19%
Goodyear/Sumitomo
20%
Goodyear/Sumitomo
18%
Bridgestone/Firestone
19%
Bridgestone/Firestone
12%
Pirelli7%
Cooper9%
Others27%
Others23%
0% 20% 40% 60% 80% 100%
North America
Europe
Source: Continental estimates
* OE & replacement
Passenger and Light Truck TiresMarket Share for Passenger and Light Truck Tires* 2010
96
* Until 2004 consolidated in CVT Division
** Since July 2009
(million units)
Passenger and Light Truck Tires
Worldwide Passenger and Light Truck Tire Production 2010
Mount Vernon
San Luis Potosí
Cuenca**
Camaçari
Port Elizabeth
Alor Star /
Petaling Jaya*
9
5
15
3
3
(US)
(MX)
(EC)
(BR)
(ZA)
(MY)

Fact Book 2010 |
© Continental AG
49
97
Lousado
15
Sarreguemines
10
Aachen
9
Korbach
10
Passenger and Light Truck Tires
European Passenger & Light Truck Tire Production 2010
Otrokovice
21
Puchov
8
Timişoara
14
(million units)
(PT)
(DE)
(FR)
(RO)
(CZ)
(SK)
98
11%
21%
26%
28%
34%
36%
42%
60%
66%
94%
100%
100%
0% 20% 40% 60% 80% 100% 120%
Malaysia
Romania
Ecuador
Brazil
South Africa
Slovakia
Czech Republic
Mexico
Portugal
USA
France
Germany
Passenger and Light Truck Tires
Cost of Labor at Continental Manufacturing Sites*
* Based on average FX rates 2010

Fact Book 2010 |
© Continental AG
50
99
Passenger and Light Truck Tires
Unit Sales 2005 - 2010
* From 2006 - 2007 Asia included in Europe
** North America; since 2007 including Latin America
80 83 84 8475
86
26 24 24 23
20
25
4
4
4
2005 2006 2007 2008 2009 2010
(in million units)
Europe (incl. ROW)* The Americas** Asia/Pacific
106 107 108111
99
114
100
Passenger and Light Truck TiresProduct Mix Improvement
Winter Tires* worldwide High Performance Summer Tires Europe*
* OE & replacement (excl. All-Season Tires)
3132
34
36
32
39
13.1%
3.5%5.6% 6.2%
-11.4%
21.3%
2005 2006 2007 2008 2009 2010
(in million units)
1819
18 19 192111.1%
8.2%
-4.7%
4.1%
1.2%
6.8%
2005 2006 2007 2008 2009 2010
(in million units)

Fact Book 2010 |
© Continental AG
51
101
Topics
A. Continental at a GlanceI.
B. Continental StrategyII.
C. Continental CorporationIII.
D. Market DataIV.
Automotive Group V.
Rubber Group – 2. Commercial Vehicle Tires Division VI.
Corporate Social Responsibility at ContinentalVII.
Share & Bond InformationVIII.
GlossaryIX.
102
Commercial Vehicle TiresBusiness Unit Structure
Tires and services for customer
segments:
Goods
People
Construction
Brands:
Truck Tires EMEA Truck Tires The Americas Truck Tires Asia-Pacific Industrial Tires
Tires and services for customer
segments:
Goods
People
Construction
Brands:
Tires and services for the
applications:
Material handling
Multi-purpose
Earthmover
Brands:
Tires and services for customer
segments:
Goods
People
Construction
Brands:

Fact Book 2010 |
© Continental AG
52
103
Commercial Vehicle TiresKey Figures
(in € million) 2008 2009 2010
Sales 1,404.2 1,065.6 1,427.8
EBITDA 112.4 47.5 142.2
in % of sales 8.0 4.5 10.0
EBIT 29.5 -50.1 50.1
in % of sales 2.1 -4.7 3.5
EBIT adjusted 1 22.0 85.9
in % of sales 1 2.1 6.1
Operating Assets (avg.) 776.2 634.7 628.4
RoCE (avg.) in % 3.8 -7.9 8.0
R & D expense 43.4 40.5 41.8
in % of sales 3.1 3.8 2.9
Capex 2 95.6 40.5 51.2
in % of sales 6.8 3.8 3.6
Depreciation & amortization 3 82.9 97.6 92.1
in % of sales 5.9 9.2 6.5
thereof impairment 0.4 15.7 12.8
1) EBIT before amortization of intangibles from PPA, consolidation and special effects; sales before changes in the scope of consolidation
2) Capex including software
3) Excluding impairments on financial investments
104
Commercial Vehicle TiresSales by Region
Sales in 2010: €1.4 bn
Germany15%
Europe (excluding Germany)
34%
NAFTA30%
Asia7%
Other countries
14%
(2009: 15%)
(2009: 10%)
(2009: 7%)
(2009: 31%)
(2009: 37%)

Fact Book 2010 |
© Continental AG
53
105
8%
Continental15%
Michelin22%
Michelin33%
Goodyear/Sumitomo
21%
Goodyear/Sumitomo
20%
Bridgestone/Firestone
25%
Bridgestone/Firestone
21%6% 4%
5% 19%
1%
0% 20% 40% 60% 80% 100%
North America
Europe
Pirelli Hankook Yokohama Others
Source: Continental estimates
* OE & replacement
Commercial Vehicle TiresMarket Share for Truck Tires* 2010
106
Commercial Vehicle Tires
Continental Product Segments 2010
4%
10%
2%
3%
8%
73%
0%
6%
2%
0%
29%
63%
0% 10% 20% 30% 40% 50% 60% 70% 80% 90% 100%
Winter
Construction
Urban Traffic
Off-Road
Long Distance
Regional Traffic
Americas Europe
Europe
Regional Traffic
70%
Winter
3%
Long Distance
12%
Off-Road
2%
Urban Traffic
3%
Construction
10%
Europe
Regional Traffic
70%
Winter
3%
Long Distance
12%
Off-Road
2%
Urban Traffic
3%
Construction
10%
Europe
Regional Traffic
70%
Winter
3%
Long Distance
12%
Off-Road
2%
Urban Traffic
3%
Construction
10%
Europe
Regional Traffic
70%
Winter
3%
Long Distance
12%
Off-Road
2%
Urban Traffic
3%
Construction
10%
Europe
Regional Traffic
70%
Winter
3%
Long Distance
12%
Off-Road
2%
Urban Traffic
3%
Construction
10%
Europe
Regional Traffic
70%
Winter
3%
Long Distance
12%
Off-Road
2%
Urban Traffic
3%
Construction
10%

Fact Book 2010 |
© Continental AG
54
107
* Including shipments to JV partners
(million units)
Commercial Vehicle Tires
Worldwide Truck Tire Production 2010
Mount Vernon*
Cuenca** Camaçari
Port Elizabeth
Petaling Jaya
0.1
0.2
Otrokovice Puchov
(US)
(EC) (BR)
(ZA)
(CZ)(SK)
(MY)0.3
2.70.6
2.2
0.1
108
15%
26%
28%
34%
41%
42%
94%
100%
0% 20% 40% 60% 80% 100% 120%
Malaysia
Ecuador
Brazil
South Africa
Slovakia
Czech Republic
USA
Germany
Commercial Vehicle Tires
Cost of Labor at Continental Manufacturing Sites*
* Based on average FX rates 2010

Fact Book 2010 |
© Continental AG
55
109
3.7 4.04.3
3.7
2.32.8
2.93.0
2.9
2.8
2.6
3.2
0.2
0.2
0.2
2005 2006 2007 2008 2009 2010
Europe (incl. ROW)* The Americas** Asia
* From 2005 - 2007 Asia included in Europe
** North America; since 2007 including Latin America
Commercial Vehicle TiresUnit Sales 2005 - 2010
7.0 7.2
6.7
5.1
6.2
6.6
110
Topics
A. Continental at a GlanceI.
B. Continental StrategyII.
C. Continental CorporationIII.
D. Market DataIV.
Automotive Group V.
Rubber Group – 3. ContiTech Division VI.
Corporate Social Responsibility at ContinentalVII.
Share & Bond InformationVIII.
GlossaryIX.

Fact Book 2010 |
© Continental AG
56
111
ContiTech
Business Unit Structure
Air Spring Systems
Air suspensions systems for
buses, trucks and rail vehicle
technology
Air actuators for pneumatics
and air springs for vibration
isolation
Compensators
Benecke- Kaliko Group
Foils and artificial leather for
automotive interior trim
Conveyor Belt Group
Steel cord / fabric belts
Special-purpose belts
Conveyor belts
Components
Service
material
Power Transmission Group
Belts for automotive and
industrial applications:
V-belts, multiple V-ribbed
belts, timing belts, flat
belts, belt drive systems, PU
belts
Vibration Control
Rubber-to-metal bonded
products:
Hydromounts, mounting
systems and modules,
precision molded parts,
blow molded parts,
plastic parts
Fluid Technology
Hoses / hose lines:
Exhaust systems, powertrain,
air conditioning, fuel systems,
heating/ cooling systems,
steering/ chassis,
turbocharger,
industrial
applications
Elastomer Coatings
Coated fabrics, printing
blankets, diaphragms /
diaphragm materials,
gasholder diaphragms,
collapsible fuel tanks,
concertina walls
Compounding
Natural rubber, synthetic
rubber, silicon
112
China▐ Changchun▐ Changshu▐ Changzhi▐ Ninghai▐ Shanghai▐ Tianjin▐ Zhangjiagang
ContiTech
Locations Worldwide
India▐ Calcutta▐ New DelhiBrazil
▐ Ponta Grossa▐ Varzea Paulista
Mexico▐ Mexico City▐ San Luis Potosí
USA▐ Houston▐ Somersworth
Japan▐ Kurashiki
South Korea▐ Busan▐ Cheonan▐ Jeonju
Europe Hungary▐ Makó
▐ Nyiregyhaza
▐ Szeged
▐ Vác
Greece▐ Vólos
France.
▐ Lyon
▐ Production, R&D
Germany▐ Aachen
▐ Bad Blankenburg
▐ Berlin
▐ Dannenberg
▐ Eislingen
▐ Friedberg
▐ Hanover
▐ Hamburg
▐ Hann. Münden
▐ Cooperation, Joint Ventures < 50%
Chile▐ Santiago de Chile
▐ Hedemünden
▐ Herzogenaurach
▐ Karben
▐ Korbach
▐ Moers
▐ Northeim
▐ Oedelsheim
▐ Oppenweiler
▐ Salzgitter
▐ Waltershausen
Russia▐ Moscow
Romania▐ Carei
▐ Nadab
▐ Timişoara
Serbia▐ Veliki Crljeni
Slovakia▐ Dolné Vestenice
▐ Partizanske
▐ Puchov
Spain▐ Madrid
Sweden▐ Kista
Turkey▐ Bursa
UK▐ Ashington
▐ Grimsby
▐ Wigan
56 sites for production and R&D in 18 countries. Divisional headquarters in Hanover, Germany.

Fact Book 2010 |
© Continental AG
57
113
ContiTechKey Figures
(in € million) 2008 2009 2010
Sales 3,007.0 2,406.1 3,095.3
EBITDA 430.1 274.0 468.2
in % of sales 14.3 11.4 15.1
EBIT 329.1 169.4 369.6
in % of sales 10.9 7.0 11.9
EBIT adjusted 1 242.1 396.9
in % of sales 1 10.2 12.9
Operating Assets (avg.) 1,105.2 1,006.7 1,060.7
RoCE (avg.) in % 29.8 16.8 34.8
R & D expense 59.1 58.0 60.7
in % of sales 2.0 2.4 2.0
Capex 2 110.8 82.8 100.3
in % of sales 3.7 3.4 3.2
Depreciation & amortization 3 101.0 104.6 98.6
in % of sales 3.4 4.3 3.2
thereof impairment 0.4 3.7 2.1
1) EBIT before amortization of intangibles from PPA, consolidation and special effects; sales before changes in the scope of consolidation
2) Capex including software
3) Excluding impairments on financial investments
114
ContiTechSales by Region
Germany38%
Europe (excluding Germany)
34%
NAFTA7%
Asia14%
Other countries
7%
Sales in 2010: €3.1 bn
(2009: 41%)
(2009: 33%)
(2009: 7%)
(2009: 6%)(2009: 13%)

Fact Book 2010 |
© Continental AG
58
115
ContiTechMarket Leader in its Business Units
Product line Europe Worldwide
Fluid Technology Automotive hoses & hose lines
Oil & marine
No. 1
No. 1
No. 1
No. 1
Conveyor Belt Group Conveyor belts No. 1 No. 1
Power Transmission Group Multiple V-ribbed belts & timing belts No. 1 No. 2
Benecke-Kaliko Group Foils for automotive interiors No. 1 No. 1
Air Spring Systems Truck & bus air springs
Railway systems
No. 1
No. 1
No. 1
No. 1
Vibration Control Sealing system chassis
Engine mounts for trucks
No. 1
No. 1
No. 1
Elastomer Coatings Printing blankets No. 2 No. 3
116
ContiTech
Sales and Employees 2010
* Including other operations** Including service functions
Sales in € million Employees
Fluid Technology 1,120 13,000
Conveyor Belt Group 478 3,436
Power Transmission Group 371 2,593
Benecke-Kaliko Group 296 1,493
Air Spring Systems 233 1,391
Vibration Control 254 2,066
Elastomer Coatings 99 597
Compounding 248 733
ContiTech 3,095* 25,833**

Fact Book 2010 |
© Continental AG
59
117
Topics
A. Continental at a GlanceI.
B. Continental StrategyII.
C. Continental CorporationIII.
D. Market DataIV.
Automotive Group V.
Rubber GroupVI.
Corporate Social Responsibility at ContinentalVII.
Share & Bond InformationVIII.
GlossaryIX.
118
ESH Policy – implements the
responsibility for protecting
the environment worldwide
Environmental Responsibility Social Responsibility Corporate Governance
Code of Conduct – personal
ethics, conflicts of interest
The Basics – the guidelines,
codex and basic principles of
our business activities
THE BASICS Our corporate guidelines
Corporate Governance Policy
– to foster a responsible
management of the company
focused on value creation
Risk Report – overview of our
risk management
CSR Guideline Our basic values and principles
Corporate Social Responsibility at Continental
General View

Fact Book 2010 |
© Continental AG
60
119
18.9 18.419.9
22.3
20.2
8.2 7.8 8.18.8
9.5
7.9
2005 2006 2007 2008 2009 2015*
Energy Consumption**
Corporate Social Responsibility at Continental
Corporate Environmental Key Figures and Goals
13.6 13 13.8 14.3
11.6
5.9 5.5 5.6 5.6 5.54.6
2005 2006 2007 2008 2009 2015*
Water Consumption**
197211
223 226
184
85.4 89.2 90.9 89.4 86.772.3
60.4 66.8 72.6 69.6 69.4 68.7
2005 2006 2007 2008 2009 2015*
Waste Generation & Recovery**
1.581.68
1.79
2.021.92
0.88 0.88 0.910.99
1.11
0.92
0.45 0.4 0.45 0.49 0.44
2005 2006 2007 2008 2009 2015*
CO2 Emissions**
* Continental environmental goals
**Increase mainly attributable to company acquisitions
mill. tons indirect
mill. tons direct
mill. GJ (gigajoule)
GJ per ton of product
ton per ton of product
mill. m3
m3 per ton of product
kg per ton of product
thousand tons
kg recycling per ton of product
120
The Charter of Diversity recognizes diversity
as an opportunity
The signatory companies commit to diversity,
fairness and mutual respect
The aim is to create a working environment
that is free of prejudice and discrimination
The Luxembourg Declaration on
Workplace Health Promotion (WHP)
promotes health and occupational safety in
the companies of the member states of
ENWHP*
The declaration encourages members to
attach greater importance to WHP
Corporate Social Responsibility at Continental
Corporate Memberships
* European Network for Workplace Health Promotion
Source: www.vielfalt-als-chance.de (German Federal Government Commissioner for Migration, Refugees and Integration); www.luxemburger-deklaration.de

Fact Book 2010 |
© Continental AG
61
121
Corporate Social Responsibility at Continental
Corporate Governance
20 members (in accordance with the
Mitbestimmungsgesetz (German Co-determination
Act):
10 elected by ASM
10 elected by such employees of Continental AG
and its subsidiaries who are employed in Germany
Shareholders exercise their voting rights (1 share = 1 vote)
Annual Shareholders‟ Meeting (ASM)
Chairman‟s Committee
& Mediation Committee
8 members currently
Chairman of the
Executive Board
Solely responsible for the management
of the company
Audit Committee
Nomination Committee
appoints, supervises, advises
Chairman of the
Supervisory Board
Approval of certain management decisions
of material importance to the company
reportingelection / ratification
reporting
Corporate Governance is the responsibility of the company„s corporate bodies. Continental AG„s Corporate Governance
Principles are closely modeled on the recommandations and suggestions of the German Corporate Governance Code.
ratificationtaking into account resolutions of ASM
Executive Board
Supervisory Board
122
Topics
A. Continental at a GlanceI.
B. Continental StrategyII.
C. Continental CorporationIII.
D. Market DataIV.
Automotive Group V.
Rubber GroupVI.
Corporate Social Responsibility at ContinentalVII.
Share & Bond InformationVIII.
GlossaryIX.

Fact Book 2010 |
© Continental AG
62
123
Share & Bond Information
Share Data / ADR Data
Share Data
Type of share No-par value share
Bloomberg ticker symbol CON
Reuters ticker symbol CONG
German securities code number (WKN) 543 900
ISIN number DE0005439004
Shares outstanding at December 31, 2010 200,005,983
ADR Data
Ratio (ordinary share: ADR) 1:1
Bloomberg ticker symbol CTTAY
Reuters ticker symbol CTTAY.PK
ISIN number US2107712000
ADR level Level 1
Trading OTC
Sponsor Deutsche Bank Trust Company Americas
124
Share & Bond Information
Share Price Development Vs. Major Stock Indexes
Source: Bloomberg
0%
100%
200%
300%
400%
500%
600%
700%
Jan-01 Jan-02 Jan-03 Jan-04 Jan-05 Jan-06 Jan-07 Jan-08 Jan-09 Jan-10 Jan-11
Continental DAX MDAX DJ Euro Stoxx Automobile & Parts

Fact Book 2010 |
© Continental AG
63
125
373 375
414433 433
512
135.4146.5
161.7 169.0 169.0
200.0
0
100
200
300
400
500
600
2005 2006 2007 2008 2009 2010
Issued capital (in € million) Number of shares (in million)
Share & Bond Information
Issued Capital
126
Share & Bond Information
Shareholder Structure
Shareholder Structure
as of December 31, 2010
Shareholder Structure
as of March 31, 2011
Schaeffler GmbH42.17%
B. Metzler seel. Sohn Co. Holding
AG16.48%
M.M.Warburg & CO KGaA
16.48%
Free Float24.87%
Schaeffler GmbH49.9%
B. Metzler seel. Sohn Co. Holding
AG5.2%
Free Float39.7%
M.M. Warburg & CO KGaA
5.2%

Fact Book 2010 |
© Continental AG
64
127
Share & Bond Information
Bond Details
Bond Data
Issuer Conti-Gummi Finance
B.V., Netherlands*
Conti-Gummi Finance
B.V., Netherlands*
Conti-Gummi Finance
B.V., Netherlands*
Conti-Gummi Finance
B.V., Netherlands*
Issue Senior Secured Notes Senior Secured Notes Senior Secured Notes Senior Secured Notes
Principal Amount €750 mn €1,000 mn €625 mn €625 mn
Offering Price 99.0047% 99.3304% 98.8610% 99.2460%
Rating B1 (Moody‟s)
B (Standard & Poor‟s)
B1 (Moody‟s)
B (Standard & Poor‟s)
B1 (Moody‟s)
B (Standard & Poor‟s)
B1 (Moody‟s)
B (Standard & Poor‟s)
Coupon 8.5% p.a. 7.5% p.a. 6.5% p.a. 7.125% p.a.
Issue Date July 16, 2010 September 13, 2010 October 5, 2010 October 5, 2010
Maturity July 15, 2015 September 15, 2017 January 15, 2016 October 15, 2018
Interest Payment Semi annual January 15
and July 15
Semi annual March 15
and September 15
Semi annual January 15
and July 15
Semi annual April 15 and
October 15
WKN A1AY2A A1A0U3 A1A1P0 A1A1P2
ISIN DE000A1AY2A0 DE000A1A0U37 DE000A1A1P09 DE000A1A1P25
Denomination €1,000 with min. tradable
amount €50,000
€1,000 with min. tradable
amount €50,000
€1,000 with min. tradable
amount €50,000
€1,000 with min. tradable
amount €50,000
* Guaranteed by Continental AG and certain subsidiaries of Continental AG
128
Share & Bond Information
Development of the Euro Bonds
Source: Bloomberg March 2011
95
97
99
101
103
105
107
109
111
113
Jul-10 Aug-10 Sep-10 Oct-10 Nov-10 Dec-10 Jan-11 Feb-11 Mar-11
Coupon 8.5%(July 2015)
Coupon 6.5%(October 2016)
Coupon 7.5%(September 2017)
Coupon 7.125%(October 2018)
(in €)

Fact Book 2010 |
© Continental AG
65
129
BBB
Investment Grade
Rati
ng
Development of Continental‟s Credit Rating (S&P)
BBB+BBB
BBB+
05/19/200010/31/2001
08/06/2004
Non-Investment Grade
2000 2001 2002 2003 2004 2005 2006 2007
BBB-
BBB+
11/16/2007
09/26/2008
01/27/200908/13/2009
B
05/18/2010
2008 2009 2010
Share & Bond Information
Development of Continental’s Credit Rating
Baa1Baa2
Investment Grade
Rati
ng
Development of Continental‟s Credit Rating (Moody‟s)
Baa1Baa2
Non-Investment Grade
05/19/2000 11/05/2001 04/01/2005
2001 2002 2003 2004 2005 2006 2007
B1
Ba2
Baa3
Ba1
02/26/2008 08/14/2009
11/07/2008
12/18/2008
06/02/2009
02/23/2009
2008 20102000 2009
Ba3
130
Topics
A. Continental at a GlanceI.
B. Continental StrategyII.
C. Continental CorporationIII.
D. Market DataIV.
Automotive Group V.
Rubber GroupVI.
Corporate Social Responsibility at ContinentalVII.
Share & Bond InformationVIII.
GlossaryIX.

Fact Book 2010 |
© Continental AG
66
131
Financial Glossary
ADR American Depositary Receipt
Capex Capital expenditure on property, plant, equipment and software
EBIT Earnings Before Interest and Taxes
EBITDA EBIT Before Depreciation and Amortization
EBIT margin EBIT as a percentage of sales
EBITDA margin EBITDA as a percentage of sales
FCF Free Cash Flow
Gearing Ratio Represents the net indebtedness divided by total equity, expressed as a percentage
ISIN International Securities Identification Number
Net Indebtedness The net amount of interest-bearing liabilities, investments and cash and cash equivalents as recognized in the
balance sheet as well as the market values of the derivative instruments
NIAT Net Income Attributable to the shareholders of the parent
Operating Assets Operating assets are the assets less liabilities as reported in the balance sheet, without recognizing the net
indebtedness, discounted trade bills, deferred tax assets and income tax receivable and payable as well as
other financial assets and debt
PPA Purchase Price Allocation
R&D Research and Development Expenses
ROCE (avg.) Return On Capital Employed. We define ROCE (avg.) as the ratio of EBIT to average of quarterly operating
assets
132
Product Glossary
ABS Anti-Lock Brake System
ACC Adaptive Cruise Control
ADAS Advanced Driver Assistant System
AMT Automated Manual Transmission
AT Automatic Transmission
C&S Chassis & Safety Division
CSR Conti Support Ring
CT ContiTech Division
CV Commercial Vehicle
CVT Commercial Vehicle Tires Division
CVaT Continuous Variable Transmission
ECU Electronic control unit
DCT Double Clutch Transmission
EBS Electronic Brake System
ESC Electronic Stability Control
HEV Hybrid Electric Vehicle
HMI Human Maschine Interface
HVAC Heating, Ventilation and Air Conditioning
I Interior Division
MAB/MIB Motorcycle Anti-lock Braking System /
Motorcycle Integrated Brake System
MAF Mass Airflow Sensor
MT Manual Transmission
NVH Noise Vibration Harshness
OTR Off The Road Tires
PCB Printed Curcuit Board
PLT Passenger & Light Truck Tires Division
PT Powertrain Division
PWM Pulse Width Modulation
RV Recreational Vehicle
SSR Self Supporting Runflat Tires
SUV Sport Utility Vehicle
TCS Traction Control System
TPMS Tire Pressure Monitoring System

Fact Book 2010 |
© Continental AG
67
133
Contact Data & Financial Calender
Equity and Debt Markets Relations
Vahrenwalder Str.9 Rolf Woller Kajsa Hebeler
30165 Hannover Telephone: +49 511 938 1068 Telephone: +49 511 938 1062
Germany e-mail: [email protected] e-mail: [email protected]
Telephone: +49 511 938 1163
Fax: +49 511 938 1080 Gabriele Collatz Sabine Reese
e-mail: [email protected] Telephone: +49 511 938 1915 Telephone: +49 511 938 1027
www.continental-ir.com e-mail: [email protected] e-mail: [email protected]
Financial Calender
2011
Annual Shareholders‟ Meeting April 28, 2011
Q1, Financial Report May 5, 2011
HY, Financial Report July 29, 2011
9M, Financial Report November 3, 2011
2012
Annual Financial Press Conference February 2012
134
Disclaimer
This presentation has been prepared by Continental Aktiengesellschaft. It has not been independently verified. It does not constitute
an offer, invitation or recommendation to purchase or subscribe for any shares or other securities issued by Continental AG or any of
its affiliates and neither shall any part of it form the basis of, or be relied upon in connection with, any contract or commitment
concerning the purchase or sale of such shares or other securities or any other financial investment or exposure whatsoever.
Neither Continental Aktiengesellschaft nor any of its affiliates, advisors or representatives shall have any liability whatsoever (in
negligence or otherwise) for any loss that may arise from any use of this presentation or its contents or otherwise arising in
connection with this presentation.
This presentation includes assumptions, estimates, forecasts and other forward-looking statements, including statements about our
beliefs and expectations regarding future developments as well as their effect on the results of Continental. These statements are
based on plans, estimates and projections as they are currently available to the management of Continental. Therefore, these
statements speak only as of the date they are made, and we undertake no obligation to update publicly any of them in light of new
information or future events. Furthermore, although the management is of the opinion that these statements, and their underlying
beliefs and expectations, are realistic as of the date they are made, no guarantee can be given that the expected developments and
effects will actually occur. Many factors may cause the actual development to be materially different from the expectations expressed
here. Such factors include, for example and without limitation, changes in general economic and business conditions, fluctuations in
currency exchange rates or interest rates, the introduction of competing products, the lack of acceptance for new products or
services and changes in business strategy.

Fact Book 2010 |
© Continental AG
68
135135 / © Continental AG