Fact Book Fall 2016 - Fayetteville State University...George Grainger, Jr., Thomas Lomax, Nelson...
118
Fact Book Fall 2016 Fayetteville State University Office of Institutional Research
Transcript of Fact Book Fall 2016 - Fayetteville State University...George Grainger, Jr., Thomas Lomax, Nelson...

Fact Book Fall 2016
Fayetteville State UniversityOffice of Institutional Research

i
TABLE OF CONTENTS
General Information
Statement of Educational Mission, Philosophy and Values ................................................2
Administration .....................................................................................................................3
History of Fayetteville State University ..............................................................................7
University of North Carolina Board of Governors ............................................................10
Institutional Memberships, Accreditation, Centers and Special Programs........................11
Fayetteville State University Organizational Chart ...........................................................12
Academic Program Inventory ............................................................................................13
Students
Narrative Summary of Student Data .............................................................................18
First Time Freshmen Applied, Accepted, Enrolled 2011-2016 ....................................20
First Time Freshmen Enrolled 2011-2016 by Gender and Age .....................................43
By Residency and Race .....................................................................................................44
By SAT Verbal and Math Scores.......................................................................................45
By SAT Combined Score and High School GPA ..............................................................46
By Class Rank in Quintiles and Quartiles..........................................................................47
Total Student Enrollment 2011-2016 by Gender and Age .............................................48
By Residency .....................................................................................................................49
By Race ..............................................................................................................................50
By Enrolled Status and Citizenship ...................................................................................51
By Housing Status and Semester Credit Hours .................................................................52
By Transfer Hours Applied ................................................................................................53
By Classification ................................................................................................................54
Undergraduate By Major ...................................................................................................57
Graduate By Major ............................................................................................................59
Upper Division (junior, senior, and graduate) Enrollment 2013-2015 ..............................61
Degrees Conferred 2011-2016 Comparison by Level and Month .................................62
By Residency and Teacher Certification ...........................................................................63
By Race ..............................................................................................................................64
By Gender and Citizenship ................................................................................................65
Degrees Awarded By Major ..............................................................................................66
Degrees Awarded By County 2013-2016 ..........................................................................68
Degrees Awarded By State 2013-2016 .............................................................................76
Retention, Graduation, and Persistence Rates ...................................................................80
ii
Faculty and Staff
Full-Time Faculty 2013-2016 AAUP By Gender and Race ............................................82
By Tenure Status and Position ...........................................................................................83
By Degree and Average Salary ..........................................................................................84
Employees 2011-2016 By Race and Gender.....................................................................87
By Status ............................................................................................................................88
Employee Statistics Fall 2013-Fall 2016 ...........................................................................89
Finances
Finance Report Fiscal Years 2011-2015 ............................................................................96
IPEDS Finance Survey Fiscal Years 2010-2015 ...............................................................97
Detailed Tuition and Fees Fall 2016-Spring 2017 ...........................................................103
Financial Aid 2011-2016 By Type and Dollars ...............................................................105
Financial Aid Comparative Statistics 2013-2016 ............................................................106
Economic Impact of Fayetteville State University ..........................................................109
Facilities
Facilities Inventory ..........................................................................................................114

General Information Institutional Profile Fall 2016
Established: 1867
Control: State
Highest Degree Offering: Doctorate
Accreditation: Southern Association of Colleges and Schools
FICE Code: 002928
Level: Comprehensive I
School Motto: Res Non Verba “Deeds not Words”
School Colors: White & Blue
School Song: “Old White and Blue” by Mary T. Eldridge
School Mascot: Bronco
Fall Enrollment: 6,223 (5,543 undergraduate)
Top Majors: Nursing, General Studies, Business Administration, and Psychology
Degree Areas: Bachelor – 33, Master – 8, Doctor – 1
Estimated Annual In State $7,687 – undergraduate (room & board $14,936) Costs: $8,135 – graduate
Demographics: Female – 68%, Black – 62%, In State – 96%
Employees: Total – 894, Full-Time Faculty – 256 (80% hold a doctorate or 1st professional degree)
Facilities: 38 buildings on 156 acres
Annual Budget (FY 2016): $112,820,060
Fayetteville State University

2
General Information
Statement of Educational Mission Fayetteville State University (FSU) is a public comprehensive regional university that promotes the educational, social, cultural, and economic transformation of southeastern North Carolina and beyond. The primary mission of FSU is to provide students with the highest quality learning experiences that will produce global citizens and leaders as change agents for shaping the future of the State. Awarding degrees at the baccalaureate and
master's levels, and the doctorate in educational leadership, FSU offers programs in teacher education, the arts and sciences, health professions, business and economics, and unique and emerging fields. FSU is an institution of opportunity and diversity. Committed to excellence in teaching, research, scholarship, and service, the university extends its services and programs to the community, including the military, and other educational institutions throughout North Carolina, the nation, and the world. (Approved by UNC Board of Governors, October 9, 2009.)
FSU Core Values
Student Success and the Pursuit of Excellence
We believe in student success and the obligation of the university to provide the
highest quality learning experiences and academic programs to facilitate student
success, intellectual and cultural growth, excellence in scholarship, leadership, and
ethical standards.
Shared Governance
We believe in shared governance, fiscal responsibility, a commitment to life-long
learning, and professional development for faculty, staff, and students.
Global Responsibility
We believe in respect for diversity, global responsibility, conservation of natural
resources, and a commitment to sustainability.
Collaboration
We believe in outreach, partnerships with educational institutions, engagement with
the military and the community, economic transformation of the state, and service to
others.
FSU Strategic Priorities 2015 - 2020
1. Graduation and Retention Rates
2. Collaborations and Partnerships
3. Efficiency, Effectiveness, and Sustainability

3
FSU Administration 2016-2017
Board of Trustees Mr. Jodie Ervin, Chair
Mrs. Vedas Neal, Vice Chair Mr. Claude, Bogues, Secretary
Dr. Richard Clayton Adams Mr. Edward E. Dickerson
Mr. Elliot Jackson (Ex-Officio) Dr. Inder Nijhawan
Mr. Donald L. Porter Mr. Rajan Shamdasani
Ms. Brenda Timberlake Mr. Kirk deViere
Suzetta Perkins, Secretary of the University Staff Liaison/Assistant Secretary
Emeriti Dr. W. T. Brown
Mr. Felton J. Capel Dr. Jack V. Hill
Mr. James M. Paige
Chancellor’s Cabinet
James A. Anderson, B.A., Ph.D. Chancellor
Vacant Vice Chancellor and Chief of Staff
Jon Young, B.A., M.A., Ph.D. Provost and Vice Chancellor for Academic Affairs
Janice Haynie, B.A., Ph.D. Vice Chancellor for Student Affairs
Arasu “Nick” Ganesan, B.A., M.B.A. Vice Chancellor for Inform. Tech. & Telecom Services
Vacant Vice Chancellor for Institutional Advancement
Kenneth Craig, B.B.A., M.B.A. Vice Chancellor for Business and Finance Wanda D. Jenkins, B.B.A., M.B.A., J.D.
Chief Compliance Officer and General Counsel Anthony Bennett, B.S., M.B.A.
Director of Athletics Bertha H. Miller, B.S., M.A., Ph.D.
Executive Assistant to the Chancellor for Strategic Initiatives Ann Zomerfeld, B.S., M.B.A.
Executive Assistant to the Chancellor

4
Deans
Samuel Adu-Mireku, B.A., M.S., Ph.D. Interim Dean, College of Arts and Sciences
John I. Brooks, B.A., M.A., Ph.D. Dean of University College
Marion Gillis-Olion, B.A., M.A., Ph.D. Dean, School of Education
Pamela Jackson, B.A., M.S., M.B.A., Ph.D. Dean, School of Business and Economics
*****Tyson Beale Associate Vice Chancellor for Student Affairs/Director of Student Conduct Yolanda Bonnette
Associate Vice Chancellor for Business & Finance/Title III Coordinator
Juanette Council Associate Vice Chancellor for Student Affairs Michelle Daley Associate Vice Chancellor and Deputy CIO Daryush IlA Associate Vice Chancellor for Research & Technology Transfer Charles F. Kimble Associate Vice Chancellor for Police and Public Safety/Chief Perry Massey
Senior Associate Vice Chancellor for Academic Affairs
Ben Minter Assistant Vice Chancellor of Events
Greg Moyd Assistant Vice Chancellor for Student Affairs Jon Parsons Interim Associate Vice Chancellor for Facilities Management Rollinda Thomas Interim Assistant Vice Chancellor for Academic Affairs/SACS LiaisonTerri Tibbs
Associate Vice Chancellor for Human Resources
Vacant Associate Vice Chancellor of Major Gifts
Vacant Associate Vice Chancellor for Enrollment Management Vacant Associate Vice Chancellor of Development Jeffery Womble Assistant Vice Chancellor of Communications
*****Veronica Alexander Director of Military Affiliated Services Miriam DeLone Interim Associate Dean, College of Arts and Sciences Joe Alston Director of Business Services
Jesse Baker Director of Data And Assessment Sarah Baker Interim University Registrar Ulisa Bowles
Director of Admissions

5
Tamara Holmes Brothers Director of Corporate and Foundation Relations J Lee Brown Assistant Dean, School of Business & Economics/Director of Pre-Business Program Timothy Buckner Director of the Foreign Language Lab Julian Capel Director of Student Engagement Kevin Crutchfield Director of Materials Management Gloria Moore Carter Director of Early Childhood Learning Center Yunkai Chen Director of the International Education Programs Dana L. Dalton Director of Institutional Research Miriam DeLone Interim Associate Dean, College of Arts and Sciences Kamesia Ewing Director of Financial Aid Wesley Fountain Director of Government Relations Bonnie Grohe Director of The Office of Faculty Development Ashley Johnson Director of Financial Reporting Clanton D. Johnson Director of Advancement Services Cynthia Jones Treasurer/Bursar Christine Jumalon Controller Brent Lewis Director of Cultural Programs/The Safe Zone Office Steven Mack Director of Budgeting Milton Marshburn
Director of the Small Business and Technology Development Center Greg McElveen Assistant Dean for Strategic Initiatives LaWanda Miller Budget Officer Gerald Mitchell Associate Dean of University College
Noran Moffett Associate Dean, School of Education Alvis Moore Testing Coordinator Andrea Neal Director of Special Programs Jon Parsons Director of Operations/Energy
Management Blanche Radford-Curry
Assistant Dean, College of Arts and Sciences
Karen Ray Director of Health Services YaKima Rhinehart Director of Alumni Affairs Fred Sapp
Director of The Center for Personal Development
John Scarsella MBA Director of Admissions
Ernestine Spears Director of Student Accounts Jane Smith Director of The Office of Continuing Education/Office of Summer School Curtis Street Director of Career Services Courtney Thompson Director of Student Life and Housing Teresa Thompson-Pinckney Director of The Office of College Access Programs Vacant
Director of Major Planned Gifts Vacant Director of Business Center Abdoul Wane Director of The Center for Economic Education Jenny Washington Director of Teacher Education Tavoria Wax Director of The Enrollment Services Center Erin White Interim Director of Honors Program Ashley Williams Director of Purchasing Elliott Williams Interim Director of Intramurals Bobby Wynn Director of Library Services
6
*****Adegoke Ademiluyi Chair, Department of Government and History Cevdet Akbay
Chair, Department of Chemistry and Physics
Afua Arhin Chair, Department of Nursing Joe Brown
Interim Chair, Department of Criminal Justice Kimberly Smith Burton Chair, Department of Middle Grades, Secondary and Special Education/ Director of Math/Science Education Center Todd S. Frobish
Chair, Department of Communication, Languages and Cultures
Sabrina Gammage Chair, Department of Military Science Abdelmajid Kassem Chair, Department of Biological Sciences Ji Young Kim Interim Chair, Department of English Earnest Lamb
Chair, Department of Performing and Fine Arts
Constance Lightner Interim Chair, Department of Management, Marketing, and Entrepreneurship
Nicole Lucas Chair, Department of Sociology Priscilla Manarino-Leggett Chair, Department of Elementary Education Jay Miller Chair, Department of Aerospace Studies Daniel Montoya Interim Chair, Department of Psychology Terri Moore-Brown Chair, Department of Social Work Radoslav Nickolov Chair, Department of Math/Computer Science Ulysses Taylor Chair, Department of Accounting, Finance, Healthcare Administration, and Information Systems Linda Wilson-Jones
Chair, Department of Educational Leadership/
Ed.D. Director
7
History of Fayetteville State University
In 1867, seven black men - Matthew N. Leary, Jr., A. J. Chesnutt, Robert Simmons, George Grainger, Jr., Thomas Lomax, Nelson Carter, and David A. Bryant - paid $136 for two lots on Gillespie Street and converted themselves into a self-perpetuating Board of Trustees to maintain this property permanently as a site for the education of black children in Fayetteville. General Oliver O. Howard of the Freedman's Bureau, erected a building on this site, and the institution became known as the Howard School. Robert Harris was selected as the principal.
By a legislative act of 1877, the North Carolina General Assembly provided for the establishment of a Normal School for the education of black teachers. The Howard School was chosen as the most promising because of its successful record during the previous ten years under the leadership of Robert Harris. Its name was changed to the State Colored Normal School and Harris remained as principal until his death in 1880.
Charles W. Chesnutt was principal from 1880 to 1883. He emphasized foreign languages, social graces, and intellectual development as keys to success. He resigned to pursue a literary career and indeed became one of the leading black American writers of fiction between 1887 and 1930.
Ezekiel E. Smith became the third principal in 1883 and would serve three different terms in this leadership position. His first term as principal lasted from 1883-1888. He expanded the curriculum to better prepare teachers for the public grammar schools. In 1888 George Williams became the principal and introduced a Speaker’s Series. Smith returned in 1895 after serving as an ambassador in Liberia. In 1898, he left to serve in the Spanish American War. Reverend Leonard E. Fairley served as acting principal until Smith returned in 1899.
Between 1899 and 1933, Dr. E.E. Smith’s vision for excellence in teaching would lay the framework for the Normal School to become a college. By the time he retired in 1933, the school had grown from three rooms in a small frame structure to a physical plant of ten buildings on a fifty-acre tract of land. Black and white citizens contributed funds along with Dr. Smith, F. D. Williston, E. N. Williams, J. G. Smith and Dr. P. N. Melchor, to purchase the initial forty acres of land. With the erection of the Aycock Building by the state in 1908, the school began its permanent residency on Murchison Road. Smith’s title was changed from principal to president in 1927. The Newbold School, a practice school for teachers, was erected on the campus in 1930. Dr. E.E. Smith’s ideas about teacher training set the pace for teacher education throughout the state. His years of service covered a span of fifty years-1883 to 1933.
Dr. James Ward Seabrook became the president in 1933. Under his presidency the school became Fayetteville State Teachers College, thereafter being authorized to grant the Bachelor of Science Degree in Elementary Education. Cultural activities, student organizations, and significant physical expansion contributed to the complete transformation from a normal school to a college. The college received both state and regional accreditation in 1947.
Dr. Rudolph Jones succeeded Dr. Seabrook in 1956. During his administration, the curriculum was expanded to include majors in secondary education and programs leading to degrees outside the teaching field. The name of the school was changed to Fayetteville State College in 1963. FSC students were active participants in the Civil Rights Movement of the sixties and helped to bring about integration in Fayetteville. Also, under the leadership of Dr. Jones, six additions were made to the physical plant to accommodate a rapidly expanding enrollment.

8
Dr. Charles A. Lyons, Jr. was appointed president in 1969 and the institution acquired its present name. By a legislative act in 1972, Fayetteville State University became a constituent institution of the University of North Carolina System, and Dr. Lyons became its first Chancellor. During his tenure, the curriculum was expanded to include a variety of both baccalaureate and master's level programs. The Fort Bragg-Pope AFB Extension Center, in conjunction with the Weekend and Evening College, was established in order to provide military personnel and other full-time working people with the opportunity to further their education. The general academic structure took its present configuration in 1985 when the university became a Comprehensive Level I Institution. In addition to expanding program offerings and services, eight buildings were added to the physical plant during this period.
On January 1, 1988, Dr. Lloyd V. Hackley became the eighth Chief Executive Officer of the university. In his seven years as Chancellor, the university expanded its master's level program offerings to include biology, business administration, education, English, history, mathematics, psychology, and sociology, and FSU's first doctoral program in Educational Leadership was established. Baccalaureate program offerings were also increased to include 36 disciplines in the arts and sciences, business and economics, and education. Hackley strengthened FSU's community outreach to at-risk children in the public schools and established numerous scholarship and tutoring/mentoring programs to encourage more young people to aspire to academic excellence and a college education. FSU's first major public Capital Campaign was also completed, which enabled the university to increase the number of privately funded scholarships. The student population doubled in numbers and in diversity during his administration. The addition of the ultra-modern School of Business and Economics Building and the Health and Physical Education Building underscored Dr. Hackley's commitment to FSU's continued expansion and growth. On December 31, 1994, Dr. Hackley left his post to become President of the North Carolina Department of Community Colleges, the first African-American to lead the state's system of 59 community colleges.
Dr. Donna J. Benson, Associate Vice President for Academic Affairs of the University of North Carolina served as Interim Chancellor from January 1, 1995 to November 15, 1995. Capital improvements included renovation of dormitories and completion of the Distance Learning Center in the Communications Building.
In 1995 Dr. Willis B. McLeod, a 1964 graduate of Fayetteville State University, became the ninth Chief Executive Officer of FSU and the first alumnus to serve as Chancellor. Among the initiatives he instituted were the “Freshman Year Initiative” (or F.Y.I.), a program designed to enhance students’ educational outcomes; new outreach efforts aimed at forging stronger community ties; and formed a regional partnership of public school, community college, and university leaders which focused on strengthening the educational pipeline from pre-school to post-graduate studies. Renovation and improvement of campus facilities were achieved, including all air-conditioned buildings. A strong cultural and fine arts series and fourteen CIAA championships bolstered Bronco Pride.
Dr. T. J. Bryan assumed the position of Chancellor on July 1, 2003. As the tenth chief executive officer of the university, Dr. Bryan was the first African-American woman selected to lead a constituent institution of the University of North Carolina. Dr. Bryan developed new academic programs, obtained specialized accreditation for several programs, strengthened student recruitment and support programs, and improved buildings and grounds. Under her leadership, a four-year nursing program and an Honors Program were established.

9
In 2007 Dr. Lloyd V. Hackley returned as Interim Chancellor. He launched projects to carry out the initiatives of UNC Tomorrow, placed FSU on a sound course for fiscal solvency, and introduced a number of organizational changes for greater efficiency of operations.
Dr. James A. Anderson was named the eleventh Chief Executive Officer of Fayetteville State University on March 7, 2008. Under Chancellor Anderson’s leadership, the university has established a five year strategic plan for growth, expanded academic program offerings, added global education and study abroad, and increased certification and accreditation of academic programs. The university has expanded partnerships with universities, corporations, and the military. Outreach also includes service learning, a community computer center, a Veteran Center, the Early High School College, the Center for Defense and Homeland Security, and many collaborative cultural activities with community agencies.
Dr. Anderson is committed to making FSU a university of choice by enabling students to be successful through advanced technology, new cutting edge academic programs, expanded partnerships with the community and educational institutions, globalism, an improved campus environment, and professional development opportunities for faculty, staff, and students.

10
Administration of the University of North Carolina
The Board of Governors
W. Louis Bissette, Jr., Chairman Joan Templeton Perry, M.D., Secretary
Roger Aiken W. Louis Bissette, Jr.
Pearl Burris-Floyd C. Philip Byers
Walter C. Davenport Madeline Finnegan (Ex-Officio)
Thom Goolsby H. Frank Grainger Henry W. Hinton
James L. Holmes, Jr. Joe Knott
W. Marty Kotis III Scott Lampe
Steven B. Long Joan G. MacNeill
Ann Maxwell J. Alex Mitchell
W. G. Champion Mitchell Anna S. Nelson R. Doyle Parrish
Joan Templeton Perry Therence O. Pickett
David M. Powers Robert S. Rippy
O. Temple Sloan III Harry L. Smith, Jr.
J. Craig Souza George A. Sywassink
William Webb Laura I. Wiley
Michael Williford
Emeritus Members Hannah D. Gage

11
Institutional Memberships and Accreditations
The university holds institutional membership and/or accreditation in the following agencies and professional organizations: The Academy of Criminal Justice Sciences (ACJS) The Adult Education Association, U.S.A. American Association for Counseling and Development The American Association of Colleges and Schools for Teacher Education (AACTE) The American Association of State Colleges and Universities (AASCU) The American Council on Education (ACE) Association for Continuing and Higher Education (ACHE) The Association to Advance Collegiate Schools of Business (AACSB) The Central Intercollegiate Athletic Association (CIAA) Commission on Collegiate Nursing Education (CCNE) Council for Advancement and Support of Education (CASE) Council on Social Work Education The National Alliance of Business National Association for Equal Opportunity in Higher Education (NAFEO) National Association for Student Financial Aid Administrators (NASFAA) The National Association of Business Teacher Education The National Collegiate Athletic Association (NCAA) The National Council for Accreditation of Teacher Education (NCATE) The National League of Nursing (NLN) The North Carolina Association of Colleges and Universities North Carolina Day Care Association The North Carolina Department of Public Instruction (DPI) The Servicemen’s Opportunity College (SOC) The Southern Association of Colleges and Schools (SACS) The Southern Conference of Graduate Schools (SCGS)
Centers and Special Programs
Center for Extended Learning Center for Economic Education Curriculum Learning Resource Laboratory Distance Learning Center Early Childhood Learning Center Educational Opportunity Centers Program Educational Talent Search Program Fine Arts Resource Center FSU Theatre Company Mathematics and Science Education Center Office of School Services Rosenthal Gallery Servicemen’s Opportunity College Seymour Johnson AFB Center Small Business and Technology Development Center Fort Bragg-Pope Air Force Base University Center. University Testing Services Upward Bound Program Veterans Affairs
12
Educational Talent Search Program Extended Learning and Summer Programs Fine Arts Resource Center Fort Bragg Center GEAR UP Honors Program Mathematics and Science Education Center Online Degree Completion Programs Residence Halls Rosenthal Gallery Servicemen’s Opportunity College Small Business and Technology Development Center Study Abroad Program Summer School Program Teaching Licensure Opportunities for Transitioning Soldiers University Library University Police and Public Safety University Testing Services Upward Bound Program Veterans Affairs

Provost and Senior Vice Chancellor for Academic
Affairs
Vice Chancellor and Chief of Staff
(Vacant)
Vice Chancellor for Information Technology and Telecommunication
Services
Board of Governors
President of The University of North Carolina
CHANCELLORBOARD OF TRUSTEES
Vice Chancellor for Student Affairs
Vice Chancellor for Institut ional Advancement General Counsel Director of Athlet icsVice Chancellor for
Business and Finance
Assoc. VC for Development & Campaign Manager
Director of Publications & Sr. Graphics Illustrator
Asst. VC for Events Management
Assoc VC for Communications
Assoc. VC for Business and Finance
Assoc. VC for Student Affairs
Asst. VC for Student Affairs Assoc. VC/Dir. Student Conduct Director of Career Services Director of Health Services
Director of the Center for Personal Development
Director of Intramural Sports
Assoc. VC/Deputy CIO
Assoc. VC for Police and Public SafetyAssoc. VC for Human Resources l
Asst. Athletic Dir. Bus. Affairs & Senior Women s Administrator Asst. Athletic Director Compliance
Head Football Coach
Head Athletic Trainer
Senior Assoc. VC for Acad. Affairs
Asst. VC for Acad. Affairs & SACS Liaison
Assoc.VC for Research &Tech Transfer
Head Coaches
Fayetteville State University Organizational Chart
2016
Director of Residence Life
Faculty Athletics Representat ive
Assoc. VC for Enrollment Mgt.
Business Systems Analyst
Dean College of Arts & Sciences
Dean School of Business & Economics.
Dean School of Education
Dean University College & Student Success
Director of Cont. Ed. & Summer School Exec. Director of Acad. Budget & Administration
Asst. VC for Acad. Affairs & Strategic Init iatives
Asst. Athletic Dir. Sports Information Director
Executive Asst. Director of Government & Community Relations
Internal Auditor
Executive Asst. for Strategic Initiatives
Director of Alumni Affairs
Director of Marketing
Director of Corporate & Foundation Relations
Asst. Athletic Director for Development and Marketing
Paralegal
Director of Inst. Research
Director of Advancement Services
Director of Development and Gift Planning
IT Project Manager
Information Security Specialist
Assoc. VC/Facilities Management
University ControllerDirector of Systems & Procedures
Director of Contracts & Grants Director of Business Services Director of Materials Management
University Bursar
University Budget Officer
Title IX Coordinator
Senior Associate Vice Chancellor
Secretary of the University
Assistant General Counsel
13
14 Fayetteville State University Office of Institutional Research 01/09/2017
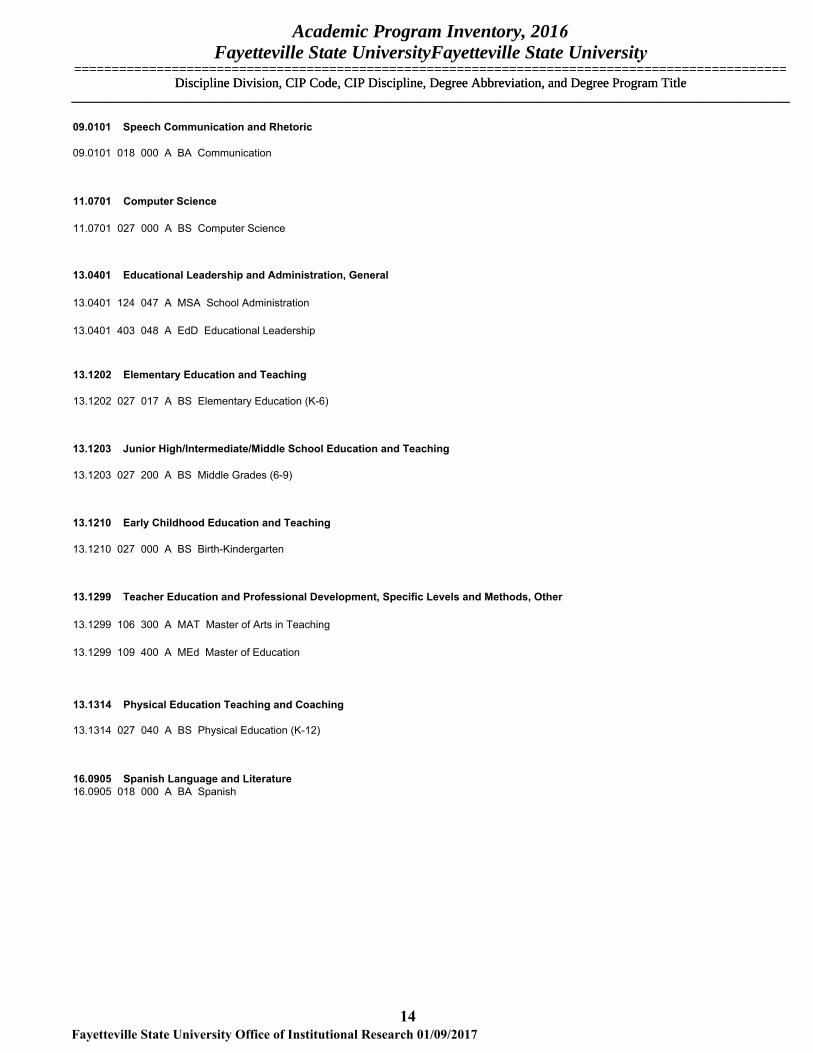
Academic Program Inventory, 2016Fayetteville State UniversityFayetteville State University
============================================================================================================================================================================================== Discipline Division, CIP Code, CIP Discipline, Degree Abbreviation, and Degree Program TitleDiscipline Division, CIP Code, CIP Discipline, Degree Abbreviation, and Degree Program Title
________________________________________________________________________________________________________________________________________________________________________________________________________________________
09.0101 Speech Communication and Rhetoric
09.0101 018 000 A BA Communication
11.0701 Computer Science
11.0701 027 000 A BS Computer Science
13.0401 Educational Leadership and Administration, General
13.0401 124 047 A MSA School Administration
13.0401 403 048 A EdD Educational Leadership
13.1202 Elementary Education and Teaching
13.1202 027 017 A BS Elementary Education (K-6)
13.1203 Junior High/Intermediate/Middle School Education and Teaching
13.1203 027 200 A BS Middle Grades (6-9)
13.1210 Early Childhood Education and Teaching
13.1210 027 000 A BS Birth-Kindergarten
13.1299 Teacher Education and Professional Development, Specific Levels and Methods, Other
13.1299 106 300 A MAT Master of Arts in Teaching
13.1299 109 400 A MEd Master of Education
13.1314 Physical Education Teaching and Coaching
13.1314 027 040 A BS Physical Education (K-12)
16.0905 Spanish Language and Literature16.0905 018 000 A BA Spanish

15 Fayetteville State University Office of Institutional Research 01/09/2017
Academic Program Inventory, 2016Fayetteville State University
===============================================================================================Discipline Division, CIP Code, CIP Discipline, Degree Abbreviation, and Degree Program Title
____________________________________________________________________________________________________________
23.0101 English Language and Literature, General
23.0101 018 000 A BA English, Language and Literature
24.0101 Liberal Arts and Sciences/Liberal Studies
24.0101 027 000 A BS Professional Studies
26.0101 Biology/Biological Sciences, General
26.0101 027 000 A BS Biology
27.0101 Mathematics, General
27.0101 027 000 A BS Mathematics
40.0501 Chemistry, General
40.0501 018 000 A BA Chemistry
40.0501 027 000 A BS Chemistry
42.0101 Psychology, General
42.0101 027 000 A BS Psychology
42.0101 102 000 A MA Psychology
43.0104 Criminal Justice/Safety Studies
43.0104 027 000 A BS Criminal Justice
43.0104 123 000 A MS Criminal Justice
43.0106 Forensic Science and Technology
43.0106 027 000 A BS Forensic Science
43.0202 Fire Services Administration43.0202 027 000 A BS Fire and Emergency Services Administration
Fayetteville State University===============================================================================================
Discipline Division, CIP Code, CIP Discipline, Degree Abbreviation, and Degree Program Title____________________________________________________________________________________________________________
16 Fayetteville State University Office of Institutional Research 01/09/2017
Academic Program Inventory, 2016Fayetteville State University
===============================================================================================Discipline Division, CIP Code, CIP Discipline, Degree Abbreviation, and Degree Program Title
____________________________________________________________________________________________________________
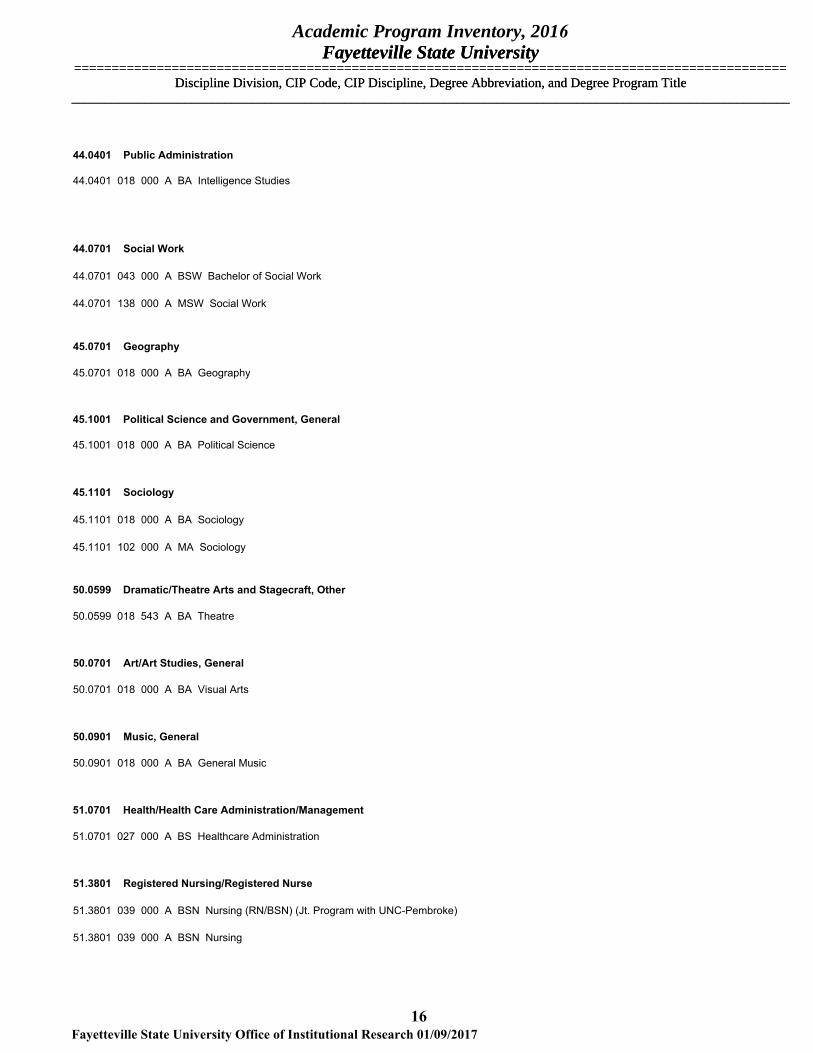
44.0401 Public Administration
44.0401 018 000 A BA Intelligence Studies
44.0701 Social Work
44.0701 043 000 A BSW Bachelor of Social Work
44.0701 138 000 A MSW Social Work
45.0701 Geography
45.0701 018 000 A BA Geography
45.1001 Political Science and Government, General
45.1001 018 000 A BA Political Science
45.1101 Sociology
45.1101 018 000 A BA Sociology
45.1101 102 000 A MA Sociology
50.0599 Dramatic/Theatre Arts and Stagecraft, Other
50.0599 018 543 A BA Theatre
50.0701 Art/Art Studies, General
50.0701 018 000 A BA Visual Arts
50.0901 Music, General
50.0901 018 000 A BA General Music
51.0701 Health/Health Care Administration/Management
51.0701 027 000 A BS Healthcare Administration
51.3801 Registered Nursing/Registered Nurse
51.3801 039 000 A BSN Nursing (RN/BSN) (Jt. Program with UNC-Pembroke)
51.3801 039 000 A BSN Nursing
17 Fayetteville State University Office of Institutional Research 01/09/2017
Academic Program Inventory, 2016Fayetteville State University
===============================================================================================Discipline Division, CIP Code, CIP Discipline, Degree Abbreviation, and Degree Program Title
____________________________________________________________________________________________________________
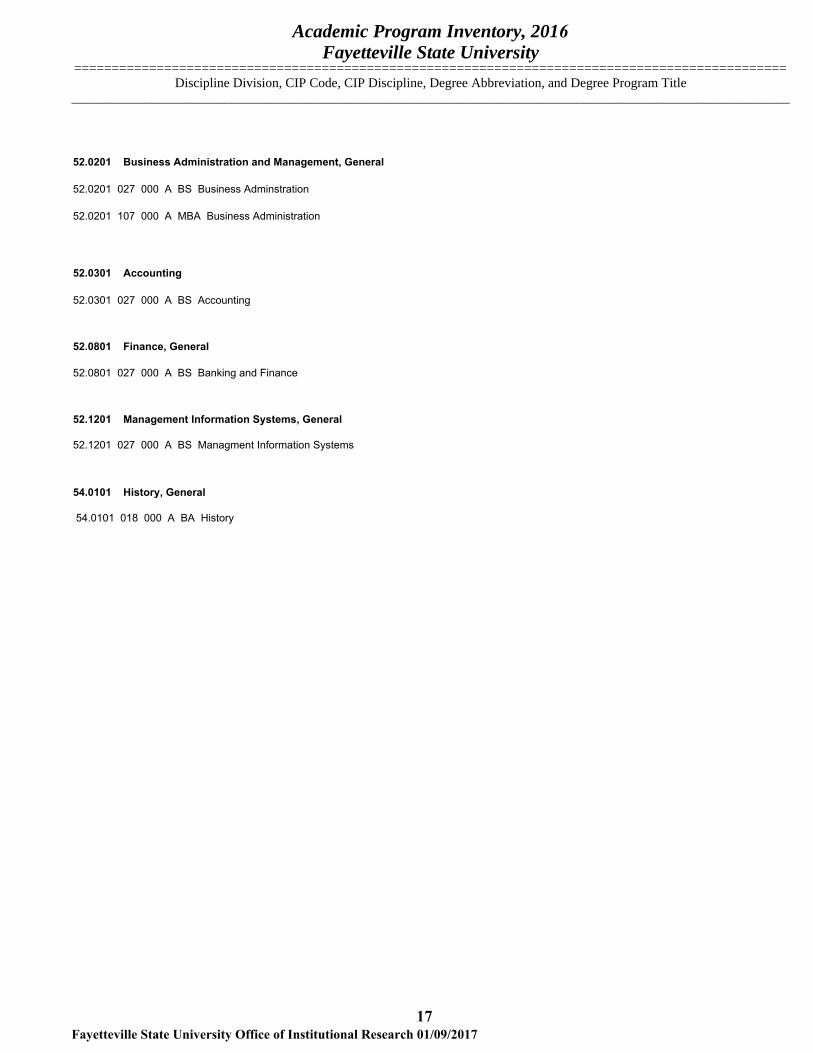
52.0201 Business Administration and Management, General
52.0201 027 000 A BS Business Adminstration
52.0201 107 000 A MBA Business Administration
52.0301 Accounting
52.0301 027 000 A BS Accounting
52.0801 Finance, General
52.0801 027 000 A BS Banking and Finance
52.1201 Management Information Systems, General
52.1201 027 000 A BS Managment Information Systems
54.0101 History, General
54.0101 018 000 A BA History

Finances
It’s all about your vision for the future and how Fayetteville State University will help you attain it. We believe in your ability to make a positive impact with an outstanding education as your springboard. We believe in results, and we know how to foster achievement. Whether you are in high school, already working, or transferring from another institution, Fayetteville State University is a university that inspires you to set high expectations for yourself.
Students
Fayetteville State University
19 Fayetteville State University Office of Institutional Research 01/09/2017
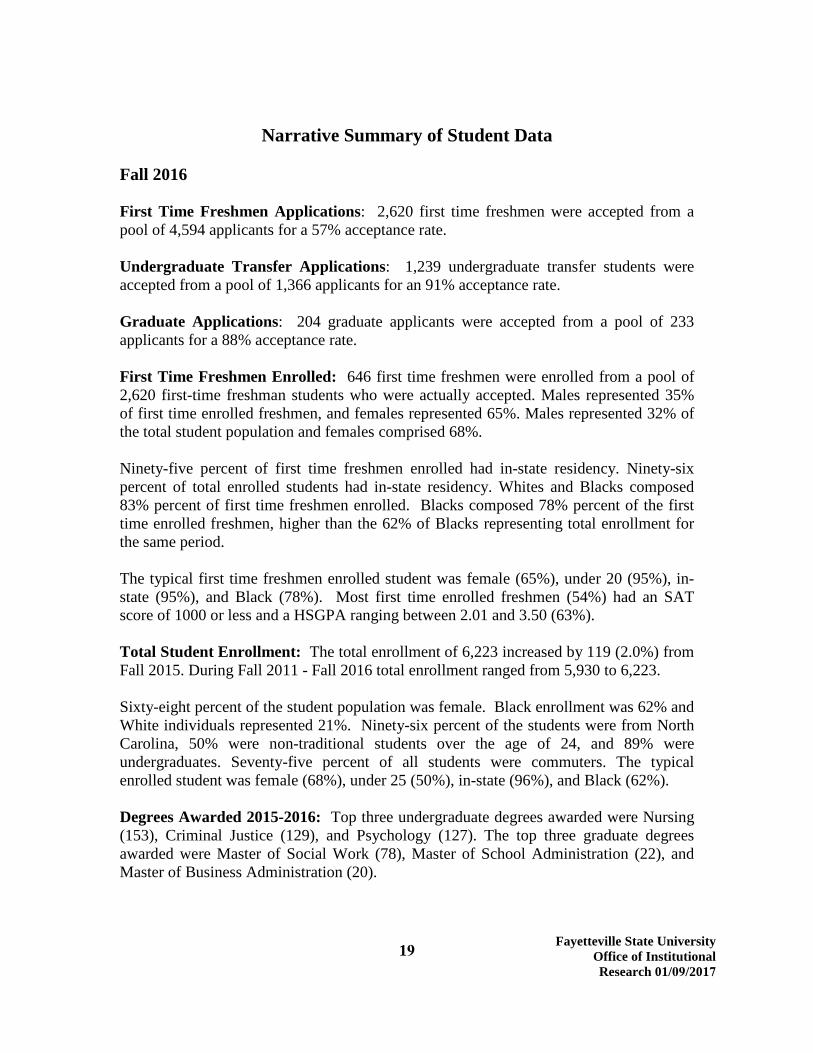
Narrative Summary of Student Data
Fall 2016
First Time Freshmen Applications: 2,620 first time freshmen were accepted from a pool of 4,594 applicants for a 57% acceptance rate.
Undergraduate Transfer Applications: 1,239 undergraduate transfer students were accepted from a pool of 1,366 applicants for an 91% acceptance rate.
Graduate Applications: 204 graduate applicants were accepted from a pool of 233 applicants for a 88% acceptance rate.
First Time Freshmen Enrolled: 646 first time freshmen were enrolled from a pool of 2,620 first-time freshman students who were actually accepted. Males represented 35% of first time enrolled freshmen, and females represented 65%. Males represented 32% of the total student population and females comprised 68%.
Ninety-five percent of first time freshmen enrolled had in-state residency. Ninety-six percent of total enrolled students had in-state residency. Whites and Blacks composed 83% percent of first time freshmen enrolled. Blacks composed 78% percent of the first time enrolled freshmen, higher than the 62% of Blacks representing total enrollment for the same period.
The typical first time freshmen enrolled student was female (65%), under 20 (95%), in-state (95%), and Black (78%). Most first time enrolled freshmen (54%) had an SAT score of 1000 or less and a HSGPA ranging between 2.01 and 3.50 (63%).
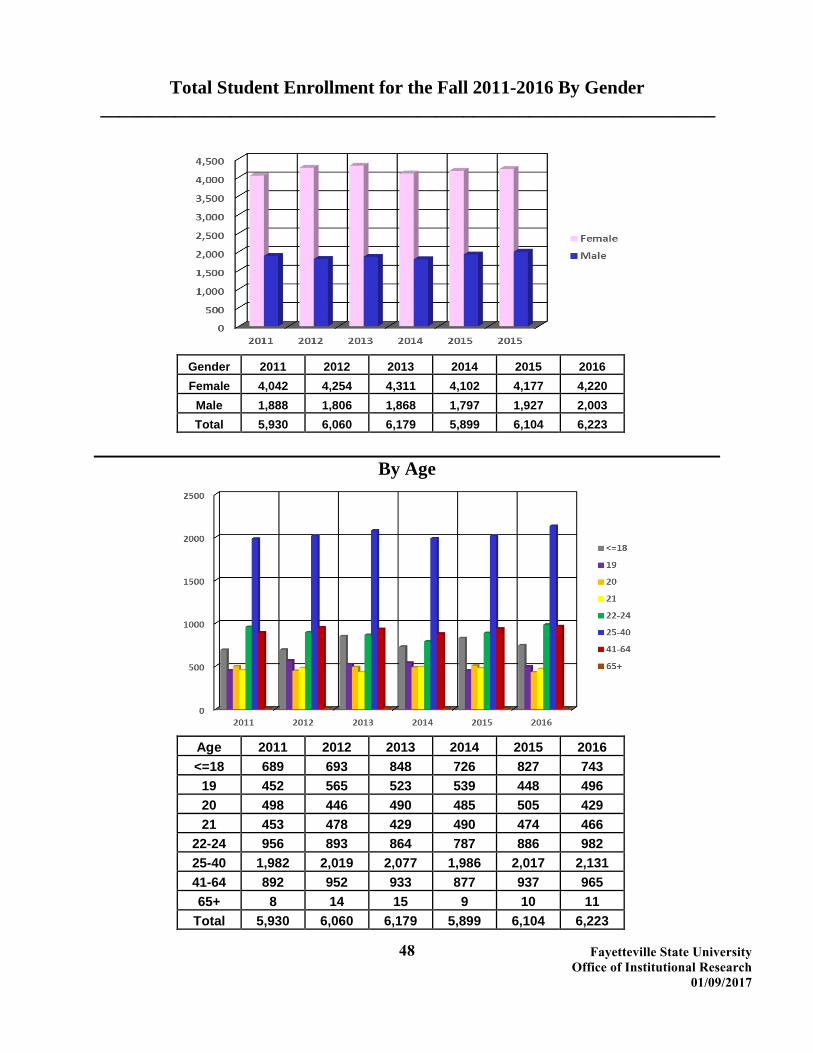
Total Student Enrollment: The total enrollment of 6,223 increased by 119 (2.0%) from Fall 2015. During Fall 2011 - Fall 2016 total enrollment ranged from 5,930 to 6,223.
Sixty-eight percent of the student population was female. Black enrollment was 62% and White individuals represented 21%. Ninety-six percent of the students were from North Carolina, 50% were non-traditional students over the age of 24, and 89% were undergraduates. Seventy-five percent of all students were commuters. The typical enrolled student was female (68%), under 25 (50%), in-state (96%), and Black (62%).
Degrees Awarded 2015-2016: Top three undergraduate degrees awarded were Nursing (153), Criminal Justice (129), and Psychology (127). The top three graduate degrees awarded were Master of Social Work (78), Master of School Administration (22), and Master of Business Administration (20).

Fall 2011 First-Time Freshmen Applied, Accepted, Enrolled
By Residency
Residency Applied Accepted Enrolled
In-State 2309 1543 604
Out-Of-State+ 753 427 51
Total 3062 1970 655
Fall 2011 First-Time Freshmen Applied, Accepted, Enrolled
By Gender
Gender Applied Accepted Enrolled
Male 1118 711 280
Female 1944 1259 375
Total 3062 1970 655
Fall 2011 First-Time Freshmen Applied, Accepted, Enrolled
By Race/Ethnicity
Race/Ethnicity Applied Accepted Enrolled
Non-Resident Alien 18 7 1
Race Unknown 134 80 21
Hispanic 107 83 36
Amer. Indian/Alaskan
Native 55 44 23
Asian 23 17 4
Black 2566 1600 532
Native Hawaiian/Pacific
Islander 3 2 0
White 123 107 30
Two or More 33 30 8
Total 3062 1970 655
Fall 2011 First-Time Freshmen Applied, Accepted, Enrolled
By Age
Age Applied Accepted Enrolled
<=18 2351 1603 493
19 568 283 111
20 54 25 18
21 12 6 3
22-24 21 10 7
25-40 43 33 19
41-64 13 10 4
Total 3062 1970 655
20
Fayetteville State University
Office of Institutional Research
01/09/2017

Fall 2011 First-Time Freshmen Applied, Accepted, Enrolled
By SAT Verbal
SAT Verbal Applied Accepted Enrolled
. Not Available 360 181 62
>200 & <=300 145 7 3
>300 & <=400 1153 591 245
>400 & <=500 1130 933 299
>500 & <=600 249 236 42
>600 & <=700 25 22 4
Total 3062 1970 655
Fall 2011 First-Time Freshmen Applied, Accepted, Enrolled
By SAT Math
SAT Math Applied Accepted Enrolled
. Not Available 358 181 62
>200 & <=300 107 1 1
>300 & <=400 967 388 170
>400 & <=500 1285 1074 347
>500 & <=600 323 305 68
>600 & <=700 22 21 7
Total 3062 1970 655
Fall 2011 First-Time Freshmen Applied, Accepted, Enrolled
By SAT Combined
SAT Combined Applied Accepted Enrolled
. Not Available 358 181 62
>400 & <=600 80 1 1
>600 & <=800 1045 393 193
>800 & <=1000 1329 1154 357
>1000 & <=1200 232 227 39
>1200 & <=1400 16 14 3
>1400 & <=1600 2 0 0
Total 3062 1970 655
Fall 2011 First-Time Freshmen Applied, Accepted, Enrolled
By ACT Composite
ACT Combined Applied Accepted Enrolled
12-17 321 131 61
18-23 200 177 40
24-29 20 20 2
30-36 1 1 0
Missing 2520 1641 552
Total 3062 1970 655
21Fayetteville State University
Office of Institutional Research
01/09/2017
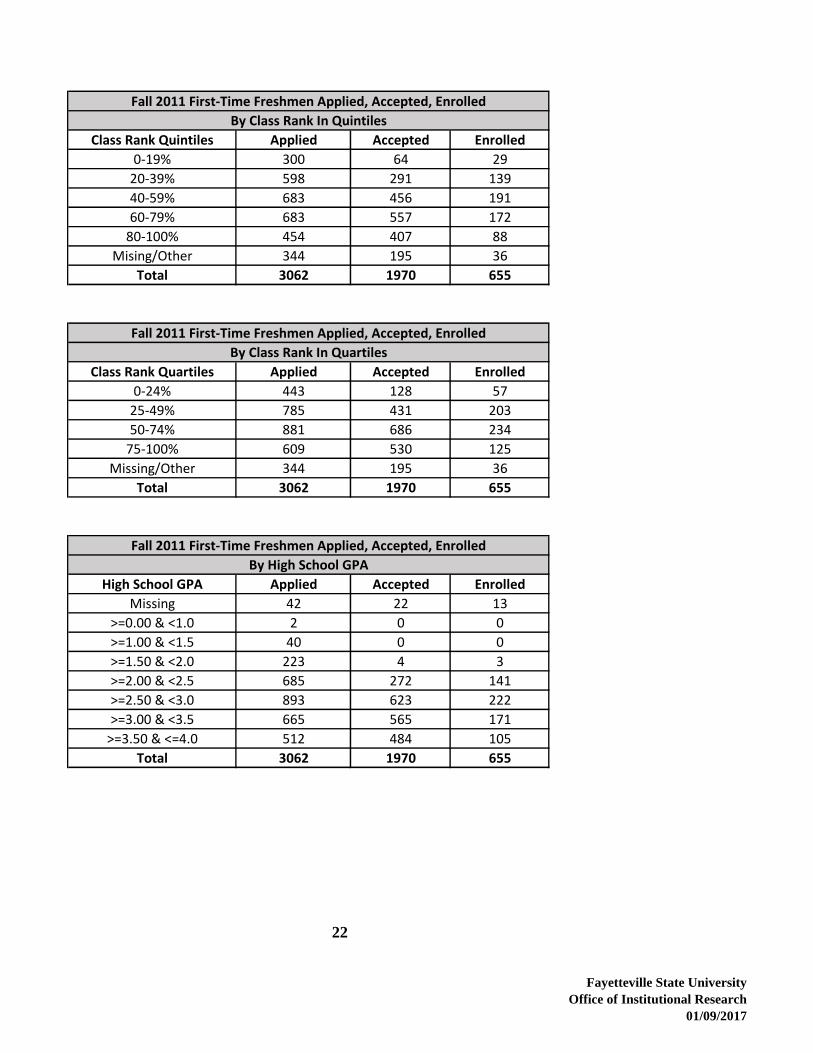
Fall 2011 First-Time Freshmen Applied, Accepted, Enrolled
By Class Rank In Quintiles
Class Rank Quintiles Applied Accepted Enrolled
0-19% 300 64 29
20-39% 598 291 139
40-59% 683 456 191
60-79% 683 557 172
80-100% 454 407 88
Mising/Other 344 195 36
Total 3062 1970 655
Fall 2011 First-Time Freshmen Applied, Accepted, Enrolled
By Class Rank In Quartiles
Class Rank Quartiles Applied Accepted Enrolled
0-24% 443 128 57
25-49% 785 431 203
50-74% 881 686 234
75-100% 609 530 125
Missing/Other 344 195 36
Total 3062 1970 655
Fall 2011 First-Time Freshmen Applied, Accepted, Enrolled
By High School GPA
High School GPA Applied Accepted Enrolled
Missing 42 22 13
>=0.00 & <1.0 2 0 0
>=1.00 & <1.5 40 0 0
>=1.50 & <2.0 223 4 3
>=2.00 & <2.5 685 272 141
>=2.50 & <3.0 893 623 222
>=3.00 & <3.5 665 565 171
>=3.50 & <=4.0 512 484 105
Total 3062 1970 655
22
Fayetteville State University
Office of Institutional Research
01/09/2017

Fall 2012 First-Time Freshmen Applied, Accepted, Enrolled
By Residency
Residency Applied Accepted Enrolled
In-State 2927 1701 573
Out-Of-State+ 1083 503 39
Total 4010 2204 612
Fall 2012 First-Time Freshmen Applied, Accepted, Enrolled
By Gender
Gender Applied Accepted Enrolled
Male 1417 709 236
Female 2593 1495 376
Total 4010 2204 612
Fall 2012 First-Time Freshmen Applied, Accepted, Enrolled
By Race/Ethnicity
Race/Ethnicity Applied Accepted Enrolled
Non-Resident Alien 26 18 2
Race Unknown 243 75 24
Hispanic 139 101 37
Amer. Indian/Alaskan
Native 93 54 13
Asian 25 21 7
Black 3302 1789 491
Native Hawaiian/Pacific
Islander 4 4 1
White 167 136 37
Two or More 11 6 0
Total 4010 2204 612
Fall 2012 First-Time Freshmen Applied, Accepted, Enrolled
By Age
Age Applied Accepted Enrolled
<=18 3046 1810 444
19 767 309 121
20 83 18 13
21 24 8 5
22-24 35 17 10
25-40 47 38 18
41-64 7 4 1
65+ 1 0 0
Total 4010 2204 612
23Fayetteville State University
Office of Institutional Research
01/09/2017
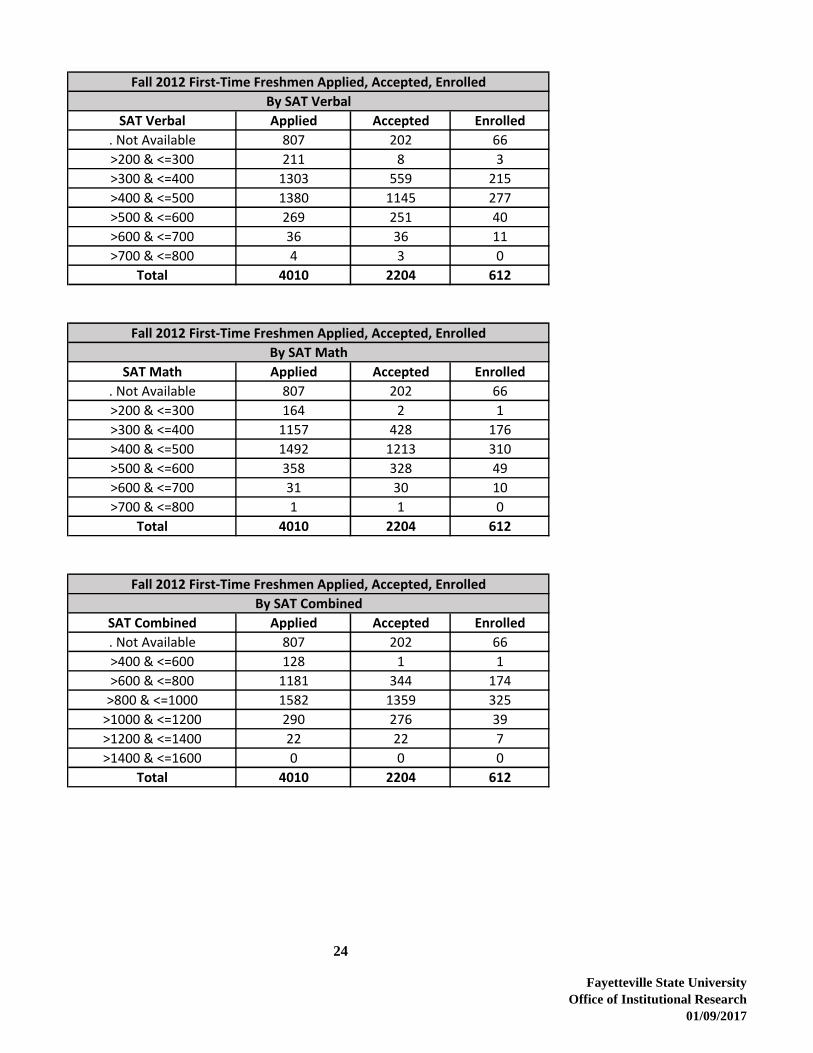
Fall 2012 First-Time Freshmen Applied, Accepted, Enrolled
By SAT Verbal
SAT Verbal Applied Accepted Enrolled
. Not Available 807 202 66
>200 & <=300 211 8 3
>300 & <=400 1303 559 215
>400 & <=500 1380 1145 277
>500 & <=600 269 251 40
>600 & <=700 36 36 11
>700 & <=800 4 3 0
Total 4010 2204 612
Fall 2012 First-Time Freshmen Applied, Accepted, Enrolled
By SAT Math
SAT Math Applied Accepted Enrolled
. Not Available 807 202 66
>200 & <=300 164 2 1
>300 & <=400 1157 428 176
>400 & <=500 1492 1213 310
>500 & <=600 358 328 49
>600 & <=700 31 30 10
>700 & <=800 1 1 0
Total 4010 2204 612
Fall 2012 First-Time Freshmen Applied, Accepted, Enrolled
By SAT Combined
SAT Combined Applied Accepted Enrolled
. Not Available 807 202 66
>400 & <=600 128 1 1
>600 & <=800 1181 344 174
>800 & <=1000 1582 1359 325
>1000 & <=1200 290 276 39
>1200 & <=1400 22 22 7
>1400 & <=1600 0 0 0
Total 4010 2204 612
24
Fayetteville State University
Office of Institutional Research
01/09/2017

Fall 2012 First-Time Freshmen Applied, Accepted, Enrolled
By ACT Composite
ACT Composite Applied Accepted Enrolled
6-11 4 0 0
12-17 161 45 15
18-23 118 98 25
24-29 15 12 3
30-36 0 0 0
Missing 3712 2049 569
Total 4010 2204 612
Fall 2012 First-Time Freshmen Applied, Accepted, Enrolled
By Class Rank In Quintiles
Class Rank Quintiles Applied Accepted Enrolled
0-19% 485 69 26
20-39% 782 257 113
40-59% 833 549 197
60-79% 737 565 167
80-100% 558 494 76
Mising/Other 615 270 33
Total 4010 2204 612
Fall 2012 First-Time Freshmen Applied, Accepted, Enrolled
By Class Rank In Quartiles
Class Rank Quartiles Applied Accepted Enrolled
0-24% 665 102 45
25-49% 1037 496 205
50-74% 959 698 217
75-100% 734 638 112
Missing/Other 615 270 33
Total 4010 2204 612
25Fayetteville State University
Office of Institutional Research
01/09/2017

Fall 2012 First-Time Freshmen Applied, Accepted, Enrolled
By High School GPA
High School GPA Applied Accepted Enrolled
Missing 112 28 14
>=0.00 & <1.0 5 0 0
>=1.00 & <1.5 79 1 1
>=1.50 & <2.0 459 8 3
>=2.00 & <2.5 1000 284 136
>=2.50 & <3.0 995 689 214
>=3.00 & <3.5 725 593 142
>=3.50 & <=4.0 635 601 102
Total 4010 2204 612
26Fayetteville State University
Office of Institutional Research
01/09/2017

Fall 2013 First-Time Freshmen Applied, Accepted, Enrolled
By Residency
Residency Applied Accepted Enrolled
In-State 3265 2043 652
Out-Of-State+ 841 453 55
Total 4106 2496 707
Fall 2013 First-Time Freshmen Applied, Accepted, Enrolled
By Gender
Gender Applied Accepted Enrolled
Male 1435 801 249
Female 2671 1695 458
Total 4106 2496 707
Fall 2013 First-Time Freshmen Applied, Accepted, Enrolled
By Race/Ethnicity
Race/Ethnicity Applied Accepted Enrolled
Non-Resident Alien 34 18 5
Race Unknown 155 84 24
Hispanic 160 114 29
Amer. Indian/Alaskan
Native 114 64 19
Asian 27 19 5
Black 3414 2032 585
Native Hawaiian/Pacific
Islander 4 2 1
White 193 160 39
Two or More 5 3 0
Total 4106 2496 707
Fall 2013 First-Time Freshmen Applied, Accepted, Enrolled
By Age
Age Applied Accepted Enrolled
<=18 3151 2040 532
19 768 352 128
20 91 33 10
21 20 10 8
22-24 26 16 9
25-40 43 38 19
41-64 7 7 1
65+ 0 0 0
Total 4106 2496 707
27Fayetteville State University
Office of Institutional Research
01/09/2017
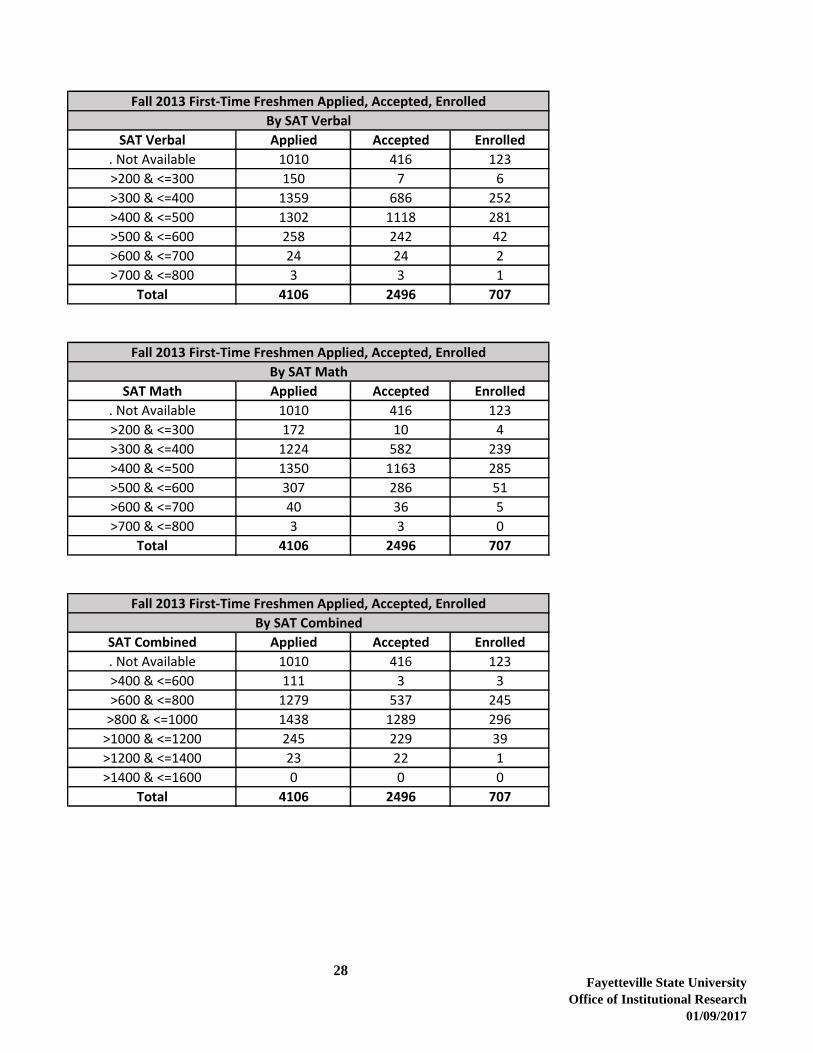
Fall 2013 First-Time Freshmen Applied, Accepted, Enrolled
By SAT Verbal
SAT Verbal Applied Accepted Enrolled
. Not Available 1010 416 123
>200 & <=300 150 7 6
>300 & <=400 1359 686 252
>400 & <=500 1302 1118 281
>500 & <=600 258 242 42
>600 & <=700 24 24 2
>700 & <=800 3 3 1
Total 4106 2496 707
Fall 2013 First-Time Freshmen Applied, Accepted, Enrolled
By SAT Math
SAT Math Applied Accepted Enrolled
. Not Available 1010 416 123
>200 & <=300 172 10 4
>300 & <=400 1224 582 239
>400 & <=500 1350 1163 285
>500 & <=600 307 286 51
>600 & <=700 40 36 5
>700 & <=800 3 3 0
Total 4106 2496 707
Fall 2013 First-Time Freshmen Applied, Accepted, Enrolled
By SAT Combined
SAT Combined Applied Accepted Enrolled
. Not Available 1010 416 123
>400 & <=600 111 3 3
>600 & <=800 1279 537 245
>800 & <=1000 1438 1289 296
>1000 & <=1200 245 229 39
>1200 & <=1400 23 22 1
>1400 & <=1600 0 0 0
Total 4106 2496 707
28Fayetteville State University
Office of Institutional Research
01/09/2017

Fall 2013 First-Time Freshmen Applied, Accepted, Enrolled
By ACT Composite
ACT Composite Applied Accepted Enrolled
6-11 24 1 1
12-17 378 141 41
18-23 219 196 50
24-29 20 20 5
30-36 1 1 0
Missing 3464 2137 610
Total 4106 2496 707
Fall 2013 First-Time Freshmen Applied, Accepted, Enrolled
By Class Rank In Quintiles
Class Rank Quintiles Applied Accepted Enrolled
0-19% 474 78 40
20-39% 832 353 152
40-59% 959 646 236
60-79% 840 678 154
80-100% 576 521 91
Mising/Other 425 220 34
Total 4106 2496 707
Fall 2013 First-Time Freshmen Applied, Accepted, Enrolled
By Class Rank In Quartiles
Class Rank Quartiles Applied Accepted Enrolled
0-24% 664 125 66
25-49% 1129 625 254
50-74% 1130 847 238
75-100% 758 679 115
Missing/Other 425 220 34
Total 4106 2496 707
29Fayetteville State University
Office of Institutional Research
01/09/2017

Fall 2013 First-Time Freshmen Applied, Accepted, Enrolled
By High School GPA
High School GPA Applied Accepted Enrolled
Missing 68 30 12
>=0.00 & <1.0 2 0 0
>=1.00 & <1.5 89 2 2
>=1.50 & <2.0 431 7 5
>=2.00 & <2.5 808 298 154
>=2.50 & <3.0 1115 761 233
>=3.00 & <3.5 893 731 184
>=3.50 & <=4.0 700 667 117
Total 4106 2496 707
30Fayetteville State University
Office of Institutional Research
01/09/2017

Fall 2014 First-Time Freshmen Applied, Accepted, Enrolled
By Residency
Residency Applied Accepted Enrolled
In-State 3350 1634 443
Out-Of-State+ 760 434 33
Total 4110 2068 476
Fall 2014 First-Time Freshmen Applied, Accepted, Enrolled
By Gender
Gender Applied Accepted Enrolled
Male 1392 635 158
Female 2718 1433 318
Total 4110 2068 476
Fall 2014 First-Time Freshmen Applied, Accepted, Enrolled
By Race/Ethnicity
Race/Ethnicity Applied Accepted Enrolled
Non-Resident Alien 16 8 0
Race Unknown 182 97 14
Hispanic 197 121 30
Amer. Indian/Alaskan
Native 119 54 20
Asian 35 27 7
Black 3363 1609 370
Native Hawaiian/Pacific
Islander 4 1 0
White 189 150 35
Two or More 5 1 0
Total 4110 2068 476
Fall 2014 First-Time Freshmen Applied, Accepted, Enrolled
By Age
Age Applied Accepted Enrolled
<=18 3124 1683 345
19 842 312 88
20 80 39 16
21 16 5 4
22-24 14 8 7
25-40 30 19 14
41-64 4 2 2
65+ 0 0 0
Total 4110 2068 476
31Fayetteville State University
Office of Institutional Research
01/09/2017

Fall 2014 First-Time Freshmen Applied, Accepted, Enrolled
By SAT Verbal
SAT Verbal Applied Accepted Enrolled
. Not Available 1303 542 140
>200 & <=300 160 4 2
>300 & <=400 1197 365 103
>400 & <=500 1173 897 184
>500 & <=600 246 229 38
>600 & <=700 30 30 8
>700 & <=800 1 1 1
Total 4110 2068 476
Fall 2014 First-Time Freshmen Applied, Accepted, Enrolled
By SAT Math
SAT Math Applied Accepted Enrolled
. Not Available 1303 542 140
>200 & <=300 176 4 2
>300 & <=400 1084 281 77
>400 & <=500 1235 954 200
>500 & <=600 276 251 50
>600 & <=700 34 34 7
>700 & <=800 2 2 0
Total 4110 2068 476
Fall 2014 First-Time Freshmen Applied, Accepted, Enrolled
By SAT Combined
SAT Combined Applied Accepted Enrolled
. Not Available 1303 542 140
>400 & <=600 121 1 1
>600 & <=800 1105 161 55
>800 & <=1000 1314 1110 230
>1000 & <=1200 242 229 43
>1200 & <=1400 23 23 6
>1400 & <=1600 2 2 1
Total 4110 2068 476
32Fayetteville State University
Office of Institutional Research
01/09/2017
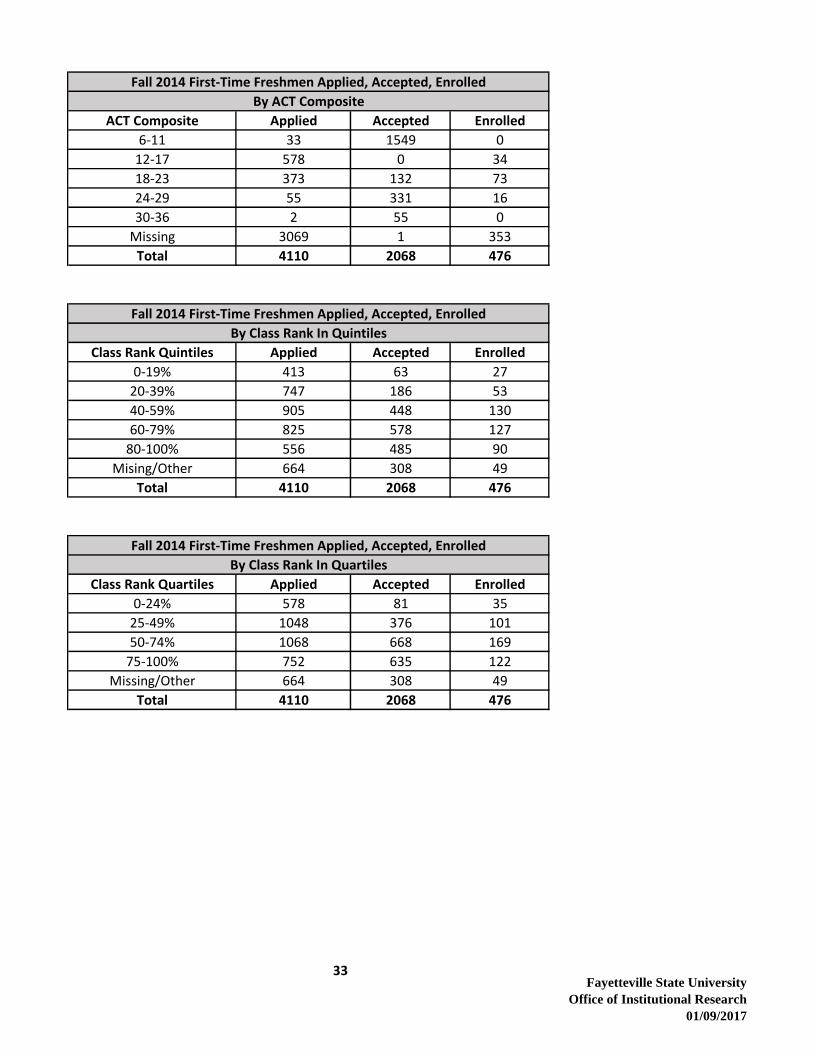
Fall 2014 First-Time Freshmen Applied, Accepted, Enrolled
By ACT Composite
ACT Composite Applied Accepted Enrolled
6-11 33 1549 0
12-17 578 0 34
18-23 373 132 73
24-29 55 331 16
30-36 2 55 0
Missing 3069 1 353
Total 4110 2068 476
Fall 2014 First-Time Freshmen Applied, Accepted, Enrolled
By Class Rank In Quintiles
Class Rank Quintiles Applied Accepted Enrolled
0-19% 413 63 27
20-39% 747 186 53
40-59% 905 448 130
60-79% 825 578 127
80-100% 556 485 90
Mising/Other 664 308 49
Total 4110 2068 476
Fall 2014 First-Time Freshmen Applied, Accepted, Enrolled
By Class Rank In Quartiles
Class Rank Quartiles Applied Accepted Enrolled
0-24% 578 81 35
25-49% 1048 376 101
50-74% 1068 668 169
75-100% 752 635 122
Missing/Other 664 308 49
Total 4110 2068 476
33Fayetteville State University
Office of Institutional Research
01/09/2017
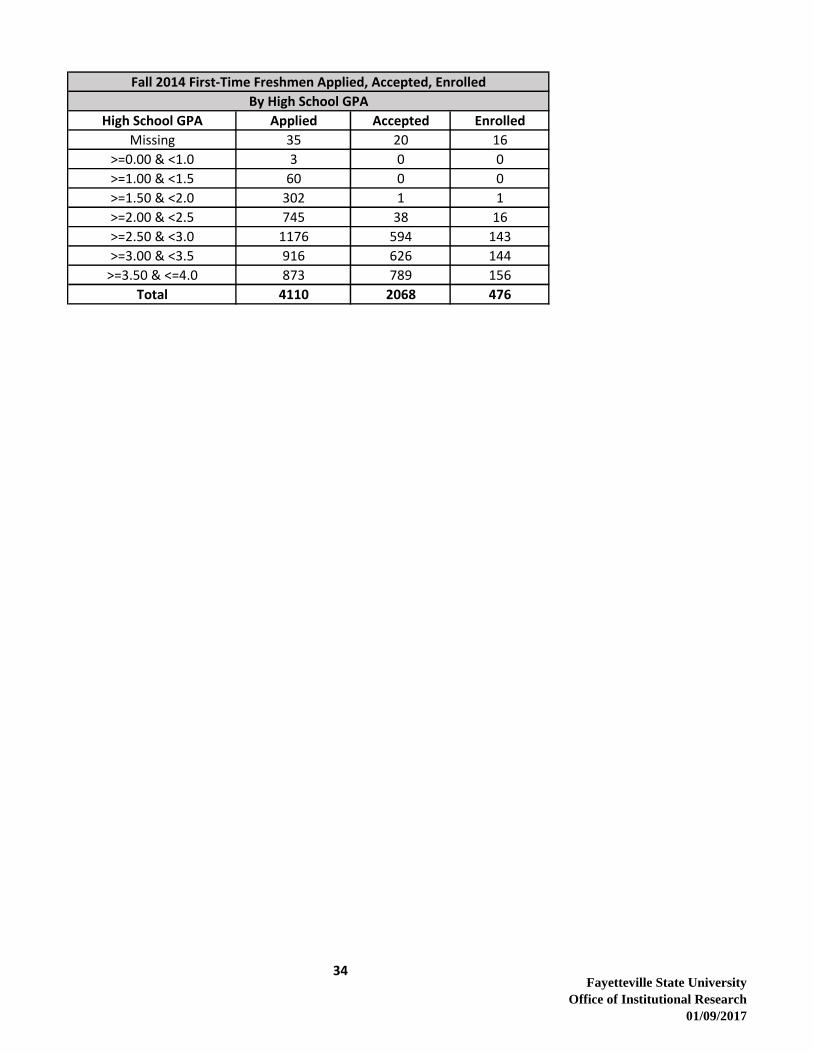
Fall 2014 First-Time Freshmen Applied, Accepted, Enrolled
By High School GPA
High School GPA Applied Accepted Enrolled
Missing 35 20 16
>=0.00 & <1.0 3 0 0
>=1.00 & <1.5 60 0 0
>=1.50 & <2.0 302 1 1
>=2.00 & <2.5 745 38 16
>=2.50 & <3.0 1176 594 143
>=3.00 & <3.5 916 626 144
>=3.50 & <=4.0 873 789 156
Total 4110 2068 476
34Fayetteville State University
Office of Institutional Research
01/09/2017

Fall 2015 First-Time Freshmen Applied, Accepted, Enrolled
By Residency
Residency Applied Accepted Enrolled
In-State 3111 2018 595
Out-Of-State+ 943 457 36
Total 4054 2475 631
Fall 2015 First-Time Freshmen Applied, Accepted, Enrolled
By Gender
Gender Applied Accepted Enrolled
Male 1458 822 242
Female 2596 1653 389
Total 4054 2475 631
Fall 2015 First-Time Freshmen Applied, Accepted, Enrolled
By Race/Ethnicity
Race/Ethnicity Applied Accepted Enrolled
Non-Resident Alien 70 56 0
Race Unknown 189 103 25
Hispanic 194 145 35
Amer. Indian/Alaskan
Native 107 65 22
Asian 34 27 6
Black 3256 1909 512
Native Hawaiian/Pacific
Islander 3 2 2
White 178 152 28
Two or More 23 16 1
Total 4054 2475 631
Fall 2015 First-Time Freshmen Applied, Accepted, Enrolled
By Age
Age Applied Accepted Enrolled
<=18 3062 1937 445
19 742 358 125
20 94 56 26
21 16 11 3
22-24 42 30 8
25-40 77 65 21
41-64 20 17 3
65+ 1 1 0
Total 4054 2475 631
35Fayetteville State University
Office of Institutional Research
01/09/2017

Fall 2015 First-Time Freshmen Applied, Accepted, Enrolled
By SAT Verbal
SAT Verbal Applied Accepted Enrolled
. Not Available 1497 910 238
>200 & <=300 149 3 0
>300 & <=400 1123 476 151
>400 & <=500 1056 879 204
>500 & <=600 205 188 35
>600 & <=700 23 18 2
>700 & <=800 1 1 1
Total 4054 2475 631
Fall 2015 First-Time Freshmen Applied, Accepted, Enrolled
By SAT Math
SAT Math Applied Accepted Enrolled
. Not Available 1497 910 238
>200 & <=300 131 3 0
>300 & <=400 997 362 120
>400 & <=500 1133 927 222
>500 & <=600 269 248 49
>600 & <=700 27 25 2
>700 & <=800 0 0 0
Total 4054 2475 631
Fall 2015 First-Time Freshmen Applied, Accepted, Enrolled
By SAT Combined
SAT Combined Applied Accepted Enrolled
. Not Available 1497 910 238
>400 & <=600 91 0 0
>600 & <=800 1046 314 117
>800 & <=1000 1190 1037 242
>1000 & <=1200 216 202 32
>1200 & <=1400 14 12 2
>1400 & <=1600 0 0 0
Total 4054 2475 631
36Fayetteville State University
Office of Institutional Research
01/09/2017

Fall 2015 First-Time Freshmen Applied, Accepted, Enrolled
By ACT Composite
ACT Composite Applied Accepted Enrolled
6-11 54 0 3
12-17 752 305 199
18-23 465 420 135
24-29 77 72 12
30-36 5 5 1
Missing 2701 1673 281
Total 4054 2475 631
Fall 2015 First-Time Freshmen Applied, Accepted, Enrolled
By Class Rank In Quintiles
Class Rank Quintiles Applied Accepted Enrolled
0-19% 335 53 24
20-39% 730 249 92
40-59% 1018 628 190
60-79% 918 722 187
80-100% 633 567 92
Mising/Other 420 256 46
Total 4054 2475 631
Fall 2015 First-Time Freshmen Applied, Accepted, Enrolled
By Class Rank In Quartiles
Class Rank Quartiles Applied Accepted Enrolled
0-24% 484 92 43
25-49% 1087 493 165
50-74% 1217 884 251
75-100% 846 750 126
Missing/Other 420 256 46
Total 4054 2475 631
37Fayetteville State University
Office of Institutional Research
01/09/2017

Fall 2015 First-Time Freshmen Applied, Accepted, Enrolled
By High School GPA
High School GPA Applied Accepted Enrolled
Missing 94 78 16
>=0.00 & <1.0 2 0 0
>=1.00 & <1.5 35 2 1
>=1.50 & <2.0 210 3 0
>=2.00 & <2.5 693 58 29
>=2.50 & <3.0 1186 699 215
>=3.00 & <3.5 955 796 213
>=3.50 & <=4.0 599 560 112
Error>4.0 280 279 45
Total 4054 2475 631
38Fayetteville State University
Office of Institutional Research
01/09/2017
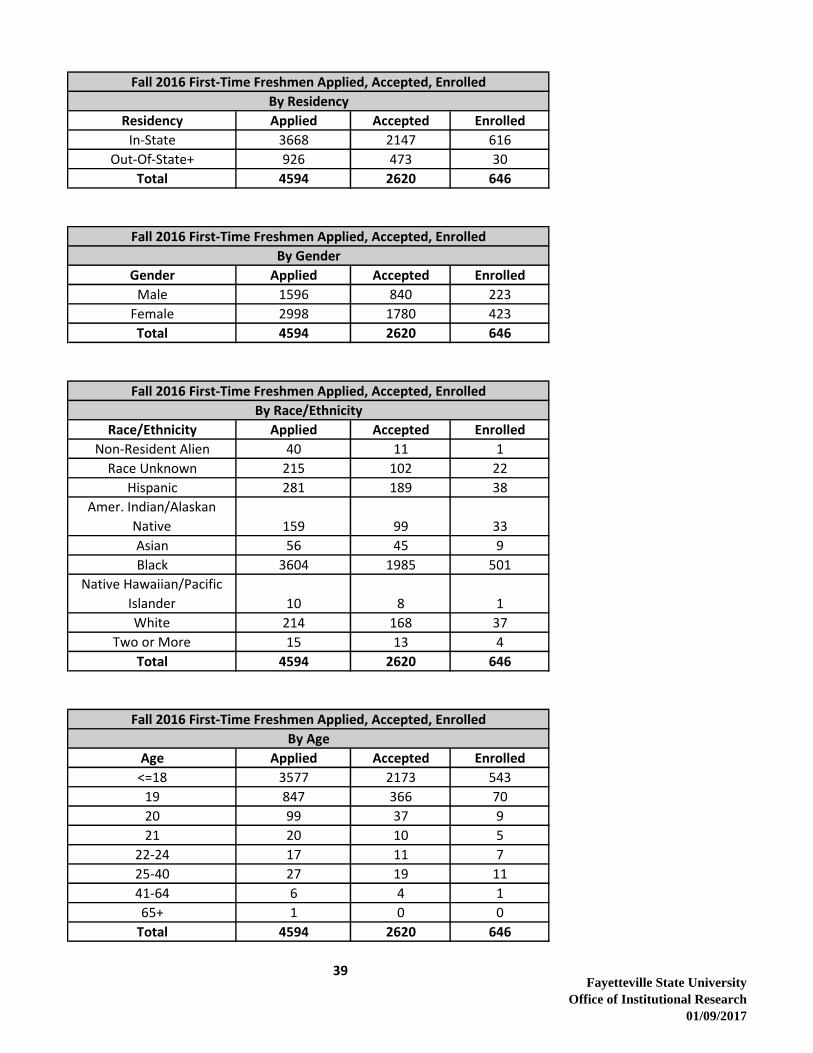
Fall 2016 First-Time Freshmen Applied, Accepted, Enrolled
By Residency
Residency Applied Accepted Enrolled
In-State 3668 2147 616
Out-Of-State+ 926 473 30
Total 4594 2620 646
Fall 2016 First-Time Freshmen Applied, Accepted, Enrolled
By Gender
Gender Applied Accepted Enrolled
Male 1596 840 223
Female 2998 1780 423
Total 4594 2620 646
Fall 2016 First-Time Freshmen Applied, Accepted, Enrolled
By Race/Ethnicity
Race/Ethnicity Applied Accepted Enrolled
Non-Resident Alien 40 11 1
Race Unknown 215 102 22
Hispanic 281 189 38
Amer. Indian/Alaskan
Native 159 99 33
Asian 56 45 9
Black 3604 1985 501
Native Hawaiian/Pacific
Islander 10 8 1
White 214 168 37
Two or More 15 13 4
Total 4594 2620 646
Fall 2016 First-Time Freshmen Applied, Accepted, Enrolled
By Age
Age Applied Accepted Enrolled
<=18 3577 2173 543
19 847 366 70
20 99 37 9
21 20 10 5
22-24 17 11 7
25-40 27 19 11
41-64 6 4 1
65+ 1 0 0
Total 4594 2620 646
39Fayetteville State University
Office of Institutional Research
01/09/2017

Fall 2016 First-Time Freshmen Applied, Accepted, Enrolled
By SAT Verbal
SAT Verbal Applied Accepted Enrolled
. Not Available 1849 945 265
>200 & <=300 198 20 7
>300 & <=400 1126 468 155
>400 & <=500 1151 937 181
>500 & <=600 229 210 30
>600 & <=700 38 37 8
>700 & <=800 3 3 0
Total 4594 2620 646
Fall 2016 First-Time Freshmen Applied, Accepted, Enrolled
By SAT Math
SAT Math Applied Accepted Enrolled
. Not Available 1849 945 265
>200 & <=300 179 25 12
>300 & <=400 1115 423 132
>400 & <=500 1174 973 194
>500 & <=600 241 222 41
>600 & <=700 33 30 2
>700 & <=800 3 2 0
Total 4594 2620 646
Fall 2016 First-Time Freshmen Applied, Accepted, Enrolled
By SAT Combined
SAT Combined Applied Accepted Enrolled
. Not Available 1849 945 265
>400 & <=600 125 9 3
>600 & <=800 1115 345 140
>800 & <=1000 1269 1104 207
>1000 & <=1200 207 189 26
>1200 & <=1400 28 27 5
>1400 & <=1600 1 1 0
Total 4594 2620 646
40Fayetteville State University
Office of Institutional Research
01/09/2017

Fall 2016 First-Time Freshmen Applied, Accepted, Enrolled
By ACT Composite
ACT Composite Applied Accepted Enrolled
6-11 35 0 2
12-17 758 270 198
18-23 617 526 181
24-29 95 84 25
30-36 9 9 3
Missing 3080 1731 237
Total 4594 2620 646
Fall 2016 First-Time Freshmen Applied, Accepted, Enrolled
By Class Rank In Quintiles
Class Rank Quintiles Applied Accepted Enrolled
0-19% 211 41 11
20-39% 450 156 75
40-59% 568 338 118
60-79% 548 408 126
80-100% 385 324 80
Mising/Other 2432 1353 236
Total 4594 2620 646
Fall 2016 First-Time Freshmen Applied, Accepted, Enrolled
By Class Rank In Quartiles
Class Rank Quartiles Applied Accepted Enrolled
0-24% 301 61 21
25-49% 653 289 122
50-74% 705 496 160
75-100% 503 421 107
Missing/Other 2432 1353 236
Total 4594 2620 246
41Fayetteville State University
Office of Institutional Research
01/09/2017

Fall 2016 First-Time Freshmen Applied, Accepted, Enrolled
By High School GPA
High School GPA Applied Accepted Enrolled
Missing 23 11 6
>=0.00 & <1.0 9 0 0
>=1.00 & <1.5 50 0 0
>=1.50 & <2.0 272 3 0
>=2.00 & <2.5 747 50 26
>=2.50 & <3.0 1249 693 173
>=3.00 & <3.5 1069 812 205
>=3.50 & <=4.0 1175 1051 236
Total 4594 2620 646
42Fayetteville State University
Office of Institutional Research
01/09/2017
43 Fayetteville State University
Office of Institutional
Research 01/09/2017
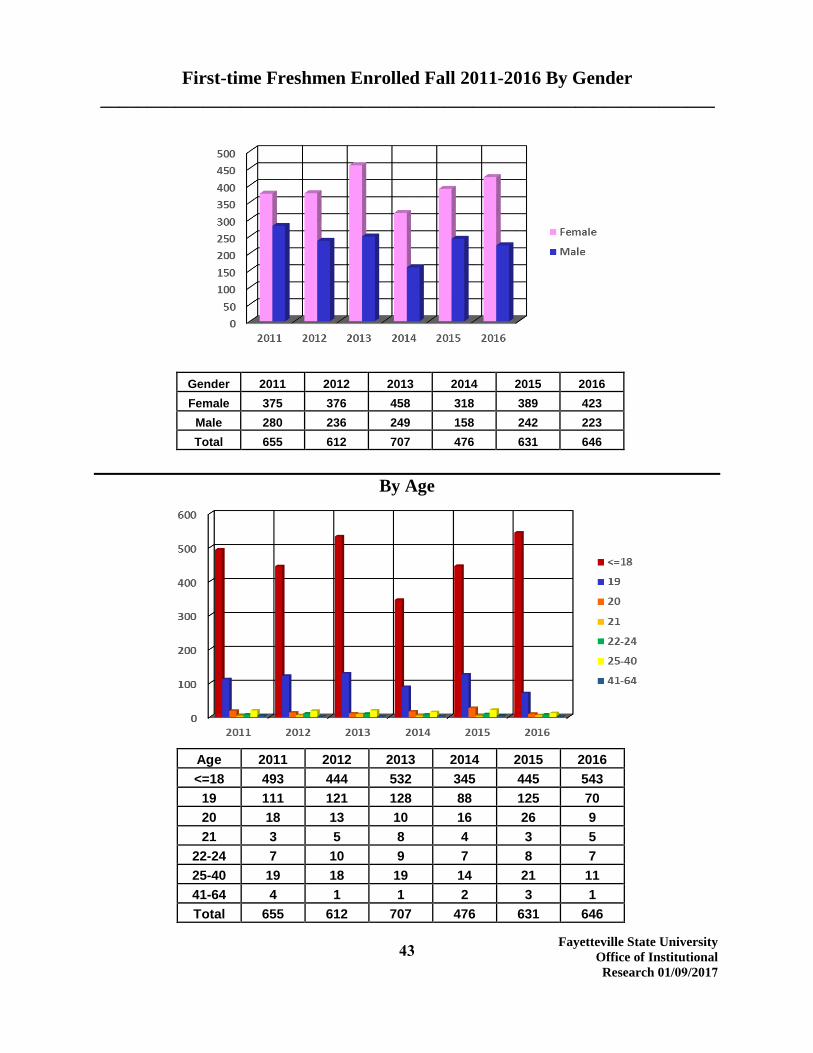
First-time Freshmen Enrolled Fall 2011-2016 By Gender
__________________________________________________________________
Gender 2011 2012 2013 2014 2015 2016
Female 375 376 458 318 389 423
Male 280 236 249 158 242 223
Total 655 612 707 476 631 646
By Age
Age 2011 2012 2013 2014 2015 2016
<=18 493 444 532 345 445 543
19 111 121 128 88 125 70
20 18 13 10 16 26 9
21 3 5 8 4 3 5
22-24 7 10 9 7 8 7
25-40 19 18 19 14 21 11
41-64 4 1 1 2 3 1
Total 655 612 707 476 631 646

44Fayetteville State University
Office of Institutional Research 01/09/2017
First-time Freshmen Enrolled Fall 2011-2016 By Residency
_____________________________________________________________
Residency 2011 2012 2013 2014 2015 2016
In-State 604 573 652 443 595 616
Out-of-State 51 39 55 33 36 30
Total 655 612 707 476 631 646
By Race
Race 2011 2012 2013 2014 2015 2016
White 30 37 39 35 28 37
Black 532 491 585 370 512 501
American Indian 23 13 19 20 22 33
Asian 4 7 5 7 6 9
Hispanic 36 37 29 30 35 38
NR Alien 1 2 5 0 0 1
Two or More Races 8 0 0 0 1 4
Native Hawaiian/Other Pacific Islander 0 1 1 0 2 1
Race/Ethnicity Unknown 21 24 24 14 25 22
Total 655 612 707 476 631 646
45Fayetteville State University
Office of Institutional Research 01/09/2017
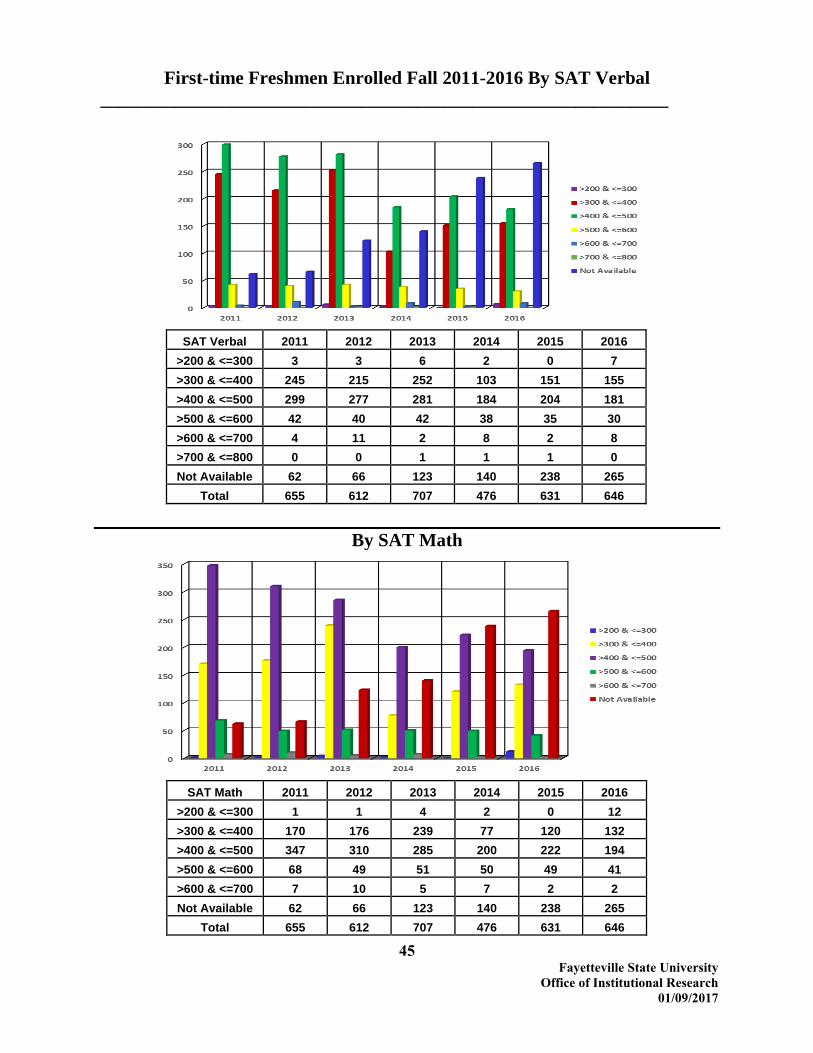
First-time Freshmen Enrolled Fall 2011-2016 By SAT Verbal
_____________________________________________________________
SAT Verbal 2011 2012 2013 2014 2015 2016
>200 & <=300 3 3 6 2 0 7
>300 & <=400 245 215 252 103 151 155
>400 & <=500 299 277 281 184 204 181
>500 & <=600 42 40 42 38 35 30
>600 & <=700 4 11 2 8 2 8
>700 & <=800 0 0 1 1 1 0
Not Available 62 66 123 140 238 265
Total 655 612 707 476 631 646
By SAT Math
SAT Math 2011 2012 2013 2014 2015 2016
>200 & <=300 1 1 4 2 0 12
>300 & <=400 170 176 239 77 120 132
>400 & <=500 347 310 285 200 222 194
>500 & <=600 68 49 51 50 49 41
>600 & <=700 7 10 5 7 2 2
Not Available 62 66 123 140 238 265
Total 655 612 707 476 631 646

46Fayetteville State University
Office of Institutional Research 01/09/2017
First-time Freshmen Enrolled Fall 2011-2016 By SAT Combined
________________________________________________________________
SAT Combined 2011 2012 2013 2014 2015 2016
>400 & <=600 1 1 3 1 0 3
>600 & <=800 193 174 245 55 117 140
>800 & <=1000 357 325 296 230 242 207
>1000 & <=1200 39 39 39 43 32 26
>1200 & <=1400 3 7 1 6 2 5
>1400 & <=1600 0 0 0 1 0 0
Not Available 62 66 123 140 238 265
Total 655 612 707 476 631 646
Average SAT 861 860 843 889 853 851
By High School GPA
High School GPA 2011 2012 2013 2014 2015 2016
>=1.00 & <=1.5 0 0 2 0 1 0
>=1.51 & <=2.0 3 16 5 1 0 0
>=2.01 & <=2.5 141 119 154 16 29 26
>=2.51 & <=3.0 222 291 233 143 215 173
>=3.01 &<=3.5 171 146 184 144 213 205
>=3.51 & <=4.0 105 40 117 156 112 236
Missing 13 0 12 16 16 6
Error>4.0 0 0 0 0 45 0
Total 655 612 707 476 631 646
Average HS GPA 2.92 2.94 2.95 3.25 3.18 3.30

47Fayetteville State University
Office of Institutional Research 01/09/2017
First-time Freshmen Enrolled Fall 2011-2016 By High School Class Rank in
Quintiles
__________________________________________________________________
0-19%
20-39%
40-59%
60-79%
80-100%
Missing/Other
By High School Class Rank in Quartiles
Quartile Rank 2011 2012 2013 2014 2015 2016
0-24% 57 45 66 35 43 21
25-49% 203 205 254 101 165 122
50-74% 234 217 238 169 251 160
75-100% 125 112 115 122 126 107
Missing/Other 36 33 34 49 46 236
Total 655 612 707 476 631 646
Quintile Rank 2011 2012 2013 2014 2015 2016
0-19% 29 26 40 27 24 11
20-39% 139 113 152 53 92 75
40-59% 191 197 236 130 190 118
60-79% 172 167 154 127 187 126
80-100% 88 76 91 90 92 80
Missing/Other 36 33 34 49 46 236
Total 655 612 707 476 631 646
48 Fayetteville State University Office of Institutional Research
01/09/2017
Total Student Enrollment for the Fall 2011-2016 By Gender __________________________________________________________________
Gender 2011 2012 2013 2014 2015 2016 Female 4,042 4,254 4,311 4,102 4,177 4,220
Male 1,888 1,806 1,868 1,797 1,927 2,003 Total 5,930 6,060 6,179 5,899 6,104 6,223
By Age
Age 2011 2012 2013 2014 2015 2016 <=18 689 693 848 726 827 743
19 452 565 523 539 448 496 20 498 446 490 485 505 429 21 453 478 429 490 474 466
22-24 956 893 864 787 886 982 25-40 1,982 2,019 2,077 1,986 2,017 2,131 41-64 892 952 933 877 937 965 65+ 8 14 15 9 10 11
Total 5,930 6,060 6,179 5,899 6,104 6,223
49 Fayetteville State University Office of Institutional Research
01/09/2017
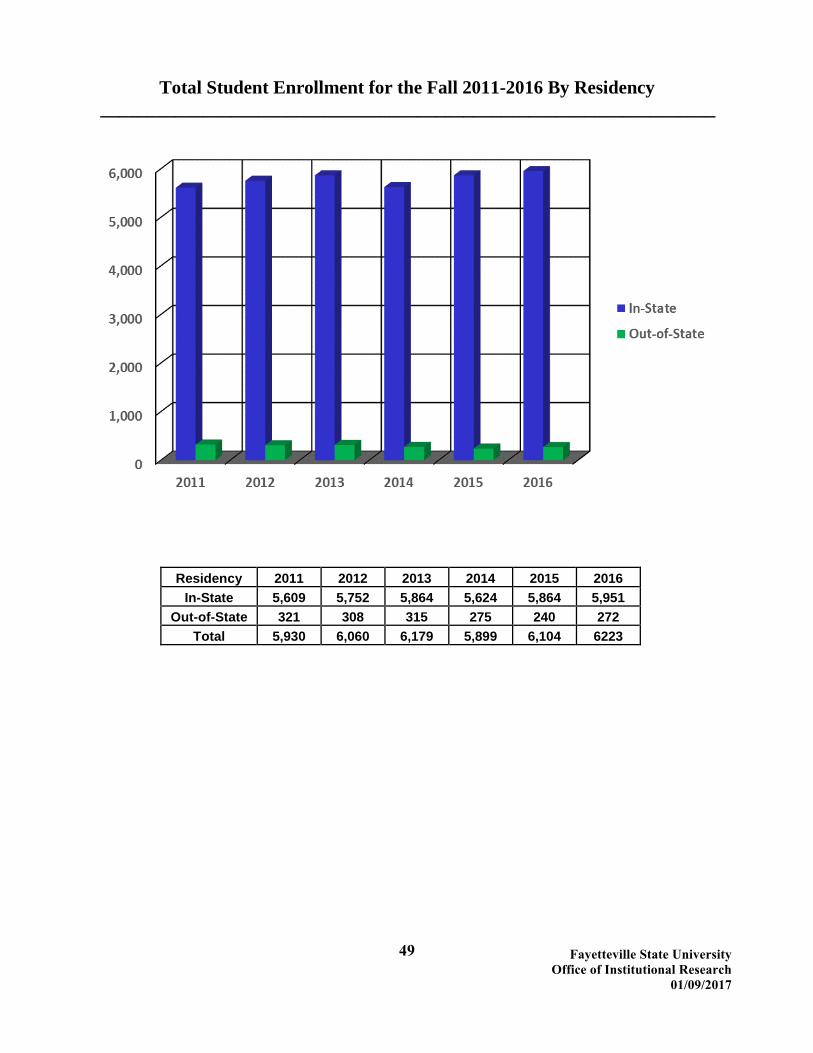
Total Student Enrollment for the Fall 2011-2016 By Residency __________________________________________________________________
Residency 2011 2012 2013 2014 2015 2016 In-State 5,609 5,752 5,864 5,624 5,864 5,951
Out-of-State 321 308 315 275 240 272 Total 5,930 6,060 6,179 5,899 6,104 6223
50 Fayetteville State University Office of Institutional Research
01/09/2017
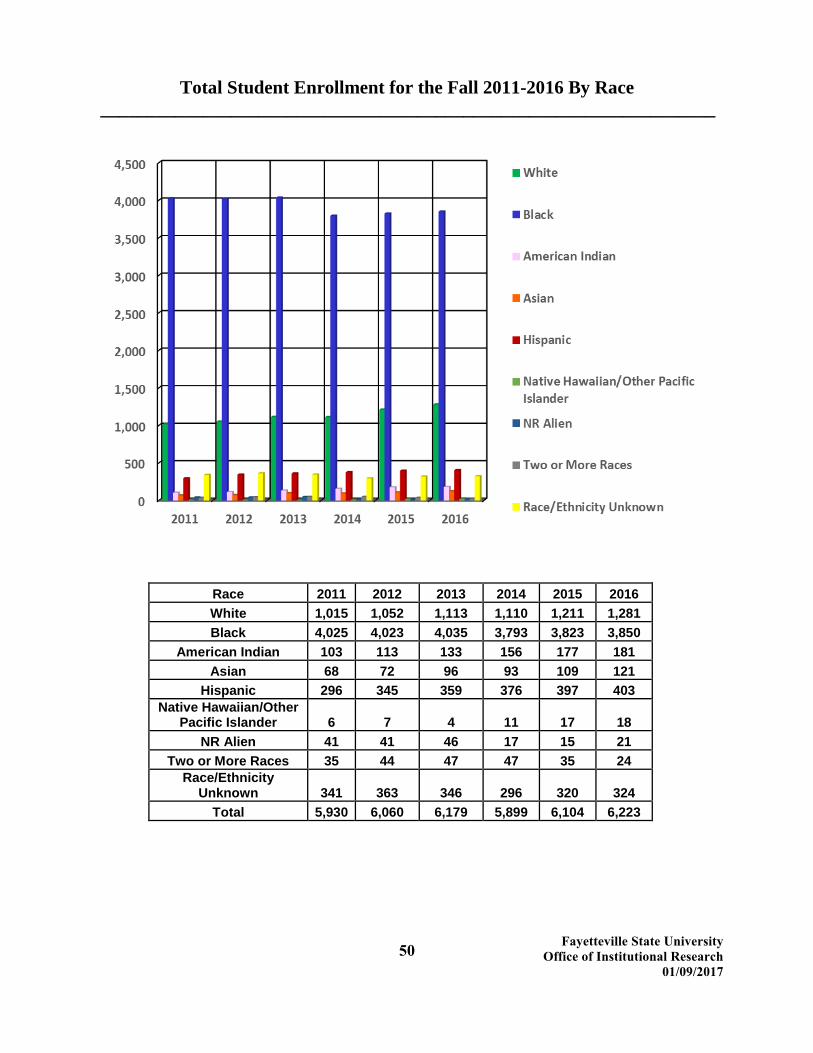
Total Student Enrollment for the Fall 2011-2016 By Race __________________________________________________________________
Race 2011 2012 2013 2014 2015 2016 White 1,015 1,052 1,113 1,110 1,211 1,281 Black 4,025 4,023 4,035 3,793 3,823 3,850
American Indian 103 113 133 156 177 181 Asian 68 72 96 93 109 121
Hispanic 296 345 359 376 397 403 Native Hawaiian/Other
Pacific Islander 6 7 4 11 17 18 NR Alien 41 41 46 17 15 21
Two or More Races 35 44 47 47 35 24 Race/Ethnicity
Unknown 341 363 346 296 320 324 Total 5,930 6,060 6,179 5,899 6,104 6,223
51 Fayetteville State University Office of Institutional Research
01/09/2017
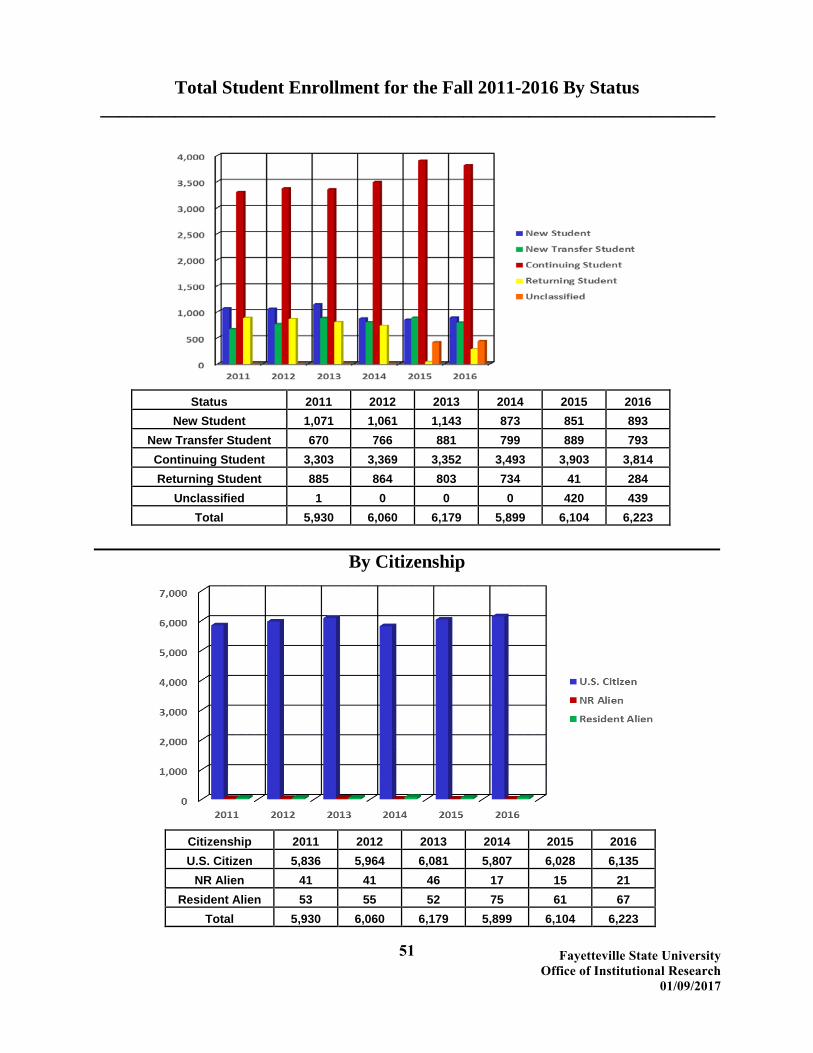
Total Student Enrollment for the Fall 2011-2016 By Status __________________________________________________________________
Status 2011 2012 2013 2014 2015 2016 New Student 1,071 1,061 1,143 873 851 893
New Transfer Student 670 766 881 799 889 793 Continuing Student 3,303 3,369 3,352 3,493 3,903 3,814 Returning Student 885 864 803 734 41 284
Unclassified 1 0 0 0 420 439 Total 5,930 6,060 6,179 5,899 6,104 6,223
By Citizenship
Citizenship 2011 2012 2013 2014 2015 2016 U.S. Citizen 5,836 5,964 6,081 5,807 6,028 6,135
NR Alien 41 41 46 17 15 21 Resident Alien 53 55 52 75 61 67
Total 5,930 6,060 6,179 5,899 6,104 6,223

52 Fayetteville State University Office of Institutional Research
01/09/2017
Total Student Enrollment for the Fall 2010-2015 By Housing Status __________________________________________________________________
Housing Status 2011 2012 2013 2014 2015 2016 Resident 1,508 1,543 1,550 1,465 1,524 1,563
Commuter 4,422 4,517 4,629 4,434 4,580 4,660 Total 5,930 6,060 6,179 5,899 6,104 6,223
By Semester Credit Hours
Semester Hours 2011 2012 2013 2014 2015 2016 Not Applicable 942 1,031 1,111 1,151 1,506 1,577
< 3 Hrs 23 25 20 20 28 35 >=3 & < 6 Hrs 536 637 704 568 603 631 >=6 & < 9 Hrs 572 592 650 563 544 597
>=9 & < 12 Hrs 747 656 740 768 733 817 >=12 & < 15 Hrs 1,849 1,688 1,650 1,545 1,247 1,005 >=15 & < 18 Hrs 1,089 1,225 1,143 1,068 1,202 1,291 >=18 & < 21 Hrs 167 185 154 179 214 241 >=21 & < 24 Hrs 5 21 7 37 26 28
>=24 Hrs 0 0 0 0 1 1 Total 5,930 6,060 6,179 5,899 6,104 6,223

53 Fayetteville State University Office of Institutional Research
01/09/2017
Total Student Enrollment for the Fall 2011-2016 By Transfer Hours Applied Towards Degree
__________________________________________________________________
Transfer Hours 2011 2012 2013 2014 2015 2016 Not Applicable 0 0 0 0 2,907 2,939
0 Hrs 3,321 3,229 3,190 2,903 44 40 1-30 Hrs 583 625 680 674 700 766 31-60 Hrs 613 643 696 731 790 821 61-90 Hrs 832 904 964 963 1,004 1,027
Over 90 Hrs 581 659 649 628 659 630 Total 5,930 6,060 6,179 5,899 6,104 6,223
54 Fayetteville State University Office of Institutional Research
01/09/2017
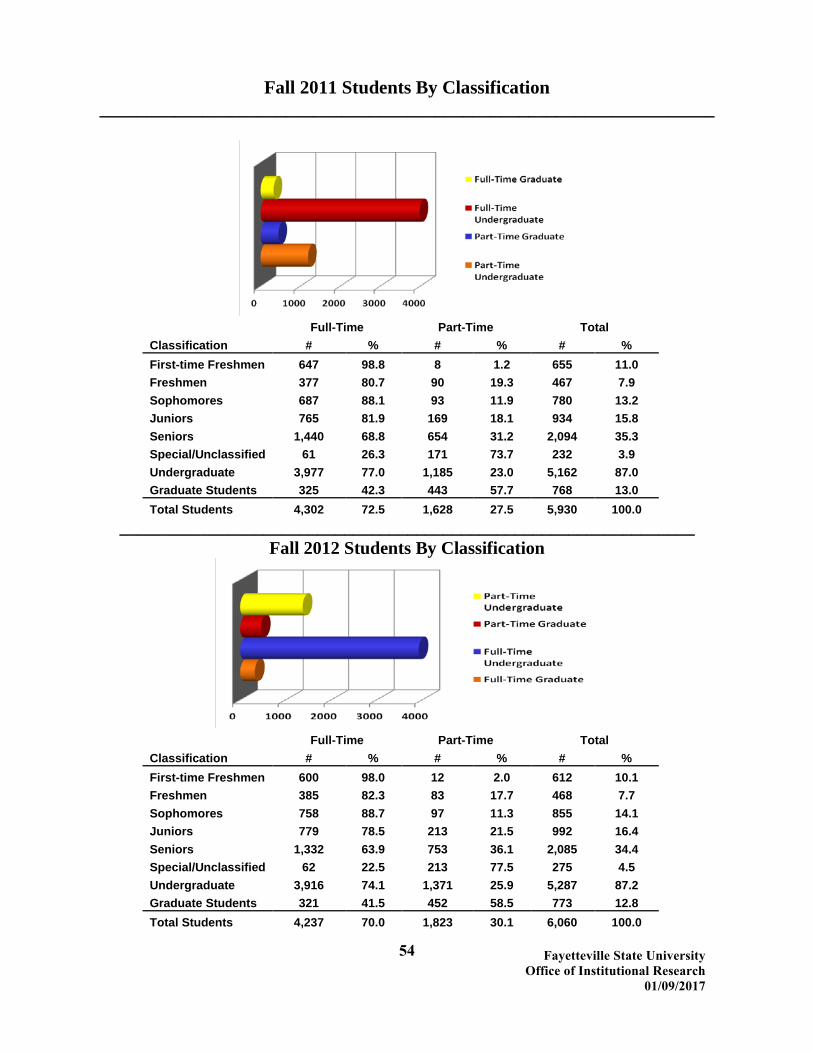
Fall 2011 Students By Classification __________________________________________________________________
Full-Time Part-Time Total Classification # % # % # % First-time Freshmen 647 98.8 8 1.2 655 11.0 Freshmen 377 80.7 90 19.3 467 7.9 Sophomores 687 88.1 93 11.9 780 13.2 Juniors 765 81.9 169 18.1 934 15.8 Seniors 1,440 68.8 654 31.2 2,094 35.3 Special/Unclassified 61 26.3 171 73.7 232 3.9 Undergraduate 3,977 77.0 1,185 23.0 5,162 87.0 Graduate Students 325 42.3 443 57.7 768 13.0 Total Students 4,302 72.5 1,628 27.5 5,930 100.0
________________________________________________________________ Fall 2012 Students By Classification
Full-Time Part-Time Total Classification # % # % # % First-time Freshmen 600 98.0 12 2.0 612 10.1 Freshmen 385 82.3 83 17.7 468 7.7 Sophomores 758 88.7 97 11.3 855 14.1 Juniors 779 78.5 213 21.5 992 16.4 Seniors 1,332 63.9 753 36.1 2,085 34.4 Special/Unclassified 62 22.5 213 77.5 275 4.5 Undergraduate 3,916 74.1 1,371 25.9 5,287 87.2 Graduate Students 321 41.5 452 58.5 773 12.8 Total Students 4,237 70.0 1,823 30.1 6,060 100.0

55 Fayetteville State University
Office of Institutional Research 01/09/2017
Fall 2013 Students By Classification __________________________________________________________________
Full-Time Part-Time Total Classification # % # % # % First-time Freshmen 689 97.5 18 2.5 707 11.4 Freshmen 343 83.1 70 16.9 413 6.7 Sophomores 722 85.5 122 14.5 844 13.7 Juniors 877 79.0 233 21.0 1,110 18.0 Seniors 1,270 63.4 733 36.6 2,003 32.4 Special/Unclassified 70 21.0 263 79.0 333 5.4 Undergraduate 3,971 73.4 1,439 26.6 5,410 87.6 Graduate Students 354 46.0 415 54.0 769 12.4 Total Students 4,325 70.0 1,854 30.0 6,179 100.0
_____________________________________________________________________ Fall 2014 Students By Classification
Full-Time Part-Time Total Classification # % # % # % First-time Freshmen 468 98.3 8 1.7 476 8.1 Freshmen 333 84.9 59 15.1 392 6.6 Sophomores 806 88.8 102 11.2 908 15.4 Juniors 850 79.0 226 21.0 1,076 18.2 Seniors 1,331 66.2 679 33.8 2,010 34.1 Special/Unclassified 147 38.2 238 61.8 385 6.5 Undergraduate 3,935 75.0 1,312 25.0 5,247 88.9 Graduate Students 332 50.9 320 49.1 652 11.1 Total Students 4,267 72.3 1,632 27.7 5,899 100.0

56 Fayetteville State University Office of Institutional Research
01/09/2017
Fall 2015 Students By Classification _________________________________________________________________
Full-Time Part-Time Total Classification # % # % # % First-time Freshmen 627 99.4 4 0.6 631 10.3 Freshmen 257 79.1 68 20.9 325 5.3 Sophomores 759 86.2 122 13.8 881 14.4 Juniors 876 77.5 255 22.5 1,131 18.5 Seniors 1,361 64.2 758 35.8 2,119 34.7 Special/Unclassified 175 41.8 244 58.2 419 6.7 Undergraduate 4,055 73.6 1,451 26.4 5,506 90.2 Graduate Students 319 53.3 279 46.7 598 9.8 Total Students 4,374 71.7 1,730 28.3 6,104 100.0
____________________________________________________________________ Fall 2016 Students By Classification
Full-Time Part-Time Total Classification # % # % # % First-time Freshmen 639 98.9 7 1.1 646 10.4 Freshmen 433 61.6 270 38.4 703 11.3 Sophomores 756 86.3 120 13.7 876 14.1 Juniors 924 79.6 237 20.4 1,161 18.7 Seniors 1,389 65.2 743 34.8 2,132 34.3 Special/Unclassified 0 0.0 25 100.0 25 0.4 Undergraduate 4,141 74.7 1,402 25.3 5,543 89.1 Graduate Students 373 54.9 307 45.1 680 10.9 Total Students 4,514 72.5 1,709 27.5 6,223 100.0
57 Fayetteville State University Office of Institutional Research
01/09/2017
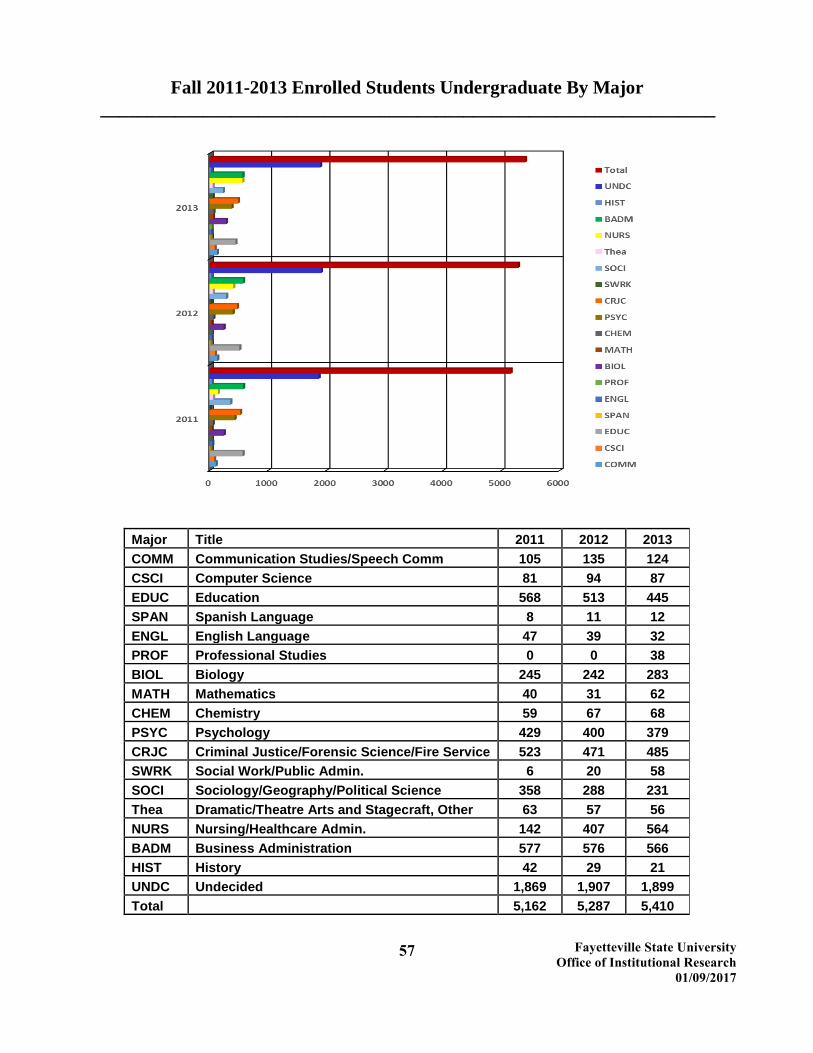
Fall 2011-2013 Enrolled Students Undergraduate By Major __________________________________________________________________
Major Title 2011 2012 2013 COMM Communication Studies/Speech Comm 105 135 124 CSCI Computer Science 81 94 87 EDUC Education 568 513 445 SPAN Spanish Language 8 11 12 ENGL English Language 47 39 32 PROF Professional Studies 0 0 38 BIOL Biology 245 242 283 MATH Mathematics 40 31 62 CHEM Chemistry 59 67 68 PSYC Psychology 429 400 379 CRJC Criminal Justice/Forensic Science/Fire Service 523 471 485 SWRK Social Work/Public Admin. 6 20 58 SOCI Sociology/Geography/Political Science 358 288 231 Thea Dramatic/Theatre Arts and Stagecraft, Other 63 57 56 NURS Nursing/Healthcare Admin. 142 407 564 BADM Business Administration 577 576 566 HIST History 42 29 21 UNDC Undecided 1,869 1,907 1,899 Total 5,162 5,287 5,410

58 Fayetteville State University Office of Institutional Research
01/09/2017
Fall 2014-2016 Enrolled Students Undergraduate By Major __________________________________________________________________
Major Title 2014 2015 2016
COMM Communication Studies/Speech Comm 125 109 103
CSCI Computer Science 102 138 141 EDUC Education 278 255 222 SPAN Spanish Language 15 24 14 ENGL English Language 31 36 41 PROF Professional Studies 53 70 56 BIOL Biology 267 271 256 MATH Mathematics 44 37 46 CHEM Chemistry 59 48 45 PSYC Psychology 379 420 446
CRJC Criminal Justice/Forensic Science/Fire Service 549 566 502
SWRK Social Work/Public Admin. 115 172 200
SOCI Sociology/Geography/Political Science 185 177 178
Thea Dramatic/Theatre Arts and Stagecraft, Other 66 79 81
NURS Nursing/Healthcare Admin. 689 758 774 BADM Business Administration 538 616 555 HIST History 26 27 26 UNDC Undecided 1,726 1,703 1,857 Total 5,247 5,506 5,543

59 Fayetteville State University Office of Institutional Research
01/09/2017
Fall 2011-2013 Enrolled Students Graduate By Major __________________________________________________________________
Major Title 2011 2012 2013 EDUC Education 190 174 165 ENGL English Language 3 4 10 BIOL Biology 15 9 15 MATH Mathematics 6 8 13
MSCI Military Behavioral Health Graduate Certificate 0 0 20
PSYC Psychology 36 34 33 CRJC Criminal Justice 47 44 57 SWRK Social Work 132 150 165
SOCI Sociology/Geography/Political Science/History 28 19 11
BADM Business Administration 60 63 80 PROF Professional Development 251 268 200 Total 768 773 769

60 Fayetteville State University
Office of Institutional Research 01/09/2017
Fall 2014-2016 Enrolled Students Graduate By Major __________________________________________________________________
Major Title 2014 2015 2016 EDUC Education 139 189 199 ENGL English Language 8 1 0 BIOL Biology 8 1 0 MATH Mathematics 9 2 0
MSCI Military Behavioral Health Graduate Certificate 13 9 7
PSYC Psychology 31 26 26 CRJC Criminal Justice 46 35 49 SWRK Social Work 144 121 110 SOCI Sociology/Geography/Political Science 16 16 10
HCM Medical/Health Management and Clinical Assistant/Specialist 12 5 3
BADM Business Administration 70 99 187 PROF Professional Development 156 94 89 Total 652 598 680
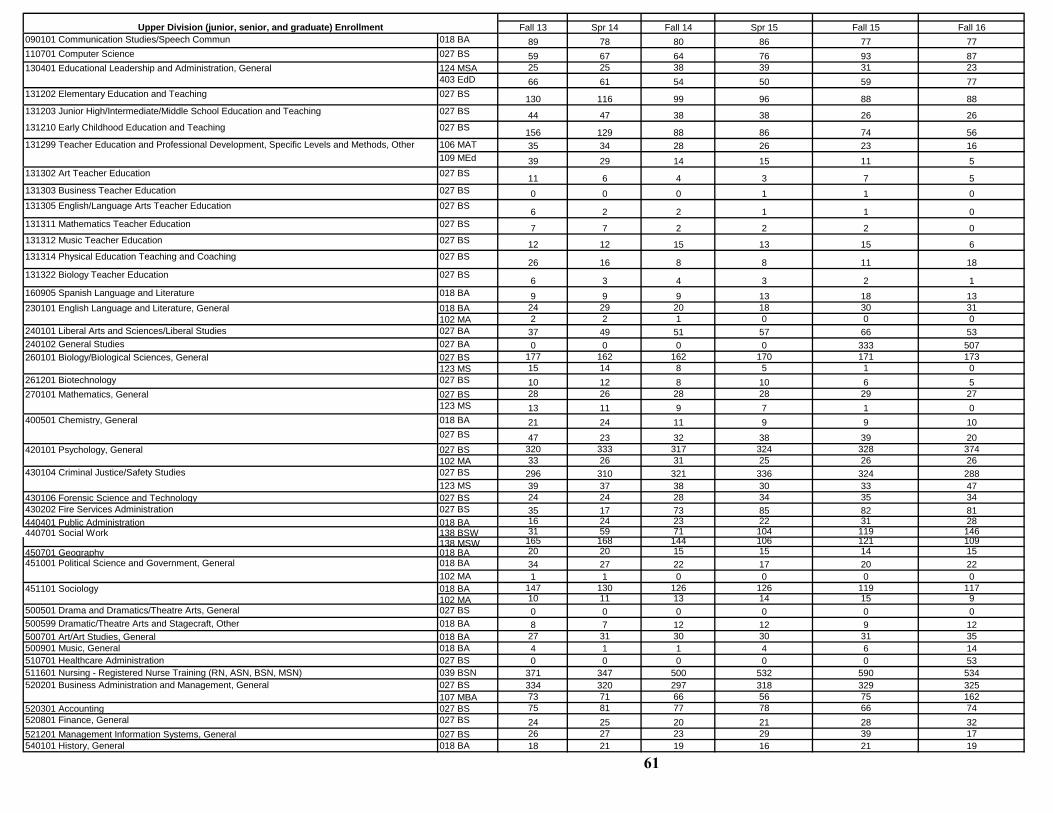
Fall 13 Spr 14 Fall 14 Spr 15 Fall 15 Fall 16090101 Communication Studies/Speech Commun 018 BA 89 78 80 86 77 77110701 Computer Science 027 BS 59 67 64 76 93 87
124 MSA 25 25 38 39 31 23403 EdD 66 61 54 50 59 77
131202 Elementary Education and Teaching 027 BS 130 116 99 96 88 88131203 Junior High/Intermediate/Middle School Education and Teaching 027 BS 44 47 38 38 26 26131210 Early Childhood Education and Teaching 027 BS 156 129 88 86 74 56
106 MAT 35 34 28 26 23 16109 MEd 39 29 14 15 11 5
131302 Art Teacher Education 027 BS 11 6 4 3 7 5131303 Business Teacher Education 027 BS 0 0 0 1 1 0131305 English/Language Arts Teacher Education 027 BS 6 2 2 1 1 0131311 Mathematics Teacher Education 027 BS 7 7 2 2 2 0131312 Music Teacher Education 027 BS 12 12 15 13 15 6131314 Physical Education Teaching and Coaching 027 BS 26 16 8 8 11 18131322 Biology Teacher Education 027 BS 6 3 4 3 2 1160905 Spanish Language and Literature 018 BA 9 9 9 13 18 13
018 BA 24 29 20 18 30 31102 MA 2 2 1 0 0 0
240101 Liberal Arts and Sciences/Liberal Studies 027 BA 37 49 51 57 66 53240102 General Studies 027 BA 0 0 0 0 333 507
027 BS 177 162 162 170 171 173123 MS 15 14 8 5 1 0
261201 Biotechnology 027 BS 10 12 8 10 6 5027 BS 28 26 28 28 29 27123 MS 13 11 9 7 1 0018 BA 21 24 11 9 9 10027 BS 47 23 32 38 39 20027 BS 320 333 317 324 328 374102 MA 33 26 31 25 26 26
430104 Criminal Justice/Safety Studies 027 BS 296 310 321 336 324 288123 MS 39 37 38 30 33 47
430106 Forensic Science and Technology 027 BS 24 24 28 34 35 34430202 Fire Services Administration 027 BS 35 17 73 85 82 81440401 Public Administration 018 BA 16 24 23 22 31 28440701 Social Work 138 BSW 31 59 71 104 119 146
138 MSW 165 168 144 106 121 109450701 Geography 018 BA 20 20 15 15 14 15
018 BA 34 27 22 17 20 22102 MA 1 1 0 0 0 0018 BA 147 130 126 126 119 117102 MA 10 11 13 14 15 9
500501 Drama and Dramatics/Theatre Arts, General 027 BS 0 0 0 0 0 0500599 Dramatic/Theatre Arts and Stagecraft, Other 018 BA 8 7 12 12 9 12500701 Art/Art Studies, General 018 BA 27 31 30 30 31 35500901 Music, General 018 BA 4 1 1 4 6 14510701 Healthcare Administration 027 BS 0 0 0 0 0 53511601 Nursing - Registered Nurse Training (RN, ASN, BSN, MSN) 039 BSN 371 347 500 532 590 534
027 BS 334 320 297 318 329 325107 MBA 73 71 66 56 75 162
520301 Accounting 027 BS 75 81 77 78 66 74520801 Finance, General 027 BS 24 25 20 21 28 32521201 Management Information Systems, General 027 BS 26 27 23 29 39 17540101 History, General 018 BA 18 21 19 16 21 19
61
260101 Biology/Biological Sciences, General
Upper Division (junior, senior, and graduate) Enrollment
130401 Educational Leadership and Administration, General
451101 Sociology
520201 Business Administration and Management, General
270101 Mathematics, General
420101 Psychology, General
451001 Political Science and Government, General
400501 Chemistry, General
131299 Teacher Education and Professional Development, Specific Levels and Methods, Other
230101 English Language and Literature, General

62 Fayetteville State University
Office of Institutional Research 01/09/2017
Degrees Conferred Between 2011-2016 Comparison By Degree Level __________________________________________________________________
Degree Type 2011 2012 2013 2014 2015 2016 Bachelor 902 991 937 965 911 954 Master 117 159 179 193 169 160
Doctorate 6 1 7 7 8 6 Total 1025 1151 1123 1,165 1,088 1,120
By Month
Month 2011 2012 2013 2014 2015 2016 May 599 613 595 677 709 614
December 426 538 528 488 379 506
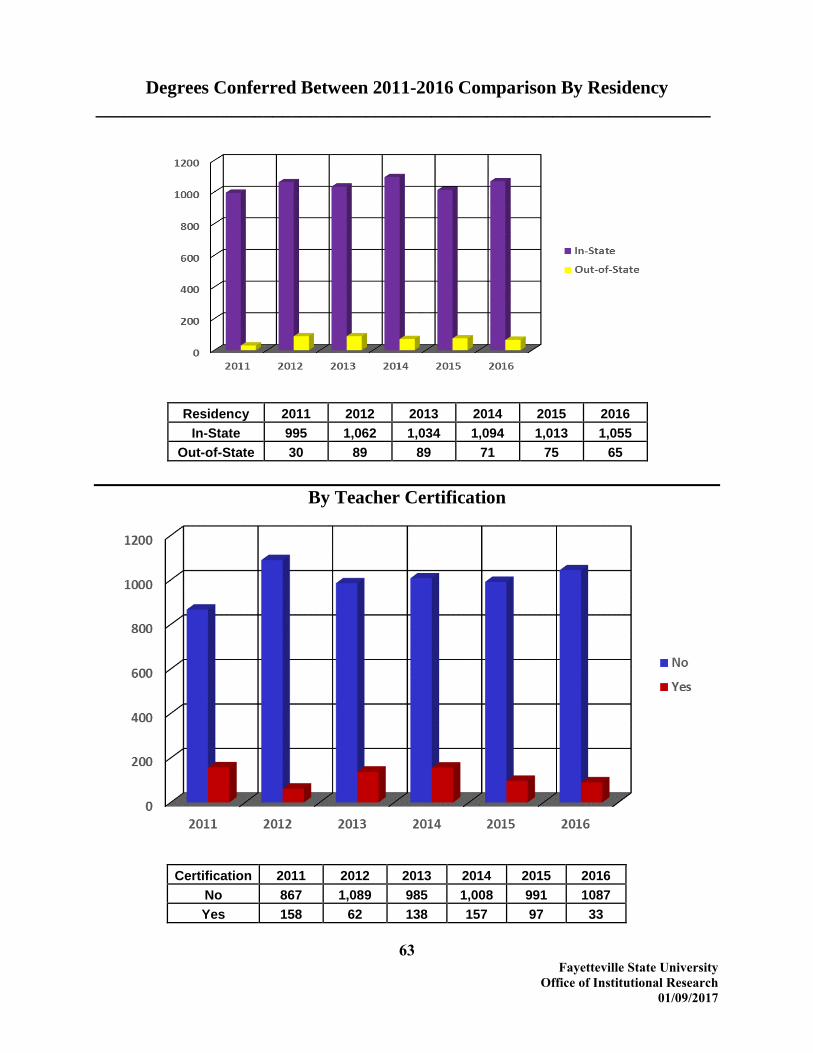
63 Fayetteville State University
Office of Institutional Research 01/09/2017
Degrees Conferred Between 2011-2016 Comparison By Residency __________________________________________________________________
Residency 2011 2012 2013 2014 2015 2016 In-State 995 1,062 1,034 1,094 1,013 1,055
Out-of-State 30 89 89 71 75 65
By Teacher Certification
Certification 2011 2012 2013 2014 2015 2016 No 867 1,089 985 1,008 991 1087 Yes 158 62 138 157 97 33

64 Fayetteville State University
Office of Institutional Research 01/09/2017
Degrees Conferred Between 2011-2016 Comparison By Race __________________________________________________________________
Race 2011 2012 2013 2014 2015 2016 White 213 244 268 291 275 316 Black 696 711 690 674 605 619
American Indian 14 16 16 25 24 27 Asian 15 13 13 23 25 19
Hispanic 42 60 54 73 83 86 Non-Resident Alien 3 19 13 14 11 3
Race/Ethnicity Unknown 40 85 60 58 53 40 Native Hawaiian/Other
Pacific Islander 1 1 2 0 1 0 Two or More Races 1 2 7 7 11 10

65 Fayetteville State University
Office of Institutional Research 01/09/2017
Degrees Conferred Between 2011-2016 Comparison By Gender __________________________________________________________________
Gender 2011 2012 2013 2014 2015 2016 Female 727 791 804 848 780 812
Male 298 360 319 317 308 308
By Citizenship
Citizenship 2011 2012 2013 2014 2015 2016 US Citizen 1,009 1,122 1,096 1,140 1,057 1,106
Non-Resident Alien 3 19 13 14 11 3 Resident Alien 13 10 14 11 20 11

2011-
2012
2012-
2013
2013-
2014
2014-
2015
2015-
2016
90101 Communication Studies/Speech Communication and Rhe 018 BA 21 36 35 38 32
110701 Computer Science 027 BS 15 21 12 7 18
124
MSA 14 14 6 17 22
403
EdD 1 7 8 8 6
131202 Elementary Education and Teaching 027 BS 26 30 33 19 10
131203 Junior High/Intermediate/Middle School Education and Teaching 027 BS 4 5 11 11 5
131210 Early Childhood Education and Teaching 027 BS 34 38 45 21 31
106
MAT 9 10 12 8 8
109
MEd 25 19 25 8 3
131302 Art Teacher Education 027 BS 2 0 4 1 1
131305 English/Language Arts Teacher Education 027 BS 2 1 1 1 0
131307 Health Teacher Education 027 BS 0 0 0 0 0
131311 Mathematics Teacher Education 027 BS 0 3 1 1 2
131312 Music Teacher Education 027 BS 3 2 3 0 0
131314 Physical Education Teaching and Coaching 027 BS 8 3 6 1 0
131317 Social Science Teacher Education 027 BS 1 3 0 0 0
131322 Biology Teacher Education 027 BS 2 3 2 0 1
131330 Spanish Language Teacher Education 027 BS . 1 0 0 0
160905 Spanish Language and Literature 018 BA 2 7 2 3 6
018 BA 26 21 18 6 11
102 MA
. 1 2 1 0
240101 Liberal Arts andSciences/Liberal Studies 027 BA . 1 39 34 61
027 BS 34 30 33 35 38
123 MS 2 3 2 4 5
261201 Biotechnology 027 BS 1 4 2 0 2
027 BS 14 14 12 12 6
123 MS 2 3 2 4 5
018 BA 10 8 7 4 0
027 BS 4 4 6 9 7
027 BS 154 128 125 119 127
102 MA
10 5 11 10 6
027 BS 157 169 144 125 129
123 MS 10 13 4 10 6
430106 Forensic Science & Technology 027 BS 9 3 5 2 4
430202 Fire Services Administration 027 BS 22 14 19 28 36
440401 Public Administration 018 BS . 2 6 8 5
043
BSW 0 0 11 30 42
138
MSW 60 77 95 81 79
450701 Geography 018 BA 9 4 14 10 7
018 BA 22 28 12 10 6
102 MA
2 4 0 1 0
270101 Mathematics, General
400501 Chemistry, General
420101 Psychology, General
430104 Criminal Justice/Safety Studies
440701 Social Work
451001 Political Science and Government, General
Number of Degrees Awarded
130401 Educational Leadership and Administration, General
131299 Teacher Education and Professional Development, Specific Levels
and Methods, Other
230101 English Language and Literature, General
260101 Biology/Biological Sciences, General
66

2011-
2012
2012-
2013
2013-
2014
2014-
2015
2015-
2016
018 BA 117 78 57 59 41
102 MA
6 6 5 4 6
500599 Dramatic/Theatre Arts and Stagecraft, Other 018 BA 12 0 9 3 3
500701 Art/Art Studies, General 018 BA 22 11 14 9 14
500901 Music, General 018 BA 4 2 2 0 4
510701 Health/Healthcare Administration/Management 027 BS . . . . 4
513801 Nursing - Registered Nurse Training (RN, ASN, BSN, MSN) 039
BSN 43 75 83 137 153
027 BS 136 140 131 100 95
107
MBA 19 24 29 21 20
520301 Accounting 027 BS 29 16 16 36 18
520801 Finance, General 027 BS 18 7 19 6 13
521201 Management Information Systems, General 027 BS 10 8 9 15 9
540101 History, General 018 BA 18 17 16 11 13
Total 1151 1123 1165 1088 1120
451101 Sociology
520201 Business Administration and Management, General
Number of Degrees Awarded
67
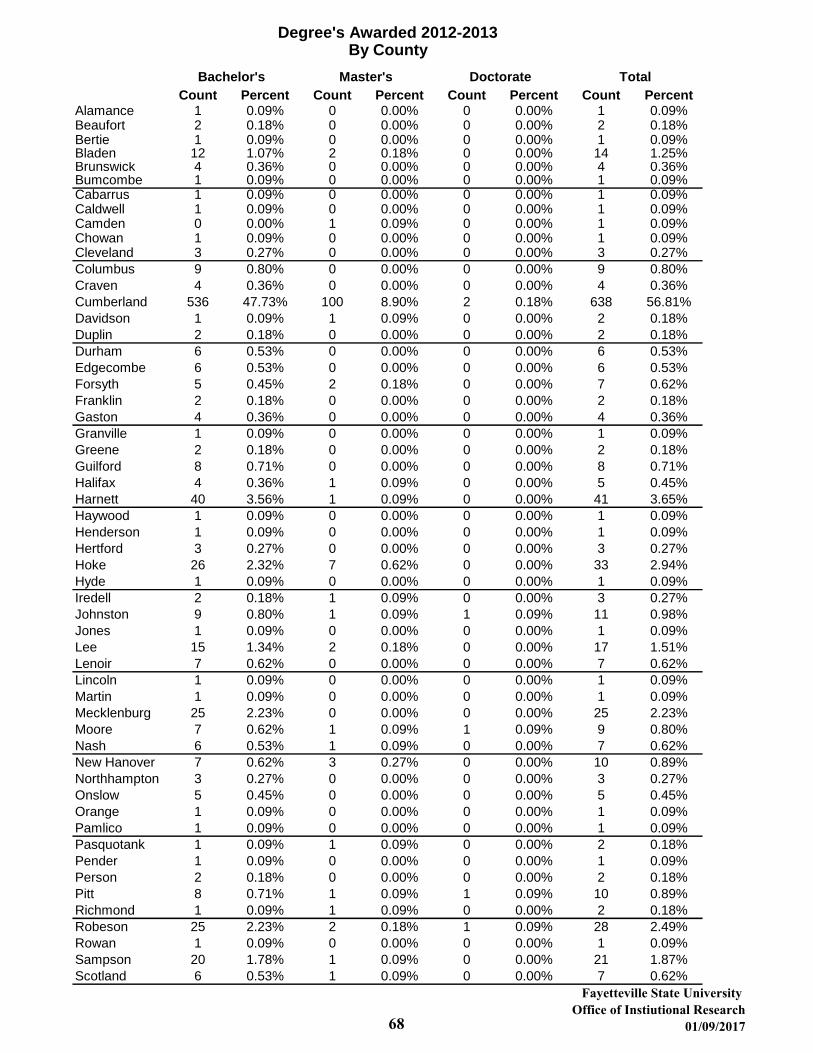
Degree's Awarded 2012-2013By County
Bachelor's Master's Doctorate Total
Count Percent Count Percent Count Percent Count PercentAlamance 1 0.09% 0 0.00% 0 0.00% 1 0.09%Beaufort 2 0.18% 0 0.00% 0 0.00% 2 0.18%Bertie 1 0.09% 0 0.00% 0 0.00% 1 0.09%Bladen 12 1.07% 2 0.18% 0 0.00% 14 1.25%Brunswick 4 0.36% 0 0.00% 0 0.00% 4 0.36%Bumcombe 1 0.09% 0 0.00% 0 0.00% 1 0.09%Cabarrus 1 0.09% 0 0.00% 0 0.00% 1 0.09%Caldwell 1 0.09% 0 0.00% 0 0.00% 1 0.09%Camden 0 0.00% 1 0.09% 0 0.00% 1 0.09%Chowan 1 0.09% 0 0.00% 0 0.00% 1 0.09%Cleveland 3 0.27% 0 0.00% 0 0.00% 3 0.27%
Columbus 9 0.80% 0 0.00% 0 0.00% 9 0.80%
Craven 4 0.36% 0 0.00% 0 0.00% 4 0.36%
Cumberland 536 47.73% 100 8.90% 2 0.18% 638 56.81%
Davidson 1 0.09% 1 0.09% 0 0.00% 2 0.18%
Duplin 2 0.18% 0 0.00% 0 0.00% 2 0.18%
Durham 6 0.53% 0 0.00% 0 0.00% 6 0.53%
Edgecombe 6 0.53% 0 0.00% 0 0.00% 6 0.53%
Forsyth 5 0.45% 2 0.18% 0 0.00% 7 0.62%
Franklin 2 0.18% 0 0.00% 0 0.00% 2 0.18%
Gaston 4 0.36% 0 0.00% 0 0.00% 4 0.36%
Granville 1 0.09% 0 0.00% 0 0.00% 1 0.09%
Greene 2 0.18% 0 0.00% 0 0.00% 2 0.18%
Guilford 8 0.71% 0 0.00% 0 0.00% 8 0.71%
Halifax 4 0.36% 1 0.09% 0 0.00% 5 0.45%
Harnett 40 3.56% 1 0.09% 0 0.00% 41 3.65%
Haywood 1 0.09% 0 0.00% 0 0.00% 1 0.09%
Henderson 1 0.09% 0 0.00% 0 0.00% 1 0.09%
Hertford 3 0.27% 0 0.00% 0 0.00% 3 0.27%
Hoke 26 2.32% 7 0.62% 0 0.00% 33 2.94%
Hyde 1 0.09% 0 0.00% 0 0.00% 1 0.09%
Iredell 2 0.18% 1 0.09% 0 0.00% 3 0.27%
Johnston 9 0.80% 1 0.09% 1 0.09% 11 0.98%
Jones 1 0.09% 0 0.00% 0 0.00% 1 0.09%
Lee 15 1.34% 2 0.18% 0 0.00% 17 1.51%
Lenoir 7 0.62% 0 0.00% 0 0.00% 7 0.62%
Lincoln 1 0.09% 0 0.00% 0 0.00% 1 0.09%
Martin 1 0.09% 0 0.00% 0 0.00% 1 0.09%
Mecklenburg 25 2.23% 0 0.00% 0 0.00% 25 2.23%
Moore 7 0.62% 1 0.09% 1 0.09% 9 0.80%
Nash 6 0.53% 1 0.09% 0 0.00% 7 0.62%
New Hanover 7 0.62% 3 0.27% 0 0.00% 10 0.89%
Northhampton 3 0.27% 0 0.00% 0 0.00% 3 0.27%
Onslow 5 0.45% 0 0.00% 0 0.00% 5 0.45%
Orange 1 0.09% 0 0.00% 0 0.00% 1 0.09%
Pamlico 1 0.09% 0 0.00% 0 0.00% 1 0.09%
Pasquotank 1 0.09% 1 0.09% 0 0.00% 2 0.18%
Pender 1 0.09% 0 0.00% 0 0.00% 1 0.09%
Person 2 0.18% 0 0.00% 0 0.00% 2 0.18%
Pitt 8 0.71% 1 0.09% 1 0.09% 10 0.89%
Richmond 1 0.09% 1 0.09% 0 0.00% 2 0.18%
Robeson 25 2.23% 2 0.18% 1 0.09% 28 2.49%
Rowan 1 0.09% 0 0.00% 0 0.00% 1 0.09%
Sampson 20 1.78% 1 0.09% 0 0.00% 21 1.87%
Scotland 6 0.53% 1 0.09% 0 0.00% 7 0.62%
68
Fayetteville State University Office of Instiutional Research
01/09/2017

Stanley 3 0.27% 0 0.00% 0 0.00% 3 0.27%
Surry 1 0.09% 0 0.00% 0 0.00% 1 0.09%
Tyrrell 1 0.09% 0 0.00% 0 0.00% 1 0.09%
Union 1 0.09% 0 0.00% 0 0.00% 1 0.09%
Vance 2 0.18% 0 0.00% 0 0.00% 2 0.18%
Wake 18 1.60% 3 0.27% 0 0.00% 21 1.87%
Warren 2 0.18% 0 0.00% 0 0.00% 2 0.18%
Washington 2 0.18% 0 0.00% 0 0.00% 2 0.18%
Watauga 1 0.09% 0 0.00% 0 0.00% 1 0.09%
Wayne 9 0.80% 2 0.18% 1 0.09% 12 1.07%
Wilson 6 0.53% 0 0.00% 0 0.00% 6 0.53%
Total County 891 79.34% 136 12.11% 7 0.62% 1034 92.07%
69
Fayetteville State University Office of Instiutional Research
01/09/2017
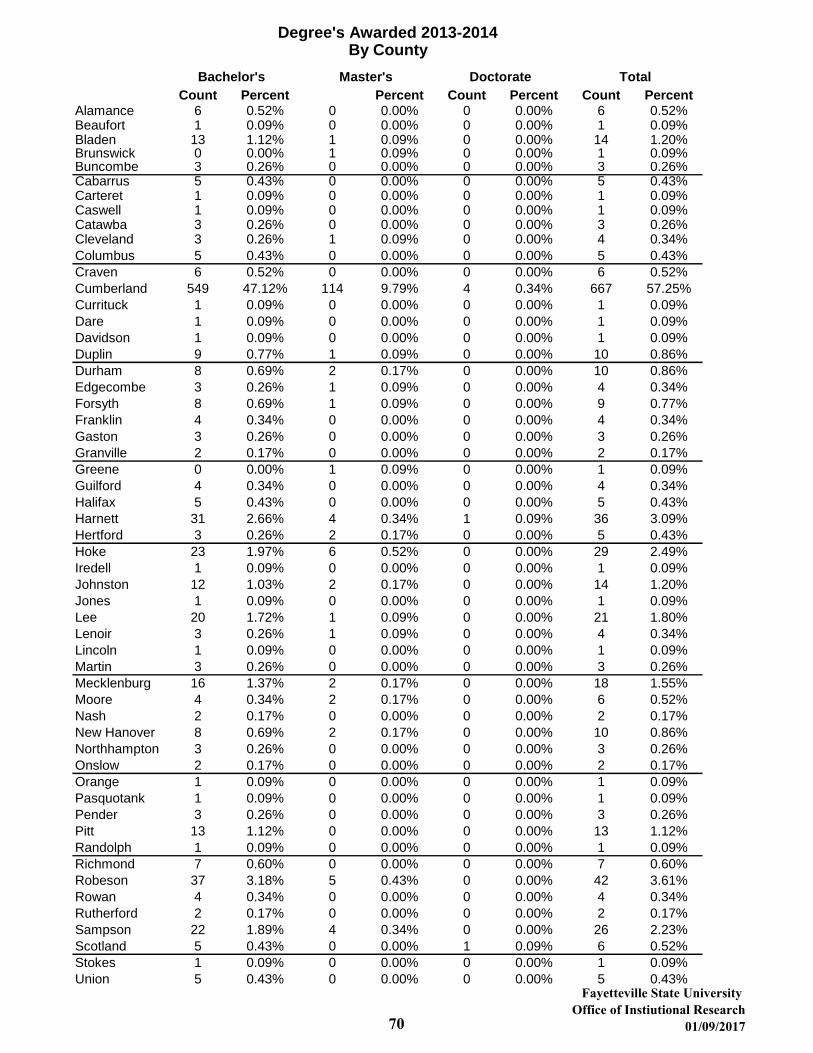
Degree's Awarded 2013-2014By County
Bachelor's Master's Doctorate Total
Count Percent Percent Count Percent Count PercentAlamance 6 0.52% 0 0.00% 0 0.00% 6 0.52%Beaufort 1 0.09% 0 0.00% 0 0.00% 1 0.09%Bladen 13 1.12% 1 0.09% 0 0.00% 14 1.20%Brunswick 0 0.00% 1 0.09% 0 0.00% 1 0.09%Buncombe 3 0.26% 0 0.00% 0 0.00% 3 0.26%Cabarrus 5 0.43% 0 0.00% 0 0.00% 5 0.43%Carteret 1 0.09% 0 0.00% 0 0.00% 1 0.09%Caswell 1 0.09% 0 0.00% 0 0.00% 1 0.09%Catawba 3 0.26% 0 0.00% 0 0.00% 3 0.26%Cleveland 3 0.26% 1 0.09% 0 0.00% 4 0.34%
Columbus 5 0.43% 0 0.00% 0 0.00% 5 0.43%
Craven 6 0.52% 0 0.00% 0 0.00% 6 0.52%
Cumberland 549 47.12% 114 9.79% 4 0.34% 667 57.25%
Currituck 1 0.09% 0 0.00% 0 0.00% 1 0.09%
Dare 1 0.09% 0 0.00% 0 0.00% 1 0.09%
Davidson 1 0.09% 0 0.00% 0 0.00% 1 0.09%
Duplin 9 0.77% 1 0.09% 0 0.00% 10 0.86%
Durham 8 0.69% 2 0.17% 0 0.00% 10 0.86%
Edgecombe 3 0.26% 1 0.09% 0 0.00% 4 0.34%
Forsyth 8 0.69% 1 0.09% 0 0.00% 9 0.77%
Franklin 4 0.34% 0 0.00% 0 0.00% 4 0.34%
Gaston 3 0.26% 0 0.00% 0 0.00% 3 0.26%
Granville 2 0.17% 0 0.00% 0 0.00% 2 0.17%
Greene 0 0.00% 1 0.09% 0 0.00% 1 0.09%
Guilford 4 0.34% 0 0.00% 0 0.00% 4 0.34%
Halifax 5 0.43% 0 0.00% 0 0.00% 5 0.43%
Harnett 31 2.66% 4 0.34% 1 0.09% 36 3.09%
Hertford 3 0.26% 2 0.17% 0 0.00% 5 0.43%
Hoke 23 1.97% 6 0.52% 0 0.00% 29 2.49%
Iredell 1 0.09% 0 0.00% 0 0.00% 1 0.09%
Johnston 12 1.03% 2 0.17% 0 0.00% 14 1.20%
Jones 1 0.09% 0 0.00% 0 0.00% 1 0.09%
Lee 20 1.72% 1 0.09% 0 0.00% 21 1.80%
Lenoir 3 0.26% 1 0.09% 0 0.00% 4 0.34%
Lincoln 1 0.09% 0 0.00% 0 0.00% 1 0.09%
Martin 3 0.26% 0 0.00% 0 0.00% 3 0.26%
Mecklenburg 16 1.37% 2 0.17% 0 0.00% 18 1.55%
Moore 4 0.34% 2 0.17% 0 0.00% 6 0.52%
Nash 2 0.17% 0 0.00% 0 0.00% 2 0.17%
New Hanover 8 0.69% 2 0.17% 0 0.00% 10 0.86%
Northhampton 3 0.26% 0 0.00% 0 0.00% 3 0.26%
Onslow 2 0.17% 0 0.00% 0 0.00% 2 0.17%
Orange 1 0.09% 0 0.00% 0 0.00% 1 0.09%
Pasquotank 1 0.09% 0 0.00% 0 0.00% 1 0.09%
Pender 3 0.26% 0 0.00% 0 0.00% 3 0.26%
Pitt 13 1.12% 0 0.00% 0 0.00% 13 1.12%
Randolph 1 0.09% 0 0.00% 0 0.00% 1 0.09%
Richmond 7 0.60% 0 0.00% 0 0.00% 7 0.60%
Robeson 37 3.18% 5 0.43% 0 0.00% 42 3.61%
Rowan 4 0.34% 0 0.00% 0 0.00% 4 0.34%
Rutherford 2 0.17% 0 0.00% 0 0.00% 2 0.17%
Sampson 22 1.89% 4 0.34% 0 0.00% 26 2.23%
Scotland 5 0.43% 0 0.00% 1 0.09% 6 0.52%
Stokes 1 0.09% 0 0.00% 0 0.00% 1 0.09%
Union 5 0.43% 0 0.00% 0 0.00% 5 0.43%
70
Fayetteville State University Office of Instiutional Research
01/09/2017

Vance 4 0.34% 0 0.00% 0 0.00% 4 0.34%
Wake 26 2.23% 4 0.34% 1 0.09% 31 2.66%
Warren 1 0.09% 0 0.00% 0 0.00% 1 0.09%
Washington 1 0.09% 0 0.00% 0 0.00% 1 0.09%
Wayne 8 0.69% 1 0.09% 0 0.00% 9 0.77%
Wilson 7 0.60% 0 0.00% 0 0.00% 7 0.60%
Yadkin 1 0.09% 0 0.00% 0 0.00% 1 0.09%
Total County 928 79.66% 159 13.65% 7 0.60% 1094 93.91%
71
Fayetteville State University Office of Instiutional Research
01/09/2017
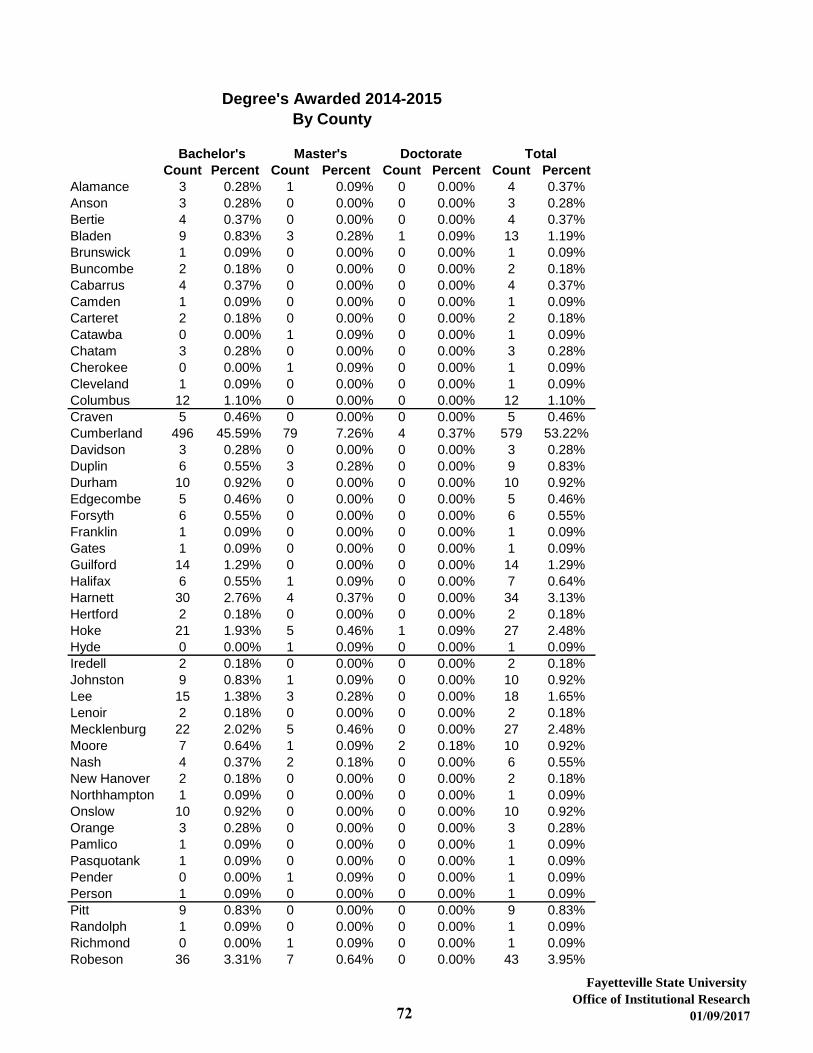
Degree's Awarded 2014-2015
By County
Bachelor's Master's Doctorate Total
Count Percent Count Percent Count Percent Count Percent
Alamance 3 0.28% 1 0.09% 0 0.00% 4 0.37%
Anson 3 0.28% 0 0.00% 0 0.00% 3 0.28%
Bertie 4 0.37% 0 0.00% 0 0.00% 4 0.37%
Bladen 9 0.83% 3 0.28% 1 0.09% 13 1.19%
Brunswick 1 0.09% 0 0.00% 0 0.00% 1 0.09%
Buncombe 2 0.18% 0 0.00% 0 0.00% 2 0.18%
Cabarrus 4 0.37% 0 0.00% 0 0.00% 4 0.37%
Camden 1 0.09% 0 0.00% 0 0.00% 1 0.09%
Carteret 2 0.18% 0 0.00% 0 0.00% 2 0.18%
Catawba 0 0.00% 1 0.09% 0 0.00% 1 0.09%
Chatam 3 0.28% 0 0.00% 0 0.00% 3 0.28%
Cherokee 0 0.00% 1 0.09% 0 0.00% 1 0.09%
Cleveland 1 0.09% 0 0.00% 0 0.00% 1 0.09%
Columbus 12 1.10% 0 0.00% 0 0.00% 12 1.10%
Craven 5 0.46% 0 0.00% 0 0.00% 5 0.46%
Cumberland 496 45.59% 79 7.26% 4 0.37% 579 53.22%
Davidson 3 0.28% 0 0.00% 0 0.00% 3 0.28%
Duplin 6 0.55% 3 0.28% 0 0.00% 9 0.83%
Durham 10 0.92% 0 0.00% 0 0.00% 10 0.92%
Edgecombe 5 0.46% 0 0.00% 0 0.00% 5 0.46%
Forsyth 6 0.55% 0 0.00% 0 0.00% 6 0.55%
Franklin 1 0.09% 0 0.00% 0 0.00% 1 0.09%
Gates 1 0.09% 0 0.00% 0 0.00% 1 0.09%
Guilford 14 1.29% 0 0.00% 0 0.00% 14 1.29%
Halifax 6 0.55% 1 0.09% 0 0.00% 7 0.64%
Harnett 30 2.76% 4 0.37% 0 0.00% 34 3.13%
Hertford 2 0.18% 0 0.00% 0 0.00% 2 0.18%
Hoke 21 1.93% 5 0.46% 1 0.09% 27 2.48%
Hyde 0 0.00% 1 0.09% 0 0.00% 1 0.09%
Iredell 2 0.18% 0 0.00% 0 0.00% 2 0.18%
Johnston 9 0.83% 1 0.09% 0 0.00% 10 0.92%
Lee 15 1.38% 3 0.28% 0 0.00% 18 1.65%
Lenoir 2 0.18% 0 0.00% 0 0.00% 2 0.18%
Mecklenburg 22 2.02% 5 0.46% 0 0.00% 27 2.48%
Moore 7 0.64% 1 0.09% 2 0.18% 10 0.92%
Nash 4 0.37% 2 0.18% 0 0.00% 6 0.55%
New Hanover 2 0.18% 0 0.00% 0 0.00% 2 0.18%
Northhampton 1 0.09% 0 0.00% 0 0.00% 1 0.09%
Onslow 10 0.92% 0 0.00% 0 0.00% 10 0.92%
Orange 3 0.28% 0 0.00% 0 0.00% 3 0.28%
Pamlico 1 0.09% 0 0.00% 0 0.00% 1 0.09%
Pasquotank 1 0.09% 0 0.00% 0 0.00% 1 0.09%
Pender 0 0.00% 1 0.09% 0 0.00% 1 0.09%
Person 1 0.09% 0 0.00% 0 0.00% 1 0.09%
Pitt 9 0.83% 0 0.00% 0 0.00% 9 0.83%
Randolph 1 0.09% 0 0.00% 0 0.00% 1 0.09%
Richmond 0 0.00% 1 0.09% 0 0.00% 1 0.09%
Robeson 36 3.31% 7 0.64% 0 0.00% 43 3.95%
72
Fayetteville State University
Office of Institutional Research
01/09/2017
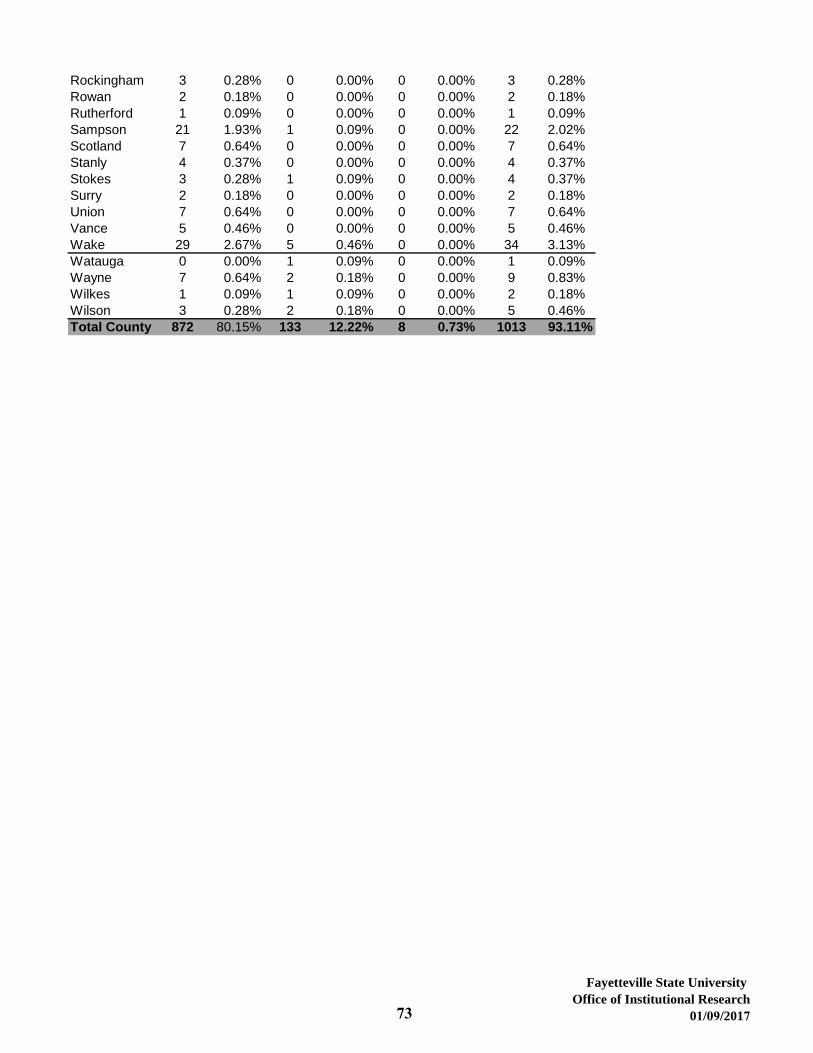
Rockingham 3 0.28% 0 0.00% 0 0.00% 3 0.28%
Rowan 2 0.18% 0 0.00% 0 0.00% 2 0.18%
Rutherford 1 0.09% 0 0.00% 0 0.00% 1 0.09%
Sampson 21 1.93% 1 0.09% 0 0.00% 22 2.02%
Scotland 7 0.64% 0 0.00% 0 0.00% 7 0.64%
Stanly 4 0.37% 0 0.00% 0 0.00% 4 0.37%
Stokes 3 0.28% 1 0.09% 0 0.00% 4 0.37%
Surry 2 0.18% 0 0.00% 0 0.00% 2 0.18%
Union 7 0.64% 0 0.00% 0 0.00% 7 0.64%
Vance 5 0.46% 0 0.00% 0 0.00% 5 0.46%
Wake 29 2.67% 5 0.46% 0 0.00% 34 3.13%
Watauga 0 0.00% 1 0.09% 0 0.00% 1 0.09%
Wayne 7 0.64% 2 0.18% 0 0.00% 9 0.83%
Wilkes 1 0.09% 1 0.09% 0 0.00% 2 0.18%
Wilson 3 0.28% 2 0.18% 0 0.00% 5 0.46%
Total County 872 80.15% 133 12.22% 8 0.73% 1013 93.11%
73
Fayetteville State University
Office of Institutional Research
01/09/2017
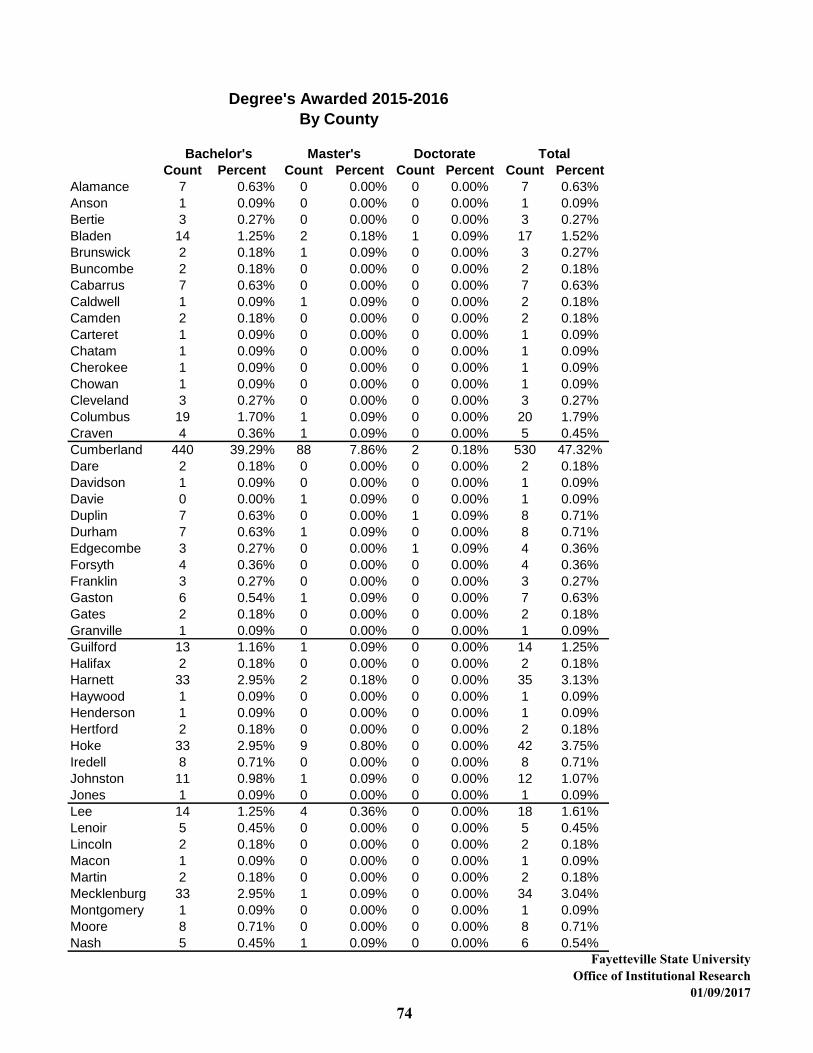
Degree's Awarded 2015-2016
By County
Bachelor's Master's Doctorate Total
Count Percent Count Percent Count Percent Count Percent
Alamance 7 0.63% 0 0.00% 0 0.00% 7 0.63%
Anson 1 0.09% 0 0.00% 0 0.00% 1 0.09%
Bertie 3 0.27% 0 0.00% 0 0.00% 3 0.27%
Bladen 14 1.25% 2 0.18% 1 0.09% 17 1.52%
Brunswick 2 0.18% 1 0.09% 0 0.00% 3 0.27%
Buncombe 2 0.18% 0 0.00% 0 0.00% 2 0.18%
Cabarrus 7 0.63% 0 0.00% 0 0.00% 7 0.63%
Caldwell 1 0.09% 1 0.09% 0 0.00% 2 0.18%
Camden 2 0.18% 0 0.00% 0 0.00% 2 0.18%
Carteret 1 0.09% 0 0.00% 0 0.00% 1 0.09%
Chatam 1 0.09% 0 0.00% 0 0.00% 1 0.09%
Cherokee 1 0.09% 0 0.00% 0 0.00% 1 0.09%
Chowan 1 0.09% 0 0.00% 0 0.00% 1 0.09%
Cleveland 3 0.27% 0 0.00% 0 0.00% 3 0.27%
Columbus 19 1.70% 1 0.09% 0 0.00% 20 1.79%
Craven 4 0.36% 1 0.09% 0 0.00% 5 0.45%
Cumberland 440 39.29% 88 7.86% 2 0.18% 530 47.32%
Dare 2 0.18% 0 0.00% 0 0.00% 2 0.18%
Davidson 1 0.09% 0 0.00% 0 0.00% 1 0.09%
Davie 0 0.00% 1 0.09% 0 0.00% 1 0.09%
Duplin 7 0.63% 0 0.00% 1 0.09% 8 0.71%
Durham 7 0.63% 1 0.09% 0 0.00% 8 0.71%
Edgecombe 3 0.27% 0 0.00% 1 0.09% 4 0.36%
Forsyth 4 0.36% 0 0.00% 0 0.00% 4 0.36%
Franklin 3 0.27% 0 0.00% 0 0.00% 3 0.27%
Gaston 6 0.54% 1 0.09% 0 0.00% 7 0.63%
Gates 2 0.18% 0 0.00% 0 0.00% 2 0.18%
Granville 1 0.09% 0 0.00% 0 0.00% 1 0.09%
Guilford 13 1.16% 1 0.09% 0 0.00% 14 1.25%
Halifax 2 0.18% 0 0.00% 0 0.00% 2 0.18%
Harnett 33 2.95% 2 0.18% 0 0.00% 35 3.13%
Haywood 1 0.09% 0 0.00% 0 0.00% 1 0.09%
Henderson 1 0.09% 0 0.00% 0 0.00% 1 0.09%
Hertford 2 0.18% 0 0.00% 0 0.00% 2 0.18%
Hoke 33 2.95% 9 0.80% 0 0.00% 42 3.75%
Iredell 8 0.71% 0 0.00% 0 0.00% 8 0.71%
Johnston 11 0.98% 1 0.09% 0 0.00% 12 1.07%
Jones 1 0.09% 0 0.00% 0 0.00% 1 0.09%
Lee 14 1.25% 4 0.36% 0 0.00% 18 1.61%
Lenoir 5 0.45% 0 0.00% 0 0.00% 5 0.45%
Lincoln 2 0.18% 0 0.00% 0 0.00% 2 0.18%
Macon 1 0.09% 0 0.00% 0 0.00% 1 0.09%
Martin 2 0.18% 0 0.00% 0 0.00% 2 0.18%
Mecklenburg 33 2.95% 1 0.09% 0 0.00% 34 3.04%
Montgomery 1 0.09% 0 0.00% 0 0.00% 1 0.09%
Moore 8 0.71% 0 0.00% 0 0.00% 8 0.71%
Nash 5 0.45% 1 0.09% 0 0.00% 6 0.54%
74
Fayetteville State University Office of Institutional Research
01/09/2017
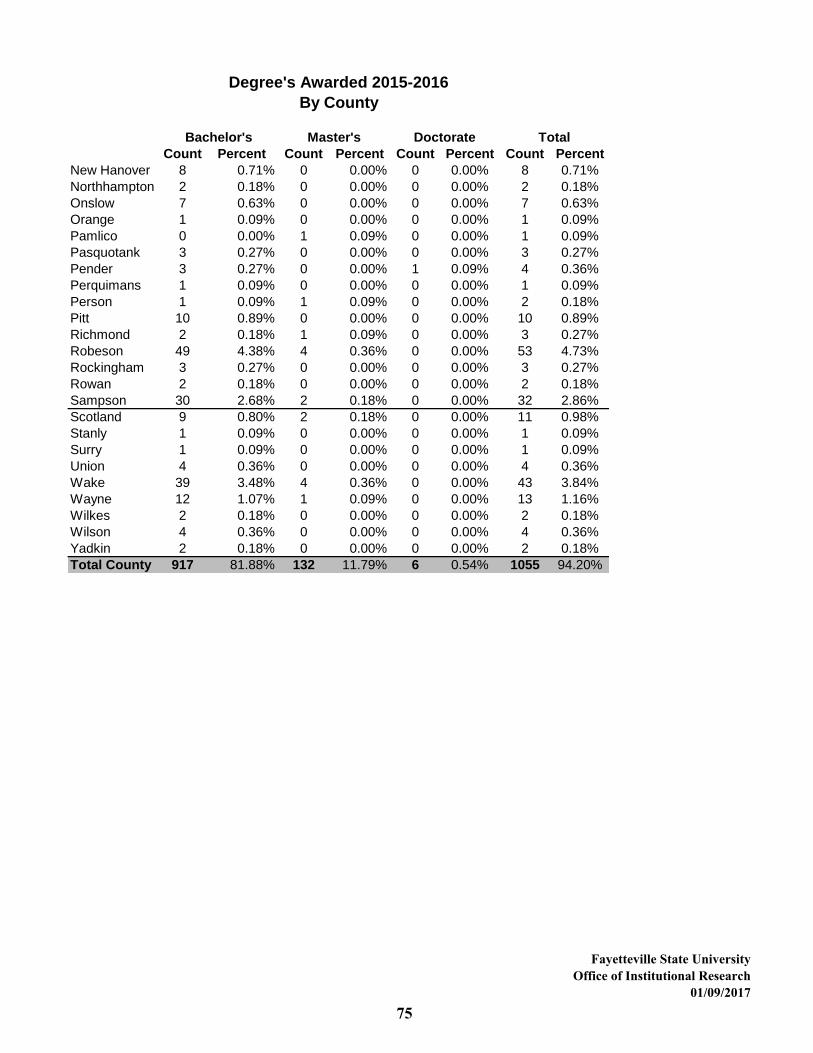
Degree's Awarded 2015-2016
By County
Bachelor's Master's Doctorate Total
Count Percent Count Percent Count Percent Count Percent
New Hanover 8 0.71% 0 0.00% 0 0.00% 8 0.71%
Northhampton 2 0.18% 0 0.00% 0 0.00% 2 0.18%
Onslow 7 0.63% 0 0.00% 0 0.00% 7 0.63%
Orange 1 0.09% 0 0.00% 0 0.00% 1 0.09%
Pamlico 0 0.00% 1 0.09% 0 0.00% 1 0.09%
Pasquotank 3 0.27% 0 0.00% 0 0.00% 3 0.27%
Pender 3 0.27% 0 0.00% 1 0.09% 4 0.36%
Perquimans 1 0.09% 0 0.00% 0 0.00% 1 0.09%
Person 1 0.09% 1 0.09% 0 0.00% 2 0.18%
Pitt 10 0.89% 0 0.00% 0 0.00% 10 0.89%
Richmond 2 0.18% 1 0.09% 0 0.00% 3 0.27%
Robeson 49 4.38% 4 0.36% 0 0.00% 53 4.73%
Rockingham 3 0.27% 0 0.00% 0 0.00% 3 0.27%
Rowan 2 0.18% 0 0.00% 0 0.00% 2 0.18%
Sampson 30 2.68% 2 0.18% 0 0.00% 32 2.86%
Scotland 9 0.80% 2 0.18% 0 0.00% 11 0.98%
Stanly 1 0.09% 0 0.00% 0 0.00% 1 0.09%
Surry 1 0.09% 0 0.00% 0 0.00% 1 0.09%
Union 4 0.36% 0 0.00% 0 0.00% 4 0.36%
Wake 39 3.48% 4 0.36% 0 0.00% 43 3.84%
Wayne 12 1.07% 1 0.09% 0 0.00% 13 1.16%
Wilkes 2 0.18% 0 0.00% 0 0.00% 2 0.18%
Wilson 4 0.36% 0 0.00% 0 0.00% 4 0.36%
Yadkin 2 0.18% 0 0.00% 0 0.00% 2 0.18%
Total County 917 81.88% 132 11.79% 6 0.54% 1055 94.20%
75
Fayetteville State University Office of Institutional Research
01/09/2017

Count Percent Count Percent Count Percent Count PercentAlabama 0 0.00% 1 0.09% 0 0.00% 1 0.09%California 0 0.00% 1 0.09% 0 0.00% 1 0.09%Colorado 1 0.09% 2 0.18% 0 0.00% 3 0.27%Connecticut 0 0.00% 1 0.09% 0 0.00% 1 0.09%Dist. Of Columbia 10 0.89% 0 0.00% 0 0.00% 10 0.89%Florida 0 0.00% 1 0.09% 0 0.00% 1 0.09%Georgia 2 0.18% 1 0.09% 0 0.00% 3 0.27%Hawaii 0 0.00% 1 0.09% 0 0.00% 1 0.09%Illinois 2 0.18% 0 0.00% 0 0.00% 2 0.18%Indiana 0 0.00% 1 0.09% 0 0.00% 1 0.09%Iowa 0 0.00% 1 0.09% 0 0.00% 1 0.09%Maryland 5 0.45% 2 0.18% 0 0.00% 7 0.62%Massachusetts 0 0.00% 1 0.09% 0 0.00% 1 0.09%Michigan 1 0.09% 0 0.00% 0 0.00% 1 0.09%Missouri 1 0.09% 0 0.00% 0 0.00% 1 0.09%New Jersey 4 0.36% 0 0.00% 0 0.00% 4 0.36%New York 1 0.09% 5 0.45% 0 0.00% 6 0.53%Oregon 0 0.00% 1 0.09% 0 0.00% 1 0.09%Pennsylvania 1 0.09% 0 0.00% 0 0.00% 1 0.09%South Carolina 2 0.18% 1 0.09% 0 0.00% 3 0.27%Tennessee 0 0.00% 1 0.09% 0 0.00% 1 0.09%Texas 0 0.00% 13 1.16% 0 0.00% 13 1.16%Utah 0 0.00% 1 0.09% 0 0.00% 1 0.09%Virginia 4 0.36% 3 0.27% 0 0.00% 7 0.62%Washington 0 0.00% 1 0.09% 0 0.00% 1 0.09%Unknown 1 0.09% 2 0.18% 0 0.00% 3 0.27%Foreign Countries 11 0.98% 2 0.18% 0 0.00% 13 1.16%Total State 46 4.10% 43 3.83% 0 0.00% 89 7.93%Total Residence 937 83.44% 179 15.94% 7 0.62% 1123 100.00%
76
Degrees Awarded 2012-2013By State
Bachelor's Master's Doctorate Total
Fayetteville State University Office of Instiutional Research
01/09/2017

Fayetteville State University Office of Institutional Research
01/09/2017
Count Percent Count Percent Count Percent Count PercentArizona 1 0.09% 0 0.00% 0 0.00% 0 0.00%Arkansas 1 0.09% 0 0.00% 0 0.00% 1 0.09%California 1 0.09% 0 0.00% 0 0.00% 1 0.09%Delaware 1 0.09% 0 0.00% 0 0.00% 1 0.09%Dist. Of Columbia 6 0.52% 0 0.00% 0 0.00% 6 0.52%Florida 1 0.09% 0 0.00% 0 0.00% 1 0.09%Georgia 0 0.00% 4 0.34% 0 0.00% 4 0.34%Hawaii 0 0.00% 1 0.09% 0 0.00% 1 0.09%Indiana 0 0.00% 1 0.09% 0 0.00% 1 0.09%Kansas 0 0.00% 1 0.09% 0 0.00% 1 0.09%Kentucky 0 0.00% 2 0.17% 0 0.00% 2 0.17%Louisiana 0 0.00% 1 0.09% 0 0.00% 1 0.09%Maryland 3 0.26% 0 0.00% 0 0.00% 3 0.26%New Jersey 3 0.26% 1 0.09% 0 0.00% 4 0.34%New York 2 0.17% 0 0.00% 0 0.00% 2 0.17%Oklahoma 0 0.00% 1 0.09% 0 0.00% 1 0.09%South Carolina 2 0.17% 2 0.17% 0 0.00% 4 0.34%Tennessee 0 0.00% 3 0.26% 0 0.00% 3 0.26%Texas 0 0.00% 10 0.86% 0 0.00% 10 0.86%Virginia 2 0.17% 1 0.09% 0 0.00% 3 0.26%Washington 0 0.00% 4 0.34% 0 0.00% 4 0.34%Unknown 0 0.00% 2 0.17% 0 0.00% 2 0.17%Foreign Countries 14 1.20% 0 0.00% 0 0.00% 14 1.20%Total State 37 3.18% 34 2.92% 0 0.00% 70 6.01%Total Residence 965 82.83% 193 16.57% 7 0.60% 1,165 100.00%
77
Degrees Awarded 2013-2014By State
Bachelor's Master's Doctorate Total
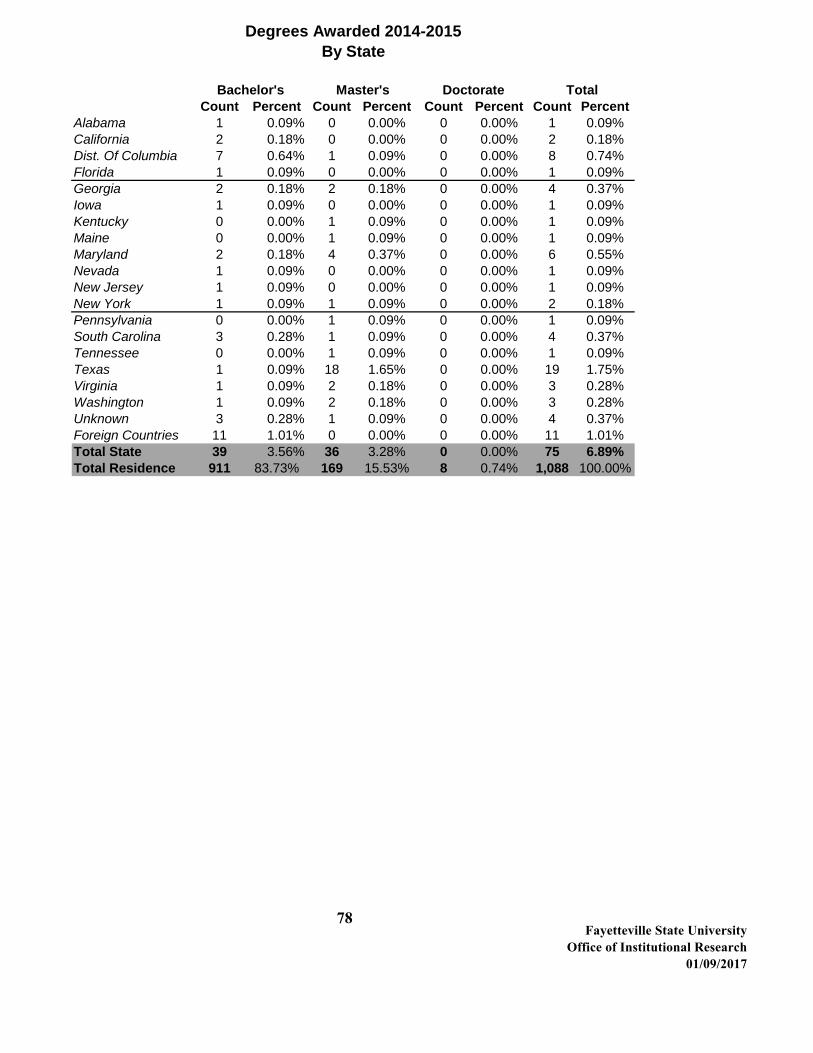
Fayetteville State University Office of Institutional Research
01/09/2017
Count Percent Count Percent Count Percent Count PercentAlabama 1 0.09% 0 0.00% 0 0.00% 1 0.09%California 2 0.18% 0 0.00% 0 0.00% 2 0.18%Dist. Of Columbia 7 0.64% 1 0.09% 0 0.00% 8 0.74%Florida 1 0.09% 0 0.00% 0 0.00% 1 0.09%Georgia 2 0.18% 2 0.18% 0 0.00% 4 0.37%Iowa 1 0.09% 0 0.00% 0 0.00% 1 0.09%Kentucky 0 0.00% 1 0.09% 0 0.00% 1 0.09%Maine 0 0.00% 1 0.09% 0 0.00% 1 0.09%Maryland 2 0.18% 4 0.37% 0 0.00% 6 0.55%Nevada 1 0.09% 0 0.00% 0 0.00% 1 0.09%New Jersey 1 0.09% 0 0.00% 0 0.00% 1 0.09%New York 1 0.09% 1 0.09% 0 0.00% 2 0.18%Pennsylvania 0 0.00% 1 0.09% 0 0.00% 1 0.09%South Carolina 3 0.28% 1 0.09% 0 0.00% 4 0.37%Tennessee 0 0.00% 1 0.09% 0 0.00% 1 0.09%Texas 1 0.09% 18 1.65% 0 0.00% 19 1.75%Virginia 1 0.09% 2 0.18% 0 0.00% 3 0.28%Washington 1 0.09% 2 0.18% 0 0.00% 3 0.28%Unknown 3 0.28% 1 0.09% 0 0.00% 4 0.37%Foreign Countries 11 1.01% 0 0.00% 0 0.00% 11 1.01%Total State 39 3.56% 36 3.28% 0 0.00% 75 6.89%Total Residence 911 83.73% 169 15.53% 8 0.74% 1,088 100.00%
78
Degrees Awarded 2014-2015By State
Bachelor's Master's Doctorate Total

Count Percent Count Percent Count Percent Count Percent
Alabama 1 0.09% 0 0.00% 0 0.00% 1 0.09%
California 1 0.09% 0 0.00% 0 0.00% 1 0.09%
Colorado 1 0.09% 0 0.00% 0 0.00% 1 0.09%
Dist. Of Columbia 4 0.36% 0 0.00% 0 0.00% 4 0.36%
Florida 1 0.09% 0 0.00% 0 0.00% 1 0.09%
Georgia 6 0.54% 1 0.09% 0 0.00% 7 0.63%
Hawaii 1 0.09% 0 0.00% 0 0.00% 1 0.09%
Maryland 4 0.36% 1 0.09% 0 0.00% 5 0.45%
Massachusetts 1 0.09% 0 0.00% 0 0.00% 1 0.09%
Michigan 2 0.18% 0 0.00% 0 0.00% 2 0.18%
New Jersey 1 0.09% 0 0.00% 0 0.00% 1 0.09%
New York 2 0.18% 0 0.00% 0 0.00% 2 0.18%
Oklahoma 1 0.09% 0 0.00% 0 0.00% 1 0.09%
South Carolina 2 0.18% 0 0.00% 0 0.00% 2 0.18%
Texas 0 0.00% 26 2.32% 0 0.00% 26 2.32%
Virginia 4 0.36% 0 0.00% 0 0.00% 4 0.36%
Washington 1 0.09% 0 0.00% 0 0.00% 1 0.09%
Foreign Countries 3 0.27% 1 0.09% 0 0.00% 4 0.36%
Total State 36 3.21% 29 2.59% 0 0.00% 65 5.80%
Total Residence 953 85.09% 161 14.38% 6 0.54% 1120 100.00%
79
Degrees Awarded 2015-2016
By State
Bachelor's Master's Doctorate Total
Fayetteville State University Office of Institutional Research
01/09/2017

Retention, Graduation and Persistence Rates of First-Time Full-Time Freshmen At Fayetteville State University Group= All Students____________________________________________________________________________________________________________________________________________| Original Institution |Any UNC Institution ||Yr of Number In|After Year Number |After Year Number ||Entry Class | 1 2 3 4 5 6 7 8 9 10 | 1 2 3 4 5 6 7 8 9 10||Panel A - Retention | |1997.....511......|.72.8..57.5..48.1..28.4..15.1...5.9...3.1...4.3...4.7...2.0.|.76.5..62.4..52.4..32.3..17.0...7.4...3.7...5.3...5.3.|1998 519 | 74.2 54.9 46.4 31.8 13.3 4.6 3.7 2.7 1.2 0.4 | 77.3 59.3 50.5 35.6 16.6 6.6 6.0 4.0 1.9 0.8||1999 799 | 72.6 60.2 52.9 25.0 9.6 5.5 4.0 2.5 2.5 2.0 | 75.2 65.7 58.2 29.9 12.4 7.4 4.8 3.1 2.8 2.3| | |2000 535 | 71.0 56.8 48.6 31.4 10.8 5.8 3.7 2.4 1.9 1.9 | 76.1 63.6 55.5 35.9 13.6 7.5 5.0 3.6 2.4 2.4||2001 763 | 73.9 55.8 51.2 31.8 13.2 7.2 3.1 2.4 1.8 1.2 | 76.5 59.2 55.2 35.9 15.9 7.9 3.5 2.8 2.2 2.0| |2001 763 | 73.9 55.8 51.2 31.8 13.2 7.2 3.1 2.4 1.8 1.2 | 76.5 59.2 55.2 35.9 15.9 7.9 3.5 2.8 2.2 2.0| |2002 734 | 73.4 59.8 53.0 30.7 14.3 7.4 4.1 2.2 1.4 1.2 | 75.3 64.7 57.6 34.6 16.1 8.6 4.8 3.0 2.3 2.3||2003 794 | 72.7 57.4 49.7 30.7 14.1 7.2 3.9 3.7 1.8 1.0 | 75.9 63.0 55.4 35.5 17.0 8.7 5.0 4.3 2.4 1.6||2004 760 | 75.3 60.5 52.9 35.9 17.5 6.8 3.4 2.2 1.7 1.3 | 78.0 63.9 57.0 39.3 19.1 8.0 3.9 2.8 2.2 1.4| |2005 835 | 70.9 55.0 46.1 32.0 14.3 5.7 3.7 3.0 1.9 1.9 | 73.5 58.7 49.6 35.6 16.5 7.2 4.7 3.6 2.4 2.3||2006 823 | 73.3 55.5 46.1 28.9 11.8 5.3 3.2 1.6 1.6 . | 75.6 60.9 51.9 33.4 14.9 7.5 4.6 2.9 2.3 . ||2007 931 | 69.3 52.5 42.6 26.9 9.9 4.2 2.8 2.3 . . | 73.3 58.6 48.4 31.9 14.0 5.8 3.9 2.7 . . ||2008 579 | 73.6 53.2 47.3 26.8 9.8 4.0 2.1 . . . | 79.3 61.3 54.6 32.0 12.8 5.2 2.8 . . . ||2009 754 | 69.1 51.7 45.1 24.4 8.5 3.4 . . . . | 74.4 59.5 53.1 30.8 12.2 5.3 . . . . ||2010 538 | 72.3 58.6 48.7 27.5 12.6 . . . . . | 77.0 64.9 54.1 31.8 16.2 . . . . . ||2011 647 | 75.6 55.6 49.9 28.0 . . . . . . | 80.5 62.4 56.1 34.6 . . . . . . ||2012 600 | 71.3 55.8 47.5 . . . . . . . | 76.8 61.8 53.5 . . . . . . . ||2013 689 | 74.5 57.5 . . . . . . . . | 77.8 62.4 . . . . . . . . | |2014 468 | 79.1 . . . . . . . . . | 82.9 . . . . . . . . . |Panel B - Graduation|1998 519 | 0.0 0.0 0.0 12.1 28.5 34.9 38.2 38.9 39.7 39.9 | 0.0 0.0 0.0 12.5 29.5 36.4 40.1 41.2 42.4 43.0| |1998 519 | 0.0 0.0 0.0 12.1 28.5 34.9 38.2 38.9 39.7 39.9 | 0.0 0.0 0.0 12.5 29.5 36.4 40.1 41.2 42.4 43.0| |1999 799 | 0.0 0.0 0.4 24.4 38.5 42.2 43.2 43.8 44.3 44.7 | 0.0 0.0 0.4 24.9 40.3 44.9 46.7 47.7 48.2 48.7| |2000 535 | 0.0 0.0 0.6 14.2 31.8 37.0 38.7 40.2 40.7 40.9 | 0.0 0.0 0.7 15.5 35.0 41.1 43.2 44.9 45.6 45.8| 1996 587 | 0.0 0.0 0.5 23.0 34.2 38.5 39.5 40.7 40.9 40.9 | 0.0 0.0 0.9 23.7 36.3 41.6 42.8 44.3 44.8 44.8| |1999 799 | 0.0 0.0 0.4 24.4 38.5 42.2 43.2 43.8 44.3 44.7 | 0.0 0.0 0.4 24.9 40.3 44.9 46.7 47.7 48.2 48.7| |1999 799 | 0.0 0.0 0.4 24.4 38.5 42.2 43.2 43.8 44.3 44.7 | 0.0 0.0 0.4 24.9 40.3 44.9 46.7 47.7 48.2 48.7| 1997 511 | 0.0 0.0 0.8 18.0 31.5 38.0 41.1 42.1 42.7 44.2 | 0.0 0.0 0.8 18.4 32.7 40.3 44.0 45.2 45.8 47.4| |2000 535 | 0.0 0.0 0.6 14.2 31.8 37.0 38.7 40.2 40.7 40.9 | 0.0 0.0 0.7 15.5 35.0 41.1 43.2 44.9 45.6 45.8| |2000 535 | 0.0 0.0 0.6 14.2 31.8 37.0 38.7 40.2 40.7 40.9 | 0.0 0.0 0.7 15.5 35.0 41.1 43.2 44.9 45.6 45.8| |2001 763 | 0.0 0.0 0.4 15.7 30.4 35.6 38.3 39.4 40.2 40.6 | 0.0 0.0 0.4 16.1 32.1 38.7 41.5 43.0 43.9 44.3| |2002 734 | 0.0 0.0 1.0 18.4 31.9 38.0 40.6 42.2 43.5 43.7 | 0.0 0.0 1.0 18.7 34.2 41.1 44.4 46.2 47.5 48.0| |2003 794 | 0.0 0.0 0.6 12.7 25.3 31.5 34.6 35.6 36.4 . | 0.0 0.0 0.6 13.4 27.7 34.8 38.4 39.7 40.7 . | 1998 519 | 0.0 0.0 0.0 12.1 28.5 34.9 38.2 38.9 39.7 39.9 | 0.0 0.0 0.0 12.5 29.5 36.4 40.1 41.2 42.4 43.0| |2001 763 | 0.0 0.0 0.4 15.7 30.4 35.6 38.3 39.4 40.2 40.6 | 0.0 0.0 0.4 16.1 32.1 38.7 41.5 43.0 43.9 44.3| |2001 763 | 0.0 0.0 0.4 15.7 30.4 35.6 38.3 39.4 40.2 40.6 | 0.0 0.0 0.4 16.1 32.1 38.7 41.5 43.0 43.9 44.3| |2002 734 | 0.0 0.0 1.0 18.4 31.9 38.0 40.6 42.2 43.5 43.7 | 0.0 0.0 1.0 18.7 34.2 41.1 44.4 46.2 47.5 48.0| 1999 799 | 0.0 0.0 0.4 24.4 38.5 42.2 43.2 43.8 44.3 44.7 | 0.0 0.0 0.4 24.9 40.3 44.9 46.7 47.7 48.2 48.7| |2002 734 | 0.0 0.0 1.0 18.4 31.9 38.0 40.6 42.2 43.5 43.7 | 0.0 0.0 1.0 18.7 34.2 41.1 44.4 46.2 47.5 48.0| |2002 734 | 0.0 0.0 1.0 18.4 31.9 38.0 40.6 42.2 43.5 43.7 | 0.0 0.0 1.0 18.7 34.2 41.1 44.4 46.2 47.5 48.0| |2003 794 | 0.0 0.0 0.6 12.7 25.3 31.5 34.6 35.6 36.4 . | 0.0 0.0 0.6 13.4 27.7 34.8 38.4 39.7 40.7 . | |2004 760 | 0.0 0.0 0.1 11.4 26.3 33.6 37.1 37.8 . . | 0.0 0.0 0.1 11.8 28.3 36.1 40.0 40.9 . . | |2005 835 | 0.0 0.1 0.2 9.3 23.7 30.5 32.7 . . . | 0.0 0.1 0.2 9.8 25.3 32.7 35.6 . . . | 2000 535 | 0.0 0.0 0.6 14.2 31.8 37.0 38.7 40.2 40.7 40.9 | 0.0 0.0 0.7 15.5 35.0 41.1 43.2 44.9 45.6 45.8| |2003 794 | 0.0 0.0 0.6 12.7 25.3 31.5 34.6 35.6 36.4 36.9 | 0.0 0.0 0.6 13.4 27.7 34.8 38.4 39.7 40.7 41.3| | 0.0 0.0 0.4 15.7 30.4 35.6 38.3 39.4 40.2 40.6 | 0.0 0.0 0.4 16.1 32.1 38.7 41.5 43.0 43.9 44.3| |2004 760 | 0.0 0.0 0.1 11.3 26.2 33.4 37.0 37.6 38.0 38.6 | 0.0 0.0 0.1 11.7 28.2 35.9 39.9 40.8 41.2 41.8| 0.0 0.0 1.0 18.4 31.9 38.0 40.6 42.2 43.5 43.7 | 0.0 0.0 1.0 18.7 34.2 41.1 44.4 46.2 47.5 48.0| |2005 835 | 0.0 0.1 0.2 9.3 23.7 30.5 32.7 34.1 35.3 35.7 | 0.0 0.1 0.2 9.8 25.3 32.7 35.6 37.1 38.6 39.2||2006 823 | 0.0 0.0 0.2 11.8 25.0 31.0 33.0 34.1 34.9 . | 0.0 0.0 0.2 12.5 27.5 34.4 37.2 38.6 40.1 . ||2007 931 | 0.0 0.0 0.1 12.0 27.2 32.1 33.2 33.8 . . | 0.0 0.1 0.2 12.5 29.1 36.0 37.6 38.8 . . ||2008 579 | 0.0 0.0 0.9 17.1 29.9 34.5 36.4 . . . | 0.0 0.0 0.9 18.5 34.2 39.7 42.3 . . . | . . . . | |2009 754 | 0.0 0.1 1.7 16.0 27.9 31.7 . . . . | 0.0 0.1 1.7 17.5 32.2 37.4 . . . . | | 0.0 0.0 0.1 12.0 27.2 . . . . . | 0.0 0.1 0.2 12.5 29.1 . . . . . | |2010 538 | 0.0 0.2 1.1 16.5 26.8 . . . . . | 0.0 0.2 1.1 17.7 28.6 . . . . . | | 0.0 0.0 0.9 17.1 . . . . . . | 0.0 0.0 0.9 18.5 . . . . . . | |2011 647 | 0.0 0.2 1.1 17.0 . . . . . . | 0.0 0.2 1.1 17.6 . . . . . . | 2009 754 | 0.0 0.1 1.7 . . . . . . . | 0.0 0.1 1.7 . . . . . . . | |2012 600 | 0.0 1.0 2.3 . . . . . . . | 0.0 1.0 2.3 . . . . . . . | |2013 689 | 0.0 1.5 . . . . . . . . | 0.0 1.6 . . . . . . . . ||2014 468 | 0.0 . . . . . . . . . | 0.0 . . . . . . . . . |Panel C - Persistence ||1998 519 | 74.2 54.9 46.4 43.9 41.8 39.5 41.8 41.6 40.8 40.3 | 77.3 59.3 50.5 48.2 46.1 43.0 46.1 45.3 44.3 43.7||1999 799 | 72.6 60.2 53.3 49.4 48.2 47.7 47.2 46.3 46.8 46.7 | 75.2 65.7 58.6 54.8 52.7 52.3 51.4 50.8 50.9 50.9| |2000 535 | 71.0 56.8 49.2 45.6 42.6 42.8 42.4 42.6 42.6 42.8 | 76.1 63.6 56.3 51.4 48.6 48.6 48.2 48.4 48.0 48.2| |2001 763 | 73.9 55.8 51.6 47.6 43.6 42.9 41.4 41.8 42.1 41.8 | 76.5 59.2 55.6 52.0 48.0 46.5 45.1 45.7 46.1 46.3| 1999 799 | 72.6 60.2 53.3 49.4 48.2 47.7 47.2 46.3 46.8 46.7 | 75.2 65.7 58.6 54.8 52.7 52.3 51.4 50.8 50.9 50.9| |2002 734 | 73.4 59.8 54.0 49.0 46.2 45.4 44.7 44.4 44.8 45.0 | 75.3 64.7 58.6 53.3 50.3 49.7 49.2 49.2 49.9 50.3| |2003 794 | 72.7 57.4 50.4 43.5 39.4 38.7 38.5 39.3 38.2 37.9 | 75.9 63.0 56.0 48.9 44.7 43.5 43.5 44.0 43.1 42.9| 763 | 73.9 55.8 51.6 47.6 43.6 42.9 41.4 41.8 42.1 41.8 | 76.5 59.2 55.6 52.0 48.0 46.5 45.1 45.7 46.1 46.3| |2004 760 | 75.3 60.5 53.0 47.2 43.7 40.3 40.4 39.9 39.7 39.9 | 78.0 63.9 57.1 51.1 47.2 43.9 43.8 43.6 43.4 43.3| |2005 835 | 70.9 55.1 46.3 41.3 38.0 36.3 36.4 37.1 37.2 37.6 | 73.5 58.8 49.8 45.4 41.8 39.9 40.2 40.7 41.0 41.4| |2005 835 | 70.9 55.1 46.3 41.3 38.0 36.3 36.4 . . . | 73.5 58.8 49.8 45.4 41.8 39.9 40.2 . . . | 2003 794 | 72.7 57.4 50.4 43.5 39.4 38.7 38.5 39.3 38.2 . | 75.9 63.0 56.0 48.9 44.7 43.5 43.5 44.0 43.1 . | |2006 823 | 73.3 55.5 46.3 40.7 36.8 36.3 36.2 35.7 36.5 . | 75.6 60.9 52.1 45.9 42.4 41.9 41.8 41.6 42.4 . | |2007 931 | 69.3 52.5 42.7 38.9 37.1 36.3 36.0 36.1 . . | 73.3 58.8 48.7 44.4 43.1 41.8 41.5 41.5 . . | |2008 579 | 73.6 53.2 48.2 43.9 39.7 38.5 38.5 . . . | 79.3 61.3 55.4 50.4 47.0 44.9 45.1 . . . | |2009 754 | 69.1 51.9 46.8 40.5 36.3 35.1 . . . . | 74.4 59.7 54.8 48.3 44.4 42.7 . . . . | |2010 538 | 72.3 58.7 49.8 44.1 39.4 . . . . . | 77.0 65.1 55.2 49.4 44.8 . . . . . | |2011 647 | 75.6 55.8 51.0 45.0 . . . . . . | 80.5 62.6 57.2 52.2 . . . . . . | |2012 600 | 71.3 56.8 49.8 . . . . . . . | 76.8 62.8 55.8 . . . . . . . | . . . . . . . . | |2013 689 | 74.5 58.9 . . . . . . . . | 77.8 64.0 . . . . . . . . | |2014 468 | 79.1 . . . . . . . . . | 82.9 . . . . . . . . . |
Fayetteville State University Office of Institutional Research 01/09/2017 80

Faculty & Staff
Personnel
A total of 894 individuals worked at Fayetteville State University as of October 1, 2016. For the past year, of that number, 359 (40%) were faculty (includes full or part-time faculty, administrators with faculty status, retirees on contract, visiting faculty, and coaches with faculty status). The remaining 535 (60%) were administrators or support personnel. Fifty-three percent of the employees were black, 19% white, 5% Asian, 3%Hispanic, 1% Amer. Indian, 1% Non-Resident Alien, and 18% were of an unknown race. Fifty-seven percent of employees were women and 43% were men.
Faculty
Fayetteville State University had a total of 359 teaching faculty (256 full-time and 103 part-time) as of October 1, 2016. Of the 256 full-time faculty, 84% held the doctorate or 1st professional degree. Of this number, 68% had earned tenure, while 30% were on track. Fifty-three percent of full-time faculty members were male, and 47% were female. Thirty-seven percent of the faculty body were black, 29% white, 12% Asian, 2% Hispanic, 4% Non-Resident Alien, and 16% were of an unknown race. The assistant professor rank accounted for 29% of the faculty, while close to 33% were classified as associate professors. The mean salary of AAUP Faculty (with 11/12 month converted to 9 month) is $81,092 for males and $78,650 for females.
Fayetteville State University
2016-17 Board of Governors’ Award for Excellence in Teaching Dr. Heather Griffiths
2016-17 Teacher of the Year Award Dr. Ji Young Kim
2016-17 Staff of the Year Ms. Carlitta Moore
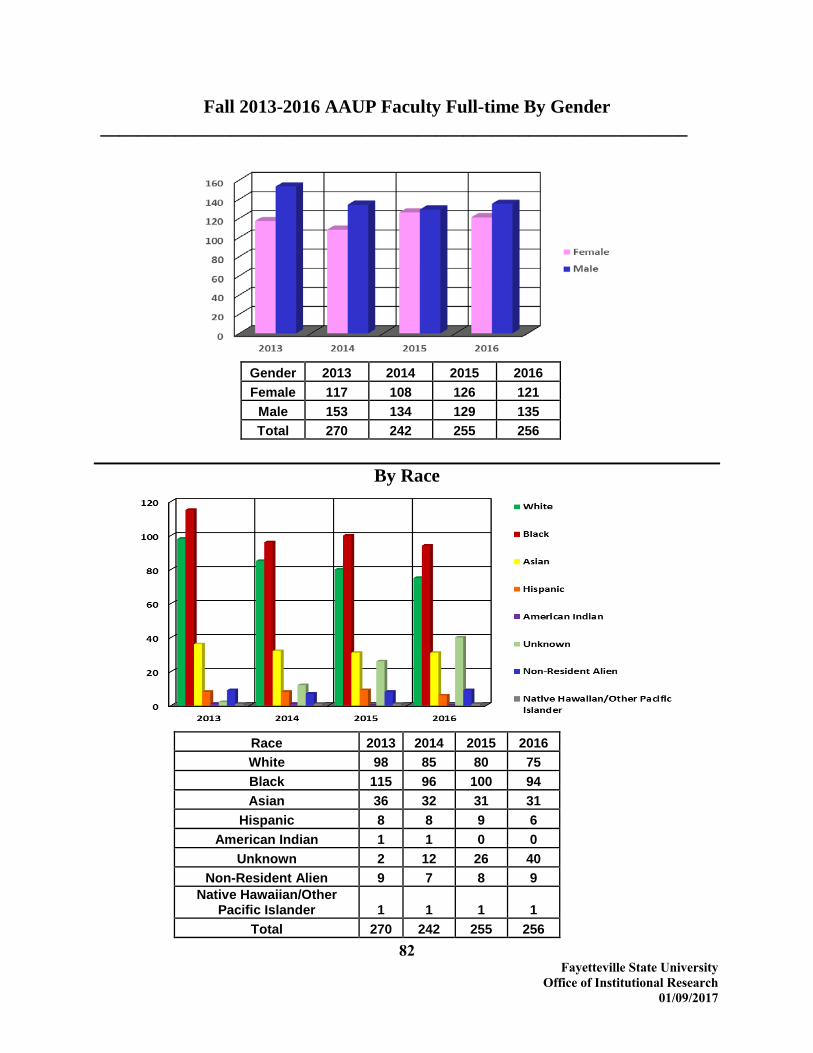
82 Fayetteville State University
Office of Institutional Research 01/09/2017
Fall 2013-2016 AAUP Faculty Full-time By Gender _______________________________________________________________
Gender 2013 2014 2015 2016 Female 117 108 126 121
Male 153 134 129 135 Total 270 242 255 256
By Race
Race 2013 2014 2015 2016 White 98 85 80 75 Black 115 96 100 94 Asian 36 32 31 31
Hispanic 8 8 9 6 American Indian 1 1 0 0
Unknown 2 12 26 40 Non-Resident Alien 9 7 8 9
Native Hawaiian/Other Pacific Islander 1 1 1 1
Total 270 242 255 256
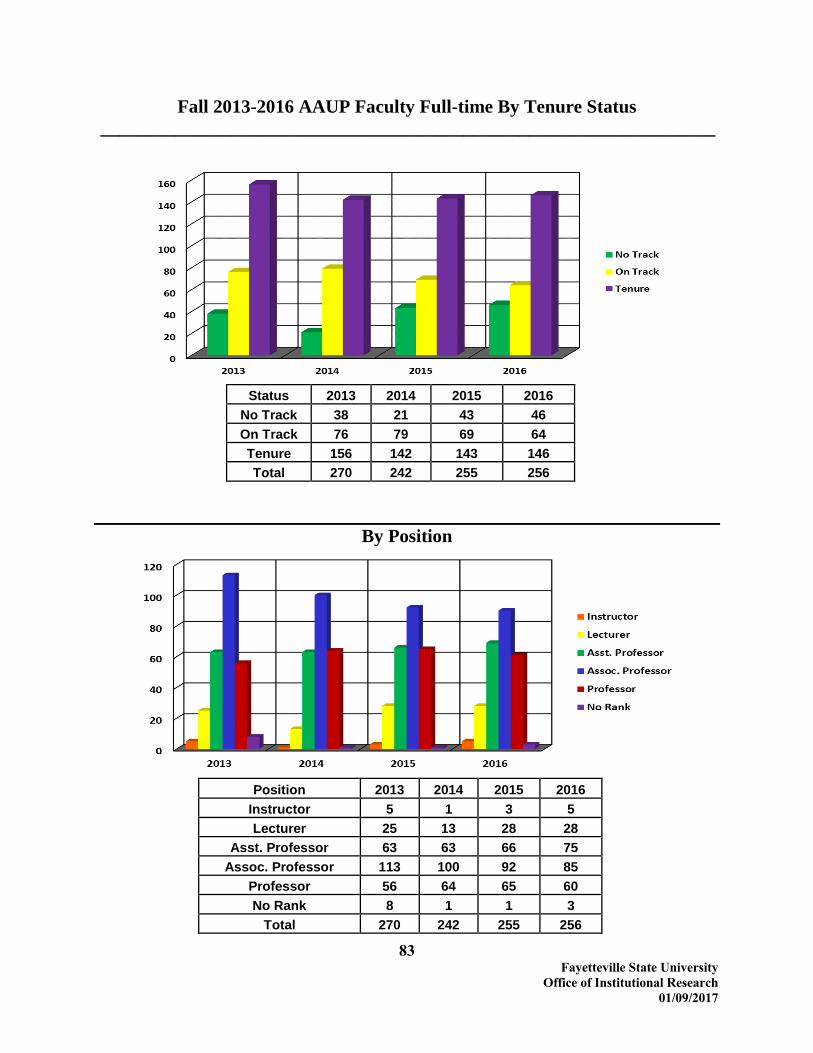
83 Fayetteville State University
Office of Institutional Research 01/09/2017
Fall 2013-2016 AAUP Faculty Full-time By Tenure Status __________________________________________________________________
Status 2013 2014 2015 2016 No Track 38 21 43 46 On Track 76 79 69 64 Tenure 156 142 143 146 Total 270 242 255 256
By Position
Position 2013 2014 2015 2016 Instructor 5 1 3 5 Lecturer 25 13 28 28
Asst. Professor 63 63 66 75 Assoc. Professor 113 100 92 85
Professor 56 64 65 60 No Rank 8 1 1 3
Total 270 242 255 256

84 Fayetteville State University
Office of Institutional Research 01/09/2017
Fall 2012-2015 AAUP Faculty Full-time By Degree __________________________________________________________________
Degree 2013 2014 2015 2016 Doctor 232 214 208 213
1st Professional 3 3 4 3 Master 34 23 40 37
Bachelor 1 2 3 3 Total 270 242 255 256
By Fall 2013 AAUP Faculty Full-time By Average Salary
Salary Male Female Lecturer $55,849 $55,335
Instructor $73,333 $58,342 Asst. Professor $68,666 $69,523
Assoc. Professor $73,639 $74,199 Professor $96,189 $100,803 No Rank $70,493 $54,511 All Ranks $76,642 $74,017

85 Fayetteville State University
Office of Institutional Research 01/09/2017
Fall 2014 AAUP Faculty Full-time By Average Salary __________________________________________________________________
By Fall 2015 AAUP Faculty Full-time By Average Salary
Salary Male Female Lecturer $55,755 $59,646
Instructor $0 $58,000 Asst. Professor $69,753 $70,687
Assoc. Professor $74,700 $74,817 Professor $87,346 $97,778 No Rank $0 $72,500 All Ranks $76,671 $77,110
Salary Male Female Lecturer $59,778 $58,715
Instructor $0 $54,038 Asst. Professor $69,843 $70,157
Assoc. Professor $74,810 $76,319 Professor $86,217 $96,434 No Rank $48,000 $0 All Ranks $76,150 $74,989

86 Fayetteville State University Office of Institutional Research
01/09/2017
Fall 2016 AAUP Faculty Full-time By Average Salary __________________________________________________________________
Salary Male Female Lecturer $61,138 $62,581
Instructor $79,500 $71,415 Asst. Professor $77,801 $74,613
Assoc. Professor $79,727 $80,096 Professor $91,817 $101,092 No Rank $45,724 $74,323 All Ranks $81,092 $78,650
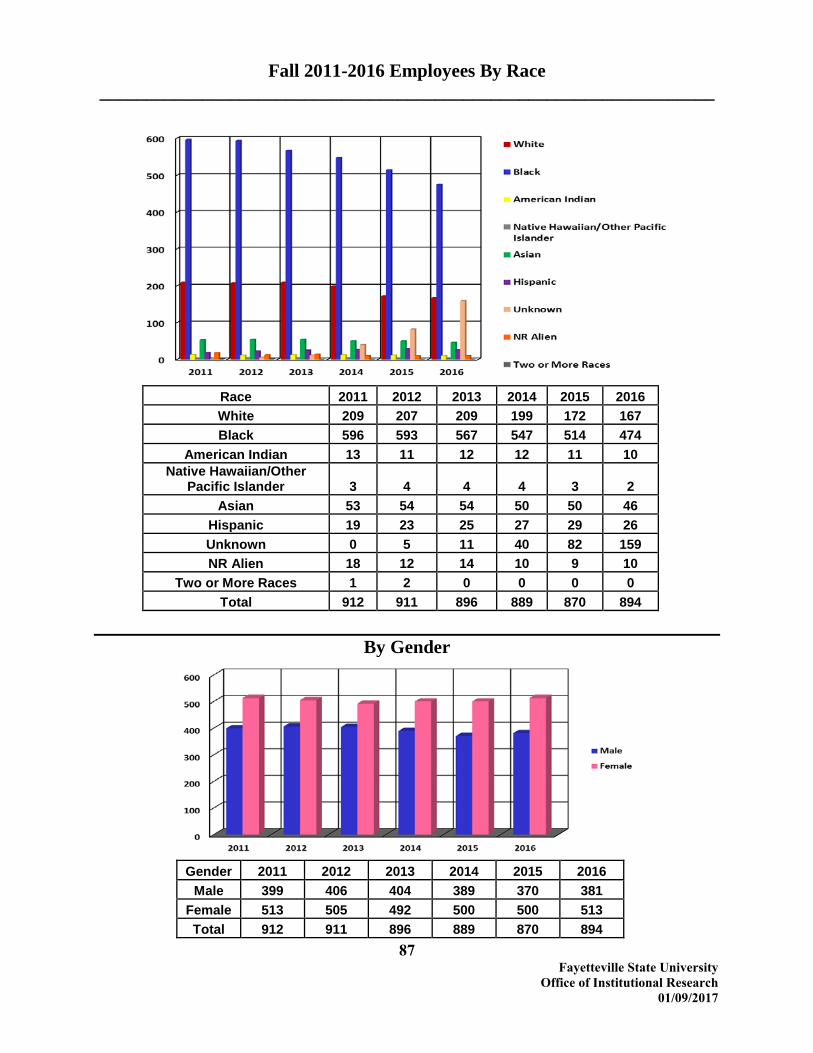
87 Fayetteville State University
Office of Institutional Research 01/09/2017
Fall 2011-2016 Employees By Race __________________________________________________________________
Race 2011 2012 2013 2014 2015 2016 White 209 207 209 199 172 167 Black 596 593 567 547 514 474
American Indian 13 11 12 12 11 10 Native Hawaiian/Other
Pacific Islander 3 4 4 4 3 2 Asian 53 54 54 50 50 46
Hispanic 19 23 25 27 29 26 Unknown 0 5 11 40 82 159 NR Alien 18 12 14 10 9 10
Two or More Races 1 2 0 0 0 0 Total 912 911 896 889 870 894
By Gender
Gender 2011 2012 2013 2014 2015 2016 Male 399 406 404 389 370 381
Female 513 505 492 500 500 513 Total 912 911 896 889 870 894
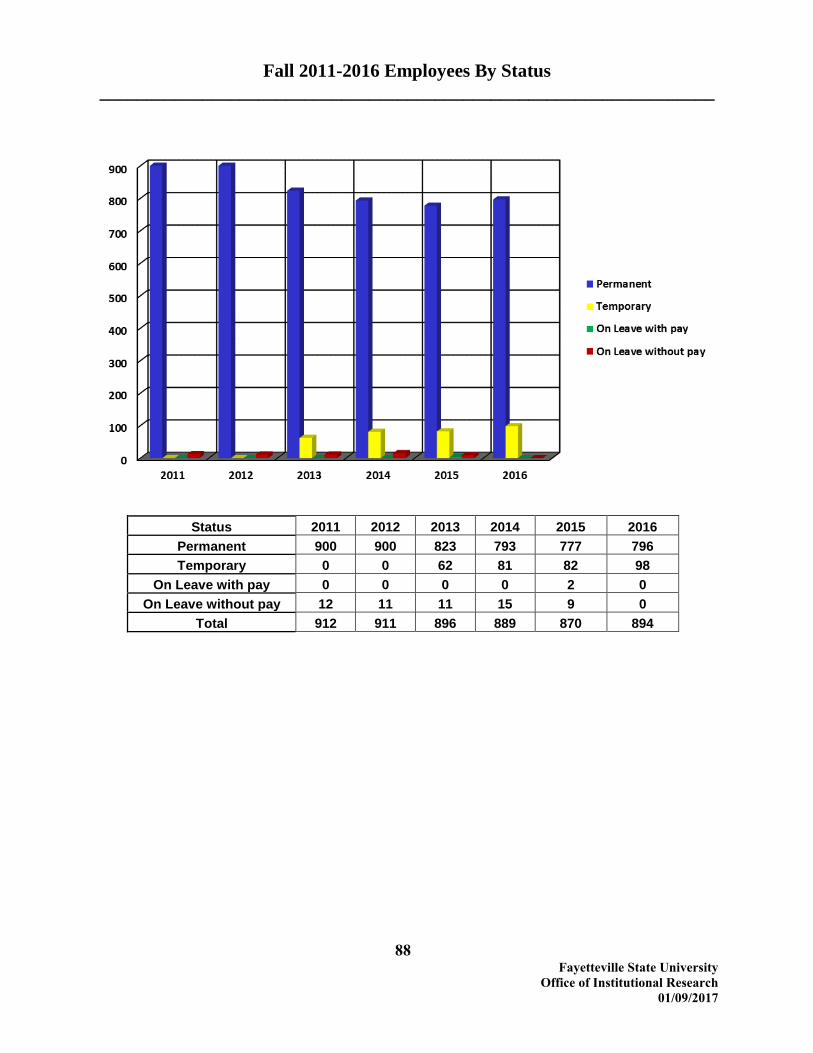
88 Fayetteville State University
Office of Institutional Research 01/09/2017
Fall 2011-2016 Employees By Status __________________________________________________________________
Status 2011 2012 2013 2014 2015 2016 Permanent 900 900 823 793 777 796 Temporary 0 0 62 81 82 98
On Leave with pay 0 0 0 0 2 0 On Leave without pay 12 11 11 15 9 0
Total 912 911 896 889 870 894
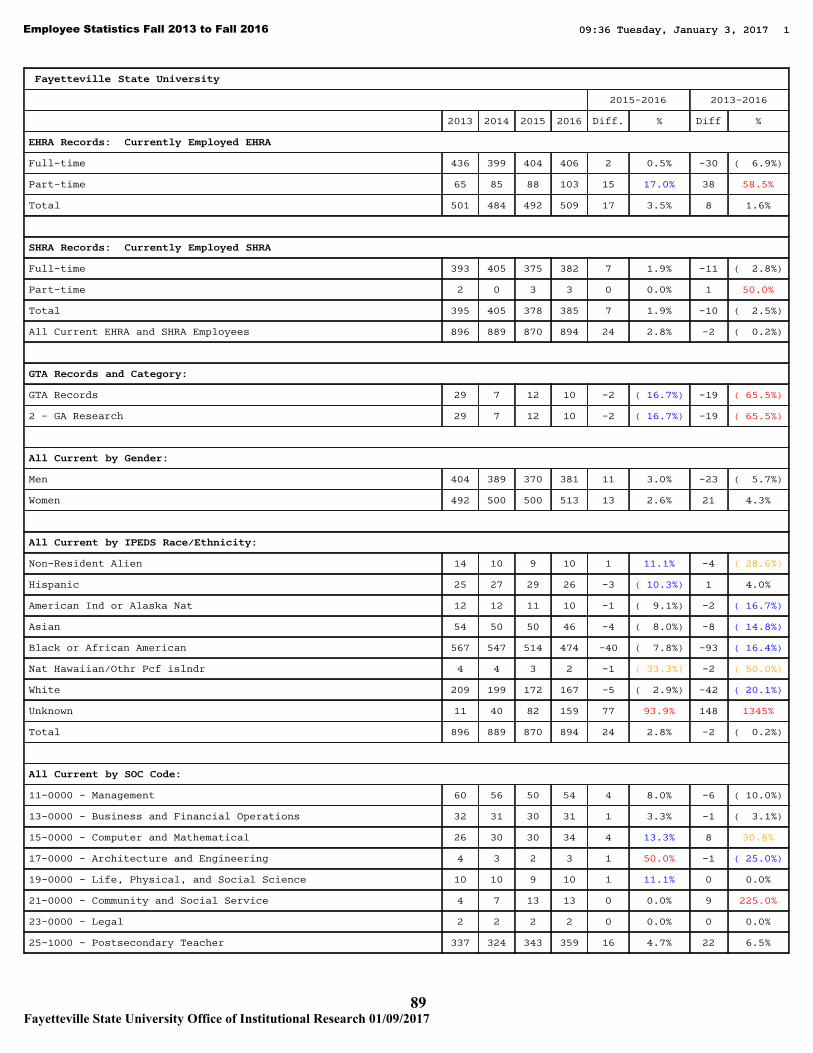
09:36 Tuesday, January 3, 2017 1
89Fayetteville State University Office of Institutional Research 01/09/2017
Employee Statistics Fall 2013 to Fall 2016 09:36 Tuesday, January 3, 2017 1
Fayetteville State University
2015-2016 2013-2016
2013 2014 2015 2016 Diff. % Diff %
EHRA Records: Currently Employed EHRA
Full-time 436 399 404 406 2 0.5% -30 ( 6.9%)
Part-time 65 85 88 103 15 17.0% 38 58.5%
Total 501 484 492 509 17 3.5% 8 1.6%
SHRA Records: Currently Employed SHRA
Full-time 393 405 375 382 7 1.9% -11 ( 2.8%)
Part-time 2 0 3 3 0 0.0% 1 50.0%
Total 395 405 378 385 7 1.9% -10 ( 2.5%)
All Current EHRA and SHRA Employees 896 889 870 894 24 2.8% -2 ( 0.2%)
GTA Records and Category:
GTA Records 29 7 12 10 -2 ( 16.7%) -19 ( 65.5%)
2 - GA Research 29 7 12 10 -2 ( 16.7%) -19 ( 65.5%)
All Current by Gender:
Men 404 389 370 381 11 3.0% -23 ( 5.7%)
Women 492 500 500 513 13 2.6% 21 4.3%
All Current by IPEDS Race/Ethnicity:
Non-Resident Alien 14 10 9 10 1 11.1% -4 ( 28.6%)
Hispanic 25 27 29 26 -3 ( 10.3%) 1 4.0%
American Ind or Alaska Nat 12 12 11 10 -1 ( 9.1%) -2 ( 16.7%)
Asian 54 50 50 46 -4 ( 8.0%) -8 ( 14.8%)
Black or African American 567 547 514 474 -40 ( 7.8%) -93 ( 16.4%)
Nat Hawaiian/Othr Pcf islndr 4 4 3 2 -1 ( 33.3%) -2 ( 50.0%)
White 209 199 172 167 -5 ( 2.9%) -42 ( 20.1%)
Unknown 11 40 82 159 77 93.9% 148 1345%
Total 896 889 870 894 24 2.8% -2 ( 0.2%)
All Current by SOC Code:
11-0000 - Management 60 56 50 54 4 8.0% -6 ( 10.0%)
13-0000 - Business and Financial Operations 32 31 30 31 1 3.3% -1 ( 3.1%)
15-0000 - Computer and Mathematical 26 30 30 34 4 13.3% 8 30.8%
17-0000 - Architecture and Engineering 4 3 2 3 1 50.0% -1 ( 25.0%)
19-0000 - Life, Physical, and Social Science 10 10 9 10 1 11.1% 0 0.0%
21-0000 - Community and Social Service 4 7 13 13 0 0.0% 9 225.0%
23-0000 - Legal 2 2 2 2 0 0.0% 0 0.0%
25-1000 - Postsecondary Teacher 337 324 343 359 16 4.7% 22 6.5%

90Fayetteville State University Office of Institutional Research 01/09/2017
Employee Statistics Fall 2013 to Fall 2016 09:36 Tuesday, January 3, 2017 2
Fayetteville State University
2015-2016 2013-2016
2013 2014 2015 2016 Diff. % Diff %
25-2000 - Pre-school, Primary, Secondary, and Special EducationSchool Teachers
0 1 0 0 0 0.0% 0 0.0%
25-4020 - Librarians 10 9 9 7 -2 ( 22.2%) -3 ( 30.0%)
25-9000 - Other Education, Training, and Library 75 71 65 61 -4 ( 6.2%) -14 ( 18.7%)
27-0000 - Arts, Design, Entertainment, Sports, and MediaOccupations
25 22 21 21 0 0.0% -4 ( 16.0%)
29-0000 - Healthcare Practitioners and Technical 8 8 7 8 1 14.3% 0 0.0%
33-0000 - Protective Service 14 19 17 17 0 0.0% 3 21.4%
35-0000 - Food Prep and Serving Related 1 1 1 1 0 0.0% 0 0.0%
37-0000 - Building and Grounds Cleaning and Maintenance 50 48 43 47 4 9.3% -3 ( 6.0%)
39-0000 - Personal Care and Service 21 23 23 20 -3 ( 13.0%) -1 ( 4.8%)
41-0000 - Sales and Related 2 2 1 2 1 100.0% 0 0.0%
43-0000 - Office and Administrative Support 174 163 156 160 4 2.6% -14 ( 8.0%)
47-0000 - Construction and Extraction 16 16 13 12 -1 ( 7.7%) -4 ( 25.0%)
49-0000 - Installation, Maintenance, and Repair 19 19 19 17 -2 ( 10.5%) -2 ( 10.5%)
51-0000 - Production 1 1 1 0 -1 (100.0%) -1 (100.0%)
53-0000 - Transportation and Material Moving 5 17 15 15 0 0.0% 10 200.0%
Total 896 883 870 894 24 2.8% -2 ( 0.2%)

09:36 Tuesday, January 3, 2017 3
91Fayetteville State University Office of Institutional Research 01/09/2017
Employee Statistics Fall 2013 to Fall 2016 09:36 Tuesday, January 3, 2017 3
Fayetteville State University
2015-2016 2013-2016
2013 2014 2015 2016 Diff. % Diff %
Mean Salary of Current Full-Time by SOC Code:
11-0000 - Management 82,377 83,047 87,914 93,590 5676 6.5% 11213 13.6%
13-0000 - Business and Financial Operations 41,547 41,771 41,970 43,104 1134 2.7% 1557 3.7%
15-0000 - Computer and Mathematical 47,407 49,175 49,218 52,368 3150 6.4% 4961 10.5%
17-0000 - Architecture and Engineering 50,332 55,231 60,539 64,113 3574 5.9% 13781 27.4%
19-0000 - Life, Physical, and Social Science 29,876 31,377 29,958 31,499 1541 5.1% 1623 5.4%
21-0000 - Community and Social Service 44,641 40,016 38,515 41,143 2628 6.8% -3498 ( 7.8%)
23-0000 - Legal 87,123 88,350 91,065 110,712 19647 21.6% 23589 27.1%
25-1000 - Postsecondary Teacher 73,034 74,657 73,160 77,726 4566 6.2% 4692 6.4%
25-4020 - Librarians 39,579 39,042 39,813 42,559 2746 6.9% 2980 7.5%
25-9000 - Other Education, Training, and Library 36,541 35,822 37,152 38,715 1563 4.2% 2174 5.9%
27-0000 - Arts, Design, Entertainment, Sports, andMedia Occupations
39,445 38,346 40,067 39,604 -463 ( 1.2%) 159 0.4%
29-0000 - Healthcare Practitioners and Technical 31,704 32,113 33,238 33,329 91 0.3% 1625 5.1%
33-0000 - Protective Service 36,339 36,983 39,291 39,819 528 1.3% 3480 9.6%
35-0000 - Food Prep and Serving Related 20,449 21,267 21,267 21,586 319 1.5% 1137 5.6%
37-0000 - Building and Grounds Cleaning andMaintenance
21,016 21,501 21,511 22,536 1025 4.8% 1520 7.2%
39-0000 - Personal Care and Service 26,070 26,831 27,305 28,253 948 3.5% 2183 8.4%
41-0000 - Sales and Related 21,755 22,900 23,936 27,401 3465 14.5% 5646 26.0%
43-0000 - Office and Administrative Support 25,845 26,647 27,325 29,495 2170 7.9% 3650 14.1%
47-0000 - Construction and Extraction 26,188 26,637 27,455 29,493 2038 7.4% 3305 12.6%
49-0000 - Installation, Maintenance, and Repair 27,593 28,675 29,305 29,684 379 1.3% 2091 7.6%
51-0000 - Production 24,824 24,824 25,642 0 -25642 (100.0%) -24824 (100.0%)
53-0000 - Transportation and Material Moving 25,511 21,301 21,713 22,450 737 3.4% -3061 ( 12.0%)
All Current by SOC Code for Postsecondary Teachers Category:
1 - Instruction 337 249 343 363 20 5.8% 26 7.7%
2 - Instruction Combined 0 75 1 0 -1 (100.0%) 0 0.0%
All Current by Employment Status:
1 - Permanent 823 793 777 796 19 2.4% -27 ( 3.3%)
5 - On-Leave With Pay 0 0 2 0 -2 (100.0%) 0 0.0%
6 - On-Leave Without Pay 11 15 9 0 -9 (100.0%) -11 (100.0%)
7 - Temporary or Visiting 62 81 82 98 16 19.5% 36 58.1%
AAUP Faculty:
All Ranks: Men 153 134 129 134 5 3.9% -19 ( 12.4%)
Women 117 108 127 121 -6 ( 4.7%) 4 3.4%
Professors: Men 36 42 42 40 -2 ( 4.8%) 4 11.1%
Women 20 22 23 20 -3 ( 13.0%) 0 0.0%

92Fayetteville State University Office of Institutional Research 01/09/2017
Employee Statistics Fall 2013 to Fall 2016 09:36 Tuesday, January 3, 2017 4
Fayetteville State University
2015-2016 2013-2016
2013 2014 2015 2016 Diff. % Diff %
Associate Professors: Men 68 55 50 49 -1 ( 2.0%) -19 ( 27.9%)
Women 45 45 42 36 -6 ( 14.3%) -9 ( 20.0%)
Assistant Professors: Men 33 31 26 33 7 26.9% 0 0.0%
Women 30 32 40 42 2 5.0% 12 40.0%
Instructors: Men 3 0 0 2 2 0.0% -1 ( 33.3%)
Women 2 1 3 3 0 0.0% 1 50.0%
Lecturers: Men 10 6 10 9 -1 ( 10.0%) -1 ( 10.0%)
Women 15 7 19 19 0 0.0% 4 26.7%
No Rank: Men 3 0 1 1 0 0.0% -2 ( 66.7%)
Women 5 1 0 1 1 0.0% -4 ( 80.0%)

09:36 Tuesday, January 3, 2017 5
93Fayetteville State University Office of Institutional Research 01/09/2017
Employee Statistics Fall 2013 to Fall 2016 09:36 Tuesday, January 3, 2017 5
Fayetteville State University
2015-2016 2013-2016
2013 2014 2015 2016 Diff. % Diff %
Mean Salary of AAUP Faculty (with 11/12 month converted to 9 month) :
All Ranks: Men 74,485 74,547 73,750 79,106 5356 7.3% 4621 6.2%
Women 71,290 74,267 72,561 76,600 4039 5.6% 5310 7.4%
Professors: Men 90,795 83,885 82,269 88,218 5949 7.2% -2577 ( 2.8%)
Women 91,610 90,197 90,028 93,126 3098 3.4% 1516 1.7%
Associate Professors: Men 71,982 72,500 72,690 77,354 4664 6.4% 5372 7.5%
Women 71,657 72,003 73,356 78,083 4727 6.4% 6426 9.0%
Assistant Professors: Men 68,666 69,753 69,514 76,622 7108 10.2% 7956 11.6%
Women 69,133 70,261 69,817 74,224 4407 6.3% 5091 7.4%
Instructors: Men 73,333 0 0 79,500 79500 0.0% 6167 8.4%
Women 58,342 58,000 54,038 71,415 17377 32.2% 13073 22.4%
Lecturers: Men 53,535 52,725 56,851 59,016 2165 3.8% 5481 10.2%
Women 54,729 59,646 58,358 62,581 4223 7.2% 7852 14.3%
No Rank: Men 70,493 0 48,000 62,448 14448 30.1% -8045 ( 11.4%)
Women 54,511 72,500 0 74,323 74323 0.0% 19812 36.3%
CUPA Administrator Title Codes:
CUPA Code 97 207 205 216 11 5.4% 119 122.7%
EHRA Type:
F - Faculty 336 248 259 258 -1 ( 0.4%) -78 ( 23.2%)
A - SAAO Tier I 11 11 11 10 -1 ( 9.1%) -1 ( 9.1%)
B - SAAO Tier II 42 37 31 32 1 3.2% -10 ( 23.8%)
L - Professional Librarian 10 9 9 7 -2 ( 22.2%) -3 ( 30.0%)
P - Instructional, Research or PublicService
102 93 88 84 -4 ( 4.5%) -18 ( 17.6%)
Fair Labor Standard Act (FLSA):
SHR - Exempt 54 58 63 71 8 12.7% 17 31.5%
SHR - Not Exempt 341 347 315 314 -1 ( 0.3%) -27 ( 7.9%)
EHR - Exempt 501 477 484 493 9 1.9% -8 ( 1.6%)
EHR - Not Exempt 0 7 8 16 8 100.0% 16 0.0%
Tenure Status of Current EHRA Employees:
T - Tenured 168 159 152 145 -7 ( 4.6%) -23 ( 13.7%)
N - On Track 80 80 69 75 6 8.7% -5 ( 6.3%)
Z - Not On Track 252 163 184 187 3 1.6% -65 ( 25.8%)
P - Phased Retirement Program Participant 1 1 5 4 -1 ( 20.0%) 3 300.0%
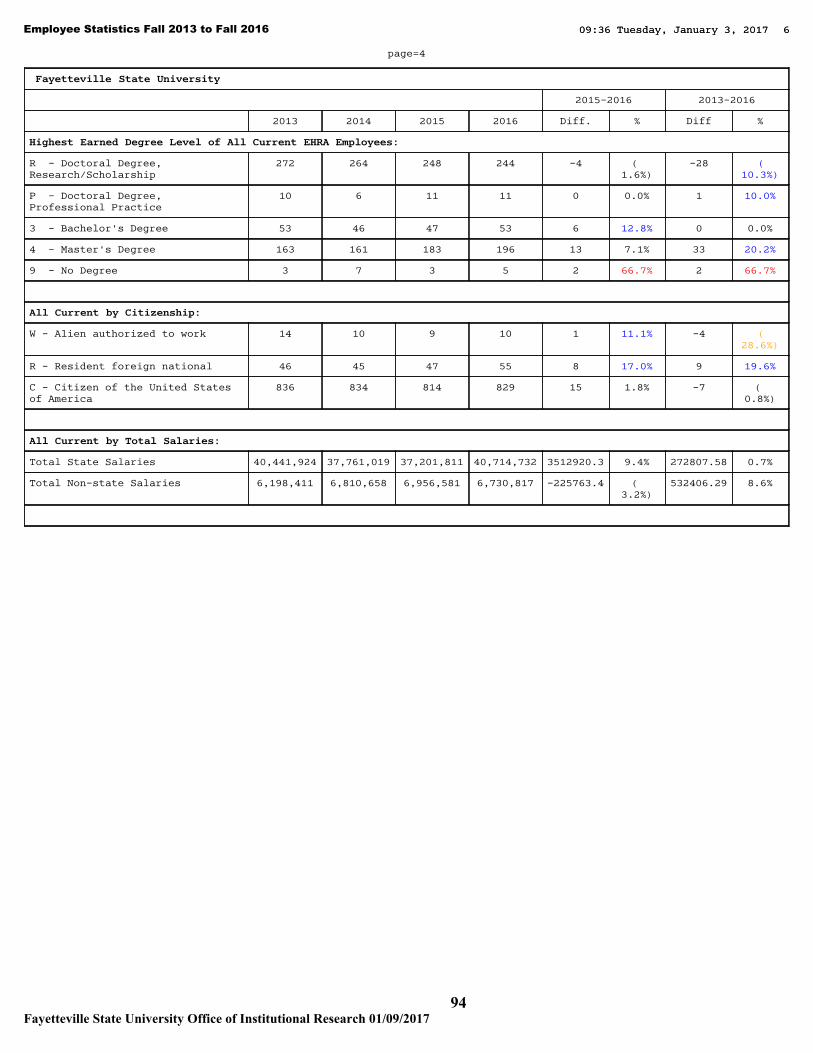
09:36 Tuesday, January 3, 2017 6
94Fayetteville State University Office of Institutional Research 01/09/2017
Employee Statistics Fall 2013 to Fall 2016 09:36 Tuesday, January 3, 2017 6
page=4
Fayetteville State University
2015-2016 2013-2016
2013 2014 2015 2016 Diff. % Diff %
Highest Earned Degree Level of All Current EHRA Employees:
R - Doctoral Degree,Research/Scholarship
272 264 248 244 -4 ( 1.6%)
-28 (10.3%)
P - Doctoral Degree,Professional Practice
10 6 11 11 0 0.0% 1 10.0%
3 - Bachelor's Degree 53 46 47 53 6 12.8% 0 0.0%
4 - Master's Degree 163 161 183 196 13 7.1% 33 20.2%
9 - No Degree 3 7 3 5 2 66.7% 2 66.7%
All Current by Citizenship:
W - Alien authorized to work 14 10 9 10 1 11.1% -4 (28.6%)
R - Resident foreign national 46 45 47 55 8 17.0% 9 19.6%
C - Citizen of the United Statesof America
836 834 814 829 15 1.8% -7 ( 0.8%)
All Current by Total Salaries:
Total State Salaries 40,441,924 37,761,019 37,201,811 40,714,732 3512920.3 9.4% 272807.58 0.7%
Total Non-state Salaries 6,198,411 6,810,658 6,956,581 6,730,817 -225763.4 ( 3.2%)
532406.29 8.6%

Finances
FinancesFinance
The financial statements report information about the university as a whole. The university’s financial position remained relatively stable during the fiscal year ending June 30, 2016. The university had an operating budget of 112,820,060.
Fayetteville State University

96 Fayetteville State University
Office of Institutional Research 01/09/2017
Finance Report Fiscal Years 2011-2015
__________________________________________________________________
Type 2011 2012 2013 2014 2015
Operating Revenue $18,885,187 $23,287,433
$27,650,998
$28,543.529 $27,870,753
Non-operating Revenue $90,501,219 $85,405,030 $83,771,479 $80,587,700 $83,312,132 Other Revenue $4,140,373 $13,818,064 $10,995,558 $4,914,928 $254,369 Total Revenue $113,526,779 $122,510,527 $122,418,035 $114,046,157 $111,437,254 Total Expenses $110,553,694 $109,958,683 $112,838,882 $109,955,518 $112,820,060

Fayetteville State UniversityOffice of Institutional Research 01/09/2017 97
Line Current Year Prior Year# Revenues and other Additions Amount Amount
Operating Revenue01 Tuition & Fees, after deducting discounts and allowances 12,698,336 14,892,713 Grants & contracts - operating:
02 Federal operating grants & contracts 118,250 483,30503 State operating grants & contracts 0 004 Local/private operating grants & contracts 005 Sales & services of auxiliary enterprises after deducting discounts & allowances 8,066,329 9,013,42406 Sales & services of hospitals, after deducting discounts and allowances 0 007 Independent operations 0 008 Other sources 148,802 1,044,21709 Total operating revenues 21,814,873 25,433,659
Non-Operating Revenues10 Federal appropriations 0 011 State appropriations 52,043,024 50,125,65912 Local appropriations, education district taxes 0
Grants - non-operating13 Federal non-operating grants 27,099,294 22,500,70814 State non-operating grants 7,273,587 1,285,12815 Local non-operating grants 51,109 75,34016 Gifts, including contributions from affiliated organizations 1,423,770 711,31317 Investment income 831,726 -476,52218 Other non-operating revenues 2,808,109 2,284,14319 Total non-operating revenues 91,530,619 76,505,769
Other Revenues and additions20 Capital appropriations 0 021 Capital grants and gifts 5,766,638 66,29422 Additions to permanent endowments 756,420 986,94723 Other revenues and additions 0 024 Total other revenues and additions 6,523,058 1,053,24125 Total all revenues and other additions 119,868,550 102,992,669
Expenses and other DeductionsOperating Expenses
01 Instruction 36,184,236 37,030,73402 Research 916,971 883,13003 Public service 3,728,233 3,588,38205 Academic support 11,502,347 11,382,33106 Student services 4,512,557 4,085,83407 Institutional Support 11,333,630 10,323,02508 Operation and maintenance of plant 8,494,773 10,143,29409 Depreciation 2,852,130 2,672,08610 Scholarships and fellowships expenses, excluding discounts and allowances 11,111,082 10,152,34111 Auxiliary enterprises 15,351,170 14,508,75212 Hospital services 013 Independent operations 014 Other expenses and deductions 0 015 Total operating expenses 105,987,129 104,769,909
Non-Operating Expenses and Deductions16 Interest 248,808 305,03317 Other non-operating expenses and deductions 194,447 597,00418 Total non-operating expenses and deductions 443,255 902,03719 Total expenses and deductions 106,430,384 105,671,946
Fayetteville State UniversityIPEDS Finance Survey
Fiscal Year 2010
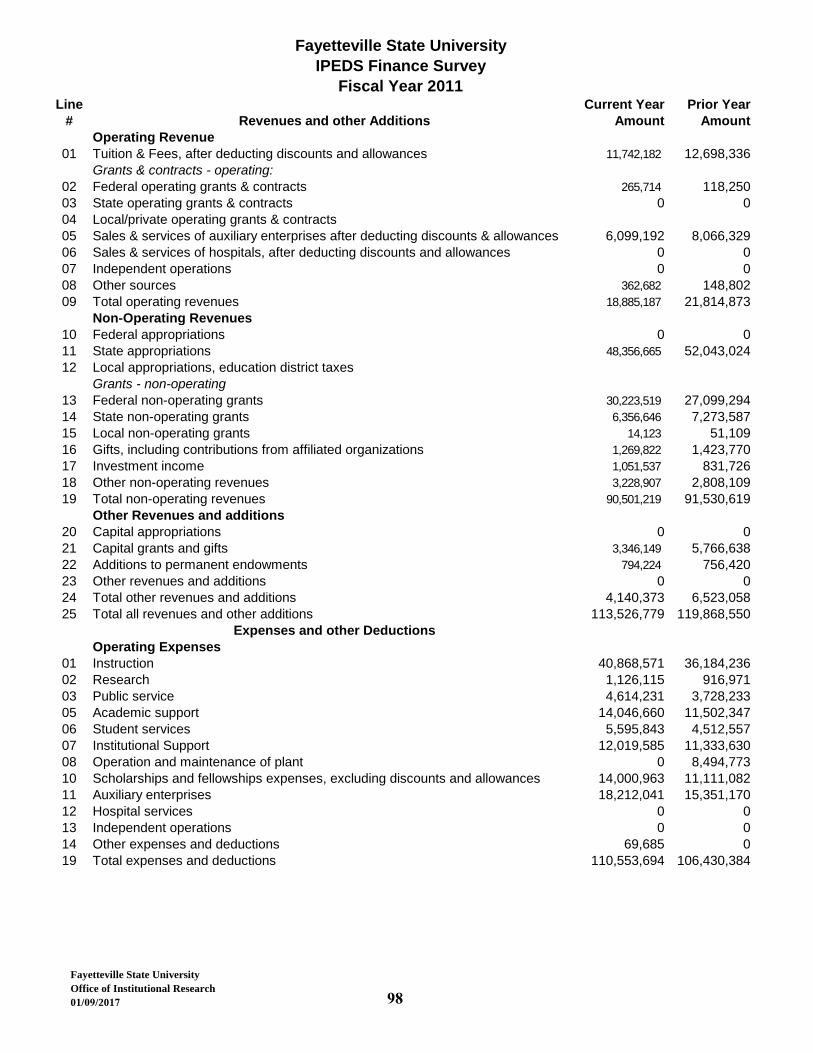
Fayetteville State University Office of Institutional Research 01/09/2017 98
Line Current Year Prior Year# Revenues and other Additions Amount Amount
Operating Revenue01 Tuition & Fees, after deducting discounts and allowances 11,742,182 12,698,336 Grants & contracts - operating:
02 Federal operating grants & contracts 265,714 118,25003 State operating grants & contracts 0 004 Local/private operating grants & contracts05 Sales & services of auxiliary enterprises after deducting discounts & allowances 6,099,192 8,066,32906 Sales & services of hospitals, after deducting discounts and allowances 0 007 Independent operations 0 008 Other sources 362,682 148,80209 Total operating revenues 18,885,187 21,814,873
Non-Operating Revenues10 Federal appropriations 0 011 State appropriations 48,356,665 52,043,02412 Local appropriations, education district taxes
Grants - non-operating13 Federal non-operating grants 30,223,519 27,099,29414 State non-operating grants 6,356,646 7,273,58715 Local non-operating grants 14,123 51,10916 Gifts, including contributions from affiliated organizations 1,269,822 1,423,77017 Investment income 1,051,537 831,72618 Other non-operating revenues 3,228,907 2,808,10919 Total non-operating revenues 90,501,219 91,530,619
Other Revenues and additions20 Capital appropriations 0 021 Capital grants and gifts 3,346,149 5,766,63822 Additions to permanent endowments 794,224 756,42023 Other revenues and additions 0 024 Total other revenues and additions 4,140,373 6,523,05825 Total all revenues and other additions 113,526,779 119,868,550
Expenses and other DeductionsOperating Expenses
01 Instruction 40,868,571 36,184,23602 Research 1,126,115 916,97103 Public service 4,614,231 3,728,23305 Academic support 14,046,660 11,502,34706 Student services 5,595,843 4,512,55707 Institutional Support 12,019,585 11,333,63008 Operation and maintenance of plant 0 8,494,77310 Scholarships and fellowships expenses, excluding discounts and allowances 14,000,963 11,111,08211 Auxiliary enterprises 18,212,041 15,351,17012 Hospital services 0 013 Independent operations 0 014 Other expenses and deductions 69,685 019 Total expenses and deductions 110,553,694 106,430,384
Fayetteville State UniversityIPEDS Finance Survey
Fiscal Year 2011
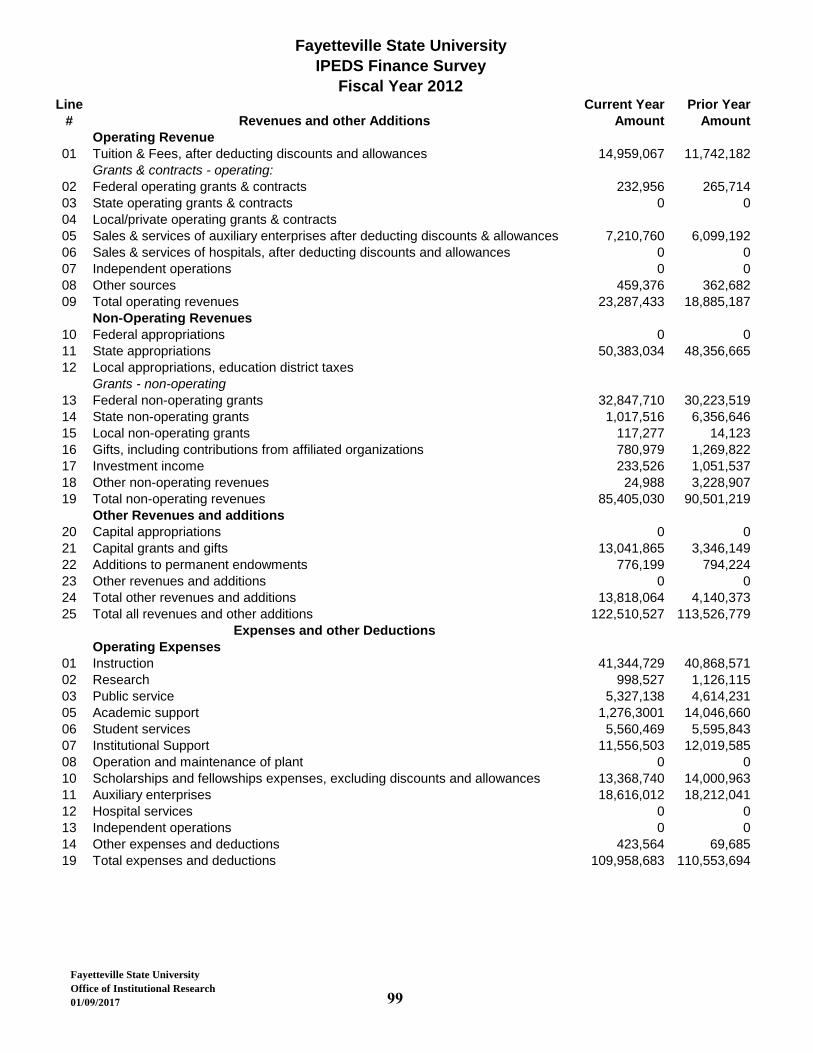
Fayetteville State University Office of Institutional Research 01/09/2017 99
Line Current Year Prior Year# Revenues and other Additions Amount Amount
Operating Revenue01 Tuition & Fees, after deducting discounts and allowances 14,959,067 11,742,182 Grants & contracts - operating:
02 Federal operating grants & contracts 232,956 265,71403 State operating grants & contracts 0 004 Local/private operating grants & contracts05 Sales & services of auxiliary enterprises after deducting discounts & allowances 7,210,760 6,099,19206 Sales & services of hospitals, after deducting discounts and allowances 0 007 Independent operations 0 008 Other sources 459,376 362,68209 Total operating revenues 23,287,433 18,885,187
Non-Operating Revenues10 Federal appropriations 0 011 State appropriations 50,383,034 48,356,66512 Local appropriations, education district taxes
Grants - non-operating13 Federal non-operating grants 32,847,710 30,223,51914 State non-operating grants 1,017,516 6,356,64615 Local non-operating grants 117,277 14,12316 Gifts, including contributions from affiliated organizations 780,979 1,269,82217 Investment income 233,526 1,051,53718 Other non-operating revenues 24,988 3,228,90719 Total non-operating revenues 85,405,030 90,501,219
Other Revenues and additions20 Capital appropriations 0 021 Capital grants and gifts 13,041,865 3,346,14922 Additions to permanent endowments 776,199 794,22423 Other revenues and additions 0 024 Total other revenues and additions 13,818,064 4,140,37325 Total all revenues and other additions 122,510,527 113,526,779
Expenses and other DeductionsOperating Expenses
01 Instruction 41,344,729 40,868,57102 Research 998,527 1,126,11503 Public service 5,327,138 4,614,23105 Academic support 1,276,3001 14,046,66006 Student services 5,560,469 5,595,84307 Institutional Support 11,556,503 12,019,58508 Operation and maintenance of plant 0 010 Scholarships and fellowships expenses, excluding discounts and allowances 13,368,740 14,000,96311 Auxiliary enterprises 18,616,012 18,212,04112 Hospital services 0 013 Independent operations 0 014 Other expenses and deductions 423,564 69,68519 Total expenses and deductions 109,958,683 110,553,694
Fayetteville State UniversityIPEDS Finance Survey
Fiscal Year 2012

Fayetteville State University Office of Institutional Research 01/09/2017 100
Line Current Year Prior Year# Revenues and other Additions Amount Amount
Operating Revenue01 Tuition & Fees, after deducting discounts and allowances 16,959,618 14,959,067 Ik
02 Federal operating grants & contracts 897 232,95603 State operating grants & contracts 004 Local/private operating grants & contracts 0 005 Sales & services of auxiliary enterprises after deducting discounts & allowances 8,510,503 7,210,76006 Sales & services of hospitals, after deducting discounts and allowances 0 007 Independent operations 008 Other sources 1,568,325 459,37609 Total operating revenues 27,650,998 23,287,433
Non-Operating Revenues10 Federal appropriations 0 011 State appropriations 49,782,641 50,383,03412 Local appropriations, education district taxes 0
Grants - non-operating13 Federal non-operating grants 31,185,529 32,847,71014 State non-operating grants 614,603 1,017,51615 Local non-operating grants 0 117,27716 Gifts, including contributions from affiliated organizations 849,617 780,97917 Investment income 1,267,880 233,52618 Other non-operating revenues 71,209 24,98819 Total non-operating revenues 83,771,479 85,405,030
Other Revenues and additions20 Capital appropriations 0 021 Capital grants and gifts 10,084,402 13,041,86522 Additions to permanent endowments 911,156 776,19923 Other revenues and additions 0 024 Total other revenues and additions 10,995,558 13,818,06425 Total all revenues and other additions 122,418,035 122,510,527
Expenses and other DeductionsOperating Expenses
01 Instruction 42,427,967 41,344,72902 Research 1,033,242 998,52703 Public service 7,197,179 5,327,13805 Academic support 11,898,417 12,763,00106 Student services 5,884,474 5,560,46907 Institutional Support 11,352,467 11,556,50308 Operation and maintenance of plant 0 010 Scholarships and fellowships expenses, excluding discounts and allowances 11,645,804 13,368,74011 Auxiliary enterprises 21,210,538 18,616,01212 Hospital services 0 013 Independent operations 0 014 Other expenses and deductions 188,794 423,56419 Total expenses and deductions 112,838,882 109,958,683
Fayetteville State UniversityIPEDS Finance Survey
Fiscal Year 2013
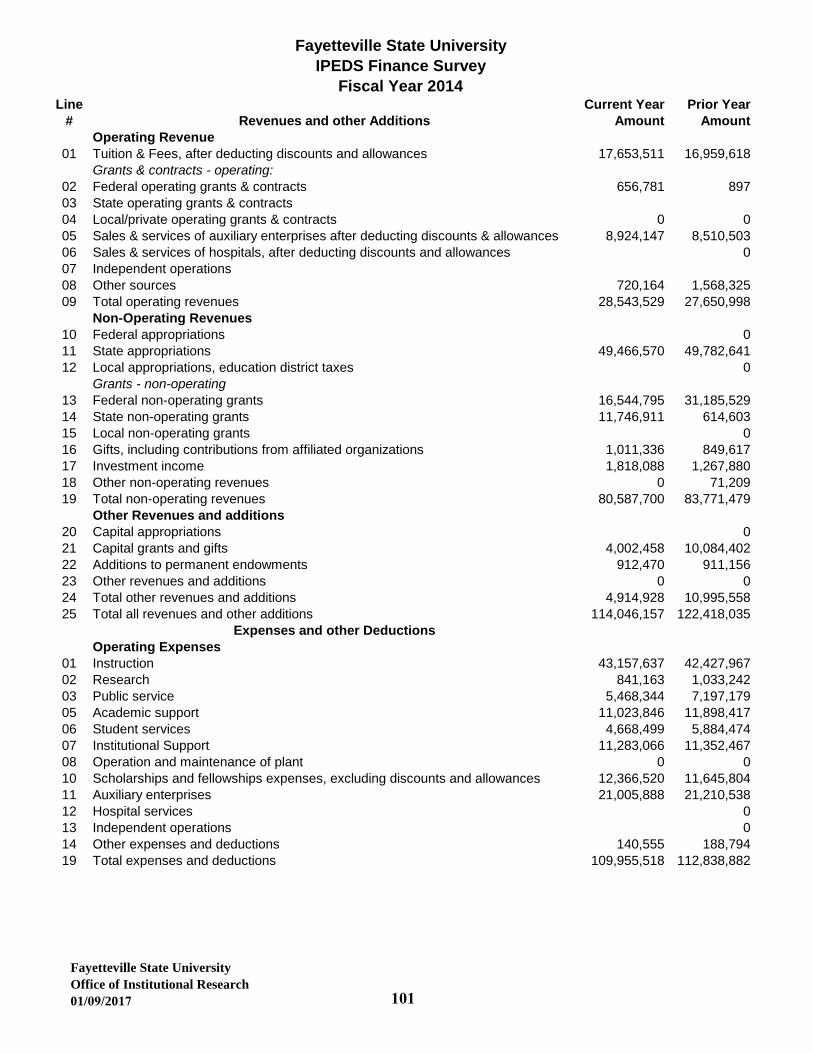
Fayetteville State University Office of Institutional Research 01/09/2017 101
Line Current Year Prior Year# Revenues and other Additions Amount Amount
Operating Revenue01 Tuition & Fees, after deducting discounts and allowances 17,653,511 16,959,618 Grants & contracts - operating:
02 Federal operating grants & contracts 656,781 89703 State operating grants & contracts04 Local/private operating grants & contracts 0 005 Sales & services of auxiliary enterprises after deducting discounts & allowances 8,924,147 8,510,50306 Sales & services of hospitals, after deducting discounts and allowances 007 Independent operations08 Other sources 720,164 1,568,32509 Total operating revenues 28,543,529 27,650,998
Non-Operating Revenues10 Federal appropriations 011 State appropriations 49,466,570 49,782,64112 Local appropriations, education district taxes 0
Grants - non-operating13 Federal non-operating grants 16,544,795 31,185,52914 State non-operating grants 11,746,911 614,60315 Local non-operating grants 016 Gifts, including contributions from affiliated organizations 1,011,336 849,61717 Investment income 1,818,088 1,267,88018 Other non-operating revenues 0 71,20919 Total non-operating revenues 80,587,700 83,771,479
Other Revenues and additions20 Capital appropriations 021 Capital grants and gifts 4,002,458 10,084,40222 Additions to permanent endowments 912,470 911,15623 Other revenues and additions 0 024 Total other revenues and additions 4,914,928 10,995,55825 Total all revenues and other additions 114,046,157 122,418,035
Expenses and other DeductionsOperating Expenses
01 Instruction 43,157,637 42,427,96702 Research 841,163 1,033,24203 Public service 5,468,344 7,197,17905 Academic support 11,023,846 11,898,41706 Student services 4,668,499 5,884,47407 Institutional Support 11,283,066 11,352,46708 Operation and maintenance of plant 0 010 Scholarships and fellowships expenses, excluding discounts and allowances 12,366,520 11,645,80411 Auxiliary enterprises 21,005,888 21,210,53812 Hospital services 013 Independent operations 014 Other expenses and deductions 140,555 188,79419 Total expenses and deductions 109,955,518 112,838,882
Fayetteville State UniversityIPEDS Finance Survey
Fiscal Year 2014

Fayetteville State University Office of Institutional Research 01/09/2017 102
Line Current Year Prior Year# Revenues and other Additions Amount Amount
Operating Revenue01 Tuition & Fees, after deducting discounts and allowances 17,582,214 17,653,511 Grants & contracts - operating:
02 Federal operating grants & contracts 783,144 656,78103 State operating grants & contracts04 Local/private operating grants & contracts 0 005 Sales & services of auxiliary enterprises after deducting discounts & allowances 8,245,587 8,924,14706 Sales & services of hospitals, after deducting discounts and allowances 007 Independent operations08 Other sources 577,161 720,16409 Total operating revenues 27,870,753 28,543,529
Non-Operating Revenues10 Federal appropriations11 State appropriations 49,320,614 49,466,57012 Local appropriations, education district taxes
Grants - non-operating13 Federal non-operating grants 16,454,500 16,544,79514 State non-operating grants 15,184,748 11,746,91115 Local non-operating grants16 Gifts, including contributions from affiliated organizations 1,547,664 1,011,33617 Investment income 804,606 1,818,08818 Other non-operating revenues 019 Total non-operating revenues 83,312,132 80,587,700
Other Revenues and additions20 Capital appropriations21 Capital grants and gifts 33,618 4,002,45822 Additions to permanent endowments 220,751 912,47023 Other revenues and additions 0 024 Total other revenues and additions 254,369 4,914,92825 Total all revenues and other additions 111,437,254 114,046,157
Expenses and other DeductionsOperating Expenses
01 Instruction 43,383,671 43,157,63702 Research 1,225,534 841,16303 Public service 4,230,208 5,468,34405 Academic support 12,179,506 11,023,84606 Student services 5,447,151 4,668,49907 Institutional Support 11,294,531 11,283,06608 Operation and maintenance of plant 0 010 Scholarships and fellowships expenses, excluding discounts and allowances 11,339,374 12,366,52011 Auxiliary enterprises 23,370,029 21,005,88812 Hospital services13 Independent operations14 Other expenses and deductions 350,056 140,55519 Total expenses and deductions 112,820,060 109,955,518
Fayetteville State UniversityIPEDS Finance Survey
Fiscal Year 2015

1-5 6-8 9-11 12+ Yearly
In State Tuition 365.35 730.69 1,096.04 1,461.38 2,922.76
Out of State Tuition 1,816.38 3,632.75 5,449.13 7,265.50 14,531.00
Athletic 83.50 167.00 250.50 334.00 668.00
Health 25.13 50.25 75.38 100.50 201.00
Education and Technology Fee 45.00 90.00 135.00 180.00 360.00
Student Activities 67.88 135.75 203.63 271.50 543.00
Book Rental Fee 100.00 100.00 100.00 190.00 380.00
Student Government Association 0.12 0.25 0.38 0.50 1.00
Sub-Total General Fees 321.63 543.25 764.89 1,076.50 2,153.00
Indebtedness Fee 41.88 83.75 125.63 167.50 335.00
Bronco Card Fee 12.00 12.00 12.00 12.00 24.00
Campus Security Fee 3.75 7.50 11.25 15.00 30.00
Student Medical Insurance 0.00 1,111.00 1,111.00 1,111.00 2,222.00
Sub-Total Other Fees 57.63 1,214.25 1,259.88 1,305.50 2,611.00
Sub-Total Fees 379.26 1,757.50 2,024.77 2,382.00 4,764.00
In State 744.61 2,488.19 3,120.81 3,843.38 7,686.76
Out of State 2,195.64 5,390.25 7,473.90 9,647.50 19,295.00
1,685.00 1,685.00 1,685.00 1,685.00 3,370.00
1,523.00 1,523.00 1,523.00 1,523.00 3,046.00
1,358.00 1,358.00 1,358.00 1,358.00 2,716.00
Plus an additional 8% sales tax
1,939.50 1,939.50 1,939.50 1,939.50 3,879.00
2,240.00 2,240.00 2,240.00 2,240.00 4,480.00
2,984.00 2,984.00 2,984.00 2,984.00 5,968.00
3,088.00 3,088.00 3,088.00 3,088.00 6,176.00
In State 4,369.11 6,112.69 6,745.31 7,467.88 14,935.76
Out of State 5,820.14 9,014.75 11,098.40
103
13,272.00 26,544.00
Total Charges/Boarder Housing &
All Access-Meal Plan
Fees
Total Tuition and Fees
(Non Boarder)
140 Block $400 per year
Meal Plans Declining Balance
All Access $240 per year
240 Block $280 per year
Resident Halls Rates:
Housing-Regular Halls
Housing-Vance Hall
Renaissance - Double
Renaissance - Quad
2016-17 Tuition and Fees
Undergraduate Semester Cost
Credit hours taken
DETAIL ESTIMATED FEE SHEET FALL 2016/SPRING2017Tuition, fees, and room and board charges are due the last day of Registration for each semester or term.
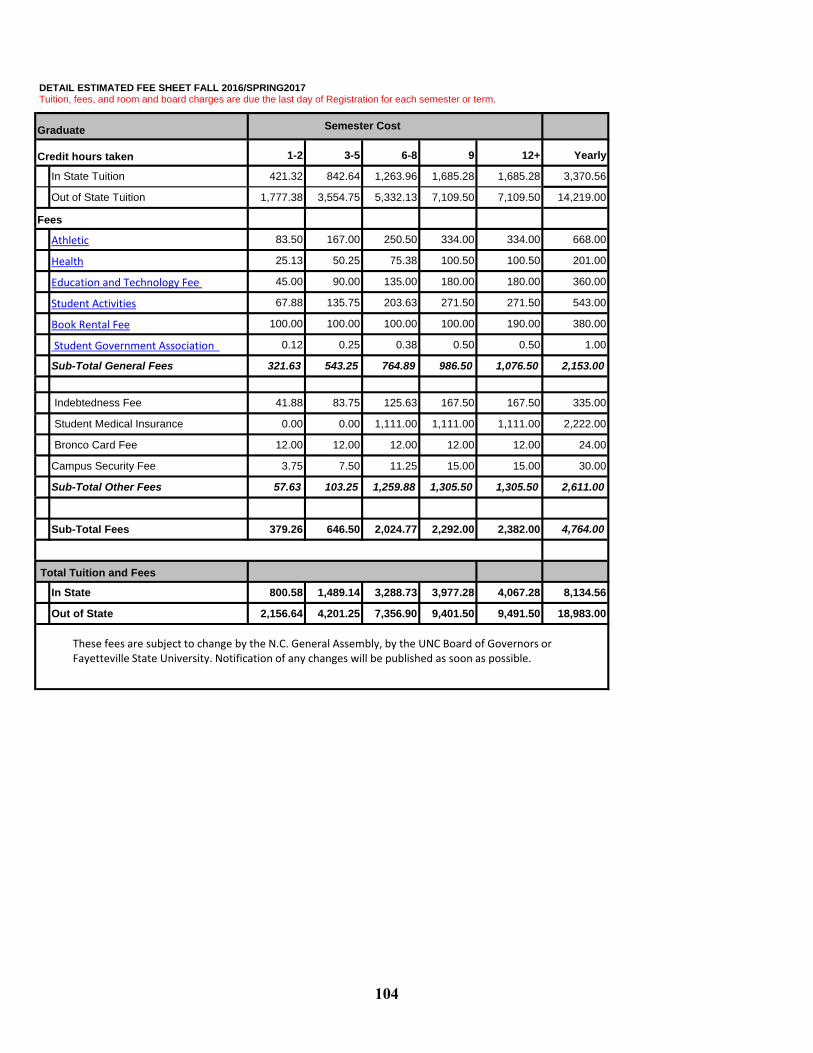
1-2 3-5 6-8 9 12+ Yearly
In State Tuition 421.32 842.64 1,263.96 1,685.28 1,685.28 3,370.56
Out of State Tuition 1,777.38 3,554.75 5,332.13 7,109.50 7,109.50 14,219.00
Athletic 83.50 167.00 250.50 334.00 334.00 668.00
Health 25.13 50.25 75.38 100.50 100.50 201.00
Education and Technology Fee 45.00 90.00 135.00 180.00 180.00 360.00
Student Activities 67.88 135.75 203.63 271.50 271.50 543.00
Book Rental Fee 100.00 100.00 100.00 100.00 190.00 380.00
Student Government Association 0.12 0.25 0.38 0.50 0.50 1.00
Sub-Total General Fees 321.63 543.25 764.89 986.50 1,076.50 2,153.00
Indebtedness Fee 41.88 83.75 125.63 167.50 167.50 335.00
Student Medical Insurance 0.00 0.00 1,111.00 1,111.00 1,111.00 2,222.00
Bronco Card Fee 12.00 12.00 12.00 12.00 12.00 24.00
Campus Security Fee 3.75 7.50 11.25 15.00 15.00 30.00
Sub-Total Other Fees 57.63 103.25 1,259.88 1,305.50 1,305.50 2,611.00
Sub-Total Fees 379.26 646.50 2,024.77 2,292.00 2,382.00 4,764.00
In State 800.58 1,489.14 3,288.73 3,977.28 4,067.28 8,134.56
Out of State 2,156.64 4,201.25 7,356.90
104
9,401.50 9,491.50 18,983.00
Total Tuition and Fees
Graduate Semester Cost
Credit hours taken
Fees
DETAIL ESTIMATED FEE SHEET FALL 2016/SPRING2017Tuition, fees, and room and board charges are due the last day of Registration for each semester or term.
These fees are subject to change by the N.C. General Assembly, by the UNC Board of Governors or Fayetteville State University. Notification of any changes will be published as soon as possible.
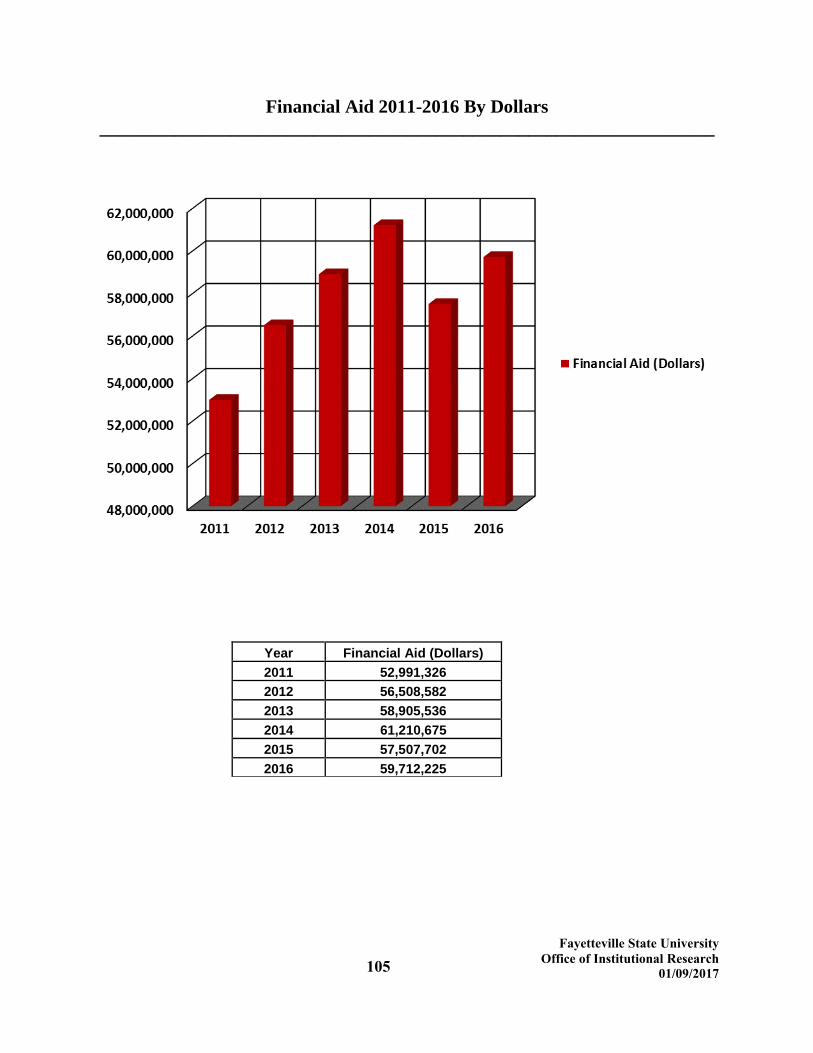
105 Fayetteville State University
Office of Institutional Research 01/09/2017
Financial Aid 2011-2016 By Dollars __________________________________________________________________
Year Financial Aid (Dollars) 2011 52,991,326 2012 56,508,582 2013 58,905,536 2014 61,210,675 2015 57,507,702 2016 59,712,225

FSU2015-16
106 Fayetteville State University Office of Institutional Research 01/09/2017
FSU Finanicial Aid Comparative Statistics 2015-16
2012-13 2013-14 2014-15 2015-16
Change(2014-15
and2015-16)
%Change(2014-15
and2015-16)
AwardsFA Federal Pell Grant 6,594 6,902 6,619 6,855 236 3.6%
FB Federal Supplemental Educational Opportunity Grant(SEOG)
2,149 2,271 1,770 1,437 -333 ( 18.8%)
FC Federal Work Study (FWS) 460 583 646 482 -164 ( 25.4%)
FD Federal Perkins Loan 108 132 104 91 -13 ( 12.5%)
FI Federal Ford Direct Loan Program(FDLP)-Subsidized Stafford
7,361 7,335 6,835 6,647 -188 ( 2.8%)
FJ FDLP-Unsubsidized Stafford 8,376 8,078 7,270 7,210 -60 ( 0.8%)
FK FDLP-PLUS 103 207 278 517 239 86.0%
FL FDLP-Grad PLUS 0 0 0 3 3 0
FT DC Tuition Assistance Grant (TAG) 65 80 55 56 1 1.8%
FV Federal Teach Grant (but actually a loan) 0 0 0 18 18 0
F7 Other federal loan 40 0 0 0 0 0
F8 Other federal forgivable loan 0 0 0 24 24 0
SB UNC Campus Scholarship Program (SEAAAdministered)
306 299 293 236 -57 ( 19.5%)
SE Millennial Teaching Scholarship/Loan (forgivable loan) 2 0 0 0 0 0
SH Education Lottery Scholarship (CFI Administered) 634 653 635 705 70 11.0%
SP Nurse Scholars Program (forgivable loan) 3 0 0 0 0 0
SQ Principal Fellows Program (forgivable loan) 4 10 12 6 -6 ( 50.0%)
SR Prospective Teacher Scholarship Loan (forgivableloan)
8 6 3 0 -3 ( 100.0%)
ST UNC Need Based Grant (CFI Administered) 2,454 4,216 3,803 3,913 110 2.9%
SV Appropriated grant (Non-service scholarship) 0 4,219 4,460 3,388 -1,072 ( 24.0%)
SW State-Funded Graduate Assistant Tuition AwardBenefit (includes in-state and out-of-state portion)
71 0 0 28 28 0
S2 NC Reach (for Foster Youth) 8 21 16 16 0 0.0%
WE Faculty/Staff Tuition Waivers 38 33 46 113 67 145.7%
IA Athletic Grant-In-Aid 210 200 186 225 39 21.0%
IB Institutional grant/scholarship (need based) 0 0 0 9 9 0
IC Institutional grant/scholarship (non-need based) 3,860 0 1 3,238 3,237 323700%
IF Need Based Campus Initiated Tuition Increase Grants(CITI)
0 4,626 10,876 5,181 -5,695 ( 52.4%)
IG Non-Need Based Campus Initiated Tuition IncreaseGrants (CITI)
9,821 4,914 765 199 -566 ( 74.0%)
I9 Other Institutional Scholarship or Grant 0 0 0 763 763 0
OA Externally Administered Private Grant/Scholarship(Non-Athletic)
341 459 431 399 -32 ( 7.4%)
OE Penn Family Scholarship 2 6 4 2 -2 ( 50.0%)
OG Golden Leaf 10 10 14 11 -3 ( 21.4%)
OH Other Non-Federal, Non-NC loan 0 68 65 80 15 23.1%
SZ NC TAP (National Guard Tuition Assistance) 22 16 26 21 -5 ( 19.2%)
NH Forgivable Education Loans for Service (FELS) 0 5 7 3 -4 ( 57.1%)
TT Total 43,050 45,349 45,220 41,876 -3,344 ( 7.4%)
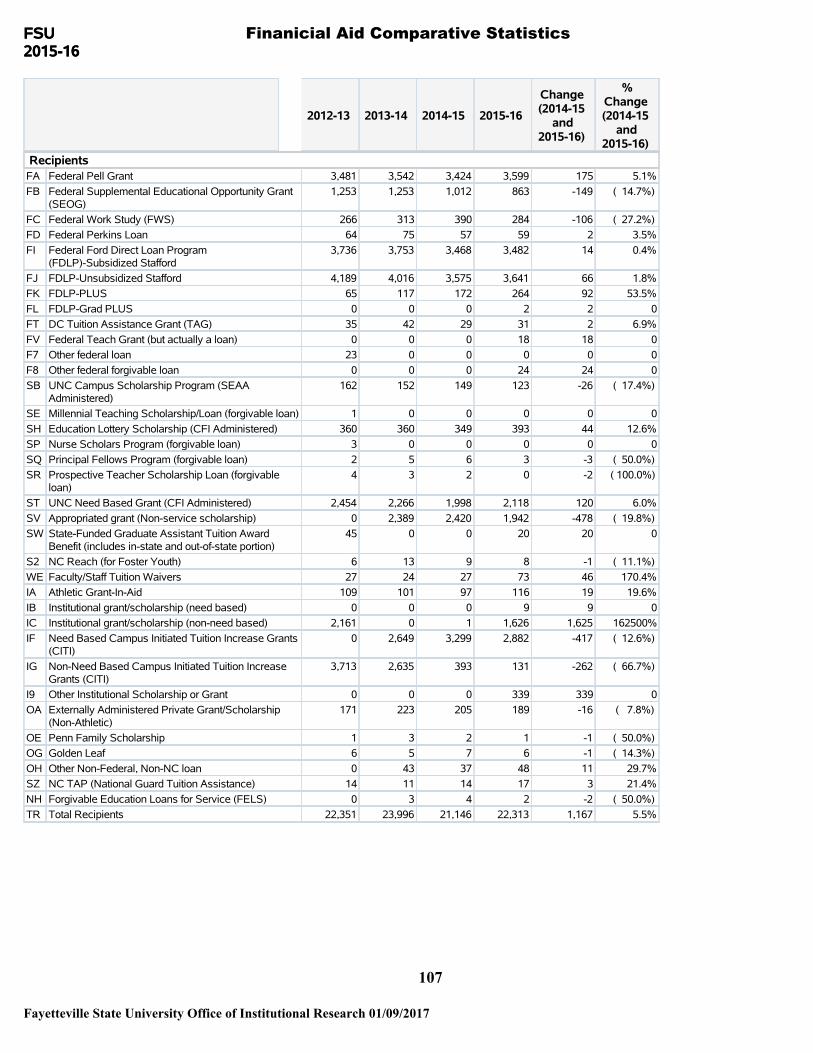
FSU2015-16
107
Fayetteville State University Office of Institutional Research 01/09/2017
FSU Finanicial Aid Comparative Statistics 2015-16
2012-13 2013-14 2014-15 2015-16
Change(2014-15
and2015-16)
%Change(2014-15
and2015-16)
RecipientsFA Federal Pell Grant 3,481 3,542 3,424 3,599 175 5.1%
FB Federal Supplemental Educational Opportunity Grant(SEOG)
1,253 1,253 1,012 863 -149 ( 14.7%)
FC Federal Work Study (FWS) 266 313 390 284 -106 ( 27.2%)
FD Federal Perkins Loan 64 75 57 59 2 3.5%
FI Federal Ford Direct Loan Program(FDLP)-Subsidized Stafford
3,736 3,753 3,468 3,482 14 0.4%
FJ FDLP-Unsubsidized Stafford 4,189 4,016 3,575 3,641 66 1.8%
FK FDLP-PLUS 65 117 172 264 92 53.5%
FL FDLP-Grad PLUS 0 0 0 2 2 0
FT DC Tuition Assistance Grant (TAG) 35 42 29 31 2 6.9%
FV Federal Teach Grant (but actually a loan) 0 0 0 18 18 0
F7 Other federal loan 23 0 0 0 0 0
F8 Other federal forgivable loan 0 0 0 24 24 0
SB UNC Campus Scholarship Program (SEAAAdministered)
162 152 149 123 -26 ( 17.4%)
SE Millennial Teaching Scholarship/Loan (forgivable loan) 1 0 0 0 0 0
SH Education Lottery Scholarship (CFI Administered) 360 360 349 393 44 12.6%
SP Nurse Scholars Program (forgivable loan) 3 0 0 0 0 0
SQ Principal Fellows Program (forgivable loan) 2 5 6 3 -3 ( 50.0%)
SR Prospective Teacher Scholarship Loan (forgivableloan)
4 3 2 0 -2 ( 100.0%)
ST UNC Need Based Grant (CFI Administered) 2,454 2,266 1,998 2,118 120 6.0%
SV Appropriated grant (Non-service scholarship) 0 2,389 2,420 1,942 -478 ( 19.8%)
SW State-Funded Graduate Assistant Tuition AwardBenefit (includes in-state and out-of-state portion)
45 0 0 20 20 0
S2 NC Reach (for Foster Youth) 6 13 9 8 -1 ( 11.1%)
WE Faculty/Staff Tuition Waivers 27 24 27 73 46 170.4%
IA Athletic Grant-In-Aid 109 101 97 116 19 19.6%
IB Institutional grant/scholarship (need based) 0 0 0 9 9 0
IC Institutional grant/scholarship (non-need based) 2,161 0 1 1,626 1,625 162500%
IF Need Based Campus Initiated Tuition Increase Grants(CITI)
0 2,649 3,299 2,882 -417 ( 12.6%)
IG Non-Need Based Campus Initiated Tuition IncreaseGrants (CITI)
3,713 2,635 393 131 -262 ( 66.7%)
I9 Other Institutional Scholarship or Grant 0 0 0 339 339 0
OA Externally Administered Private Grant/Scholarship(Non-Athletic)
171 223 205 189 -16 ( 7.8%)
OE Penn Family Scholarship 1 3 2 1 -1 ( 50.0%)
OG Golden Leaf 6 5 7 6 -1 ( 14.3%)
OH Other Non-Federal, Non-NC loan 0 43 37 48 11 29.7%
SZ NC TAP (National Guard Tuition Assistance) 14 11 14 17 3 21.4%
NH Forgivable Education Loans for Service (FELS) 0 3 4 2 -2 ( 50.0%)
TR Total Recipients 22,351 23,996 21,146 22,313 1,167 5.5%

FSU2015-16
108 Fayetteville State University Office of Institutional Research 01/09/2017
FSU Finanicial Aid Comparative Statistics2015-16
2012-13 2013-14 2014-15 2015-16
Change(2014-15
and2015-16)
%Change(2014-15
and2015-16)
Dollars AwardedFA Federal Pell Grant $14,215,29
1$14,886,26
8$14,570,51
7$15,311,23
4$740,717 5.1%
FB Federal Supplemental Educational Opportunity Grant(SEOG)
706,118 800,580 622,930 573,771 -49,159 ( 7.9%)
FC Federal Work Study (FWS) 296,963 434,950 482,041 356,030 -126,011 ( 26.1%)
FD Federal Perkins Loan 260,994 321,849 254,077 256,285 2,208 0.9%
FI Federal Ford Direct Loan Program(FDLP)-Subsidized Stafford
13,776,230 14,819,014 13,644,191 13,497,132 -147,059 ( 1.1%)
FJ FDLP-Unsubsidized Stafford 20,009,019 19,663,029 17,662,032 17,713,458 51,426 0.3%
FK FDLP-PLUS 352,985 594,264 682,928 1,433,295 750,367 109.9%
FL FDLP-Grad PLUS 0 0 0 12,062 12,062 0
FT DC Tuition Assistance Grant (TAG) 325,000 400,000 275,000 280,000 5,000 1.8%
FV Federal Teach Grant (but actually a loan) 0 0 0 33,552 33,552 0
F7 Other federal loan 169,801 0 0 0 0 0
F8 Other federal forgivable loan 0 0 0 43,123 43,123 0
SB UNC Campus Scholarship Program (SEAAAdministered)
250,654 348,267 342,960 292,823 -50,137 ( 14.6%)
SE Millennial Teaching Scholarship/Loan (forgivable loan) 6,500 0 0 0 0 0
SH Education Lottery Scholarship (CFI Administered) 361,026 413,186 395,125 426,473 31,348 7.9%
SP Nurse Scholars Program (forgivable loan) 5,000 0 0 0 0 0
SQ Principal Fellows Program (forgivable loan) 57,068 147,068 168,272 85,108 -83,164 ( 49.4%)
SR Prospective Teacher Scholarship Loan (forgivableloan)
11,500 12,000 6,000 0 -6,000 ( 100.0%)
ST UNC Need Based Grant (CFI Administered) 3,396,579 3,500,701 3,334,118 3,326,058 -8,060 ( 0.2%)
SV Appropriated grant (Non-service scholarship) 0 585,856 647,337 589,571 -57,766 ( 8.9%)
SW State-Funded Graduate Assistant Tuition AwardBenefit (includes in-state and out-of-state portion)
127,860 0 0 21,000 21,000 0
S2 NC Reach (for Foster Youth) 25,161 66,725 34,194 49,062 14,868 43.5%
WE Faculty/Staff Tuition Waivers 34,599 31,800 41,356 107,027 65,671 158.8%
IA Athletic Grant-In-Aid 739,146 647,707 623,902 773,217 149,315 23.9%
IB Institutional grant/scholarship (need based) 0 0 0 12,657 12,657 0
IC Institutional grant/scholarship (non-need based) 508,185 0 366 1,467,565 1,467,199 400874%
IF Need Based Campus Initiated Tuition Increase Grants(CITI)
0 1,307,896 2,743,653 733,382 -2,010,271 ( 73.3%)
IG Non-Need Based Campus Initiated Tuition IncreaseGrants (CITI)
2,885,838 1,527,701 258,451 594,906 336,455 130.2%
I9 Other Institutional Scholarship or Grant 0 0 0 964,536 964,536 0
OA Externally Administered Private Grant/Scholarship(Non-Athletic)
331,206 415,200 375,605 389,430 13,825 3.7%
OE Penn Family Scholarship 2,000 3,000 3,000 3,000 0 0.0%
OG Golden Leaf 15,000 15,000 21,000 16,500 -4,500 ( 21.4%)
OH Other Non-Federal, Non-NC loan 0 242,996 253,253 304,057 50,804 20.1%
SZ NC TAP (National Guard Tuition Assistance) 35,813 13,368 40,894 37,162 -3,732 ( 9.1%)
NH Forgivable Education Loans for Service (FELS) 0 12,250 24,500 8,750 -15,750 ( 64.3%)
TT Total 58,905,536 61,210,675 57,507,702 59,712,225 2,204,523 3.8%

E C O N O M I C M O D E L I N G S P E C I A L I S T S I N T L . | 4 0 9 S . J A C K S O N S T R E E T, M O S C O W, I D A H O 8 3 8 4 3 | 2 0 8 - 8 8 3 - 3 5 0 0 109
Impact on THE regional Business Community
During the analysis year, FY 2012-13, FSU spent $68.3 million on payroll and benefits for 1,037 full-time and part-time employees, and spent another $44.5 million on goods and services to carry out its day-to-day operations and research. This initial round of spending creates more spending across other businesses throughout the regional economy, resulting in the commonly referred to multiplier effects. We estimate these multiplier effects in this study and report the additional economic activity that is created by the initial spending of FSU.* Impacts are reported in terms of total income, which is analogous to Gross Regional Product, and the corresponding number of jobs created.
Fact SheetDemonstrating the Economic Value of Fayetteville State University to the Sandhills and the state of North Carolina
January 2015
Fayetteville State University (FSU) improves higher education delivery throughout the region and helps students increase their employability and potential. By facilitating new research and drawing students and visitors to the Sandhills, the university also generates new dollars and opportunities for the region. The purpose of this analysis is to assess the impact of FSU on the regional economy, defined as the counties of Cumberland, Bladen, Harnett, Hoke, Moore, Robeson, and Sampson. The analysis also looks at the benefits generated for students, North Carolina as a whole, and taxpayers.
Our analysis shows that in FY 2012-13, the $112.8 million in payroll and operations spending of FSU, together with its construction spending and the spending of its students, visitors, and alumni, created $266.6 million in added regional income. This is equal to approximately 0.9% of the total Gross Regional Product of the Sandhills, and is equivalent to creating 5,128 new jobs.
* Note: Our estimated economic impacts are conservative in that we directly take into account the fact that state andlocal dollars spent on the university could have been spent elsewhere in North Carolina if not directed toward FSU, and thus would have created some economic impacts regardless. We account for these alternative uses of funds directly in our analysis by (i) assuming that if funds were not directed to FSU, they would have been returned to the taxpayer and generate economic impacts through household spending on goods and services, and (ii) subtracting the estimated eco-nomic impacts generated by this alternative use of funds from the estimated economic impacts of FSU. Thus, we report a net impact of FSU that is above and beyond what would have occurred had the funds been returned to the taxpayer.

E C O N O M I C M O D E L I N G S P E C I A L I S T S I N T L . | 4 0 9 S . J A C K S O N S T R E E T, M O S C O W, I D A H O 8 3 8 4 3 | 2 0 8 - 8 8 3 - 3 5 0 0 110
These economic impacts break down as follows:
Operations spending impact• Payroll and non-pay expenditures to support day-to-day
operations (less research) of FSU amounted to $57.6 millionand $38.5 million, respectively. The net impact of theuniversity’s operations spending in the Sandhills during theanalysis year was approximately $75 million in added regionalincome, which is equivalent to creating 1,127 jobs.
Research spending impact• Research activities of FSU impact the regional economy by
employing people and making purchases for equipment, supplies,and services. They also facilitate new knowledge creationthroughout the Sandhills. In FY 2012-13, FSU spent $10.7million on payroll to support research activities.
• Research spending of FSU generates $14.2 million in addedregional income for the Sandhills economy, which is equivalentto creating 216 new jobs.
Construction spending impact• FSU built or renovated a number of its facilities during the
analysis year. This spending generated a short-term infusionof income and jobs in the regional economy.
• The net impact of the university’s construction spending in FY2012-13 was $585.9 thousand in added regional income,equivalent to 17 new jobs.
Student spending impact• Around 32% of graduate and undergraduate students attending
FSU originated from outside the region. Some of these studentsrelocated to the Sandhills and spent money on groceries,transportation, rent, and so on at Sandhills businesses.
• The expenditures of students who relocated to the region duringthe analysis year added approximately $7 million in regionalincome for the Sandhills economy, which is equivalent to creating161 new jobs.
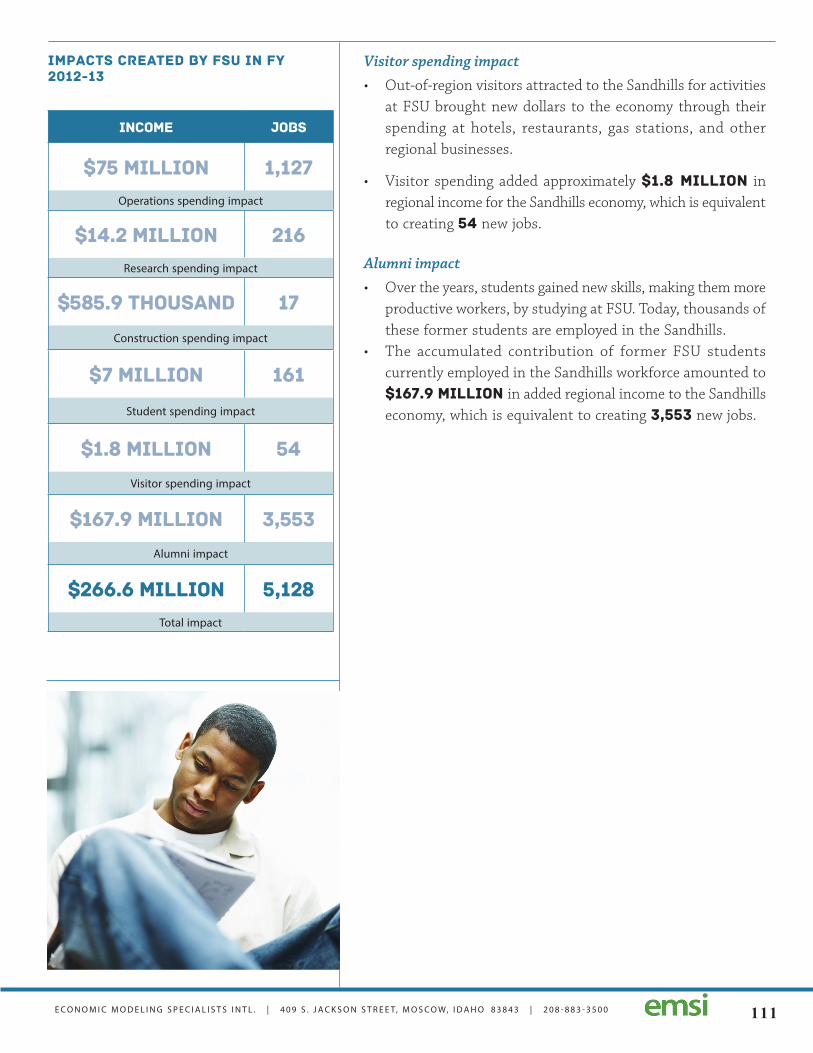
E C O N O M I C M O D E L I N G S P E C I A L I S T S I N T L . | 4 0 9 S . J A C K S O N S T R E E T, M O S C O W, I D A H O 8 3 8 4 3 | 2 0 8 - 8 8 3 - 3 5 0 0 111
Visitor spending impact• Out-of-region visitors attracted to the Sandhills for activities
at FSU brought new dollars to the economy through theirspending at hotels, restaurants, gas stations, and otherregional businesses.
• Visitor spending added approximately $1.8 million inregional income for the Sandhills economy, which is equivalentto creating 54 new jobs.
Alumni impact• Over the years, students gained new skills, making them more
productive workers, by studying at FSU. Today, thousands ofthese former students are employed in the Sandhills.
• The accumulated contribution of former FSU studentscurrently employed in the Sandhills workforce amounted to$167.9 million in added regional income to the Sandhillseconomy, which is equivalent to creating 3,553 new jobs.
Impacts created by FSU in FY 2012-13
Income Jobs
$75 million 1,127Operations spending impact
$14.2 million 216Research spending impact
$585.9 thousand 17
Construction spending impact
$7 million 161
Student spending impact
$1.8 million 54Visitor spending impact
$167.9 million 3,553Alumni impact
$266.6 million 5,128Total impact
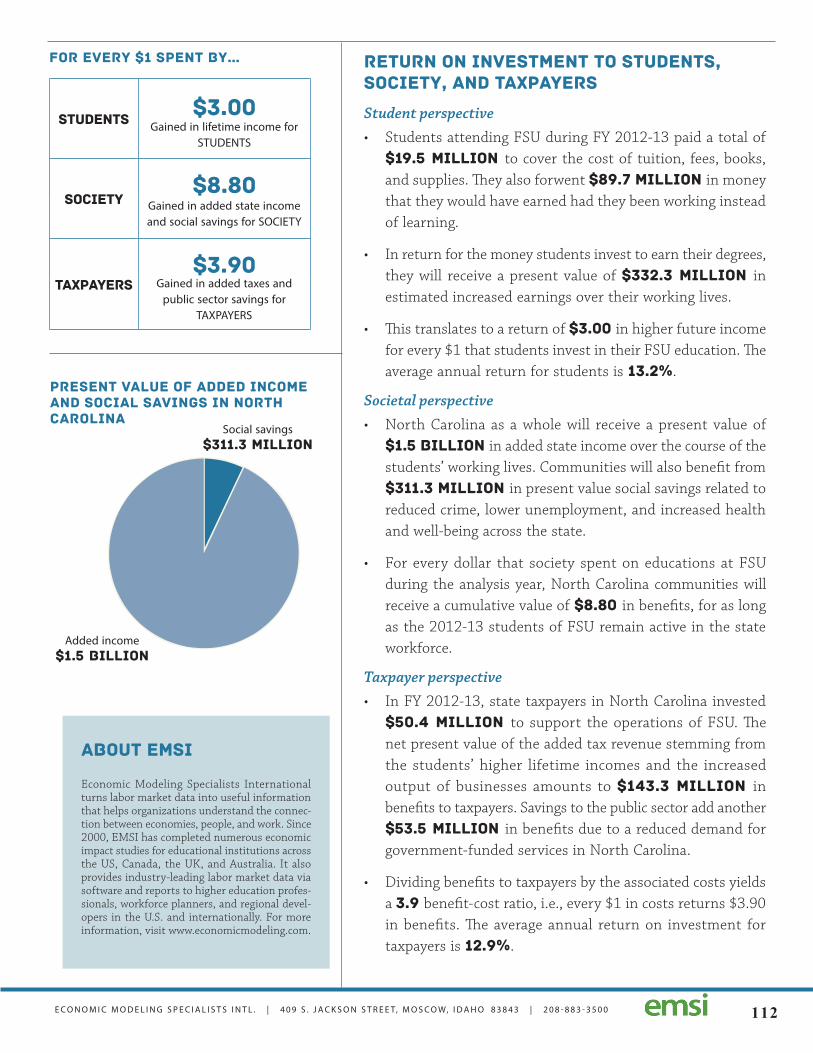
E C O N O M I C M O D E L I N G S P E C I A L I S T S I N T L . | 4 0 9 S . J A C K S O N S T R E E T, M O S C O W, I D A H O 8 3 8 4 3 | 2 0 8 - 8 8 3 - 3 5 0 0 112
Return on investment to students, society, and taxpayers
Student perspective• Students attending FSU during FY 2012-13 paid a total of
$19.5 million to cover the cost of tuition, fees, books,and supplies. They also forwent $89.7 million in moneythat they would have earned had they been working insteadof learning.
• In return for the money students invest to earn their degrees,they will receive a present value of $332.3 million inestimated increased earnings over their working lives.
• This translates to a return of $3.00 in higher future incomefor every $1 that students invest in their FSU education. Theaverage annual return for students is 13.2%.
Societal perspective• North Carolina as a whole will receive a present value of
$1.5 billion in added state income over the course of thestudents’ working lives. Communities will also benefit from$311.3 million in present value social savings related toreduced crime, lower unemployment, and increased healthand well-being across the state.
• For every dollar that society spent on educations at FSUduring the analysis year, North Carolina communities willreceive a cumulative value of $8.80 in benefits, for as longas the 2012-13 students of FSU remain active in the stateworkforce.
Taxpayer perspective• In FY 2012-13, state taxpayers in North Carolina invested
$50.4 million to support the operations of FSU. Thenet present value of the added tax revenue stemming fromthe students’ higher lifetime incomes and the increasedoutput of businesses amounts to $143.3 million inbenefits to taxpayers. Savings to the public sector add another$53.5 million in benefits due to a reduced demand forgovernment-funded services in North Carolina.
• Dividing benefits to taxpayers by the associated costs yieldsa 3.9 benefit-cost ratio, i.e., every $1 in costs returns $3.90in benefits. The average annual return on investment fortaxpayers is 12.9%.
Present value of added income and social savings in North Carolina
7+93Social savings
$311.3 million
Added income $1.5 billion
For every $1 spent By…
Students$3.00
Gained in lifetime income for STUDENTS
Society$8.80
Gained in added state income and social savings for SOCIETY
Taxpayers$3.90
Gained in added taxes and public sector savings for
TAXPAYERS
About EMSI
Economic Modeling Specialists International turns labor market data into useful information that helps organizations understand the connec-tion between economies, people, and work. Since 2000, EMSI has completed numerous economic impact studies for educational institutions across the US, Canada, the UK, and Australia. It also provides industry-leading labor market data via software and reports to higher education profes-sionals, workforce planners, and regional devel-opers in the U.S. and internationally. For more information, visit www.economicmodeling.com.

FinancesOn November 7, 2000 North Carolina
voter
The Campus Master Plan expresses the vision for Fayetteville State University’s continued physical development achieving a balance of preserving existing landmarks, new development, and renovations. This plan accommodates future growth and achievement of the University’s strategic goals in line with the academic mission.
Based on the new Master Plan, the University anticipates a projected enrollment from 5,600 students to 9,600 students within the next 20 years. These recommendations will require an estimated $500 million in capital improvements. Priority projects are also identified for implementation within the next six years. These projects will provide a decision-making framework to help the University guide the campus in its construction efforts to meet immediate needs as well as those to come in future years
.
Facilities
Fayetteville State University

114
Fayetteville State University Office of Institutional Research
01/09/2017
Bldg. Name Year Gross Bldg.No Constr. Area Cost000A PAIGE ALUMNI HOUSE 1922 5,097 $13,000001+001A ROSENTHAL BUILDING 1966 26,353 397,245002 LILLY GYM 1938 32,867 $317,000002A LAURETTA TAYLOR BLDG. 1969 31,940 $618,000003B MITCHELL PRE-SCHOOL 1955 3,304 $50,000004 SEABROOK AUDITORIUM 1953 35,193 $7,965,000006 TAYLOR SOC SCIENCES BLDG. 1939 20,901 $122,000006A JOSEPH KNUCKLES SCIENCE ANNEX 1968 22,548 $2,552,000007 JOYNER HALL 1930 18,984 $57,000009 BRYANT HALL 1966 40,662 $607,000010 HARRIS HALL 1938 26,688 $71,000011 COOK HALL 1923 18,267 $93,000012 SMITH HALL 1953 20,604 $230,000013 SPAULDING INFIRMARY 1955 6,020 $104,000014 COMMUNICATION CENTER 1937 12,582 $36,000015B NEWBOLD TRAINING 1958 4,417 $88,000016 VANCE HALL 1966 55,917 $773,000017 WILLIAMS HALL 1955 11,488 $128,000018 HOOD HALL 1939 17,516 $57,000019 HELEN T. CHICK BLDG. 1968 37,598 $1,377,000020 MAINTENANCE BLDG. 1969 8,200 $82,000021 W.R. COLLINS ADMINISTRATION BLDG. 1970 17,346 $475,000021A C.J. BARBER ADMINISTRATION BLDG. 1981 29,162 $1,328,000022 RUDOLPH JONES STUDENT CENTER 1972 58,742 $7,829,240023 STORAGE BLDG. 1969 720 $4,000024A VEHICLE/GEN SHOP 1983 3,600 $44,080025 CONT EDUC CENTER 1976 9,545 $265,000026 NEW RESIDENCE HALL 1976 51,670 $1,580,000027 BUTLER LEARNING CENTER 1976 75,418 $2,503,000027A MARION "REX AND ARONUL E. HARRIS SBE BLDG. 1991 73,000 $6,441,000028 CHANCELLOR'S RES 1976 5,925 $135,000029 LYONS SCIENCE 1981 76,686 $5,040,62529A LYONS SCIENCE ANNEX 2008 55,324 $14,386,555030 CENTRAL WAREHOUSE 1982 10,945 $383,920031 SECURITY BUILDING 1951 2,800 $23,090032 RADIO TRANSMIT 1982 220 $5,154033 CHARLES CHESNUTT LIBRARY 1987 81,866 $8,299,000034 MITCHELL STORAGE 1980 96 $450035 CONCESSION 1978 322 $1,000036 PRESS BOX 1997 800 $630,700037 RESTROOM 1995 1,610 $8,688039 CONCESSION 1987 120 $6,200040 CONCESSION 1978 192 $500041 FELTON J. CAPEL ARENA 1995 122,464 $9,700,000041A NICK JERALDS STADIUM 2003 10,585 $2,567,926042 HONORS HALL 1997 37,500 $3,479,600043 McCloud Hall 2005 63,512 $6,529,000044 PHYSICAL PLANT 1982 4,717 $8,000045 SE NC NURSING ED 2011 37,458 8,199,390046 Renaissance Hall 2012 86,499 $14,718,781047 Science & Technology 2012 72,101 20,884,213
Facilities Inventory

Fayetteville State University 1200 Murchison Road
Fayetteville, North Carolina 28301-4298 910.672.1111
www.uncfsu.edu
Fayetteville State University is a member institution of The University of North Carolina, which is committed to equality of educational opportunity and does not discriminate against applicants,
students, or employees based on race, color, national origin, religion, sex, age, or disability.