FACOLTÀ DI SCIENZE E TECNOLOGIE Corso di Dottorato in ...
147
UNIVERSITÀ DEGLI STUDI DI MILANO FACOLTÀ DI SCIENZE E TECNOLOGIE Corso di Dottorato in Chimica Industriale XXXIII Ciclo New organic and hybrid organic/inorganic materials with intriguing solid state optoelectronic properties Andrea PREVITALI R12058 Tutor: Prof.ssa Elena CARIATI Coordinatore del corso: Prof.ssa Dominique Marie ROBERTO Anno Accademico 2019-2020
Transcript of FACOLTÀ DI SCIENZE E TECNOLOGIE Corso di Dottorato in ...

UNIVERSITÀ DEGLI STUDI DI MILANO
FACOLTÀ DI SCIENZE E TECNOLOGIE
Corso di Dottorato in Chimica Industriale XXXIII Ciclo
New organic and hybrid organic/inorganic materials
with intriguing solid state optoelectronic properties
Andrea PREVITALI
R12058
Tutor: Prof.ssa Elena CARIATI
Coordinatore del corso: Prof.ssa Dominique Marie ROBERTO
Anno Accademico 2019-2020


i
Index
1 Fluorescence and Phosphorescence: a thousand-year history .......................... 1
1.1 References ....................................................................................................................... 6
2 Theoretical concepts ........................................................................................ 7
2.1 Introduction ..................................................................................................................... 7
2.2 Lambert-Beer law and oscillator strength ......................................................................... 8
2.3 Selection rules ................................................................................................................. 9
2.4 Franck-Condon principle .................................................................................................. 9
2.5 Possible transition between electronic states ................................................................. 11
2.5.1 Internal Conversion, IC ....................................................................................................... 11
2.5.2 Fluorescence ..................................................................................................................... 11
2.5.3 Intersystem Crossing, ISC ................................................................................................... 11
2.5.4 Phosphorescence ............................................................................................................... 12
2.5.5 Thermally Activated Delayed Fluorescence TADF ................................................................ 12
2.5.6 Excited state lifetimes ........................................................................................................ 12
2.6 Quantum efficiency ........................................................................................................ 14
2.7 References ..................................................................................................................... 15
3 Aggregation Induced Emission ....................................................................... 16
3.1 Introduction ................................................................................................................... 16
3.2 Mechanism .................................................................................................................... 17
3.2.1 RIM ................................................................................................................................... 17
3.2.2 J-Aggregate Formation (JAF)............................................................................................... 21
3.2.3 ESIPT ................................................................................................................................. 23
3.2.4 TICT ................................................................................................................................... 24
3.3 Conclusion ..................................................................................................................... 25
3.4 References ..................................................................................................................... 26
4 Room Temperature Phosphorescence ............................................................ 29
4.1 Introduction ................................................................................................................... 29

ii
4.2 Organic phosphorescence .............................................................................................. 29
4.2.1 Halogen bonding induced RTP ............................................................................................ 32
4.2.2 Strong π-π interaction induced RTP .................................................................................... 33
4.3 References ..................................................................................................................... 36
5 Cyclic Triimidazole.......................................................................................... 37
5.1 Introduction ................................................................................................................... 37
5.2 Photophysical characterization ...................................................................................... 37
5.3 Crystalline structure-emission relation ........................................................................... 40
5.4 Conclusion ..................................................................................................................... 42
5.5 References ..................................................................................................................... 43
6 The effect of Bromo Substituents on Cyclic Triimidazole ................................ 44
6.1 Introduction ................................................................................................................... 44
6.2 Photophysical characterization and discussion ............................................................... 45
6.2.1 TT1Br ................................................................................................................................ 45
6.2.2 TT2Br ................................................................................................................................ 46
6.2.3 TT3Br ................................................................................................................................ 47
6.3 Conclusion ..................................................................................................................... 49
6.4 References ..................................................................................................................... 50
7 Iodine introduction on the triimidazole scaffold: Intrinsic vs Extrinsic effect. . 51
7.1 Introduction ................................................................................................................... 51
7.2 Photophysical characterization and discussion ............................................................... 52
7.2.1 TT1I ................................................................................................................................... 52
7.2.2 TTCo .................................................................................................................................. 54
7.3 Conclusion ..................................................................................................................... 55
7.4 References ..................................................................................................................... 56
8 Pyridinyl fragment conjugation: (2-fluoropyridin-4-yl) ................................... 58
8.1 Introduction ................................................................................................................... 58
8.2 Photophysical characterization ...................................................................................... 58

iii
8.3 Discussion ...................................................................................................................... 61
8.4 Conclusion ..................................................................................................................... 64
8.5 References ..................................................................................................................... 65
9 Pyridinyl fragment conjugation: (pyridin-2-yl) ................................................ 67
9.1 Introduction ................................................................................................................... 67
9.2 Photophysical characterization ...................................................................................... 67
9.3 Discussion ...................................................................................................................... 74
9.4 Conclusions .................................................................................................................... 76
9.5 References ..................................................................................................................... 77
10 TT-Pyrene derivative ................................................................................... 79
10.1 Introduction ................................................................................................................... 79
10.2 Synthesis and Crystal Structure Analysis ......................................................................... 79
10.3 Photophysical characterization ...................................................................................... 83
10.3.1 DMSO Solutions ................................................................................................................. 83
10.3.2 Nano-Aggreggates ............................................................................................................. 84
10.3.3 Crystals ............................................................................................................................. 85
10.3.4 Amorphous films ............................................................................................................... 88
10.3.5 Discussion ......................................................................................................................... 89
10.4 Biological evaluation ...................................................................................................... 90
10.4.1 Bacteria imaging ................................................................................................................ 90
10.4.2 Cell imaging ....................................................................................................................... 90
10.5 Conclusions .................................................................................................................... 93
10.6 References ..................................................................................................................... 95
11 Ag(I) and Cu(I) cyclic-triimidazole coordination polymers ............................ 97
11.1 Introduction ................................................................................................................... 97
11.2 Results and discussion.................................................................................................... 97
11.2.1 1D [Ag(TT)I]n, 1-Ag ............................................................................................................. 97
11.2.2 1D [Cu(TT)I]n, 1-Cu ........................................................................................................... 100
11.3 Conclusions .................................................................................................................. 103

iv
11.4 References ................................................................................................................... 104
12 Procedures and methods. ......................................................................... 106
12.1 General information .................................................................................................... 106
12.2 Triimidazo[1,2-a:1',2'-c:1'',2''-e][1,3,5]triazine (Cyclic Triimidazole or TT)...................... 107
12.2.1 Synthesis ......................................................................................................................... 107
12.2.2 1H NMR ........................................................................................................................... 108
12.2.3 13C NMR .......................................................................................................................... 109
12.2.4 XRDP ............................................................................................................................... 109
12.3 Brominated derivatives: 3-bromotriimidazo[1,2-a:1',2'-c:1'',2''-e][1,3,5]triazine or TT1Br,
3,7-dibromotriimidazo[1,2-a:1',2'-c:1'',2''-e][1,3,5]triazine or TT2Br, 3,7,11-
tribromotriimidazo[1,2-a:1',2'-c:1'',2''-e][1,3,5]triazine or TT3Br ............................................. 110
12.3.1 TT1Br and TT2Br Synthesis ............................................................................................... 110
12.3.2 1H NMR TT1Br .................................................................................................................. 111
12.3.3 1H NMR TT2Br .................................................................................................................. 112
12.3.4 13C NMR TT1Br ................................................................................................................. 113
12.3.5 13C NMR TT2Br ................................................................................................................. 114
12.3.6 TT3Br Synthesis ............................................................................................................... 115
12.3.7 1H NMR TT3Br .................................................................................................................. 115
12.3.8 13C NMR TT3Br ................................................................................................................. 116
12.3.9 Crystallographic data ....................................................................................................... 116
12.4 3-iodotriimidazo[1,2-a:1',2'-c:1'',2''-e][1,3,5]triazine or TT1I, 3,7-diiodotriimidazo[1,2-
a:1',2'-c:1'',2''-e][1,3,5]triazine or TT2I and Triimidazale/Diiodotetrafluorobenzene or TTCo. .. 117
12.4.1 TT1I synthesis .................................................................................................................. 117
12.4.2 TT2I synthesis .................................................................................................................. 118
12.4.3 TTCo cocrystallization ...................................................................................................... 118
12.4.4 1H NMR TT1I .................................................................................................................... 119
12.4.5 1H NMR TT2I .................................................................................................................... 120
12.4.6 13C NMR TT1I ................................................................................................................... 121
12.4.7 13C NMR TT2I ................................................................................................................... 122
12.4.8 Crystallographic data ....................................................................................................... 123
12.5 3-(2-fluoropyridin-4-yl)triimidazo[1,2-a:1',2'-c:1'',2''-e][1,3,5]triazine or TTFPy ............. 124
12.5.1 Synthesis ......................................................................................................................... 124
12.5.2 1H NMR TTFPy ................................................................................................................. 125
12.5.3 13C NMR TTFPy ................................................................................................................. 126
12.5.4 Crystallographic data ....................................................................................................... 127
12.6 3-(pyridin-2-yl)triimidazo[1,2-a:1',2'-c:1'',2''-e][1,3,5]triazine or TT2Py ......................... 128
12.6.1 Synthesis ......................................................................................................................... 128
12.6.2 1H NMR TT2Py ................................................................................................................. 129
12.6.3 13C NMR TT2Py ................................................................................................................ 130
12.6.4 Crystallographic data ....................................................................................................... 131

v
12.7 3-(pyren-1-yl)triimidazo[1,2-a:1',2'-c:1'',2''-e][1,3,5]triazine or TTPyr............................ 132
12.7.1 Synthesis ......................................................................................................................... 132
12.7.2 1H NMR TTPyr .................................................................................................................. 132
12.7.3 13C NMR TTPyr ................................................................................................................. 133
12.8 Cu(I) and Ag(I) coordination polymers .......................................................................... 134
12.8.1 Synthesis of [Cu(TT)I]n (1-Cu) ............................................................................................ 134
12.8.2 Synthesis of [Ag(TT)I]n (1-Ag) ............................................................................................ 134
12.8.3 Crystallographic data ....................................................................................................... 135
12.9 References ................................................................................................................... 136
13 Conclusion ................................................................................................ 137
13.1 References ................................................................................................................... 140

1
1 Fluorescence and Phosphorescence: a thousand-year history The modern perception of the photoluminescent phenomena is the product of an intensive work mostly
concentrated in the 19th and 20th centuries. Actually, even before the discovery of the photoelectric effect
and the wave-particle duality in quantum mechanics, the scientific community has tried to explain some
exceptional phenomena observed when light and some specific materials are interacting[1].
Figure 1: Representation of Pliny the Elder
Along the centuries many proof of the observation of photoluminescent phenomena can be find. Evidences
of this are present in the documents written by Pliny the Elder (Naturalis Historia (libri XXXVI e XXXVII)) in
the ancient Rome and by Saint Albert the great (Historia animalium (1555)) during the Middle age. During
the middle ages it is possible to date the born of the terms phosphor that was use to describe materials able
to glow in the dark after exposure to light, this term derives from the Greek name of Venus and it literally
means the light bearer. Only later, the name Phosphor, was given to the element discovered by Brandt in
1677, that has observed the glow from the vapors produced by this new element exposes to the atmosphere.
The most famous case of glow-in-the-dark material is the rock known as the Bolognian Phosphors (impure
barium sulfate) discovered by a cobbler, Vincenzo Casciarolo, in Bologna in 1602. This rock, after calcination
with coal, was able to store and re-emit the sunlight for a certain time.
Figure 2: Bolognian Phosphors

2
Previously, in 1565, the botanist Nicolas Monardes, noticed the bluish colour of an infuse of a plant, named Lignum Nephriticum, that was used by the Incas population as medicine. Matlaline is responsible for the particular coloration and is the oxidation product of the flavonoids contained in the plant. The peculiar bluish coloration of the infuse, observed under particular observation condition, is the very first case of anti-counterfeiting system, in fact, Monardes explain that another plant was sold as Lignum Nephriticum, but the false plant shows only a yellow infusion and no blueish emission[2-4].
Figure 3: Left: Lignum Nephriticum paint. Right: Lignum Nephriticum picture under day and UV light.
However, many famous scientists, as Newton and Boyle, have investigated the particular behaviour of this
solution but its nature wasn’t completely understood at that time.
In 1819, a British geologist, Edward D. Clarke, has firstly reported the discovery of a fluorite crystal in Durham
describing the mineral as the most beautiful crystal he had ever seen before. Crystals of the “Durham fluor”,
as it was later called, show deep blue sapphire colour by reflected light and an intense emerald green by the
transmitted light. Clarke offered no explanation for this behaviour but, in 1822, the French mineralogist Rene-
Just Haüy, observed a similar behaviour in a fluorite crystal and it explain the phenomenon as a kind of
opalescence, unfortunately for him he was wrong and many years were required to understand this
uncommon behaviour.
Sir David Brewster, in 1833, describe a red dichroism in a green alcoholic extract of chlorophyll when is
observed from a side. The case was considered analogous to the one of the Durham fluor, and explained
through opalescence[5].
In 1845, Sir John Herschel, inventor of the term “photography”, describes the blue surface colour of an inner
colourless concentrate quinine sulfate solution. He named the phenomenon “epipolic dispersion” from the
greek term “surface”. In this case the high concentration prevents the light to be adsorbed by the inner part
of the solution and the blue emission seems to be only superficial. Herschel, using a prism, demonstrated
that only using the blue end of the spectrum was possible to observe the epiploic dispersion but he did not
recognise that the emission had a lower energy, with a blue-green colour. He extended his theory even to
fluorite crystals but, in the Lignum Nephriticum case, he claimed the effect was due to a tiny particles
dispersion. When Brewster read about the epopilic dispersion and the intrinsic contradiction with his theory
decided to further investigate this phenomenon proving the phenomenon was not superficial. For this
reason, Brewster proposed that the behaviour observed was a new case of interaction between light and

3
some specific fluid and solid, in particular he claim that the media he studied contained minute crystals
randomly oriented able to disperse the unpolarised light. Unfortunately, he was wrong[6].
Figure 4: Painting of Sir George Gabriel Stokes
A major improvement in the comprehension of the physics of light was due to the work of Professor Sir
George Gabriel Stokes, that in 1852 published “On the refrangibility of light”. In this work, he describes the
phenomenon he called “dispersive reflection” where the dispersed light has always a longer wavelength
respect the incident one. Stokes’ experiment consist in the use of a tube filled with a quinine sulfate solution
that is exposed to the different wavelengths using a prism. When the tube is exposed to the visible part
nothing happened but when he moves the tube to the invisible section beyond the violet one the tube
immediately lights up. Stokes used many different fillers for the tube and concluded that the disperse light
always had a longer wavelength, this statement will be called Stokes law. Stokes also noticed that, instead of
a “dispersion” of light, the tube seemed to glow itself. For this reasons he did not want to use the term
“dispersive reflection” but the lack of a more proper one forced him to use this non-precise term. However,
in his second work, Stokes overcomes this impasse coining the term fluorescence[7].
Figure 5: Picture of Edmon Becquerel.
Ten years before the Stokes’ work publication, Edmon Becquerel, published almost the same experiments
and the same conclusions but the paper was manly ignored. At the time Stokes’ publication came off,
4
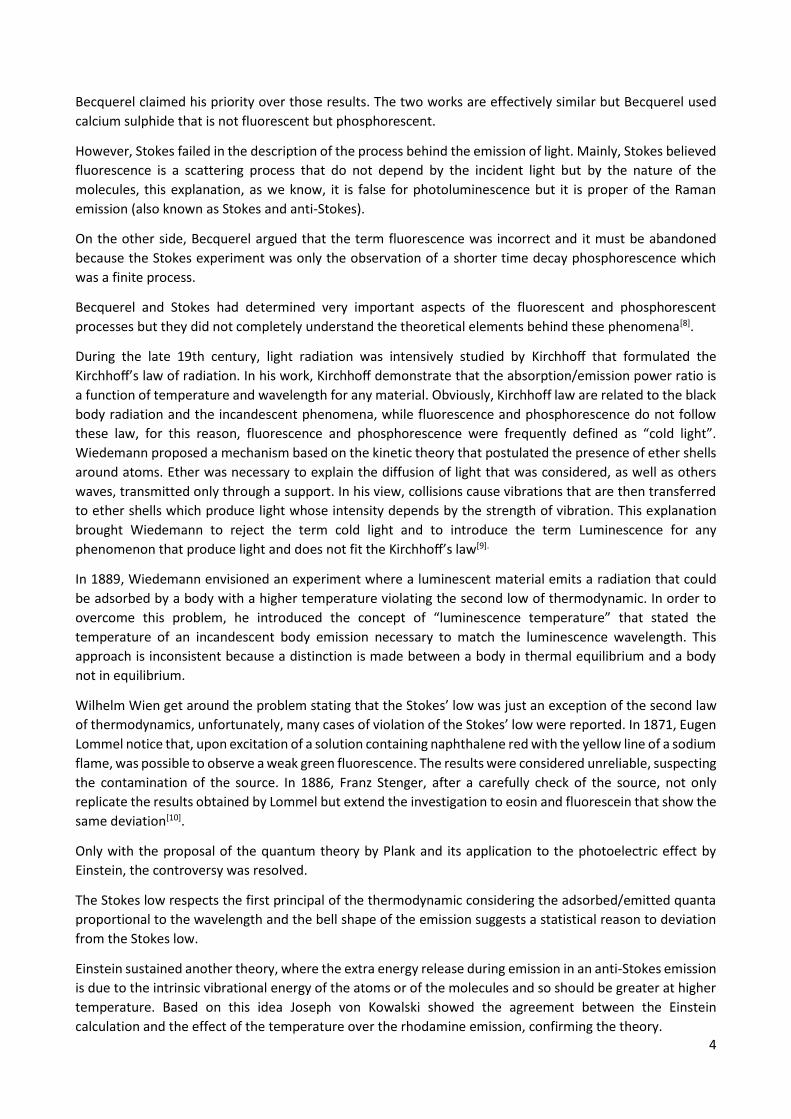
Becquerel claimed his priority over those results. The two works are effectively similar but Becquerel used
calcium sulphide that is not fluorescent but phosphorescent.
However, Stokes failed in the description of the process behind the emission of light. Mainly, Stokes believed
fluorescence is a scattering process that do not depend by the incident light but by the nature of the
molecules, this explanation, as we know, it is false for photoluminescence but it is proper of the Raman
emission (also known as Stokes and anti-Stokes).
On the other side, Becquerel argued that the term fluorescence was incorrect and it must be abandoned
because the Stokes experiment was only the observation of a shorter time decay phosphorescence which
was a finite process.
Becquerel and Stokes had determined very important aspects of the fluorescent and phosphorescent
processes but they did not completely understand the theoretical elements behind these phenomena[8].
During the late 19th century, light radiation was intensively studied by Kirchhoff that formulated the
Kirchhoff’s law of radiation. In his work, Kirchhoff demonstrate that the absorption/emission power ratio is
a function of temperature and wavelength for any material. Obviously, Kirchhoff law are related to the black
body radiation and the incandescent phenomena, while fluorescence and phosphorescence do not follow
these law, for this reason, fluorescence and phosphorescence were frequently defined as “cold light”.
Wiedemann proposed a mechanism based on the kinetic theory that postulated the presence of ether shells
around atoms. Ether was necessary to explain the diffusion of light that was considered, as well as others
waves, transmitted only through a support. In his view, collisions cause vibrations that are then transferred
to ether shells which produce light whose intensity depends by the strength of vibration. This explanation
brought Wiedemann to reject the term cold light and to introduce the term Luminescence for any
phenomenon that produce light and does not fit the Kirchhoff’s law[9].
In 1889, Wiedemann envisioned an experiment where a luminescent material emits a radiation that could
be adsorbed by a body with a higher temperature violating the second low of thermodynamic. In order to
overcome this problem, he introduced the concept of “luminescence temperature” that stated the
temperature of an incandescent body emission necessary to match the luminescence wavelength. This
approach is inconsistent because a distinction is made between a body in thermal equilibrium and a body
not in equilibrium.
Wilhelm Wien get around the problem stating that the Stokes’ low was just an exception of the second law
of thermodynamics, unfortunately, many cases of violation of the Stokes’ low were reported. In 1871, Eugen
Lommel notice that, upon excitation of a solution containing naphthalene red with the yellow line of a sodium
flame, was possible to observe a weak green fluorescence. The results were considered unreliable, suspecting
the contamination of the source. In 1886, Franz Stenger, after a carefully check of the source, not only
replicate the results obtained by Lommel but extend the investigation to eosin and fluorescein that show the
same deviation[10].
Only with the proposal of the quantum theory by Plank and its application to the photoelectric effect by
Einstein, the controversy was resolved.
The Stokes low respects the first principal of the thermodynamic considering the adsorbed/emitted quanta
proportional to the wavelength and the bell shape of the emission suggests a statistical reason to deviation
from the Stokes low.
Einstein sustained another theory, where the extra energy release during emission in an anti-Stokes emission
is due to the intrinsic vibrational energy of the atoms or of the molecules and so should be greater at higher
temperature. Based on this idea Joseph von Kowalski showed the agreement between the Einstein
calculation and the effect of the temperature over the rhodamine emission, confirming the theory.

5
While the disputation over the Stokes’ low was ongoing, Edmon Becquerel had focused his attention on
phosphorescence. In 1858, he built his phosphorocope to run the very first time resolved photoluminescence
experiment. The instrument was pretty simple but sufficiently accurate to detected decay times longer than
0.1 ms. It consists in two rotating discs with four unmatched windows with the sample inbetween. The
rotation allows the incident light to reach the sample passing through the first disc while the second one is
covering the passage to the detector, proceeding with the rotation, the excitation window before the sample
closes while the emission window to the detector is opening. The lag time between the excitation and the
measure of the emission intensity is related to the speed of the discs[8].
To Becquerel is due one of the first application of the photoluminescence, in fact, he designs the fluorescent
tube which consist in the coating of the inner surface of an electric discharge tube with a luminophore to
produce light. Nowadays, the modern fluorescent tubes are made in a similar way with EuII, EuIII and TbIII in
the coating to produce withe light.
As well as Becquerel even Stokes understood the great potential behind the luminescence, theorizing the
application of this phenomenon for the recognition of specific targets present in mixtures. On the same way,
Victor Pierre in 1862 published an article where he was able to identify single fluorescent molecules in
mixtures noting that, fluorescent bands, were characteristic of specific molecules.
Later, Göppelsröderd, firstly reported the enhancement of the emission intensity of morin due to the
aluminium complexation, referring for the first time to this technique as fluorescent analysis.
Among the oldest application of the fluorescence, it is noteworthy the use of uranin in 1877 to monitor the
flow of Danube river. Ten litres of a concentrate solution of uranin were poured in the Danube at the spring
of the river. As obvious, after a long way the Danube water reach the Black sea, but after 50 hours the
fluorescence was detected in the Aache river 12 Km in the south. This river flows into the Constanz lake that
feed the Rhine showing that, most of the water of Danube, flows into the North sea thanks to sinks on the
bed of the river[11].

6
1.1 References [1] Valeur, B.; Berberan-Santos, M. r. N., A Brief History of Fluorescence and Phosphorescence before the
Emergence of Quantum Theory. Journal of Chemical Education 2011, 88 (6), 731-738.
[2] Muyskens, M.; Ed, V., The Fluorescence of Lignum nephriticum: A Flash Back to the Past and a Simple
Demonstration of Natural Substance Fluorescence. Journal of Chemical Education 2006, 83 (5), 765.
[3] Partington, J. R., Lignum nephriticum. Annals of Science 1955, 11 (1), 1-26.
[4] Acuña, A. U.; Amat-Guerri, F.; Morcillo, P.; Liras, M.; Rodríguez, B., Structure and Formation of the
Fluorescent Compound of Lignum nephriticum. Organic Letters 2009, 11 (14), 3020-3023.
[5] Brewster, D., XIX. On the Colours of Natural Bodies. Transactions of the Royal Society of Edinburgh 1834,
12 (2), 538-545.
[6] Herschel, J. F. W., V. ’Aμóρϕω⋎a, no. II.— on the epipölic dispersion of light, being a supplement to a
paper entitled, “On a case of superficial colour presented by a homogeneous liquid internally colourless.".
Philosophical Transactions of the Royal Society of London 1845, 135, 147-153.
[7] Stokes, G. G., XXX. On the change of refrangibility of light. Philosophical Transactions of the Royal Society of London 1852, 142, 463-562. [8] Becquerel, E., La lumière, ses causes et ses effets. Firmin Didot frères, fils et cie: 1867.
[9] Wiedemann, E., Ueber Fluorescenz und Phosphorescenz I. Abhandlung. Annalen der Physik 1888, 270 (7),
446-463.
[10] Malley, M., Thermodynamics and cold light. Annals of Science 1994, 51 (3), 203-224. Lommel, E., Ueber
Fluorescenz. Annalen der Physik 1871, 219 (5), 26-51.
[11] Kass, W., Tracing Technique in Geohydrology. CRC Press: 2018.

7
2 Theoretical concepts
2.1 Introduction The very first step that every system has to undergo before any transitions can take place is the absorption
of a photon with the proper energy that promotes an electron from an orbital in the ground state to an
unoccupied orbital generating a molecular excited state. The energy of the photon adsorbed will be equal to
the “promotion jump” made by the electron implying that there must be a match between the energy
transferred and the energetic gap between the ground and the excited states. The direct consequence is that
not every molecule can absorb every photon but its chemical structure will define the distribution of the
energetic levels thus, which portion of the electromagnetic spectrum will be absorbed[1].
It is important to remind how the orbitals are energetically distributed in order to better understand which
transitions are more likely to occur. Let’s take in consideration the formaldehyde:
Figure 1: Chemical structure, molecular orbital and possible transition of formaldehyde. Reproduced from ref.[8] with permission Copyright © 2001, John Wiley and Sons.
As we can see 3 main kinds of molecular orbitals are present in this molecule:
• σ are bonding orbitals formed between atoms with collinear symmetry axes.
• π are bonding orbitals formed between atoms without collinear symmetry axes.
• n are non-bonding orbitals located on a single atom
It also is important to remind that for every bonding molecular orbital generated an anti-bonding orbital (π*,
σ*) is generated too.
Theoretically, using a photon with the proper wavelength any electron from any occupied orbital could be
promoted to any unoccupied orbital, however the lower the energy the more likely the transition. In the
example taken in consideration the energy for the transition are:
n → π* < π → π* < n → σ * < π → σ * < σ → π * < σ → σ *
So, the most probable transition is, frequently, the one involving the frontier orbitals (HOMO and LUMO) and
specifically in this case is the n → π* where a non-bonding electron localized on the oxygen is promoted to a
8
π* anti-boning orbital, shared between oxygen and carbon, giving to this transition a charge transfer
character going from the oxygen to the carbon.
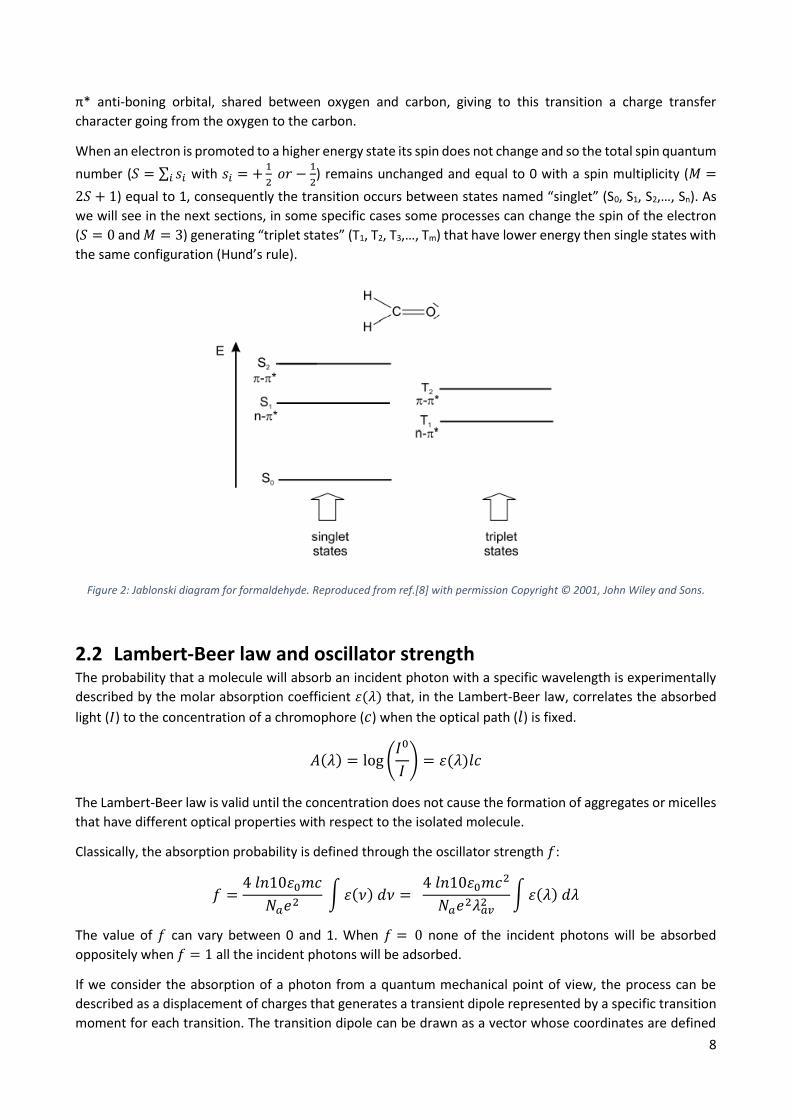
When an electron is promoted to a higher energy state its spin does not change and so the total spin quantum
number (𝑆 = ∑ 𝑠𝑖𝑖 with 𝑠𝑖 = +1
2 𝑜𝑟 −
1
2) remains unchanged and equal to 0 with a spin multiplicity (𝑀 =
2𝑆 + 1) equal to 1, consequently the transition occurs between states named “singlet” (S0, S1, S2,…, Sn). As
we will see in the next sections, in some specific cases some processes can change the spin of the electron
(𝑆 = 0 and 𝑀 = 3) generating “triplet states” (T1, T2, T3,…, Tm) that have lower energy then single states with
the same configuration (Hund’s rule).
Figure 2: Jablonski diagram for formaldehyde. Reproduced from ref.[8] with permission Copyright © 2001, John Wiley and Sons.
2.2 Lambert-Beer law and oscillator strength The probability that a molecule will absorb an incident photon with a specific wavelength is experimentally
described by the molar absorption coefficient 휀(𝜆) that, in the Lambert-Beer law, correlates the absorbed
light (𝐼) to the concentration of a chromophore (𝑐) when the optical path (𝑙) is fixed.
𝐴(𝜆) = log (𝐼0
𝐼) = 휀(𝜆)𝑙𝑐
The Lambert-Beer law is valid until the concentration does not cause the formation of aggregates or micelles
that have different optical properties with respect to the isolated molecule.
Classically, the absorption probability is defined through the oscillator strength 𝑓:
𝑓 =4 𝑙𝑛10휀0𝑚𝑐
𝑁𝑎𝑒2 ∫ 휀(𝜈) 𝑑𝜈 =
4 𝑙𝑛10휀0𝑚𝑐2
𝑁𝑎𝑒2𝜆𝑎𝑣2
∫ 휀(𝜆) 𝑑𝜆
The value of 𝑓 can vary between 0 and 1. When 𝑓 = 0 none of the incident photons will be absorbed
oppositely when 𝑓 = 1 all the incident photons will be adsorbed.
If we consider the absorption of a photon from a quantum mechanical point of view, the process can be
described as a displacement of charges that generates a transient dipole represented by a specific transition
moment for each transition. The transition dipole can be drawn as a vector whose coordinates are defined

9
by the nuclei positions of the atoms in the molecule. When an incident photon “hits” a molecule the
probability to be absorbed depends by the angle between the transient dipole vector of the transition and
the electric vector of the photon, in fact the probability is proportional to the square of the scalar product
between them. This means that for every molecule with a transition dipole parallel to the electric vector of
the incident photon the probability is maximum while if the two are perpendicular the probability drops to
zero[2].
2.3 Selection rules The number of the allowed transitions for a molecule in its ground state to an excited state or for a molecule
that relaxes from an excited state is limited by the so called “selection rules”. Particularly selective is the spin
selection rule according to which a transition between states of different spin multiplicity (singlet to triplet
or vice versa) is forbidden. This selection rule becomes less stringent due to spin-orbit coupling (i.e. the
interaction between the magnetic field associated with the rotation of the electron around the nucleus and
that associated its spin motion) which results in mixing states of different multiplicity so that the multiplicity
of a specific wavefunction is no more clearly defined. The result is that the intensity integral between singlet/
triplet states in not null and the transition can occur even though with low probability.
Similarly, symmetry forbidden transitions can take place through vibronic coupling which breaks the
symmetry of a molecule.
2.4 Franck-Condon principle Since nuclei are much slower than electrons, electronic transitions occur (10-15 s) with nuclei freezed in their
position (molecular vibrations takes 10-10 – 10-12 s). According to the Franck-Condon principle (an extension
of the Born-Oppenheimer approximation): “an electronic transition is most likely to occur without changes
in the positions of the nuclei in the molecular entity and its environment” (IUPAC Compendium of Chemical
Terminology, 2nd Edition (1997). The consequent relation between the potential energy and the nuclei
position allows to draw the Frank-Condon states represented by a Morse function:
Figure 3: Potential energy diagram drawn under the Franck-Condon assumption and relative excitation spectra. Reproduced from ref.[8] with permission Copyright © 2001, John Wiley and Sons.

10
The Boltzmann distribution predicts that at room temperature most of the molecules are in the lowest vibration level of the ground state. However, an experimental spectrum of a generic transition only rarely displays a very sharp shape because many broadening effects are possible. Firstly, there is a continuous set of accessible vibrational sublevels for each electronic state, and secondly the fluctuation of the environment around the molecules are the main cause of the widening of the bands. The Franck-Condon principle implies that the transitions can only occur vertically. As stated by the Boltzmann distribution a molecule at room temperature is prone to be find at the lower vibrational level of the ground state but, the absorption can bring it to different vibrational levels of an excited state. After the excitation the molecules usually converge to the lower vibrational level of the excited state and only after they will relax to a vibrational level of the ground state[3]. The probability (𝑃) to reach a certain vibrational level depends on the overlap integral of the wavefunctions involved in the transition:
𝑃 = ⟨ 𝜓𝑓 | 𝝁 | 𝜓𝑖 ⟩ = ∫ 𝜓𝑓∗𝝁 𝜓𝑖 𝑑𝜏
Where the dipole operator 𝝁 of the transition between an initial vibrational level ”𝑖“ of the ground state to
a final vibrational level ”𝑓“ of an excited state is determined by nuclei and electrons positions (𝑹𝒏 and 𝒓𝒎
respectively) and by their charges:
𝝁 = 𝝁𝒆 + 𝝁𝑵 = −𝑒 ∑ 𝒓𝒊
𝑖
+ 𝑒 ∑ 𝑍𝑗𝑹𝒋
𝑗
Since:
𝜓 = 𝜓𝑒𝜓𝑣𝜓𝑠
Under the Born-Oppenheimer approximation it is possible to calculate the probability for electronic, spin and
vibrational contributions separately:
𝑃 = ⟨𝜓𝑒𝑓
𝜓𝑣𝑓
𝜓𝑠𝑓|𝝁 |𝜓𝑒
𝑖 𝜓𝑣𝑖 𝜓𝑠
𝑖⟩ = ∫ 𝜓𝑒𝑓∗
𝜓𝑣𝑓∗
𝜓𝑠𝑓∗
(𝝁𝒆 + 𝝁𝑵) 𝜓𝑒𝑖 𝜓𝑣
𝑖 𝜓𝑠𝑖 𝑑𝜏
= ∫ 𝜓𝑒𝑓∗
𝜓𝑣𝑓∗
𝜓𝑠𝑓∗
𝝁𝒆 𝜓𝑒𝑖 𝜓𝑣
𝑖 𝜓𝑠𝑖 𝑑𝜏 + 𝜓𝑒
𝑓∗𝜓𝑣
𝑓∗𝜓𝑠
𝑓∗ 𝝁𝑵 𝜓𝑒
𝑖 𝜓𝑣𝑖 𝜓𝑠
𝑖 𝑑𝜏
= ∫ 𝜓𝑣𝑓∗
𝜓𝑣𝑖 𝑑𝜏𝑣 ∫ 𝜓𝑒
𝑓∗𝝁𝒆𝜓𝑒
𝑖 𝑑𝜏𝑒 ∫ 𝜓𝑠𝑓∗
𝜓𝑠𝑖 𝑑𝜏𝑠
+ ∫ 𝜓𝑒𝑓∗
𝜓𝑒𝑖 𝑑𝜏𝑒 ∫ 𝜓𝑣
𝑓∗𝝁𝑵𝜓𝑣
𝑖 𝑑𝜏𝑣 ∫ 𝜓𝑠𝑓∗
𝜓𝑠𝑖 𝑑𝜏𝑠
The second term of this equation is null because the electronic wavefunction of different states are
orthogonal thus no overlap is possible.
= ∫ 𝜓𝑣𝑓∗
𝜓𝑣𝑖 𝑑𝜏𝑣 ∫ 𝜓𝑒
𝑓∗𝝁𝒆𝜓𝑒
𝑖 𝑑𝜏𝑒 ∫ 𝜓𝑠𝑓∗
𝜓𝑠𝑖 𝑑𝜏𝑠
The three remaining integrals represent the Frank-Condon factor (which defines the most probable
vibrational transitions), the orbital selection rule and the spin selection rule, respectively. Franck-Condon
factor has only a limited weigh on the intensity of a transition respect the two other selection rules.

11
2.5 Possible transition between electronic states
Figure 4: Perrin-Jablonski diagram for a generic chromophore. Reproduced from ref.[8] with permission Copyright © 2001, John Wiley and Sons.
2.5.1 Internal Conversion, IC After photoexcitation, the most rapid process (10-13 -10-11 s) is the vibrational deactivation to the lower
vibrational level of the electronic excited state. In this process, energy is transferred to the environment as
kinetic energy. Then, radiationless deactivation through Internal Conversion allows molecules to relax to a
lower electronic level of the same multiplicity. IC is accomplished through isoenergetic vibrational levels of
the two electronic states followed by dissipation of the excess of energy through vibrational deactivation.
2.5.2 Fluorescence According to the energy gap law, the efficiency of IC increases exponentially by decreasing the energy gap
between the electronic states involved in the process so that only when this gap is “sufficiently” small (usually
for S1 to S0) radiative deactivation (fluorescence) becomes competitive with IC. This is express by the Kasha’s
rule (which is based on the energy gap law): the emission of photon is an appreciable process only from the
first excited state. A consequence of the Kasha’s rule is that fluorescent emission does not depend on the
excitation wavelength because the system always relaxes to S1 before emitting.
Due to the non-radiative deactivation processes which occur in between excitation and emission, excitation
is always at higher energy than the emission and this energy difference is defined as Stokes shift.
2.5.3 Intersystem Crossing, ISC Intersystem crossing (ISC) is the non-radiative deactivation between electronic states of different multiplicity.
According to the spin selection rule, ISC is a not allowed process which is however possible if favoured by
specific effects such as the presence of an heavy atom on the scaffold which favours SOC, the presence of
paramagnetic species and when there is a change in the nature of the states involved in the electronic

12
transition, in particular, the El-Sayed’s rule predicts larger 𝑘𝑆𝑇 when the two states are of different orbital
parentage[4].
2.5.4 Phosphorescence Once the system is brought to a generic triplet state through ISC, it can relax to T1 through IC. Since, according
to the Hund’s rule, T1 is always lower in energy with respect to S1, the Stokes of phosphorescence is larger
than that of fluorescence. Since triplet states undergo non-radiative deactivation more easily than singlet
states, phosphorescence is rarely observed, in particular in solution and at RT where collision with solvent
molecules, vibrational relaxation and oxygen quenching strongly affect the phosphorescent quantum
efficiency.
2.5.5 Thermally Activated Delayed Fluorescence TADF When the lifetime of T1 is particularly long and the energy gap between T1 and S1 is sufficiently small, a reverse
ISC can be observed and the emission from the singlet states became much longer than normal. The energy
gap between T1 and S1 is filled by thermal energy so this process becomes more relevant increasing the
temperature.
2.5.6 Excited state lifetimes
Figure 5: Jablonski diagram for a generic chromofore with the rate constants of the processes. Reproduced from ref.[8] with permission Copyright © 2001, John Wiley and Sons.
Every excited state is characterized by an intrinsic lifetime which is determined by the sum of every processes
that can occur starting from the level taken into consideration (Figure 5). Every process in turn is
characterized by a rate constant that is related to its probability[5].
The S1 lifetime is determined by all the processes that can occur from it. Thus we can define the rate costant
for each process:
𝑘𝐹𝑆: rate constant for radiative deactivation (fluorescence)
𝑘𝐼𝐶𝑆 : rate constant for internal conversion
𝑘𝐼𝑆𝐶: rate constant for intersystem crossing

13
IC and ISC are the only two non-radiative deactivation channels in the absence of intermolecular interactions.
Thus:
𝑘𝑛𝑟𝑆 = 𝑘𝐼𝐶
𝑆 + 𝑘𝐼𝐶𝑆
Let’s analyse a prototypical experiment. When a diluted chromophore in solution A is excited with a short
pulse of light a certain number of molecules reach the excited state S1. The return to S0 through radiative or
non-radiative decays or the intersystem crossing can be expressed as a classical chemical kinetics:
−𝑑 [ 𝐴1 ∗ ]
𝑑𝑡= (𝑘𝑟
𝑆 + 𝑘𝑛𝑟𝑆 )[ 𝐴1 ∗ ]
Supposing that at time zero the amount of molecules in the excited state is [ 𝐴1 ∗ ]0
the time integration
allows to write:
[ 𝐴1 ∗ ] = [ 𝐴1 ∗ ]0 exp (−𝑡
𝜏𝑆)
Where 𝜏𝑆 is the singlet lifetime and depends by the rate constants of the processes occurring from S1:
𝜏𝑆 = 1
𝑘𝐹𝑆 + 𝑘𝑛𝑟
𝑆
At any times during the deactivation the fluorescence intensity 𝐼𝐹 depends by the number of molecules in
the excited state. The proportionality of molecules relaxing with the emission of a photon at any time is:
𝑖𝐹(𝑡) = 𝑘𝑟𝑆[ 𝐴1 ∗ ] = 𝑘𝑟
𝑆[ 𝐴1 ∗ ]0
exp (−𝑡
𝜏𝑆)
Clearly, in a real experiment the intensity is affected by many external factor and so the measured intensity
is only proportional to 𝐼𝐹.
Figure 6: Graphic representation of the fluorescent decay. Reproduced from ref.[8] with permission Copyright © 2001, John Wiley and Sons.

14
𝜏𝑆 represents the exact time at which the population of the excited state reach 1/𝑒 of the initial population
and so it is not the total average time of the decay that is normally considered 10 times longer (Figure 6)[6].
The above discussion for singlet states on the singlet states and fluorescence lifetime is analogous for triplets
and phosphorescence so that these latter will not be discussed.
2.6 Quantum efficiency The quantum efficiency or quantum yield of a process (𝛷) is defined by the amount of molecules in the
excited state undergoing to a specific process with respect to the total amount of excited molecules[7][8]. If
we take into consideration the fluorescent emission:
𝛷𝐹 =𝑘𝐹
𝑆
𝑘𝐹𝑆 + 𝑘𝑛𝑟
𝑆 = 𝑘𝐹𝑆𝜏𝑆
In other words the fluorescence quantum yield is the ratio of the number of emitted photon (𝑖𝐹(𝑡)) to the
number of adsorbed photon ([ 𝐴1 ∗ ]0
):
𝑖𝐹(𝑡)
[ 𝐴1 ∗ ]0
= 𝑘𝐹𝑆 exp(−
𝑡
𝜏𝑆)
If we integrate over an infinite time:
1
[ 𝐴1 ∗ ]0
∫ 𝑖𝐹(𝑡)∞
0
𝑑𝑡 = 𝑘𝐹𝑆𝜏𝑆 = 𝛷𝐹
The fluorescent quantum yield (Ф𝐹) can also be written as:
Ф𝐹 =𝜏𝑆
𝜏𝑟
Where 𝜏𝑟 is the radiative lifetime if the state could only be deactivated through the emission of a photon:
𝜏𝑟 =1
𝑘𝐹𝑆
From this last equation is clear that there is a direct proportionality between the decay time and the quantum
efficiency. This means that variation of the environment (temperature, pressure, ecc..) will affect the two
values proportionally.

15
2.7 References [1] Klessinger, M., Michl, J., 1995 Excited state and photochemistry of organic molecules, Jonh Wiley and
Sons, Inc., New York.
[2] Turro, N.J., Ramamurthy, V., Scaiano, J.C. 2009 Principles of molecular photochemistry, University
science books, Sausalito.
[3] Birks J. B. 1970 Photophysics of Aromatic Molecules, Wiley, London.
[4] Forni, A.; Lucenti, E.; Botta, C.; Cariati, E., Metal free room temperature phosphorescence from
molecular self-interactions in the solid state. Journal of Materials Chemistry C 2018, 6 (17), 4603-4626.
[5] Herzberg G. 1966 Molecular Spectra and Molecular Structure. III Electronic Spectra and Electronic
Structure of Polyatomic Molecules, Van Nostrand Reinhold Company, New York.
[6] Jaffe ´ H. H. and Orchin M. 1962 Theory and Applications of Ultraviolet Spectroscopy, John Wiley & Sons,
New York.
[7] Lipson, R.H. 2009 Ultraviolet and visible adsorption spectroscopy, in Encyclopedia of applied
spectroscopy, Wiley-VCH Verlag GmbH, Weinheim.
[8] Valeur, B., Berberan-Santos, M.N., 2012 Wiley-VCH Verlag and Co. Weinheim, Germany.

16
3 Aggregation Induced Emission
3.1 Introduction Historically, in the luminescence field the formation of aggregates has always represented a big
issue due to the so-called Concentration Quenching (CQ): the increase of the concentration of a
luminophore in solution quenches its emission. This effect is quite common for most of aromatic
hydrocarbons[1] and their derivatives that, in the classical consideration, “form aggregates[2-6]”
characterized by non-emissive of poorly emissive behaviour. For this reason, this process is defined
as Aggregation-Caused Quenching (ACQ).
A prototypical example of an ACQ fluorophore is fluorescein (See Figure 1 left). This chromophore
displays a bright green emission in water solution which is gradually weakened by the progressive
addition of a non-solvent (e.g., acetone). The low solubility of fluorescein in acetone causes a
progressive increase of the local concentration of the chromophore and the CQ starts to become
visible when the acetone fraction reaches 60 vol%. Further increasing of the acetone fraction causes
the formation of nanoscopic aggregates and the complete quench of the fluorescein emission. The
planar polycyclic structure of fluorescein makes the molecules prone to form π-π stacking
interaction leading to the formation of dentrimental species, as excimers, responsible for the
observed ACQ.
The ACQ phenomenon has strongly limited the number of applications of the numerous
luminophores identified through dilute solution-screening in research laboratories.[7-14] In
particular, luminophores are used as sensor to detect bioactive molecules in physiological media or
as probe to monitor ionic species in ecological systems[8]. Although polar functionalities can be
introduced into hydrophobic chromophores (polycyclic aromatic hydrocarbons PAH) to increase
their polarity, and so their water solubility, the introduction can only delay or partially mitigate the
aggregation process. In parallel, the ACQ effect is a thorny issue in the fabrication of OLEDs and
optoelectronic devices in general, in which chromophores are frequently used as aggregates in thin
films[7].
Figure 1: Pictures of fluorescein (Left) and HPS (Right) with different non-solvents amount. Reproduced with permission from ref.[42] © 2014 WILEY‐VCH Verlag GmbH & Co. KGaA, Weinheim.
As elucidated before, ACQ is a harmful effect even for practical applications and almost obiquitously
observed for classic chromophores.

17
Fortunately, almost 20 years ago an opposite behaviour, the Aggregation-Induced Emission (AIE)
effect, was observed and describe by Tang and co-workers. In the AIE process, poorly emissive
chromogens with propeller-shaped structures are induced to emit through aggregates formation.
The very first example of chromophore displaying AIE behaviour was Hexaphenylsilole (HPS) (See
Figure 1 Right ). If HPS is dissolved in a good solvent, as THF, no emission is detected for the solution,
while increasing the water fraction up to 80% the fluorescence is turned on and the mixture
becomes highly emissive when 90% of water is reached, thanks to the heavy aggregation of HPS
induced by water.
For a long times researchers have tried to avoid the formation of aggregates and the consequent
arise of the ACQ effect through various chemical, physical and engineering approaches with the
modification of the emissive core with bulky cyclic, spiral kinks and dendritic wedges.[10-14] The
results of these attempts were frequently unsatisfactory and brought to the creation of new
problems. In fact, most of the times the aggregation can be only temporarily prevented because the
aggregate formation is a natural process for molecules in closed proximity. The AIE effects have
provided a new starting point for scientists in the study of light-emissive properties of luminophores
and many new strategies were developed to prepare more and more performing AIEgens since the
first discovery. Moreover, AIE, oppositely to ACQ, is a constructive effect and allows to take
advantage of the aggregation process instead of working against it.
The great work done along the last decades has brought to a better comprehension of the
mechanism behind the AIE, to the design of many new AIEgens and to the exploration of their
technological applications.
3.2 Mechanism The understanding of AIE mechanism was crucial in order to guide the molecular engineering effort
in the right direction. Mechanistically, more than one process can cooperate to the AIE effect:
• Restriction of Intramolecular Motion (RIM)[15]
• J-Aggregate Formation (JAF)[1]
• Excited-State Intramolecular Proton Transfer (ESIPT)[16]
• Twisted Intramolecular Charge Transfer (TICT)[17-18]
However, RIM is the mechanism most frequently associated to AIE phenomena.
3.2.1 RIM In physics every movement, including molecular vibrations and rotations, consumes energy. In HPS,
the six phenyl rings are free to rotate independently from the central silole core. Similarly, in
tetraphenylethene (TPE, see Figure 2), that displays a configuration different from that of HPS, the
four phenyl rings have the same freedom to rotate and twist. An isolated molecule of TPE, for
example in a diluted solution, can dissipate the excess of energy in a non-radiative way through the
active intramolecular rotations. On the contrary, the physical constriction induced by the
aggregation of TPE molecules causes the restriction of the intramolecular rotation (RIR, see Figure
2) and blocks the radiationless relaxation channels favoring the radiative decays to the ground state.
18
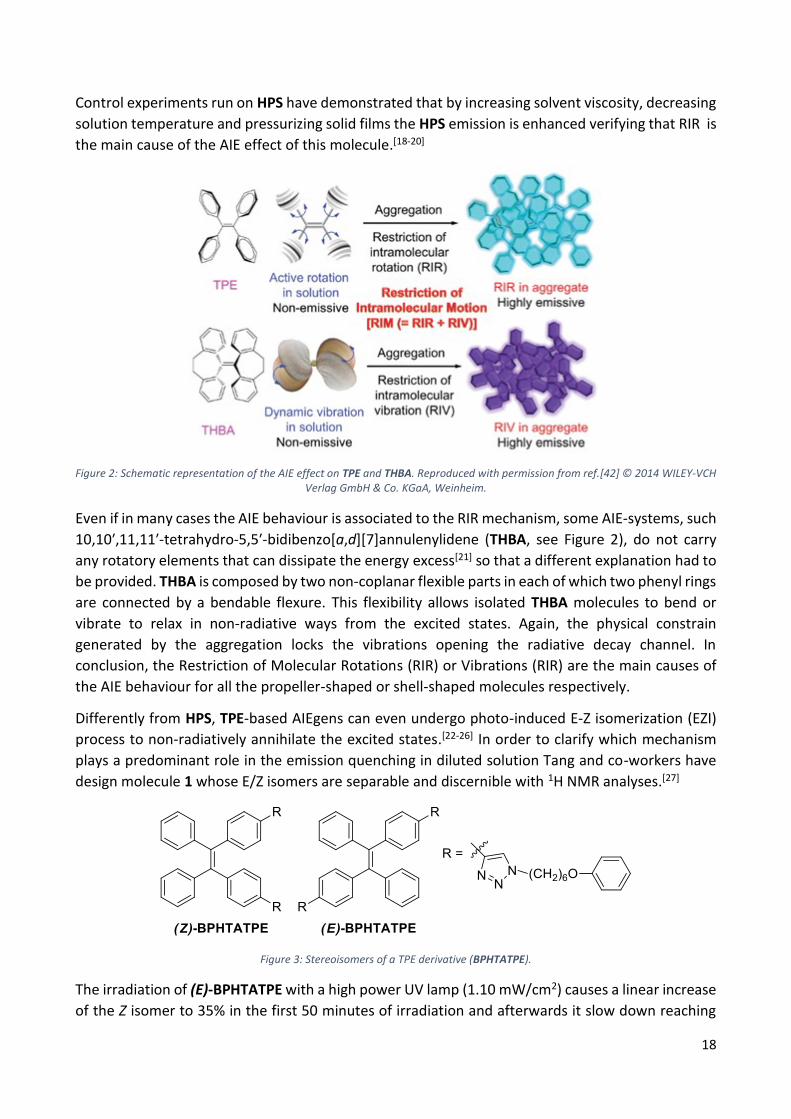
Control experiments run on HPS have demonstrated that by increasing solvent viscosity, decreasing
solution temperature and pressurizing solid films the HPS emission is enhanced verifying that RIR is
the main cause of the AIE effect of this molecule.[18-20]
Figure 2: Schematic representation of the AIE effect on TPE and THBA. Reproduced with permission from ref.[42] © 2014 WILEY‐VCH Verlag GmbH & Co. KGaA, Weinheim.
Even if in many cases the AIE behaviour is associated to the RIR mechanism, some AIE-systems, such
10,10′,11,11′-tetrahydro-5,5′-bidibenzo[a,d][7]annulenylidene (THBA, see Figure 2), do not carry
any rotatory elements that can dissipate the energy excess[21] so that a different explanation had to
be provided. THBA is composed by two non-coplanar flexible parts in each of which two phenyl rings
are connected by a bendable flexure. This flexibility allows isolated THBA molecules to bend or
vibrate to relax in non-radiative ways from the excited states. Again, the physical constrain
generated by the aggregation locks the vibrations opening the radiative decay channel. In
conclusion, the Restriction of Molecular Rotations (RIR) or Vibrations (RIR) are the main causes of
the AIE behaviour for all the propeller-shaped or shell-shaped molecules respectively.
Differently from HPS, TPE-based AIEgens can even undergo photo-induced E-Z isomerization (EZI)
process to non-radiatively annihilate the excited states.[22-26] In order to clarify which mechanism
plays a predominant role in the emission quenching in diluted solution Tang and co-workers have
design molecule 1 whose E/Z isomers are separable and discernible with 1H NMR analyses.[27]
Figure 3: Stereoisomers of a TPE derivative (BPHTATPE).
The irradiation of (E)-BPHTATPE with a high power UV lamp (1.10 mW/cm2) causes a linear increase
of the Z isomer to 35% in the first 50 minutes of irradiation and afterwards it slow down reaching

19
50% in 150 minutes. Surely the EZI process can occur under these conditions but in a
photoluminescence spectrum measurement a much lower power lamp (52 Μw/cm2) is normally
used. Setting the experiment to this milder conditions and exciting the sample at 322 nm for 30 min
the 1H NMR spectra does not show any appreciable change revealing that the EZI process has not
occurred.
This previous experiment demonstrates that in the condition under which we ordinarily observe or
measure the PL of a chromophore and specifically an AIEgen such as TPE, the alchene double bond
cannot be broken. Thus, the EZI is not a competitive process in the non-radiative deactivation
observed for TPE-based AIEgens in solution where the quenching effect is mostly ascribable to the
active rotation of the phenyl rings.
To completely demonstrate the central role played by the RIM in the arise of the AIE behaviour,
Dong at al. have convinientely lock the phenyl rings through an oxygen bridging atom through
McMurry coupling (see Figure 4).[28]
Figure 4: TPE-2O structure and pictures under the UV lamp of its solution (Left) and Crystal (Right). Reproduced with permission from [28] ©2012, Royal Society of Chemistry.
The PL spectra of TPE-2O crystals and diluted solution completely overlap due to its fully locked
phenyl rings. The quantum efficiency is 30.8% and 30.1% for crystals and solution respectively. This
means that the molecules do not display AIE behaviour since the bridging oxygens hinder the non-
radiative deactivation through intermolecular rotation. However, surprisingly, the emission is not
quenched by the aggregation. This observation was explained by the twisted conformation of TPE-
2O that prevents a close packing and the formation of harmful species such as excimers.
Theoretically, any molecule with the proper structure can undergo intramolecular rotation but not
every of them will show AIE behaviour. To explain this, Tang proposed the following arguments[17].
As mentioned, an elegible AIEgen molecule should have at least a rotatable bond through which
non-radiatively dissipate the energy excess in solution. This situation can be conveniently simplified
by two units, A and B, linked through a single bond (see Figure 5-a). In diagram a, θr defines the
structural flexibility of the molecule while Ψr describes the conformational planarity. In most of the
ACQ moieties the two units A and B are arranged in a planar conformation with Ψr ≈ 0° in order to
maximize the electronic conjugation and minimize the potential energy. The extension of the π-
conjugation endows the connecting single bond of a pseudo-double-bond character with partial
hindering of intermolecular rotation. The two chromophoric units could still swing to a small extend
(θr) but this low-frequency motion is insufficient to quench the emission, on the contrary the small
reorganization energy due to the rigidification of the system promote the luminescent process in
20
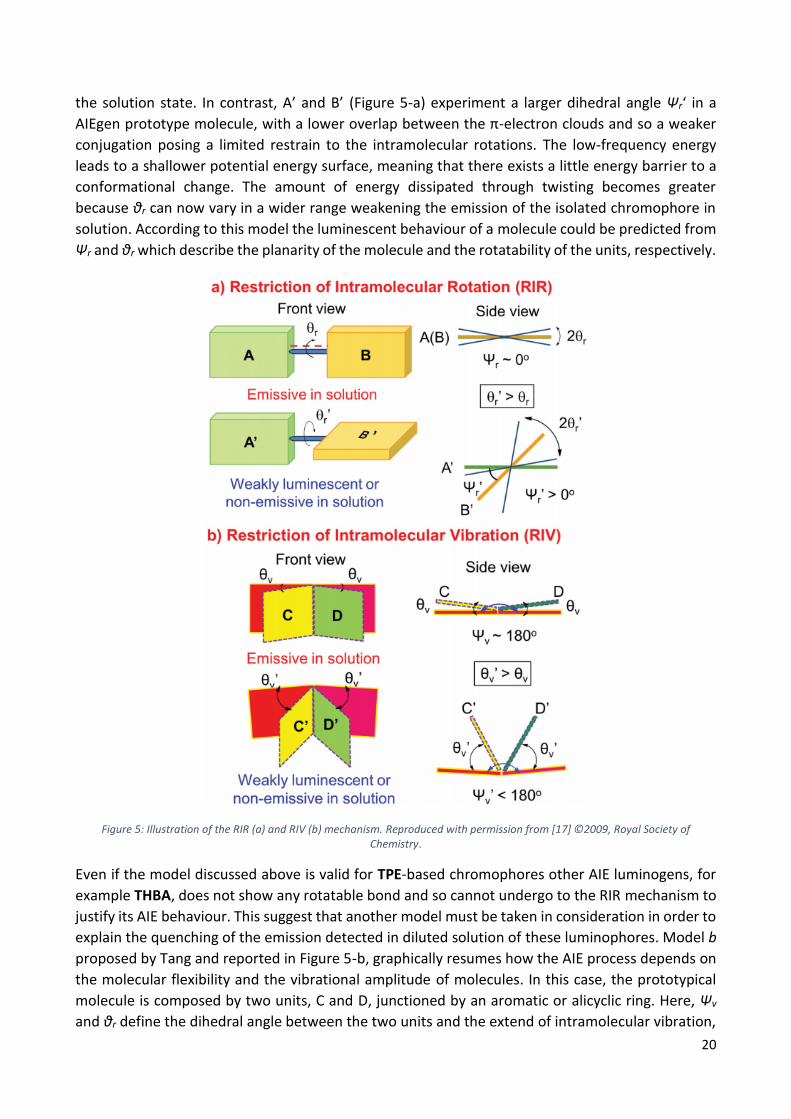
the solution state. In contrast, A’ and B’ (Figure 5-a) experiment a larger dihedral angle Ψr‘ in a
AIEgen prototype molecule, with a lower overlap between the π-electron clouds and so a weaker
conjugation posing a limited restrain to the intramolecular rotations. The low-frequency energy
leads to a shallower potential energy surface, meaning that there exists a little energy barrier to a
conformational change. The amount of energy dissipated through twisting becomes greater
because θr can now vary in a wider range weakening the emission of the isolated chromophore in
solution. According to this model the luminescent behaviour of a molecule could be predicted from
Ψr and θr which describe the planarity of the molecule and the rotatability of the units, respectively.
Figure 5: Illustration of the RIR (a) and RIV (b) mechanism. Reproduced with permission from [17] ©2009, Royal Society of Chemistry.
Even if the model discussed above is valid for TPE-based chromophores other AIE luminogens, for
example THBA, does not show any rotatable bond and so cannot undergo to the RIR mechanism to
justify its AIE behaviour. This suggest that another model must be taken in consideration in order to
explain the quenching of the emission detected in diluted solution of these luminophores. Model b
proposed by Tang and reported in Figure 5-b, graphically resumes how the AIE process depends on
the molecular flexibility and the vibrational amplitude of molecules. In this case, the prototypical
molecule is composed by two units, C and D, junctioned by an aromatic or alicyclic ring. Here, Ψv
and θr define the dihedral angle between the two units and the extend of intramolecular vibration,

21
defining the conformational planarity and the structural stiffness of the molecules. As in case a), the
planar conformation (Ψv ≈ 180°) is associated to a strong π-conjugation between units, that can still
oscillate in a small amplitude (θv) which is insufficient to prevent the radiative decay in diluted
solutions. The conformational stiffness generates a small overall reorganization energy for the
molecules and thus solutions are emissive while the aggregation can promote the instauration of
strong π-π stacking interactions causing the formation of deleterious species. On the other side, if
the two units, C’ and D’, are not coplanar due to the non-planarity of the inter-chromophore
junction (Ψv‘ < 180°) the overlap between the π-electron clouds decreases. As in the previous case,
these are the perfect conditions to observe a large vibrational amplitude (θv) that better dissipates
the energy reducing the emissive intensity in solution.
3.2.2 J-Aggregate Formation (JAF) In order to better understand the role of J-aggregation in the AIE-world it is necessary to introduce
the exciton model proposed by Kasha for the description of this mechanism.
Figure 6: Modified Jablonsky diagram for a generic J-aggregate compound.
We may assume that the exciton model can be approximated with a quasi-classical vector model,
thus, we have to consider the transition moment dipoles electrostatically. The molecules will be
approximated as an oval with a double arrow representing the polarization axis for the electronic
transition.
In a J-aggregate, typically, the transition dipoles are oriented with no overlap between adjacent
molecules (see Figure 6). In a J-dimer the exciton model provides the split of the excited state due
to the instauration of coulombian forces. In particular, the in-phase transition will be stabilized while
the out-of-phase transition will be destabilized. The oscillator strength for the transition G → E’ will
be 2f while for G → E’’ will be virtually null, thus, the direct population of E’’ is theoretically
prohibited.
Usually, J-aggregated dyes show bathocromic shift, an increase of the absorption coefficient and in
some cases a red-shift and an enhancement of the emission with respect to their diluted solution
showing AIE or at least Aggregation Enhanced Emission (AAE) effects.[30,31] Differently from RIM
mechanism, JAF dyes could be emissive already as isolated molecules because there is no

22
mechanism able to non-radiatively deactivate the excited state. At the same time, the enhancement
of the emission intensity in the aggregate or solid state is not always observed.
Figure 7: Chemical structures of PBI, 9,10-MADSA and 9,10-PADSA.
For example, the perylene bisimide derivative PBI forms J-aggregates in appropriated condition. In
particular, in methylcyclohexane (MCH) the sharper absorption band and the bathochromic effect
measured in comparison to dichloromethane diluted solution clearly indicate the formation of J-
aggregates in the nonpolar solvent. However, diluted solutions of PBI in polar solvents display
intense fluorescent emission with 100% quantum yield while in MCH, where J-aggregates are
formed, is 82% and further decreases to 20% after gelification. In synthesis, the JAF in this case does
not play a constructive role but in opposition the effect seems to make the PBI an ACQ active
species.[32]
Curiously, both 9,10-Bis(p-dimethylaminostyryl)anthracene (9,10-MADSA) and 9,10-Bis(p-
dipropylaminostyryl)anthracene (9,10-PADSA) display AIE effects but only 9,10-MADSA forms J-
aggregates. These two dyes share the same chemical structure with only small differences and it is
obvious that the AIE mechanism should be the same, involving restriction of rotation around the
connecting single bonds in the solid state.[33]
In summary, a direct correlation between JAF and AIE cannot be drawn because rigid molecules
displaying JAF could still undergo quenching effects due to strong π-π interactions in the aggregate
state. More flexible JAF dyes can surely display AIE but this effect has to be associated to the RIM
more than to JAF, which can only partially cooperate in the rigidification of the structure in the solid
state but does not provide the necessary mechanism for solution quenching.

23
3.2.3 ESIPT The extremely fast photoinduced proton transfer process was extensively studied due to the great
appeal of molecules displaying ESIPT as functional materials. [34] These dyes are stable as enol (E) in
the ground state and as keton (K) in the excited state, in fact, when an ESPITgen is excited a four-
level cycle occurs E-E*-K*-K. This process is accompanied by a large Stokes shift without self-
absorption. Even if some ESIPT dyes have enhanced emission in the aggregate form this process
alone does not fully explicate the observed AIE.
Figure 8: Conformational changes in the SaIHBP conformation and relative fluorescent emission. Modified with permission from ref.[35] © 2011 Académie des sciences. Published by Elsevier Masson SAS.
In the AIE-active ESIPT luminogen SaIHBP (see Figure 8) the proton transfer is strongly affected by
solvent properties.[35] In methyltetrahydrofuran (MeTHF) two weak emissions are observed from
the enol and keto forms that are in equilibrium. In this case the molecule may undergo
conformational changes through rotation around the single bonds quenching the radiative decays.
In a protonic solvent, such as methanol, the emission associated to the enol form completely covers
the keto one. The intramolecular H-bonding is here substituded by the formation of H-bonds with
the solvent that leads to a partial restriction of the intramolecular rotation thus the emission is not
efficiently quenched. In methylcyclohexane (MCH), where no interaction between the solvent and
the dye is possible the ESPIT process is fully active, thus only the keto emission is visible but most of
the energy is dissipated through active rotation. Regardless the ESIPT process, by lowering the
temperature to 140 K all the solutions show enhanced emission. This means that the enhancement
of the viscosity plays a significant role in the rigidification of the environment and hinders the
radiationless decays leading to a large increase of the emission.
Differently form SaIHBP the modified salicylaldehyde azine (MSAA, see Figure 9) displays a greater
structural flexibility but still undergoes ESIPT.[36] This feature gives to MSAA a larger AIE effect
because in ethanol solutions the rotations around the C-C and N-N single bonds actively quench the
emission while the addition of water causes the arise of the emission locking these free rotations.
In this case, rather than being the main mechanism behind the AIE behaviour, ESIPT works as a tuner

24
of the emission in the crystalline states, by changing the emissions wavelength in the two
polymorphs.
As in the case of JAF, ESIPT could have a role in the enhancement of the emission in the aggregate
state but it has always to work cooperatively with RIM to result in an AIEgen.
Figure 9: Structure of MSAA and pictures of its solution, aggregates and crystals. Reproduced with permission from ref.[36] © 2013 American Chemical Society.
3.2.4 TICT For systems with donor-acceptor (D-A) structure the AIE process can be the effect of the formation
of a “dark state” with TICT character in solutions while aggregation inhibits the transformation of
locally excited states (LE) into TICT states.[37,38] However, it has to be mentioned that the TICT can
provide a solid explanation to AIE only in specific solvent condition.
Figure 10: PCNDSB chemical structure and rotatable bonds. Pictures of different PCNDSB solutions and crystals). Reproduced with permission from ref.[38] © 2011 Elsevier B.V.
1,4-bis[1-cyano-2-(4-(diphenylamino)phenyl)vinyl]benzene (PCNDSB, see Figure 10) is composed by
two D-A subunits and displays remarkable solvatochromic effect with red-shifting of the emission
from green (510 nm) to red (667 nm) going from hexane to DMF. In the apolar solvent the planar
conformation of PCNDSB is stabilized by the conjugation between the units giving rise to a sharp
fluorescent emission from a locally excited (LE) state. In a polar solvent the two units are twisted
and the LE state is transformed in a TICT state with complete charge separation between D and A.
The TICT state is much more susceptible to quenching process and, with a quantum yield equal to
31% for the solid state (610 nm), this material clearly manifests AIE activity. The TICT inhibition can
effectively explain the quenching in DMF solution but the fluorescent emission in hexane and the
strong red-shifted emission of crystals can hardly be fully explained only considering the TICT[38,39].
Differently, aggregation studies on modified boron dipyrromethene (MBODIPY, see Figure 11) run
in THF/water mixure have revealed that a small addition of water in a THF solution of MBODIPY
strongly quenches and red-shifts the emission because it increases the polarity promoting a TICT
state. However, further additions of water revitalize the emission that is now blue-shifted by the
hydrophobic environment generated in the aggregates that also restricts the intramolecular

25
motion.[40] Similarly, TPA-DCM (see Figure 12) emission is weakened and red-shifted by a small
addition of water in its THF solution revealing the TICT promotion.
Figure 11: MBODIPY chemical structure and rotatable bonds. Waterfraction (fw) dependend behaviour. Reproduced with permission from ref.[40] ©2009 American Chemical Society.
Differently, when aggregates are formed through addition of greater amount of water the emission
is not intensified and the ACQ prevails. The hydrophobic environment generated through
aggregation disfravors the TICT process that quenches the emission in polar solvent but the TPA-
DCM core is already very rigid and the aggregation cannot restrict any rotational motion thus, the
molecule does not exhibit AIE effects.[41] This behaviour indicates that not all the TICT molecules are
AIE because the amplitude of the rotations involved in the TICT are not necessarily enough energetic
to be the main reason of the observed quench and so the AIE activity of a molecule undergoing TICT
depends by its flexibility and rotational motion.
Figure 12: TPA-DCM chemical structure and rotatable bonds. Waterfraction (fw) dependend behaviour). Reproduced with permission from ref. [41] © 2012 WILEY‐VCH Verlag GmbH & Co.
3.3 Conclusion Based on the above reported examples of the literature it was concluded that RIM, whose essence
is the structural rigidification or conformational stiffening, is the only mechanism through which a
dye can develop a pure AIE behaviour even if a partial overlap with others mechanism such JAF,
ESIPT and TICT is always possible.

26
3.4 References [1] Bünau, G., J. B. Birks: Photophysics of Aromatic Molecules. Wiley-Interscience, London 1970. 704 Seiten.
Preis: 210s. Berichte der Bunsengesellschaft für physikalische Chemie 1970, 74 (12), 1294-1295.
[2] a) Zhang, X.; Görl, D.; Stepanenko, V.; Würthner, F., Hierarchical Growth of Fluorescent Dye Aggregates
in Water by Fusion of Segmented Nanostructures. Angewandte Chemie International Edition 2014, 53 (5),
1270-1274.
b) Thomas, S. W.; Joly, G. D.; Swager, T. M., Chemical Sensors Based on Amplifying Fluorescent Conjugated
Polymers. Chemical Reviews 2007, 107 (4), 1339-1386.
[3] Hoeben, F. J. M.; Jonkheijm, P.; Meijer, E. W.; Schenning, A. P. H. J., About Supramolecular Assemblies of
π-Conjugated Systems. Chemical Reviews 2005, 105 (4), 1491-1546.
[4] Bunz, U. H. F., Poly(aryleneethynylene)s: Syntheses, Properties, Structures, and Applications. Chemical
Reviews 2000, 100 (4), 1605-1644.
[5] Hide, F.; DÍaz-GarcÍa, M. A.; Schwartz, B. J.; Heeger, A. J., New Developments in the Photonic Applications
of Conjugated Polymers. Accounts of Chemical Research 1997, 30 (10), 430-436.
[6] Borisov, S. M.; Wolfbeis, O. S., Optical Biosensors. Chemical Reviews 2008, 108 (2), 423-461.
[7] Tang, C. W.; VanSlyke, S. A., Organic electroluminescent diodes. Applied Physics Letters 1987, 51 (12), 913-
915.
[8] Jares-Erijman, E. A.; Jovin, T. M., FRET imaging. Nature Biotechnology 2003, 21 (11), 1387-1395.
[9] Saigusa, H.; Lim, E. C., Excimer Formation in van der Waals Dimers and Clusters of Aromatic Molecules.
Accounts of Chemical Research 1996, 29 (4), 171-178.
[10] Wang, J.; Zhao, Y.; Dou, C.; Sun, H.; Xu, P.; Ye, K.; Zhang, J.; Jiang, S.; Li, F.; Wang, Y., Alkyl and Dendron
Substituted Quinacridones: Synthesis, Structures, and Luminescent Properties. The Journal of Physical
Chemistry B 2007, 111 (19), 5082-5089.
[11] Hecht, S.; Fréchet, J. M. J., Dendritic Encapsulation of Function: Applying Nature's Site Isolation Principle
from Biomimetics to Materials Science. Angewandte Chemie International Edition 2001, 40 (1), 74-91.
[12] Nguyen, B. T.; Gautrot, J. E.; Ji, C.; Brunner, P.-L.; Nguyen, M. T.; Zhu, X. X., Enhancing the
Photoluminescence Intensity of Conjugated Polycationic Polymers by Using Quantum Dots as
Antiaggregation Reagents. Langmuir 2006, 22 (10), 4799-4803.
[13] Chen, L.; Xu, S.; McBranch, D.; Whitten, D., Tuning the Properties of Conjugated Polyelectrolytes through
Surfactant Complexation. Journal of the American Chemical Society 2000, 122 (38), 9302-9303.
[14] Taylor, P. N.; O'Connell, M. J.; McNeill, L. A.; Hall, M. J.; Aplin, R. T.; Anderson, H. L., Insulated Molecular
Wires: Synthesis of Conjugated Polyrotaxanes by Suzuki Coupling in Water. Angewandte Chemie
International Edition 2000, 39 (19), 3456-3460.
[15] Chen, J.; Law, C. C. W.; Lam, J. W. Y.; Dong, Y.; Lo, S. M. F.; Williams, I. D.; Zhu, D.; Tang, B. Z., Synthesis,
Light Emission, Nanoaggregation, and Restricted Intramolecular Rotation of 1,1-Substituted 2,3,4,5-
Tetraphenylsiloles. Chemistry of Materials 2003, 15 (7), 1535-1546.
[16] Li, H.; Zhang, X.; Zhang, X.; Yang, B.; Yang, Y.; Wei, Y., Ultra-stable biocompatible cross-linked fluorescent
polymeric nanoparticles using AIE chain transfer agent. Polymer Chemistry 2014, 5 (12), 3758-3762.

27
[17] Hong, Y.; Lam, J. W. Y.; Tang, B. Z., Aggregation-induced emission: phenomenon, mechanism and
applications. Chemical Communications 2009, (29), 4332-4353.
[18] Hu, R.; Leung, N. L. C.; Tang, B. Z., AIE macromolecules: syntheses, structures and functionalities.
Chemical Society Reviews 2014, 43 (13), 4494-4562.
[19] Fan, X.; Sun, J.; Wang, F.; Chu, Z.; Wang, P.; Dong, Y.; Hu, R.; Tang, B. Z.; Zou, D., Photoluminescence and
electroluminescence of hexaphenylsilole are enhanced by pressurization in the solid state. Chemical
Communications 2008, (26), 2989-2991.
[20] Li, S.; Wang, Q.; Qian, Y.; Wang, S.; Li, Y.; Yang, G., Understanding the Pressure-Induced Emission
Enhancement for Triple Fluorescent Compound with Excited-State Intramolecular Proton Transfer. The
Journal of Physical Chemistry A 2007, 111 (46), 11793-11800..
[21] a) Luo, J.; Song, K.; Gu, F. l.; Miao, Q., Switching of non-helical overcrowded tetrabenzoheptafulvalene
derivatives. Chemical Science 2011, 2 (10), 2029-2034.
b) Li, Z.; Qin, A., Diverge from the norm. National Science Review 2014, 1 (1), 22-24.
[22] Schilling, C. L.; Hilinski, E. F., Dependence of the lifetime of the twisted excited singlet state of
tetraphenylethylene on solvent polarity. Journal of the American Chemical Society 1988, 110 (7), 2296-2298.
[23] Shultz, D. A.; Fox, M. A., Effect of phenyl ring torsional rigidity on the photophysical behavior of
tetraphenylethylenes. Journal of the American Chemical Society 1989, 111 (16), 6311-6320.
[24] Simeonov, A.; Matsushita, M.; Juban, E. A.; Thompson, E. H. Z.; Hoffman, T. Z.; Beuscher Iv, A. E.; Taylor,
M. J.; Wirsching, P.; Rettig, W.; McCusker, J. K.; Stevens, R. C.; Millar, D. P.; Schultz, P. G.; Lerner, R. A.; Janda,
K. D., Blue-Fluorescent Antibodies. Science 2000, 290 (5490), 307.
[25] Waldeck, D. H., Photoisomerization dynamics of stilbenes. Chemical Reviews 1991, 91 (3), 415-436.
[26] Saltiel, J.; D'Agostino, J. T., Separation of viscosity and temperature effects on the singlet pathway to
stilbene photoisomerization. Journal of the American Chemical Society 1972, 94 (18), 6445-6456.
[27] Wang, J.; Mei, J.; Hu, R.; Sun, J. Z.; Qin, A.; Tang, B. Z., Click Synthesis, Aggregation-Induced Emission, E/Z
Isomerization, Self-Organization, and Multiple Chromisms of Pure Stereoisomers of a Tetraphenylethene-
Cored Luminogen. Journal of the American Chemical Society 2012, 134 (24), 9956-9966.
[28] Shi, J.; Chang, N.; Li, C.; Mei, J.; Deng, C.; Luo, X.; Liu, Z.; Bo, Z.; Dong, Y. Q.; Tang, B. Z., Locking the phenyl
rings of tetraphenylethene step by step: understanding the mechanism of aggregation-induced emission.
Chemical Communications 2012, 48 (86), 10675-10677.
[29] Herman, M.; Perry, D. S., Molecular spectroscopy and dynamics: a polyad-based perspective. Physical
Chemistry Chemical Physics 2013, 15 (25), 9970-9993.
b) Klaumünzer, B.; Kröner, D.; Lischka, H.; Saalfrank, P., Non-adiabatic excited state dynamics of riboflavin
after photoexcitation. Physical Chemistry Chemical Physics 2012, 14 (24), 8693-8702.
[30] a) Jelley, E. E., Spectral Absorption and Fluorescence of Dyes in the Molecular State. Nature 1936, 138
(3502), 1009-1010.b) Möbius, D., Scheibe Aggregates. Advanced Materials 1995, 7 (5), 437-444.
[31] Würthner, F.; Kaiser, T. E.; Saha-Möller, C. R., J-Aggregates: From Serendipitous Discovery to
Supramolecular Engineering of Functional Dye Materials. Angewandte Chemie International Edition 2011, 50
(15), 3376-3410.

28
[32] Li, X.-Q.; Zhang, X.; Ghosh, S.; Würthner, F., Highly Fluorescent Lyotropic Mesophases and Organogels
Based on J-Aggregates of Core-Twisted Perylene Bisimide Dyes. Chemistry – A European Journal 2008, 14
(27), 8074-8078.
[33] Wang, Y.; Liu, T.; Bu, L.; Li, J.; Yang, C.; Li, X.; Tao, Y.; Yang, W., Aqueous Nanoaggregation-Enhanced One-
and Two-Photon Fluorescence, Crystalline J-Aggregation-Induced Red Shift, and Amplified Spontaneous
Emission of 9,10-Bis(p-dimethylaminostyryl)anthracene. The Journal of Physical Chemistry C 2012, 116 (29),
15576-15583.
[34] Goodman, J.; Brus, L. E., Proton transfer and tautomerism in an excited state of methyl salicylate. Journal
of the American Chemical Society 1978, 100 (24), 7472-7474.
[35]. Yang, G.; Li, S.; Wang, S.; Li, Y., Emissive properties and aggregation-induced emission enhancement of
excited-state intramolecular proton-transfer compounds. Comptes Rendus Chimie 2011, 14 (9), 789-798.
[36] Wei, R.; Song, P.; Tong, A., Reversible Thermochromism of Aggregation-Induced Emission-Active
Benzophenone Azine Based on Polymorph-Dependent Excited-State Intramolecular Proton Transfer
Fluorescence. The Journal of Physical Chemistry C 2013, 117 (7), 3467-3474.
[37] Gao, B.-R.; Wang, H.-Y.; Yang, Z.-Y.; Wang, H.; Wang, L.; Jiang, Y.; Hao, Y.-W.; Chen, Q.-D.; Li, Y.-P.; Ma,
Y.-G.; Sun, H.-B., Comparative Time-Resolved Study of Two Aggregation-Induced Emissive Molecules. The
Journal of Physical Chemistry C 2011, 115 (32), 16150-16154.
[38] Yan, Z.-Q.; Yang, Z.-Y.; Wang, H.; Li, A.-W.; Wang, L.-P.; Yang, H.; Gao, B.-R., Study of aggregation induced
emission of cyano-substituted oligo (p-phenylenevinylene) by femtosecond time resolved fluorescence.
Spectrochimica Acta Part A: Molecular and Biomolecular Spectroscopy 2011, 78 (5), 1640-1645.
[39] Fang, H.-H.; Chen, Q.-D.; Yang, J.; Xia, H.; Gao, B.-R.; Feng, J.; Ma, Y.-G.; Sun, H.-B., Two-Photon Pumped
Amplified Spontaneous Emission from Cyano-Substituted Oligo(p-phenylenevinylene) Crystals with
Aggregation-Induced Emission Enhancement. The Journal of Physical Chemistry C 2010, 114 (27), 11958-
11961.
[40] Hu, R.; Lager, E.; Aguilar-Aguilar, A.; Liu, J.; Lam, J. W. Y.; Sung, H. H. Y.; Williams, I. D.; Zhong, Y.; Wong,
K. S.; Peña-Cabrera, E.; Tang, B. Z., Twisted Intramolecular Charge Transfer and Aggregation-Induced Emission
of BODIPY Derivatives. The Journal of Physical Chemistry C 2009, 113 (36), 15845-15853.
[41] Qin, W.; Ding, D.; Liu, J.; Yuan, W. Z.; Hu, Y.; Liu, B.; Tang, B. Z., Biocompatible Nanoparticles with
Aggregation-Induced Emission Characteristics as Far-Red/Near-Infrared Fluorescent Bioprobes for In Vitro
and In Vivo Imaging Applications. Advanced Functional Materials 2012, 22 (4), 771-779 .
[42] Mei, J.; Hong, Y.; Lam, J. W. Y.; Qin, A.; Tang, Y.; Tang, B. Z., Aggregation-Induced Emission: The Whole Is
More Brilliant than the Parts. Advanced Materials 2014, 26 (31), 5429-5479.

29
4 Room Temperature Phosphorescence
4.1 Introduction Room Temperature Phosphorescence or RTP has been for a long time considered the realm of inorganic
compounds due to the low Spin-Orbit Coupling (SOC) observed in pure organic materials that prevents the
population of accessible triplet states and their high sensitivity to atmospheric oxygen[1][2]. Only in recent
times the scientific community started to deeply investigate purely organic materials displaying
phosphorescent emission. A Major boost in this research field was given by the large number of application
for these materials such as the fabrication of OLEDs, digital security, sensors, bioimaging and in general in
the fields of optoelectronic and bioelectronic.
Big efforts were done in order to raise SOC in organic compounds in particular through the introduction of
aromatic carbonyl groups, halogen bonding, formation of charge transfer states and radical anion pairs.
Another crucial point in the development of efficient organic phosphors has been the stabilization of the
triplet state once it is selectively populated. The emission of a photon from a triplet state is just one of the
possible processes and, most of the time, thermal deactivation through molecular vibration or rotation and
oxygen quenching strongly overcome the phosphorescent emission. This drawback can be efficiently solved
by crystallization, host-guest doping, inclusion in metal-organic frameworks MOFs, ionic bonding or
molecular assembly.
The preparation of good emitters displaying long RTP is furtherly complicated by the obvious consideration
that, most of the times, there is an inverse proportionality between the decay time τP and the quantum
efficiency ФP[3][4].
4.2 Organic phosphorescence By its definition phosphorescence is the radiative deactivation from an upper excited state to a lower state
characterized by a different multiplicity. Transferred to the organic realm this means that all the relevant
processes labelled as phosphorescence involve a triplet excited state that relax to a singlet ground state.
The necessary step to observe any photophysical process is the excitation of the system that brings the
molecule from the ground state S0 to a generic excited state Sn (n ≥ 1). Usually more than one absorption is
possible but excitation to high energy levels is often accompanied by photodegradation of the material. The
most common process that will occur after bringing the system to a generic single excited state is Internal
Conversion (IC) to the S1 level through vibrational deactivation. As postulated by Kasha’s rule, IC is related to
the overlap between energetic levels with different vibrational and electronic quantum numbers as
expressed by the Franck-Condon factors, the greater is the overlap the faster is the transition. IC is commonly
most rapid than all the other possible processes and leads to the selective population of S1. IC from S1 to S0
is usually less efficient than from upper Sn levels to S1 due to the small overlap between the vibronic levels of
S1 and S0. This allows radiative deactivation from S1 (fluorescence) to be competitive with IC. It is also possible
that Intersystem Crossing (ISC) occurs from S1 to populate a triplet level Tm. ISC is generally difficult in purely
organic molecules due to a small SOC. Population of Tm is usually very efficiently followed by a rapid IC to T1,
from which the system can non radiatively or radiatively relax to S0 (phosphorescence) (See Figure 1). A less
common process can occur from T1 that is the re-population of S1, this is possible only when the two levels
have a small energy gap that can be filled by the thermal energy. This phenomenon leads to a delayed
fluorescence defined as TADF (Thermally Activated Delayed Fluorescence).

30
Figure 1: Jablonski diagram and possible processes.
Based on these considerations we can define the phosphorescent quantum efficiency ФP, the ISC quantum
efficiency ФISC and the phosphorescent life time τP according to the following equations:
Ф𝑃 = Ф𝐼𝑆𝐶𝜏𝑃𝑘𝑃
Ф𝐼𝑆𝐶 = 𝑘𝐼𝑆𝐶
𝑘𝐹 + 𝑘𝐼𝐶 + 𝑘𝐼𝑆𝐶
𝜏𝑃 = 1
𝑘𝑃 + 𝑘𝑛𝑟
Where 𝑘𝑋 are the rate constants of specific processes.
To better understand the related factors that allow the arise of the phosphorescence we have to approach
this phenomenon from a theoretical point of view through the quantum mechanics theory.
The rate constant 𝑘 for a process based on Fermi’s golden rule is here defined:
𝑘 = 2𝜋
ℎ |𝐻′|2𝛿 (𝐸𝑖 − 𝐸𝑓)
Where 𝐻′ is the matrix element of the perturbed Hamiltonian, (𝐸𝑖 − 𝐸𝑓) is the adiabatic energy gap between
the initial and the final state and 𝛿 is the function that ensure the energy conservation for the non-radiative
transition.
For singlet to singlet transitions the implementation of a non-adiabatic coupling between the two states leads
to IC rate 𝑘𝐼𝐶 while, turning to singlet to triplet transitions, SOC breaks the spin-forbidden transition and
opens to ISC with rate 𝑘𝐼𝑆𝐶. There are two mainly consistent ISC processes that can occur in an organic
molecule: S1 → Tm ISC, that is the main process to populate the triplet levels, and T1 → S0 ISC, that dominates
the triplet deactivation.
Assuming the high temperature approximation and the short time approximation:

31
𝑘𝐼𝑆𝐶 = 2𝜋
ℎ |⟨𝑆|�̂�𝑆𝑂𝐶|𝑇⟩|
2√
𝜋
𝜆𝑘𝐵𝑇𝑒
−(𝛥𝐸𝑆𝑇−𝜆)2
4𝜆𝑘𝐵𝑇
|⟨𝑆|�̂�𝑆𝑂𝐶|𝑇⟩| is the SOC matrix element between the two levels and 𝜆 is the reorganization energy, sum of
the normal mode components with 𝜆𝑘 = 1
2 𝜔𝑘
2𝛥𝑄𝑘2 (𝛥𝑄𝑘
2 represents the difference their equilibrium
geometry) that describes the nuclear change during the transition.
𝑘𝐼𝑆𝐶 is promoted by a magnification of SOC, that is the reason why, based on the El-Sayed’s rule, the ISC
process is favoured by a change in the molecular orbital type. In fact, the SOC matrix element of a transition
involving a transition from 1(π, π*) to 3(n, π*) is two times larger than a transition from 1(π, π*) to 3(π, π*).
The SOC operator is the product of the orbital and spin angular moment. It is evident that the orbital angular
moment operator rotates the atoms and changes their symmetry, this leads to a greater spatial integral
between states of different orbital symmetry with respect to the molecular plane reflection.
The significance of the vibronic component is not considered in the El-Sayed’s rule but it can be evaluated by
the Frank-Condon Integral. The vibronic term is determined by two parameters: 𝛥𝐸𝑆𝑇 and 𝜆. In a rigid
environment the displacement between the electronic state is small and the direct consequence is a weak
coupling limit (𝛥𝐸𝑆𝑇 ≫ 𝜆). In order to accelerate the ISC process, it is necessary to increase 𝜆 and in parallel
decrease 𝛥𝐸𝑆𝑇, however, this relationship is true till the ISC has a small structural change.
The 𝑘𝑃 radiative rate determine the spontaneous radiative emission of a photon from the lowest triplet level.
This rate can be calculated by the Einstein coefficient:
𝑘𝑃 = 64𝜋4
3ℎ4𝑐2 𝛥𝐸𝑇1→𝑆0
3 |𝜇𝑇1→𝑆0|2
𝜇𝑇1→𝑆0 = ∑⟨𝑇1|�̂�𝑆𝑂𝐶|𝑆𝑘⟩
𝐸1 − 𝐸𝑘 13
𝑘
x 𝜇𝑆𝑘→𝑆0 + ∑⟨𝑇𝑚|�̂�𝑆𝑂𝐶|𝑆0⟩
𝐸𝑚 − 𝐸0 13
𝑚
x 𝜇𝑇𝑚→𝑇1
𝜇𝑇1→𝑆0 is directly proportional to the SOC between triplet and singlet state but it is inversely proportional to
the energy gap. While, the rate 𝑘𝑃 is directly proportional to the gap between the emissive triplet state and
the singlet ground state.
To summarize, the various strategies enhance phosphorescence quantum yield, Ф𝑃:
• Promote ISC by enhancing ⟨𝑆1|�̂�𝑆𝑂𝐶|𝑇𝑚⟩ and 𝜆, decreasing the energy gap 𝛥𝐸𝑆1→𝑇𝑚 or
disadvantaging the other competitive processes.
• Decrease the non-radiative decay from the T1 state through the decrease of the ⟨𝑇1|�̂�𝑆𝑂𝐶|𝑆0⟩ and
the relative 𝜆, or the increase of the gap 𝛥𝐸𝑇1→𝑆0.
• Enhance 𝑘𝑃 by increasing 𝛥𝐸𝑇1→𝑆0 and 𝜇𝑇1→𝑆0
When the enhancement of the phosphorescent lifetime 𝜏𝑃 is taken into account we have to consider that
the stabilization of the triplet state is achievable only through the reduction of the decay processes allowed
from this state, the non-radiative decay and the phosphorescence. Obviously, the population of the triplet
state is the key process to observe phosphorescent emission but the increase of the SOC ⟨𝑆1|�̂�𝑆𝑂𝐶|𝑇1⟩, the
decrease of the gap between them, not only favours ISC but it results in an increase of the 𝑘𝑃 leading to a
shorter 𝜏𝑃. On the contrary, the increase of the SOC ⟨𝑆1|�̂�𝑆𝑂𝐶|𝑇𝑚⟩ (m>1) leads to a selective increase of the
𝑘𝐼𝑆𝐶 and it does not affect the 𝑘𝑃. The raise of the gap 𝛥𝐸𝑇1→𝑆0 can result in a reduction of the non-radiative
decay and also in an acceleration of the phosphorescence that it is not suitable for the achievement of a long
lifetime, that is the reason why it is rather difficult to find red or blue phosphorescence with long lifetime but

32
it is common to observe longer decay time for green or yellows emission, where 𝑘𝑃 and 𝑘𝑛𝑟 are balanced.
The decrease of the SOC ⟨𝑇1|�̂�𝑆𝑂𝐶|𝑆0⟩ and 𝜆, that is controlled by the rigidity of the environment and by the
deuteration, that controls 𝜔, allowing the achievement of high Ф𝑃 and long 𝑘𝑃 even if this process suppresses
the 𝜆 for the transition S1 → Tm reducing the 𝑘𝐼𝑆𝐶.
All these considerations allow to claim that the achievement of both great Ф𝑃 and long 𝜏𝑃 is feasible even if
it is an arduous challenge due to the contribution of many factors.
Finally, the Reverse Intersystem Crossing (RISC) must by mentioned. This process is not very common but it
can be present and competes with phosphorescence when S1 → T1 gap is smaller than 0.37 eV. This is a
necessary condition to observe the Thermally activated Delay Fluorescence (TADF). This uncommon emission
is frequently observed in copresence with RTP generating a dual emissive behaviour.
Two of the different strategies pursued in order to isolate organic RTP dyes are reported in the following.
4.2.1 Halogen bonding induced RTP The introduction of heavy atoms in a purely organic chromophore can effectively increase the Spin-Orbit
Coupling thus enhancing ISC from singlets to triplets. Obviously, choosing a transition metal all the benefits
deriving by the purely organic structure, such as low prize, high processability and low toxicity will be lost. In
this regard, the introduction of heavy halogen atoms can have the same impact on the photophysic of the
system without all the drawbacks associated with the heavy metal. Moreover, the presence of halogens in
some cases has allowed the formation of intermolecular interactions through halogen bonds that rigidify of
the environment and positively contribute to the arise of the RTP. In addition, cocrystallization of a
chromophore with halogen bond donor species has been reported to induce intermolecular electronic
coupling (IEC) that promotes the ISC[4].
Figure 2: Bromobenzene derivatives structure displaying RTP and relative pictures. Adapted with permission from ref.[5] © 2011, Nature Publishing Group, and from ref.[6]© 2016, American Chemical Society.
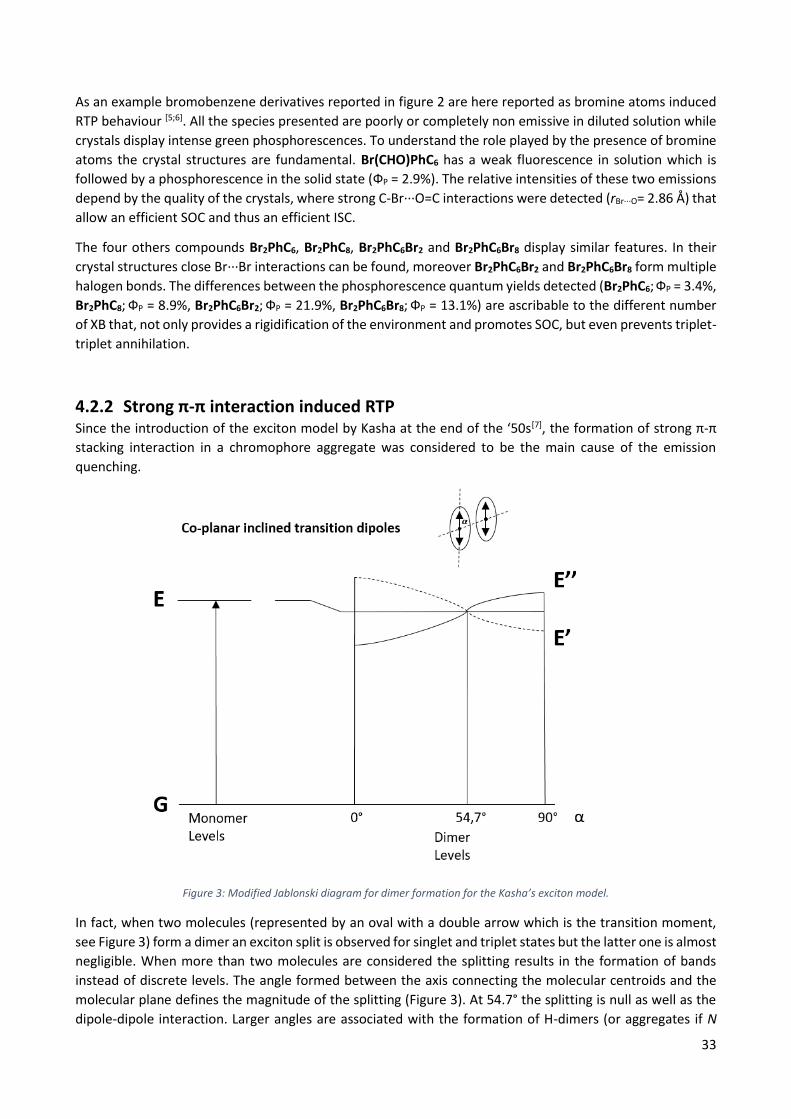
33
As an example bromobenzene derivatives reported in figure 2 are here reported as bromine atoms induced
RTP behaviour [5;6]. All the species presented are poorly or completely non emissive in diluted solution while
crystals display intense green phosphorescences. To understand the role played by the presence of bromine
atoms the crystal structures are fundamental. Br(CHO)PhC6 has a weak fluorescence in solution which is
followed by a phosphorescence in the solid state (ФP = 2.9%). The relative intensities of these two emissions
depend by the quality of the crystals, where strong C-Br···O=C interactions were detected (rBr···O= 2.86 Å) that
allow an efficient SOC and thus an efficient ISC.
The four others compounds Br2PhC6, Br2PhC8, Br2PhC6Br2 and Br2PhC6Br8 display similar features. In their
crystal structures close Br···Br interactions can be found, moreover Br2PhC6Br2 and Br2PhC6Br8 form multiple
halogen bonds. The differences between the phosphorescence quantum yields detected (Br2PhC6; ФP = 3.4%,
Br2PhC8; ФP = 8.9%, Br2PhC6Br2; ФP = 21.9%, Br2PhC6Br8; ФP = 13.1%) are ascribable to the different number
of XB that, not only provides a rigidification of the environment and promotes SOC, but even prevents triplet-
triplet annihilation.
4.2.2 Strong π-π interaction induced RTP Since the introduction of the exciton model by Kasha at the end of the ‘50s[7], the formation of strong π-π
stacking interaction in a chromophore aggregate was considered to be the main cause of the emission
quenching.
Figure 3: Modified Jablonski diagram for dimer formation for the Kasha’s exciton model.
In fact, when two molecules (represented by an oval with a double arrow which is the transition moment,
see Figure 3) form a dimer an exciton split is observed for singlet and triplet states but the latter one is almost
negligible. When more than two molecules are considered the splitting results in the formation of bands
instead of discrete levels. The angle formed between the axis connecting the molecular centroids and the
molecular plane defines the magnitude of the splitting (Figure 3). At 54.7° the splitting is null as well as the
dipole-dipole interaction. Larger angles are associated with the formation of H-dimers (or aggregates if N

34
molecules are taken in consideration; figure 4 right) while smaller angles generate J-dimers (or aggregates;
Figure 4 left).
Figure 4: Modified Jablonski diagram for J-dimer (Left) and H-dimer (Right) for the Kasha’s exciton model.
In a H-dimer the lower exciton level (or the bottom of the bands considering an N-fold aggregate) is not
directly accessible from the ground state because the stabilized out-of-phase transition generates a null
variation of the transition moment while in a J-dimer (or aggregate) the opposite is true. The probabilities to
observe a transition from or to a specific level are identical thus, the emission from the lowest level is
theoretically prohibited in a H-aggregate while it could be enhanced in a J-aggregate. For this reason, after
excitation on the top of the band, an H-aggregate undergoes rapid IC to the lowest level where the exciton
is trapped since the transition to the ground state is prohibited. Now, the energy split induced by the
aggregation, that causes a decrease of the gap between the singlet levels and the triplet state, together with
the trapping effect allow ISC to became competitive with respect to fluorescent emission[8;9] (Figure 5).
Figure 5: Modified Jablonski diagram for H-dimer formation for the Kasha’s exciton model comprehensive of the triplet states and the possible transition.
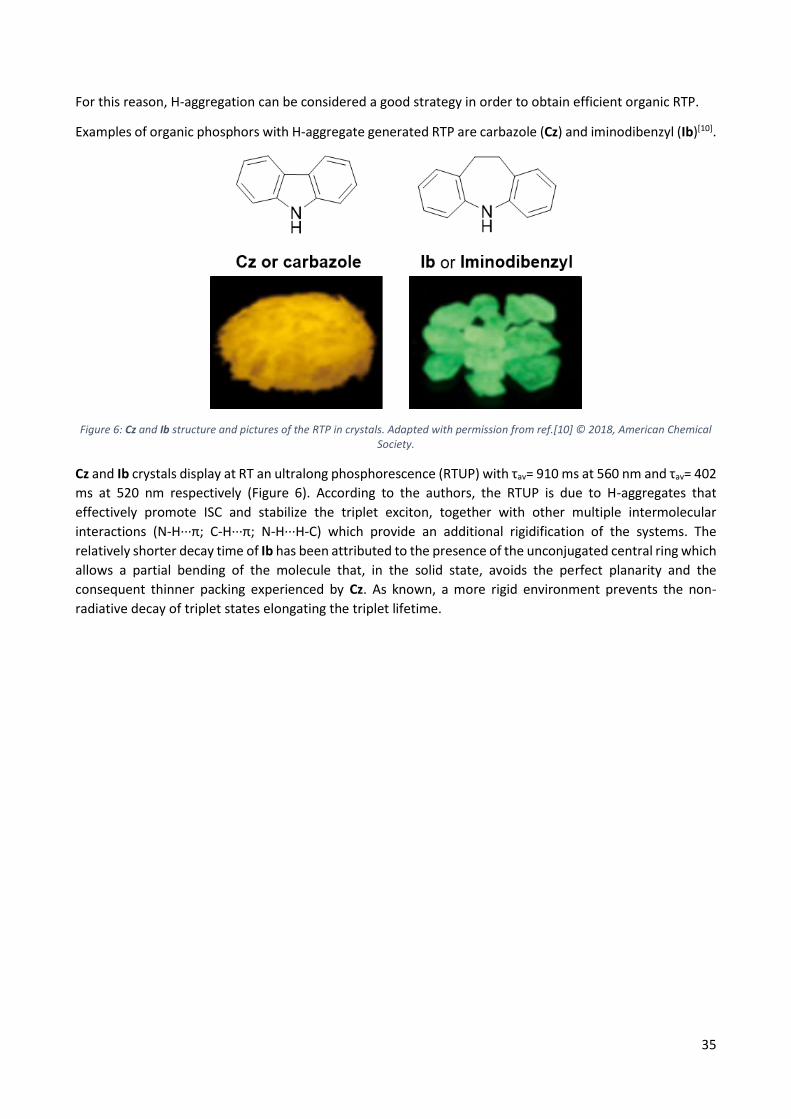
35
For this reason, H-aggregation can be considered a good strategy in order to obtain efficient organic RTP.
Examples of organic phosphors with H-aggregate generated RTP are carbazole (Cz) and iminodibenzyl (Ib)[10].
Figure 6: Cz and Ib structure and pictures of the RTP in crystals. Adapted with permission from ref.[10] © 2018, American Chemical Society.
Cz and Ib crystals display at RT an ultralong phosphorescence (RTUP) with τav= 910 ms at 560 nm and τav= 402
ms at 520 nm respectively (Figure 6). According to the authors, the RTUP is due to H-aggregates that
effectively promote ISC and stabilize the triplet exciton, together with other multiple intermolecular
interactions (N-H···π; C-H···π; N-H···H-C) which provide an additional rigidification of the systems. The
relatively shorter decay time of Ib has been attributed to the presence of the unconjugated central ring which
allows a partial bending of the molecule that, in the solid state, avoids the perfect planarity and the
consequent thinner packing experienced by Cz. As known, a more rigid environment prevents the non-
radiative decay of triplet states elongating the triplet lifetime.

36
4.3 References [1] Forni, A.; Lucenti, E.; Botta, C.; Cariati, E., Metal free room temperature phosphorescence from molecular
self-interactions in the solid state. Journal of Materials Chemistry C 2018, 6 (17), 4603-4626.
[2] Ma, H.; Lv, A.; Fu, L.; Wang, S.; An, Z.; Shi, H.; Huang, W., Room‐Temperature Phosphorescence in Metal‐
Free Organic Materials. Annalen der Physik 2019, 531 (7), 1800482.
[3] An, Z.; Zheng, C.; Tao, Y.; Chen, R.; Shi, H.; Chen, T.; Wang, Z.; Li, H.; Deng, R.; Liu, X.; Huang, W., Stabilizing
triplet excited states for ultralong organic phosphorescence. Nature Materials 2015, 14 (7), 685-690.
[4] X. Pang and W. J. Jin, in Halogen Bonding II. Topics in Current Chemistry, ed. P. Metrangolo and G. Resnati,
Springer International Publishing, Cham, 2014, vol. 359, pp. 115–146.
[5] Bolton, O.; Lee, K.; Kim, H.-J.; Lin, K. Y.; Kim, J., Activating efficient phosphorescence from purely organic
materials by crystal design. Nature Chemistry 2011, 3 (3), 205-210.
[6] Shi, H.; An, Z.; Li, P.-Z.; Yin, J.; Xing, G.; He, T.; Chen, H.; Wang, J.; Sun, H.; Huang, W.; Zhao, Y., Enhancing
Organic Phosphorescence by Manipulating Heavy-Atom Interaction. Crystal Growth & Design 2016, 16 (2),
808-813.
[7] McRae, E. G.; Kasha, M., Enhancement of Phosphorescence Ability upon Aggregation of Dye Molecules.
The Journal of Chemical Physics 1958, 28 (4), 721-722.
[8] Kasha, M.; Rawls, H. R.; El-Bayoumi, M. A., The exciton model in molecular spectroscopy. Pure and Applied
Chemistry 1965, 11 (3-4), 371-392.
[9] Levinson, G. S.; Simpson, W. T.; Curtis, W., Electronic Spectra of Pyridocyanine Dyes with Assignments of
Transitions1. Journal of the American Chemical Society 1957, 79 (16), 4314-4320.
[10] Sun, C.; Ran, X.; Wang, X.; Cheng, Z.; Wu, Q.; Cai, S.; Gu, L.; Gan, N.; Shi, H.; An, Z.; Shi, H.; Huang, W.,
Twisted Molecular Structure on Tuning Ultralong Organic Phosphorescence. The Journal of Physical
Chemistry Letters 2018, 9 (2), 335-339.
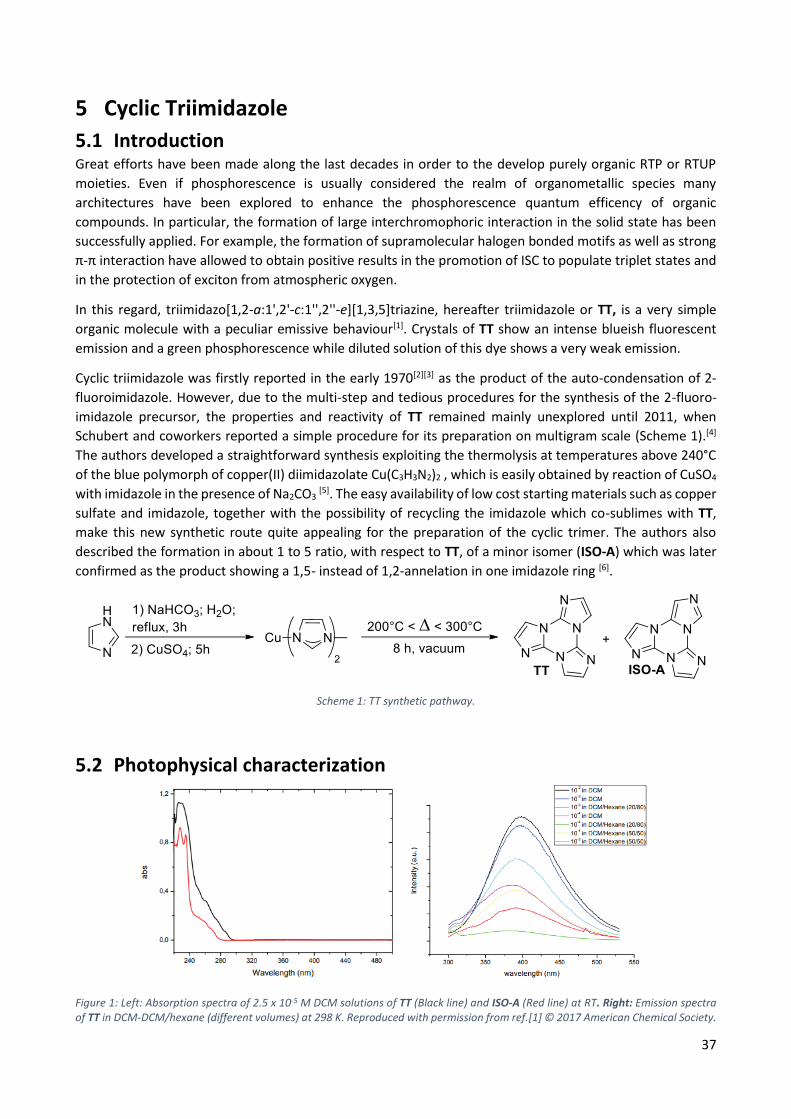
37
5 Cyclic Triimidazole
5.1 Introduction Great efforts have been made along the last decades in order to the develop purely organic RTP or RTUP
moieties. Even if phosphorescence is usually considered the realm of organometallic species many
architectures have been explored to enhance the phosphorescence quantum efficency of organic
compounds. In particular, the formation of large interchromophoric interaction in the solid state has been
successfully applied. For example, the formation of supramolecular halogen bonded motifs as well as strong
π-π interaction have allowed to obtain positive results in the promotion of ISC to populate triplet states and
in the protection of exciton from atmospheric oxygen.
In this regard, triimidazo[1,2-a:1',2'-c:1'',2''-e][1,3,5]triazine, hereafter triimidazole or TT, is a very simple
organic molecule with a peculiar emissive behaviour[1]. Crystals of TT show an intense blueish fluorescent
emission and a green phosphorescence while diluted solution of this dye shows a very weak emission.
Cyclic triimidazole was firstly reported in the early 1970[2][3] as the product of the auto-condensation of 2-
fluoroimidazole. However, due to the multi-step and tedious procedures for the synthesis of the 2-fluoro-
imidazole precursor, the properties and reactivity of TT remained mainly unexplored until 2011, when
Schubert and coworkers reported a simple procedure for its preparation on multigram scale (Scheme 1).[4]
The authors developed a straightforward synthesis exploiting the thermolysis at temperatures above 240°C
of the blue polymorph of copper(II) diimidazolate Cu(C3H3N2)2 , which is easily obtained by reaction of CuSO4
with imidazole in the presence of Na2CO3 [5]. The easy availability of low cost starting materials such as copper
sulfate and imidazole, together with the possibility of recycling the imidazole which co-sublimes with TT,
make this new synthetic route quite appealing for the preparation of the cyclic trimer. The authors also
described the formation in about 1 to 5 ratio, with respect to TT, of a minor isomer (ISO-A) which was later
confirmed as the product showing a 1,5- instead of 1,2-annelation in one imidazole ring [6].
Scheme 1: TT synthetic pathway.
5.2 Photophysical characterization
Figure 1: Left: Absorption spectra of 2.5 x 10⁻⁵ M DCM solutions of TT (Black line) and ISO-A (Red line) at RT. Right: Emission spectra of TT in DCM-DCM/hexane (different volumes) at 298 K. Reproduced with permission from ref.[1] © 2017 American Chemical Society.

38
TT shows an absorption band at 230 nm (Figure 1 left) and a weak emission at 390 nm in solution (10-4- 10-5
M DCM) with Ф equal to only 2% (Figure 1 right). Only forcing the aggregation with the addition of a non-
solvent (hexane or pentane 50/50 v/v) it is possible to observe a slightly intensification of the emission (Figure
1 right).
Similarly, increasing the concentration of the DCM solution to 10-2 M, the emission (400 nm; τav= 7.09 ns) is
intensified and an additional weak absorption band appears at 345 nm.
Surprisingly, by lowering the temperature to 77 K, the 10-2 M DCM solution of TT shows an additional broader
band centered at 435 nm that is the result of the overlap of the fast component observed even at RT at 400
nm (τav= 14.31 ns) with an ultralong component centered at 500 nm (τav= 926.76 ms) (Figure 2).
Figure 2: Emission spectra of TT in DCM (10-2 M) at 77 K recorded at different time delays (λexc=350 nm). Reproduced with permission from ref.[1] © 2017 American Chemical Society.
The remarkably long luminescence visible for highly concentrated solution at 77 K is also present in TT
powders that show an intense blue emission under the UV lamp that switches to a fading green when the
lamp is turned off.
Figure 3: (a) Photoluminescence of the DCM solution (10−2 M, λexc = 350 nm) at 77 K (blue dotted line). Photoluminescence (black line, λexc = 330 nm) and phosphorescence (red line, time delay = 172 ms, λexc = 374 nm) of powders at 298 K. Pictures of powders at
77 K with UV on (b) and off (c). Reproduced with permission from ref.[1] © 2017 American Chemical Society.
Powders of TT obtained through rapid evaporation of a DCM solution show a broad band centered at 425
(τav= 9.88 ns) nm at RT (Ф = 18%) when excited at 350 nm (Figure 3). Time-resolved experiment revealed the

39
presence of a prompt component overlaying to a ultralong emission centered at 520 nm (τav= 555.10 ms)
(Figure 4).
Figure 4: Emission spectra of TT (powder) at 298 K recorded at different time delays (λexc=374 nm). Reproduced with permission from ref.[1] © 2017 American Chemical Society.
At 77 K no additional emissions are detected, with the prompt component at 430 nm (τav= 12.31 ns) and the
green component, which is strongly intensified and elongated lasting for almost 3.6 s, at 525 nm (τav= 963.15
ms) (Figure 5). Moreover, no significant differences are noticed when the sample is exposed to nitrogen
indicating an inertness of the triplet to oxygen.
Figure 5: Emission spectra of TT (powder) at 77 K recorded at different time delays (λexc = 374 nm). Reproduced with permission from ref.[1] © 2017 American Chemical Society.
However, the photophysical behaviour seems to be sensitive to the crystallinity grade of the sample. Crystals
of TT (obtained by slow evaporation of a DCM solution, Ф = 30%) display vibronic components in both the
prompt (400 and 424 nm) and the delayed (525 and 570 nm) emissions. The vibronic components of these

40
two emissions are lost when the sample is ground and in parallel the Ф decreases to 22% revealing a
mechanochromic behaviour[7][8][9].
The exposure to unpolarised UV light of a single crystal of TT determines an emission polarized orthogonally
to the long axis of the crystal indicating that the transition dipole is orthogonal to this axis. The crystal
surfaces display bright emission due to wave-guiding effects (Figure 6).
Figure 6: Microscopy images of a part of a TT crystal under unpolarized UV light taken with an analyzer with the transmission axis horizontal (a), vertical (b), and under white light (c). Images of a smaller crystal under unpolarized UV light taken with the analyzer
with the transmission axis vertical (d) and horizontal (e). White bars are 30 μm long. Reproduced with permission from ref.[1] © 2017 American Chemical Society.
5.3 Crystalline structure-emission relation The X-ray crystal structure evidences that TT molecules are slightly distorted with respect to an ideal D3h
symmetry. Weak C-Hּּּּ ּּּ ּּּּN hydrogen bonds connect molecules along planar rows, connected through other C-
Hּּּּ ּּּ ּּּּN hydrogen bonds to form approximated sheets. Along the third axis molecules of TT stack in face-to-face
antiparallel-packed zigzag columns with distances between average molecular planes alternately equal to
3.204 and 3.290 Å and corresponding distances between centroids of the central rings equal to 3.95 and 3.73
Å, respectively (Figure 7).
Figure 7: Fragment of crystal packing of TT showing the key intermolecular distances and the angles between the transition moment dipoles (red arrows) and the axis through the centroids of the triazinic rings (purple circles). Reproduced with permission from ref.[1]
© 2017 American Chemical Society.
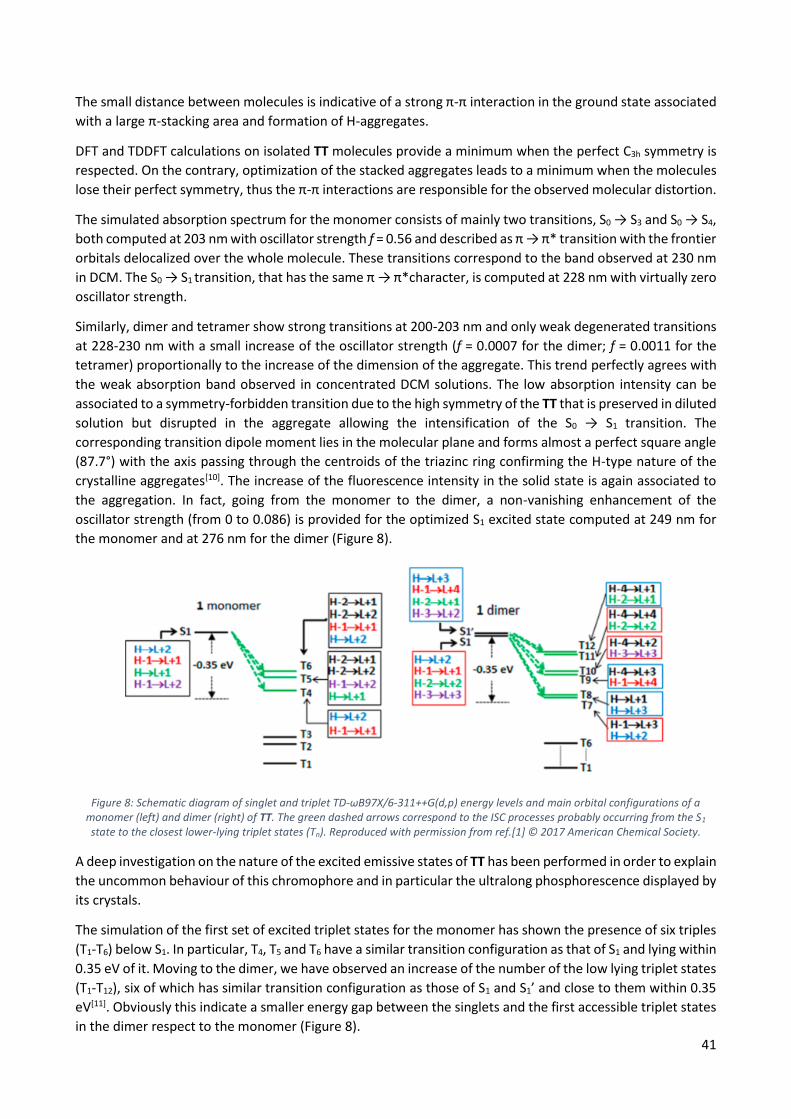
41
The small distance between molecules is indicative of a strong π-π interaction in the ground state associated
with a large π-stacking area and formation of H-aggregates.
DFT and TDDFT calculations on isolated TT molecules provide a minimum when the perfect C3h symmetry is
respected. On the contrary, optimization of the stacked aggregates leads to a minimum when the molecules
lose their perfect symmetry, thus the π-π interactions are responsible for the observed molecular distortion.
The simulated absorption spectrum for the monomer consists of mainly two transitions, S0 → S3 and S0 → S4,
both computed at 203 nm with oscillator strength f = 0.56 and described as π → π* transition with the frontier
orbitals delocalized over the whole molecule. These transitions correspond to the band observed at 230 nm
in DCM. The S0 → S1 transition, that has the same π → π*character, is computed at 228 nm with virtually zero
oscillator strength.
Similarly, dimer and tetramer show strong transitions at 200-203 nm and only weak degenerated transitions
at 228-230 nm with a small increase of the oscillator strength (f = 0.0007 for the dimer; f = 0.0011 for the
tetramer) proportionally to the increase of the dimension of the aggregate. This trend perfectly agrees with
the weak absorption band observed in concentrated DCM solutions. The low absorption intensity can be
associated to a symmetry-forbidden transition due to the high symmetry of the TT that is preserved in diluted
solution but disrupted in the aggregate allowing the intensification of the S0 → S1 transition. The
corresponding transition dipole moment lies in the molecular plane and forms almost a perfect square angle
(87.7°) with the axis passing through the centroids of the triazinc ring confirming the H-type nature of the
crystalline aggregates[10]. The increase of the fluorescence intensity in the solid state is again associated to
the aggregation. In fact, going from the monomer to the dimer, a non-vanishing enhancement of the
oscillator strength (from 0 to 0.086) is provided for the optimized S1 excited state computed at 249 nm for
the monomer and at 276 nm for the dimer (Figure 8).
Figure 8: Schematic diagram of singlet and triplet TD-ωB97X/6-311++G(d,p) energy levels and main orbital configurations of a monomer (left) and dimer (right) of TT. The green dashed arrows correspond to the ISC processes probably occurring from the S1 state to the closest lower-lying triplet states (Tn). Reproduced with permission from ref.[1] © 2017 American Chemical Society.
A deep investigation on the nature of the excited emissive states of TT has been performed in order to explain
the uncommon behaviour of this chromophore and in particular the ultralong phosphorescence displayed by
its crystals.
The simulation of the first set of excited triplet states for the monomer has shown the presence of six triples
(T1-T6) below S1. In particular, T4, T5 and T6 have a similar transition configuration as that of S1 and lying within
0.35 eV of it. Moving to the dimer, we have observed an increase of the number of the low lying triplet states
(T1-T12), six of which has similar transition configuration as those of S1 and S1’ and close to them within 0.35
eV[11]. Obviously this indicate a smaller energy gap between the singlets and the first accessible triplet states
in the dimer respect to the monomer (Figure 8).

42
As previously explained in Chapter 4, the reduction of the S-T energy gap promotes the ISC allowing an
efficient population of the triplet states. In parallel, the (π;π*) nature of the emitting triplet state, which has
a poor spin-orbit coupling, provides an efficient stabilization of the triplet exciton elongating the decay time.
5.4 Conclusion In conclusion, this very simple organic molecule, TT, displays crystallization-induced and mechanochromic
emissive behavior, together with visible ultralong luminescence (1 s) at ambient conditions associated with
H-aggregation. The TT uncommon features open up even to an intensive study of the possible structural
modification of this scaffold in view of tuning its properties and deeply explore its potentiality as smart or
functional material.
43
5.5 References [1] Lucenti, E.; Forni, A.; Botta, C.; Carlucci, L.; Giannini, C.; Marinotto, D.; Previtali, A.; Righetto, S.; Cariati, E.,
H-Aggregates Granting Crystallization-Induced Emissive Behavior and Ultralong Phosphorescence from a
Pure Organic Molecule. The Journal of Physical Chemistry Letters 2017, 8 (8), 1894-1898.
[2] Kirk, K. L.; Nagai, W.; Cohen, L. A., Photochemistry of diazonium salts. II. Synthesis of 2-fluoro-L-histidine
and 2-fluorohistamine, and the halogen lability of 2-fluoroimidazoles. Journal of the American Chemical
Society 1973, 95 (25), 8389-8392.
[3] Takeuchi, Y.; Kirk, K. L.; Cohen, L. A., Imidazole cyclotrimers (trimidazoles), a novel heteroannular series.
The Journal of Organic Chemistry 1979, 44 (24), 4243-4246.
[4] Schubert, D. M.; Natan, D. T.; Wilson, D. C.; Hardcastle, K. I., Facile Synthesis and Structures of Cyclic
Triimidazole and Its Boric Acid Adduct. Crystal Growth & Design 2011, 11 (3), 843-850.
[5] Masciocchi, N.; Bruni, S.; Cariati, E.; Cariati, F.; Galli, S.; Sironi, A., Extended Polymorphism in Copper(II)
Imidazolate Polymers: A Spectroscopic and XRPD Structural Study. Inorganic Chemistry 2001, 40 (23), 5897-
5905
[6] Buck, D. M.; Kunz, D., Triazine Annelated NHC Featuring Unprecedented Coordination Versatility.
Organometallics 2015, 34 (21), 5335-5340.
[7] Cariati, E.; Lanzeni, V.; Tordin, E.; Ugo, R.; Botta, C.; Giacometti Schieroni, A.; Sironi, A.; Pasini, D., Efficient
crystallization induced emissive materials based on a simple push–pull molecular structure. Physical
Chemistry Chemical Physics 2011, 13 (40), 18005-18014.
[8] Botta, C.; Benedini, S.; Carlucci, L.; Forni, A.; Marinotto, D.; Nitti, A.; Pasini, D.; Righetto, S.; Cariati, E.,
Polymorphism-dependent aggregation induced emission of a push–pull dye and its multi-stimuli responsive
behavior. Journal of Materials Chemistry C 2016, 4 (14), 2979-2989.
[9] Li, C.; Tang, X.; Zhang, L.; Li, C.; Liu, Z.; Bo, Z.; Dong, Y. Q.; Tian, Y.-H.; Dong, Y.; Tang, B. Z., Reversible
Luminescence Switching of an Organic Solid: Controllable On–Off Persistent Room Temperature
Phosphorescence and Stimulated Multiple Fluorescence Conversion. Advanced Optical Materials 2015, 3 (9),
1184-1190.
[10] Kasha, M.; Rawls, H. R.; El-Bayoumi, M. A., The exciton model in molecular spectroscopy. Pure and
Applied Chemistry 1965, 11 (3-4), 371-392.
[11] Englman, R.; Jortner, J., The energy gap law for radiationless transitions in large molecules. Molecular
Physics 1970, 18 (2), 145-164.
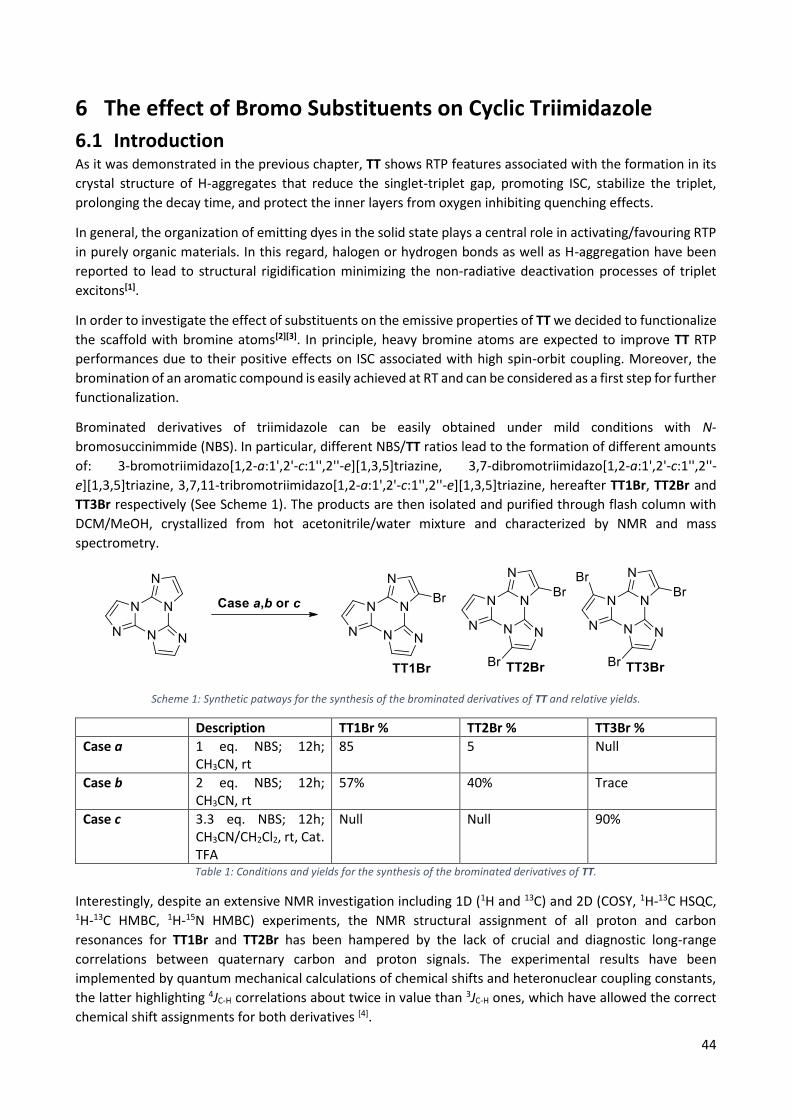
44
6 The effect of Bromo Substituents on Cyclic Triimidazole
6.1 Introduction As it was demonstrated in the previous chapter, TT shows RTP features associated with the formation in its
crystal structure of H-aggregates that reduce the singlet-triplet gap, promoting ISC, stabilize the triplet,
prolonging the decay time, and protect the inner layers from oxygen inhibiting quenching effects.
In general, the organization of emitting dyes in the solid state plays a central role in activating/favouring RTP
in purely organic materials. In this regard, halogen or hydrogen bonds as well as H-aggregation have been
reported to lead to structural rigidification minimizing the non-radiative deactivation processes of triplet
excitons[1].
In order to investigate the effect of substituents on the emissive properties of TT we decided to functionalize
the scaffold with bromine atoms[2][3]. In principle, heavy bromine atoms are expected to improve TT RTP
performances due to their positive effects on ISC associated with high spin-orbit coupling. Moreover, the
bromination of an aromatic compound is easily achieved at RT and can be considered as a first step for further
functionalization.
Brominated derivatives of triimidazole can be easily obtained under mild conditions with N-
bromosuccinimmide (NBS). In particular, different NBS/TT ratios lead to the formation of different amounts
of: 3-bromotriimidazo[1,2-a:1',2'-c:1'',2''-e][1,3,5]triazine, 3,7-dibromotriimidazo[1,2-a:1',2'-c:1'',2''-
e][1,3,5]triazine, 3,7,11-tribromotriimidazo[1,2-a:1',2'-c:1'',2''-e][1,3,5]triazine, hereafter TT1Br, TT2Br and
TT3Br respectively (See Scheme 1). The products are then isolated and purified through flash column with
DCM/MeOH, crystallized from hot acetonitrile/water mixture and characterized by NMR and mass
spectrometry.
Scheme 1: Synthetic patways for the synthesis of the brominated derivatives of TT and relative yields.
Description TT1Br % TT2Br % TT3Br %
Case a 1 eq. NBS; 12h; CH3CN, rt
85 5 Null
Case b 2 eq. NBS; 12h; CH3CN, rt
57% 40% Trace
Case c 3.3 eq. NBS; 12h; CH3CN/CH2Cl2, rt, Cat. TFA
Null Null 90%
Table 1: Conditions and yields for the synthesis of the brominated derivatives of TT.
Interestingly, despite an extensive NMR investigation including 1D (1H and 13C) and 2D (COSY, 1H-13C HSQC, 1H-13C HMBC, 1H-15N HMBC) experiments, the NMR structural assignment of all proton and carbon
resonances for TT1Br and TT2Br has been hampered by the lack of crucial and diagnostic long-range
correlations between quaternary carbon and proton signals. The experimental results have been
implemented by quantum mechanical calculations of chemical shifts and heteronuclear coupling constants,
the latter highlighting 4JC-H correlations about twice in value than 3JC-H ones, which have allowed the correct
chemical shift assignments for both derivatives [4].

45
Moreover, an electrochemical investigation of the brominated derivatives on glassy carbon has revealed a
shift of the reduction peak toward more positive potentials with respect to TT, with the carbon-halogen bond
undergoing dissociative electron transfer with concerted mechanism. This result is quite interesting since
such pathway is usually observed in alkyl derivatives (for which the injection of an electron leads to a purely
dissociative state) while aromatic halides follow a stepwise mechanism (due to the presence of low lying
LUMO orbitals that stabilize the incoming electron). In addition, the electrocleavage of the C–X bond is only
slightly influenced by increasing the number of halogens when going from TT1Br to TT3Br. These findings
support the hypothesis that each imidazole unit in the cyclic trimer acts as an almost independent redox site,
with very poor heteroannular aromaticity [4].
6.2 Photophysical characterization and discussion
6.2.1 TT1Br Dilute solutions of TT1Br (2.5 X 10⁻⁵ - 5 X 10⁻⁶ M) in DCM display a very sharp and intense absorption band at
230 nm, with a shoulder at approximately 237 nm and a low-energy tail at about 250- 280 nm. A structured
emission was observed at 328 and 342 nm (τav = 0.38 ns, Ф = 3%) (See Figure 1b). At 77 K, upon excitation at
wavelengths > 300 nm, a very weak emission is observed at approximately 460 nm. However, a very intense
and broad Molecular Phosphorescence (MP) centered at 580 nm (τav = 256 μs) dominates the spectrum
obtained upon excitation below 280 nm. The lifetime of this phosphorescence is unaffected by the
presence/absence of O2 (See Figure 1b).
Figure 1: TT1Br a) Crystal packing: π-π stacking interactions and Br···N XB shown as yellow and green dotted lines, respectively. b) In DCM (2.5 X 10⁻⁵ - 5 X 10⁻⁶ M): top: absorption and emission (λexc=280 nm) at RT; bottom: excitation (black dotted line, λem =580 nm) and emission (red line, λexc =280 nm) at 77 K. c) Powders at RT: top: excitation (black dotted line, λem =363 nm) and emission (blue line, λexc =300 nm); bottom: excitation (green dashed line, λem =429 nm) and emission (red line, λexc =360 nm). d) Powders at 77 K: top: emission (green line, λexc =300 nm) and excitation (blue line, λem =363 nm; black dashed line, λem =492 nm); bottom: excitation (black dashed line, λem =580 nm) and emission (red line, λexc =280 nm). Reproduced with permission from ref.[2] © 2017 Wiley‐VCH
Verlag GmbH & Co.

46
Crystals of TT1Br, prepared from a hot CH3CN/H2O solution and manually selected using a microscope, when
excited at 300 nm at room temperature are characterized, similarly to its diluted solution, by a structured
emission at 326, 345, and 365 nm (τ < 1 ns, with Ф below the instrumental sensitivity). Moreover, an
additional fluorescence centered at approximately 426 nm is activated by exciting at 360 nm (τav = 4 ns) (See
Figure 1c). Upon lowering the temperature, similar features are observed for excitation above 300 nm, while
upon excitation at 280 nm, the spectrum is dominated by the MP at 575 nm (τav = 274 μs) (See Figure 1d).
TD-DFT calculations on TT1Br monomer provide an allowed S0 → S1 transition with π → π* character at 231
nm (f= 0.024) owing to the introduction of bromine which disrupts the perfect symmetry of the triimidazolic
scaffold. Stronger transitions are computed at 214, 208 and 204 nm (S0 → S3 f= 0.203; S0 → S4 f= 0.400; S0 →
S5 f= 0.524) in perfect agreement with the experimental spectrum. Calculations also provide an explanation
to the observed dual emission, in fact, the fluorescence detected at 326 nm in solution is an anti-Kasha
process Sm → S0 while the weak emission detected at 426 nm is a fluorescence S1 → S0 that is accessible only
when the S1 level is selectively populated. The origin of the 580 nm phosphorescence observed at 77 K both
in solution and in the solid state when exciting at high energy, below 280 nm, was disclosed through
theoretical calculations. An efficient ISC is expected to occur from a high energy Sn to a close Tn level with σ
→ σ* symmetry where the σ orbital is mainly delocalized on the bromine. No other phosphorescence is
detected, in particular, no ultralong component is present in the solid sample at RT or at 77 K. H-aggregates
are absent in the crystal structure of TT1Br where dimers with large distances between centroids (4.846 Å)
self-assembled through cyclic Br···N halogen-bonded motifs, interact through C-H···N hydrogen bonds along
the molecular plane and through C-H···π hydrogen bonds perpendicularly to the plane (See Figure 1a).
6.2.2 TT2Br Diluted DCM solution (2.5 x 10⁻⁵ M) of TT2Br displays an intense adsorption at 235 nm with a low-energy tail
at 250-280 nm and a hardly discernible emission at 380 nm with short decay time (τav = 3.48 ns) (See Figure
2b). At 77 K, similarly to TT1Br, a strong phosphorescence at 580 nm (τav = 265 μs) is observed by exciting at
high energy (See Figure 2b).
Crystals of TT2Br, prepared from a hot CH3CN/H2O solution and manually selected using a microscope, at RT
display a structured fluorescence with peaks at 395 nm, 419 nm and 443 nm (τav = 0.71 ns), a broad long-
lived component at 470 nm (τav = 1.25 ms), visible only in the delayed spectrum, and a structured RTUP at
553, 600 nm (τav = 49 ms) that is strongly affected by the crystallinity of the sample (See Figure 2c). At 77 K,
the molecular phosphorescence dominates the spectrum when the sample is irradiated at high energy (below
280 nm) while at lower energy a long lived component at 461, 484 nm (τav = 3.59 ms) and a structured
fluorescence at 409, 434 and 462 nm (τav = 4.51 ns) are overlapped (See Figure 2d). Unlike RTUP, the two
additional phosphorescent components are insensitive to the degree of crystallinity. To better understand
this aspect the analysis of high concentrated PMMA films (10% w/w) was performed. TT2Br/PMMA thin film
does not show any RTUP component while the long lived component at 480 nm is still visible in absence of
oxygen The molecular phosphorescent appears only at 200 K, overcoming the other component under 180
K. The analysis of the photophysical behaviour clearly indicates the presence of three different
phosphorescences whose attribution has required the support of theoretical calculations.
TD-DFT calculations provide two allowed transition (S0 → S1 f= 0.016 at 233 nm and S0 → S4 f= 0.067 at 215
nm) and two symmetry-forbidden transition (S0 → S2; S0 → S3) all with π → π* character. As in the case of
TT1Br, the 570 nm phosphorescence detected at 77 K in both solutions and powders is activated through
excitation below 280 nm for the presence of a Tn level with σ → σ* symmetry and Br character. Unlike TT1Br,
TT2Br display RTUP (T1H → S0) due to the presence of H-aggregates clearly visible from single crystal X-ray
diffraction analysis. Moreover, the crystal structure shows the presence of tetrameric structure bonded
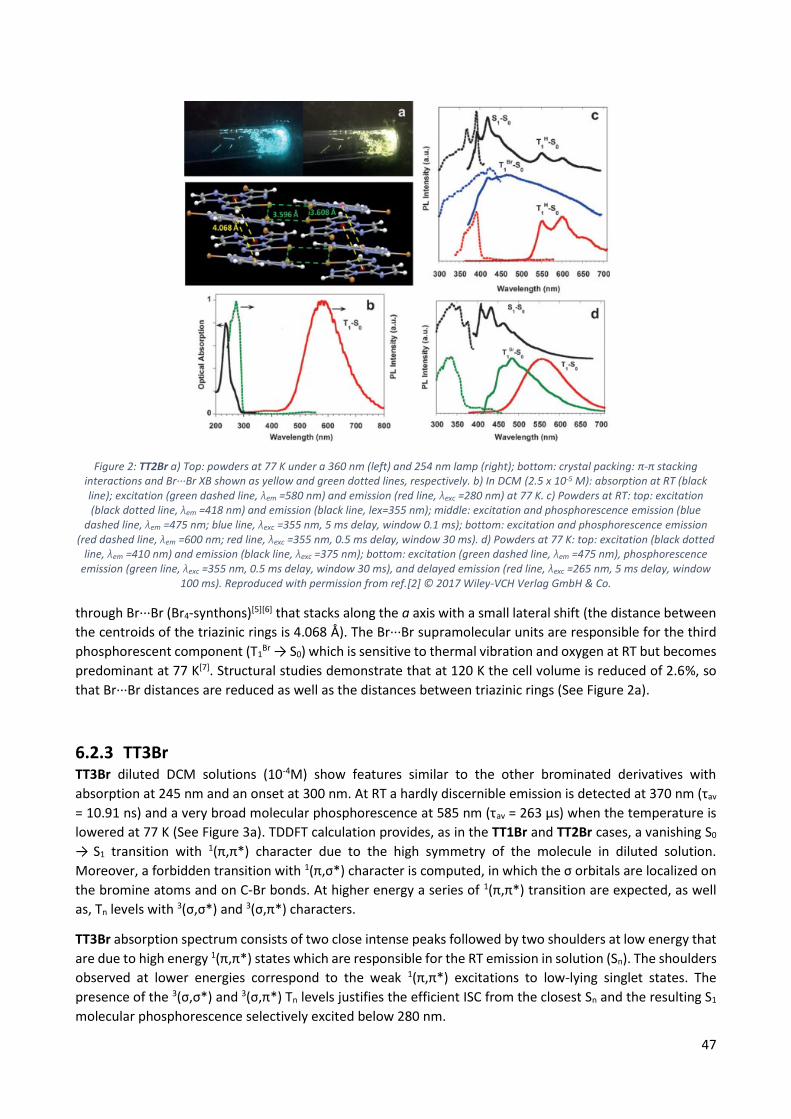
47
Figure 2: TT2Br a) Top: powders at 77 K under a 360 nm (left) and 254 nm lamp (right); bottom: crystal packing: π-π stacking interactions and Br···Br XB shown as yellow and green dotted lines, respectively. b) In DCM (2.5 x 10⁻⁵ M): absorption at RT (black line); excitation (green dashed line, λem =580 nm) and emission (red line, λexc =280 nm) at 77 K. c) Powders at RT: top: excitation (black dotted line, λem =418 nm) and emission (black line, lex=355 nm); middle: excitation and phosphorescence emission (blue
dashed line, λem =475 nm; blue line, λexc =355 nm, 5 ms delay, window 0.1 ms); bottom: excitation and phosphorescence emission (red dashed line, λem =600 nm; red line, λexc =355 nm, 0.5 ms delay, window 30 ms). d) Powders at 77 K: top: excitation (black dotted
line, λem =410 nm) and emission (black line, λexc =375 nm); bottom: excitation (green dashed line, λem =475 nm), phosphorescence emission (green line, λexc =355 nm, 0.5 ms delay, window 30 ms), and delayed emission (red line, λexc =265 nm, 5 ms delay, window
100 ms). Reproduced with permission from ref.[2] © 2017 Wiley‐VCH Verlag GmbH & Co.
through Br···Br (Br4-synthons)[5][6] that stacks along the a axis with a small lateral shift (the distance between
the centroids of the triazinic rings is 4.068 Å). The Br···Br supramolecular units are responsible for the third
phosphorescent component (T1Br → S0) which is sensitive to thermal vibration and oxygen at RT but becomes
predominant at 77 K[7]. Structural studies demonstrate that at 120 K the cell volume is reduced of 2.6%, so
that Br···Br distances are reduced as well as the distances between triazinic rings (See Figure 2a).
6.2.3 TT3Br TT3Br diluted DCM solutions (10-4M) show features similar to the other brominated derivatives with
absorption at 245 nm and an onset at 300 nm. At RT a hardly discernible emission is detected at 370 nm (τav
= 10.91 ns) and a very broad molecular phosphorescence at 585 nm (τav = 263 μs) when the temperature is
lowered at 77 K (See Figure 3a). TDDFT calculation provides, as in the TT1Br and TT2Br cases, a vanishing S0
→ S1 transition with 1(π,π*) character due to the high symmetry of the molecule in diluted solution.
Moreover, a forbidden transition with 1(π,σ*) character is computed, in which the σ orbitals are localized on
the bromine atoms and on C-Br bonds. At higher energy a series of 1(π,π*) transition are expected, as well
as, Tn levels with 3(σ,σ*) and 3(σ,π*) characters.
TT3Br absorption spectrum consists of two close intense peaks followed by two shoulders at low energy that
are due to high energy 1(π,π*) states which are responsible for the RT emission in solution (Sn). The shoulders
observed at lower energies correspond to the weak 1(π,π*) excitations to low-lying singlet states. The
presence of the 3(σ,σ*) and 3(σ,π*) Tn levels justifies the efficient ISC from the closest Sn and the resulting S1
molecular phosphorescence selectively excited below 280 nm.

48
Figure 3: TT3Br a)Absorption (black line) of TT3Br in DCM (10-4 M) at RT. Emission (λexc =280 nm; red solid line) and excitation profile at 77 K (λem =580 nm; red dotted line). b) Powders at RT. Top: Prompt emission (λexc =280 nm, red solid line; λexc =340 nm, blue solid
line) and excitation profile (λem =420 nm, dashed blue line). Bottom: Delayed emission (λexc =340 nm, 1 ms delay, window 50 ms; black solid line) and excitation profile (λem =550 nm, dotted black line). c) Powders at 77 K. Top: Prompt emission (λexc =280 nm, red solid line; λexc =340 nm, blue solid line; λexc =385 nm, green solid line) and excitation profile (λem =420 nm, dotted blue line). Bottom:
Delayed emission (λexc =360 nm, 100 ms delay, window 500 ms, red solid line; λexc =385 nm, 100 ms delay, window 500 ms, green solid line; λexc =385 nm, 5 ms delay, window 10 ms, black solid line) and excitation profiles (λem=523 nm, dotted green line; λem =600
nm, dotted red line). Reproduced with permission from ref.[3] © 2018 Wiley‐VCH Verlag GmbH & Co.
Crystals of TT3Br, obtained by slow cooling of a hot CH3CN solution and manually selected using a
microscope, at RT display a structured fluorescence at 415 nm and 437 nm (τav = 1.02 ns) when excited at 280
nm. At longer wavelength excitation an additional peak appears at 394 nm together with a lower energy
phosphorescence at 555, 605 and 656 nm (τav = 18.42 ms) (See Figure 3b). At 77 K the emission becomes
even more intricate. As in the frozen solution, the molecular phosphorescence (590 nm; τav = 200 μs)
dominates the spectrum exciting at 280 nm, while the blue structured fluorescence at 414 and 440 nm is still
present. When exciting at 340 nm the structured fluorescence at 392, 417, 440 nm (τav = 1.51 ns) is
superimposed to a broad phosphorescence (τav = 18.11 ms) which becomes sharper exciting at 385 nm (See
Figure 3c). As for TT2Br, the presence of three different long-lasting emission requires additional
investigation to better understand the behaviour. Time gated experiments have revealed that with short
delay times (100-600 μs) the broad molecular phosphorescence is easily recognizable exciting at 360 nm,
while exciting at 385 nm a broad phosphorescence at 490 nm is observed. When longer delay times (>5 ms)
are used it is possible to isolate the structured phosphorescence already observed at RT.
TT3Br crystallizes with two independent molecules in the asymmetric unit. The crystal packing of the flat and
symmetric molecules is sustained by different intermolecular interactions Br···Br and Br···N, weak C-H···N, π-
π stacking and many van der Waals contacts. Two different orientations are recognizable so that alternating
layers of parallel molecules extend in the ab directions and perpendicular to c. Molecules belonging to each
layer are involved in columnar π-π interactions characterized by triazinic centroids distances of 4.427, 4.759
and 4.838 Å.
Br···Br and Br···N XB interactions significantly shorter than the sum of vdW radii involve non-coplanar
molecules, except for two short Br···N interactions between coplanar adjacent molecules that give XB chain
motifs. The Br···N XB chains run along [1,1,0] and [1,1,0] directions with a relative inclination of about 50°.
Furthermore, adjacent 1D chains are bonded by short Br···Br XBs to give layered motifs that pack along c with
an ABAB sequence. Considering the additional relatively long Br···Br contact, such layered motif evidences
the presence of a trimeric Br3 XB unit with C-Br···Br angles from 154.8 to 171.5°, in agreement with a type II
X···X geometrical arrangement of the X atoms. These layers are further connected by short Br···N interactions
to give a 3D supramolecular array. Additional Br···Br (3.77–4.20 Å range) and Br···N (3.42–3.57 Å range)
interactions longer than the sum of VdW radii are also present (See Figure 4).
DFT optimization of π-π dimeric units of TT3Br results in a geometry quite similar to the X-ray one with
distances between triazinic centroids equal to 4.254 Å (calculated) and 4.4266 Å (measured), associated with

49
strong π-π interactions that are also responsible for the red shift observed between the fluorescence
observed in solution and in the solid state. The dual fluorescence observed in the solid state should be
ascribed to the high energy gap between the strong high energy singlet excitation and the weak S0-S1. The
latter is intensified in the solid state owning to the distortion caused by the packing forces.
Figure 4: Top: view of the packing along the c-axis in TT3Br. Two adjacent molecular layers extending parallel to ab are shown in red and blue. π -π interactions appear as green lines connecting triazine centroids: 4.4266(4) (a), 4.7591(5) (b) and 4.8385(5) A˚ (c).
Bottom: The trimeric unit assembled through Br···Br and Br···N XBs. Br···N interactions f and g, 3.1344(3) and 3.1545(3) A˚ respectively, give 1D chains; Br···Br interactions d and e, 3.5405(3) and 3.6746(3) A˚ respectively, give layers; Br···N XB h, 3.0099(3) A˚, extend to 3D; Br···Br contact i, 4.1963(14) A˚. Reproduced with permission from ref.[2] © 2018 Wiley‐VCH Verlag GmbH & Co.
On the other side, geometry optimization of the Br3 unit leads to a coplanar structure with two short (3.702
and 3.751 Å) and one long (3.990 Å) Br···Br distances. The TDDFT computed levels include a 3(π, σ*) state
close in energy to a 1(π,π*) one suggesting that efficient spin-orbit coupling may occur between the two
states allowing T1Br phosphorescence. This triplet is the only one involving excitation towards σ* orbitals
mainly delocalized on the three Br atoms supporting the role of the Br3 unit in the intermolecular electronic
coupling[8]. However, the planarity of the optimized fragment suggests reduced stability associated with the
Br3 motif in the crystal. This could justify the lack of emission from T1Br at RT and the fact that the ultralong
phosphorescence due to H-aggregation is observed also at 77 K.
6.3 Conclusion In conclusion, a comprehensive investigation on the photophysical behaviour of TT brominated derivatives
has deepen the knowledge on the heavy halogen effect. Multiple radiative deactivation processes have been
disclosed for these new three excitation-dependent dyes. Unfortunately, the low quantum yields showed by
TT1Br and TT3Br could negatively affect their possible use in the development of new optoelectronic devices.
However, as it will be shown in the following chapters, the introduction of halogen has opened up to further
modification and to the preparation of even more interesting dyes.

50
6.4 References [1] Forni, A.; Lucenti, E.; Botta, C.; Cariati, E., Metal free room temperature phosphorescence from molecular
self-interactions in the solid state. Journal of Materials Chemistry C 2018, 6 (17), 4603-4626.
[2] Lucenti, E.; Forni, A.; Botta, C.; Carlucci, L.; Giannini, C.; Marinotto, D.; Pavanello, A.; Previtali, A.; Righetto,
S.; Cariati, E., Cyclic Triimidazole Derivatives: Intriguing Examples of Multiple Emissions and Ultralong
Phosphorescence at Room Temperature. Angewandte Chemie International Edition 2017, 56 (51), 16302-
16307.
[3] Lucenti, E.; Forni, A.; Botta, C.; Carlucci, L.; Colombo, A.; Giannini, C.; Marinotto, D.; Previtali, A.; Righetto,
S.; Cariati, E., The Effect of Bromo Substituents on the Multifaceted Emissive and Crystal-Packing Features of
Cyclic Triimidazole Derivatives. ChemPhotoChem 2018, 2 (9), 801-805.
[4] Di Micco, S.; Giannini, C.; Previtali, A.; Lucenti, E.; Bifulco, G., Chemical shift assignment of mono- and di-
bromo triimidazo[1,2-a:1′,2′-c:1″,2″-e][1,3,5]triazine derivatives by DFT/NMR integrated approach. Magnetic
Resonance in Chemistry 2019, 57 (2-3), 82-92.
[5] Clark, T.; Hennemann, M.; Murray, J. S.; Politzer, P., Halogen bonding: the σ-hole. Journal of Molecular
Modeling 2007, 13 (2), 291-296.
[6] Shi, H.; An, Z.; Li, P.-Z.; Yin, J.; Xing, G.; He, T.; Chen, H.; Wang, J.; Sun, H.; Huang, W.; Zhao, Y., Enhancing
Organic Phosphorescence by Manipulating Heavy-Atom Interaction. Crystal Growth & Design 2016, 16 (2),
808-813.
[7] Mukherjee, A.; Tothadi, S.; Desiraju, G. R., Halogen Bonds in Crystal Engineering: Like Hydrogen Bonds yet
Different. Accounts of Chemical Research 2014, 47 (8), 2514-2524.
[8] Yang, Z.; Mao, Z.; Zhang, X.; Ou, D.; Mu, Y.; Zhang, Y.; Zhao, C.; Liu, S.; Chi, Z.; Xu, J.; Wu, Y.-C.; Lu, P.-Y.;
Lien, A.; Bryce, M. R., Intermolecular Electronic Coupling of Organic Units for Efficient Persistent Room-
Temperature Phosphorescence. Angewandte Chemie International Edition 2016, 55 (6), 2181-2185.

51
7 Iodine introduction on the triimidazole scaffold: Intrinsic vs
Extrinsic effect.
7.1 Introduction The introduction of heavy halogen atoms (like Br or I)[1] in the molecular structure (intrinsic effect) or the
formation of intramolecular interactions based on halogen bonding (extrinsic effect) [2][3][4], with molecules of
the same type (one component)[5][6][7][8] or with molecules of a different type (two components)[9][10][11][12],
can effectively modulate the emissive properties of a chromophore providing an efficient strategy for the
preparation of functional materials.
The wide range of possible halogen bonds (XB) patterns can produce various effects either on fluorescence
and phosphorescence, as previously demonstrated by the brominated derivatives of TT, which displays an
extrinsic one-component effect combined with an intrinsic one[13][14][15]. For example, TT2Br forms strong and
rigid Br4 XB intramolecular units that induces a long lived RTP which is absent in TT3Br where only weaker
and non-planar Br3 XB units are formed.
In order to better understand the extrinsic/intrinsic effects on the TT scaffold, the structural and emissive
properties of 3-iodiotriimidazo[1,2-a:1’,2’-c:1’’,2’’-e][1,3,5]triazine (TT1I), 3,7-diiodiotriimidazo[1,2-a:1’,2’-
c:1’’,2’’-e][1,3,5]triazine (TT2I) and TTCo, the 1:1 co-crystal self-assembled through I···N XB between two
acceptor nitrogen atoms of TT and the two iodine atoms of 1,4-diiodotetrafluorobenzene (DITFB) to form a
1D infinite chain structure, have been investigated. TT1I is an archetypal molecule to evaluate the intrinsic
halogen-atom effect and to run a comparative study with its brominated analogue (TT1Br). In parallel, TTCo
allows to isolate the extrinsic two-component effect and so, through a comparison with TT1I and TT, to draw
a complete picture of the heavy halogen role in the modulation of the photophysical properties. The
iodinated derivatives of triimidazole, similarly to the brominated ones, were prepared using N-
iodosuccinimmide (NIS) as iodinating agent in the presence of catalytic amount of TFA. By using different
TT/NIS ratios, different amounts of TT1I and TT2I were obtained. The crude products were purified through
flash chromatography using DCM/MeOH and crystallized from hot acetonitrile/water mixture.
Scheme 1: Synthetic pathways for the synthesis of the iodinated derivatives of TT.
Description TT1I % TT2I %
Case a 1 eq. NIS; 12h; CH3CN; Cat. TFA, rt
55% 15%
Case b 2 eq. NIS; 12h; CH3CN; Cat. TFA, rt
62% 27%
Table 1: Conditions and yields for the synthesis of the iodinated derivatives of TT.

52
7.2 Photophysical characterization and discussion
7.2.1 TT1I Solutions of TT1I in DCM (10-4 M) show an absorption band at about 240 nm but no emission is detected at
RT (Figure 1b). Only lowering the temperature to 77 K and exciting at 340 nm an unresolved emission is
detected at about 420 nm. When exciting at higher energy (below 300 nm) the spectrum is dominated by a
phosphorescence at 630 nm (τav= 27.27 ms)(Figure 1b). From a comparison between TT1I and the brominated
derivatives solutions some statements can be made. 1) The fluorescent emission of TT1I in diluted solutions
appears only at low temperature and it is compatible with an emission from S1, while in the bromo-derivatives
a fluorescent emission is observed even at RT and associated to an emission from high energy singlet. 2) The
molecular phosphorescence (MP) detected for TT1I is red shifted (almost 50 nm) compared to the
brominated derivatives ones. 3) The TT1I MP lifetime is 10 times shorter than the brominated derivatives
ones 4) Only TT1Br solutions display a non-null quantum yield while TT1I, TT2Br and TT3Br quantum yields
are under the instrument detection limit. Points 3) and 4) are reasonably explained by the enhanced heavy
atom effects of the iodine that increases the spin-orbit coupling promoting the ISC. The results of these two
processes are the quenching of the fluorescence and the speed up of the MP and so points number 1) and
2). Computational DFT (TDDFT) calculations provide a solid explanation for the MP. As for the bromo-
analogues, the presence of an high energy triplet state (T5) with 3(σ,σ*) close to a 1(π,π*) singlet state allows
an efficient SOC on this high energy levels. The 3(σ,σ*) level of TT1I is at lower energy with respect to TT1Br,
with a red-shifted emission as direct consequence.
Figure 1: a) Pictures of TT1I crystals under UV-light illumination at 298 K. b) TT1I in DCM (10-4 M): absorption spectrum at 298 K (black solid line); emission and excitation spectra at 77 K (λexc=280 nm, red dashed line; λem =648 nm, blue dotted line). c) Emission spectra of TT1I crystals at 298 K. Top: PL at λexc =300 nm (red dotted line), λexc =370 nm (black solid line), λexc =415 nm (blue dashed
line); bottom: phosphorescence spectrum (λexc =370 nm, delay 50 ms, window 200 ms, red solid line). d) Emission spectra of TT1I crystals at 77 K. Top: PL at λexc =320 nm (blue dotted line), λexc =370 nm (black solid line); bottom: phosphorescence spectra at λexc
=320 nm (delay 10 ms, window 50 ms, blue dotted line) and λexc =370 nm (delay 50 ms, window 200 ms, black solid line). Phosphorescence decays at λem =460 nm (λexc =320 nm, blue points) and λem =558 nm (λexc =370 nm, red points) with their three-exponential fits (black lines) shown in the inset. Reproduced with permission from ref.[1] © 2019 Wiley‐VCH Verlag GmbH & Co.
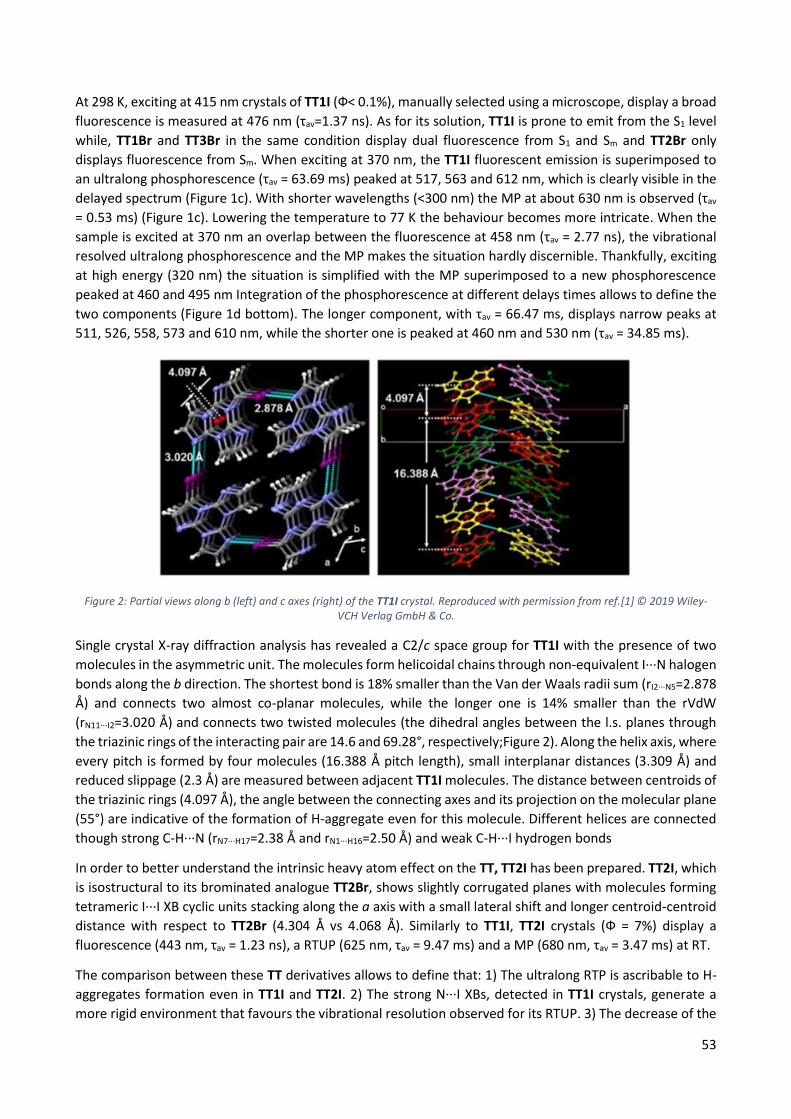
53
At 298 K, exciting at 415 nm crystals of TT1I (Ф< 0.1%), manually selected using a microscope, display a broad
fluorescence is measured at 476 nm (τav=1.37 ns). As for its solution, TT1I is prone to emit from the S1 level
while, TT1Br and TT3Br in the same condition display dual fluorescence from S1 and Sm and TT2Br only
displays fluorescence from Sm. When exciting at 370 nm, the TT1I fluorescent emission is superimposed to
an ultralong phosphorescence (τav = 63.69 ms) peaked at 517, 563 and 612 nm, which is clearly visible in the
delayed spectrum (Figure 1c). With shorter wavelengths (<300 nm) the MP at about 630 nm is observed (τav
= 0.53 ms) (Figure 1c). Lowering the temperature to 77 K the behaviour becomes more intricate. When the
sample is excited at 370 nm an overlap between the fluorescence at 458 nm (τav = 2.77 ns), the vibrational
resolved ultralong phosphorescence and the MP makes the situation hardly discernible. Thankfully, exciting
at high energy (320 nm) the situation is simplified with the MP superimposed to a new phosphorescence
peaked at 460 and 495 nm Integration of the phosphorescence at different delays times allows to define the
two components (Figure 1d bottom). The longer component, with τav = 66.47 ms, displays narrow peaks at
511, 526, 558, 573 and 610 nm, while the shorter one is peaked at 460 nm and 530 nm (τav = 34.85 ms).
Figure 2: Partial views along b (left) and c axes (right) of the TT1I crystal. Reproduced with permission from ref.[1] © 2019 Wiley‐VCH Verlag GmbH & Co.
Single crystal X-ray diffraction analysis has revealed a C2/c space group for TT1I with the presence of two
molecules in the asymmetric unit. The molecules form helicoidal chains through non-equivalent I···N halogen
bonds along the b direction. The shortest bond is 18% smaller than the Van der Waals radii sum (rI2···N5=2.878
Å) and connects two almost co-planar molecules, while the longer one is 14% smaller than the rVdW
(rN11···I2=3.020 Å) and connects two twisted molecules (the dihedral angles between the l.s. planes through
the triazinic rings of the interacting pair are 14.6 and 69.28°, respectively;Figure 2). Along the helix axis, where
every pitch is formed by four molecules (16.388 Å pitch length), small interplanar distances (3.309 Å) and
reduced slippage (2.3 Å) are measured between adjacent TT1I molecules. The distance between centroids of
the triazinic rings (4.097 Å), the angle between the connecting axes and its projection on the molecular plane
(55°) are indicative of the formation of H-aggregate even for this molecule. Different helices are connected
though strong C-H···N (rN7···H17=2.38 Å and rN1···H16=2.50 Å) and weak C-H···I hydrogen bonds
In order to better understand the intrinsic heavy atom effect on the TT, TT2I has been prepared. TT2I, which
is isostructural to its brominated analogue TT2Br, shows slightly corrugated planes with molecules forming
tetrameric I···I XB cyclic units stacking along the a axis with a small lateral shift and longer centroid-centroid
distance with respect to TT2Br (4.304 Å vs 4.068 Å). Similarly to TT1I, TT2I crystals (Ф = 7%) display a
fluorescence (443 nm, τav = 1.23 ns), a RTUP (625 nm, τav = 9.47 ms) and a MP (680 nm, τav = 3.47 ms) at RT.
The comparison between these TT derivatives allows to define that: 1) The ultralong RTP is ascribable to H-
aggregates formation even in TT1I and TT2I. 2) The strong N···I XBs, detected in TT1I crystals, generate a
more rigid environment that favours the vibrational resolution observed for its RTUP. 3) The decrease of the

54
RTUP decay time (TT (970 ms)>TT1I (64 ms)>TT2Br (29 ms)> TT3Br (18 ms)>TT2I (9 ms)) is a consequence of
the different strength of the H-aggregates and the presence of heavy atoms. 4) The formation of XB generates
a ms order phosphorescence that, differently from TT2Br and TT3Br, is present even at RT. Interestingly, a
similar phosphorescent emission is absent in TT1Br, showing in its structure only weaker Br···N XB (rBr···N =
3.006 Å, 12% shorter than the sum of van der Waals radii). 5) In agreement with the presence of the heavier
iodine atom on the molecule, the iodinated derivatives display at RT a MP which is much more intense than
the one observed for the brominated analogues that appears only at 77K. In addition, high energy
wavelengths are not required to observe the MP of TT1I that can be activated even populating S1 in the solid
sample.
7.2.2 TTCo Crystals of TTCo at 298 K (Ф = 5%) excited below 340 nm show a broad fluorescence with maximum at about
410 nm (τav = 2.56 ns) and phosphorescence bands at 496, 528 and 566 nm (τav = 21.48 ms). With higher
excitation wavelength even a structured long lasting component becomes visible and can be isolated with a
time gated experiment (Figure 3c). Lowering the temperature to 77K an additional phosphorescence appears
at 720 nm (τ = 6.83 ms) exciting at 300 nm. This latter emission is associate to the extrinsic heavy-atom effect
due to the presence of the iodine atom in the TT·DITFB dimer. In fact, DFT/TDDFT calculations provide 3(σ,σ*)
and 3(π,σ*) levels that, similarly to what observed for TT1I, promote the SOC from close singlet states of
different character. The lower efficiency of this process respect to TT1I allows to observe this “extrinsic MP”
only at low temperature. Exciting at lower energy a fluorescent emission at 440 nm (τav =3.41 ns) is
superimposed to two different phosphorescences, at 490, 527, 560 nm (τav =20.01 ms) and at 463, 497, 537
nm (τav = 14.65 ms), that are distinguishable using time-gated experiments (Figure 3e).
Figure 3: a,b) Images of TTCo crystals at 298 K with UV-light illumination on and off. c) Emission spectra of TTCo at 298 K. Top: PL at λexc=300 nm (blue line) and λexc =350 nm (black solid line); bottom: phosphorescence spectrum (λexc =350 nm, delay 0.5 ms, window 1 ms, red dashed line). d) Partial view of the crystal structure of TTCo showing columnar H-aggregates of TT along the a direction (centroids of the triazinic rings shown as red circles) interconnected through I···N XB (light-blue dashed lines) with DITFB to form infinite 1D zigzag chains. e) Emission spectra of TTCo crystals at 77 K. Top: PL at λexc =340 nm (black line), λexc =300 nm (red solid
line); bottom: phosphorescence spectra at λexc =320 nm (delay 10 ms, window 50 ms, blue dashed line) and λexc =370 nm (delay 10 ms, window 50 ms, red dotted line). Reproduced with permission from ref.[1] © 2019 Wiley‐VCH Verlag GmbH & Co.
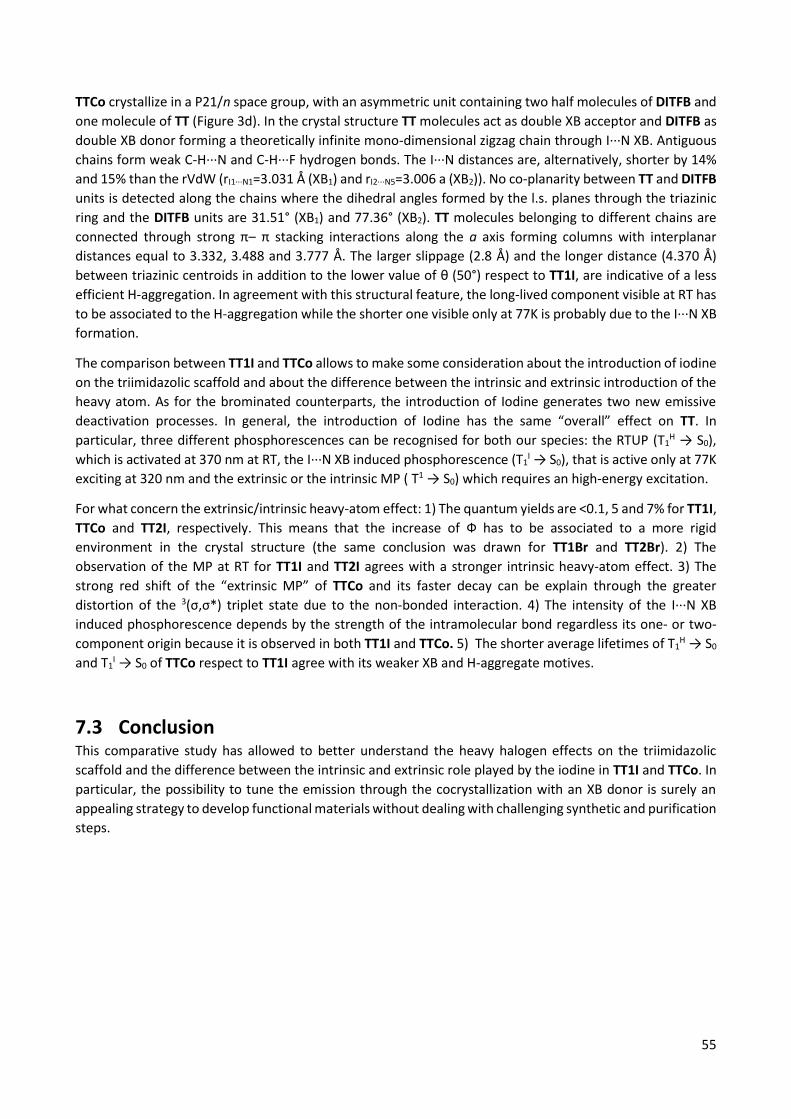
55
TTCo crystallize in a P21/n space group, with an asymmetric unit containing two half molecules of DITFB and
one molecule of TT (Figure 3d). In the crystal structure TT molecules act as double XB acceptor and DITFB as
double XB donor forming a theoretically infinite mono-dimensional zigzag chain through I···N XB. Antiguous
chains form weak C-H···N and C-H···F hydrogen bonds. The I···N distances are, alternatively, shorter by 14%
and 15% than the rVdW (rI1···N1=3.031 Å (XB1) and rI2···N5=3.006 a (XB2)). No co-planarity between TT and DITFB
units is detected along the chains where the dihedral angles formed by the l.s. planes through the triazinic
ring and the DITFB units are 31.51° (XB1) and 77.36° (XB2). TT molecules belonging to different chains are
connected through strong π– π stacking interactions along the a axis forming columns with interplanar
distances equal to 3.332, 3.488 and 3.777 Å. The larger slippage (2.8 Å) and the longer distance (4.370 Å)
between triazinic centroids in addition to the lower value of θ (50°) respect to TT1I, are indicative of a less
efficient H-aggregation. In agreement with this structural feature, the long-lived component visible at RT has
to be associated to the H-aggregation while the shorter one visible only at 77K is probably due to the I···N XB
formation.
The comparison between TT1I and TTCo allows to make some consideration about the introduction of iodine
on the triimidazolic scaffold and about the difference between the intrinsic and extrinsic introduction of the
heavy atom. As for the brominated counterparts, the introduction of Iodine generates two new emissive
deactivation processes. In general, the introduction of Iodine has the same “overall” effect on TT. In
particular, three different phosphorescences can be recognised for both our species: the RTUP (T1H → S0),
which is activated at 370 nm at RT, the I···N XB induced phosphorescence (T1I → S0), that is active only at 77K
exciting at 320 nm and the extrinsic or the intrinsic MP ( T1 → S0) which requires an high-energy excitation.
For what concern the extrinsic/intrinsic heavy-atom effect: 1) The quantum yields are <0.1, 5 and 7% for TT1I,
TTCo and TT2I, respectively. This means that the increase of Ф has to be associated to a more rigid
environment in the crystal structure (the same conclusion was drawn for TT1Br and TT2Br). 2) The
observation of the MP at RT for TT1I and TT2I agrees with a stronger intrinsic heavy-atom effect. 3) The
strong red shift of the “extrinsic MP” of TTCo and its faster decay can be explain through the greater
distortion of the 3(σ,σ*) triplet state due to the non-bonded interaction. 4) The intensity of the I···N XB
induced phosphorescence depends by the strength of the intramolecular bond regardless its one- or two-
component origin because it is observed in both TT1I and TTCo. 5) The shorter average lifetimes of T1H → S0
and T1I → S0 of TTCo respect to TT1I agree with its weaker XB and H-aggregate motives.
7.3 Conclusion This comparative study has allowed to better understand the heavy halogen effects on the triimidazolic
scaffold and the difference between the intrinsic and extrinsic role played by the iodine in TT1I and TTCo. In
particular, the possibility to tune the emission through the cocrystallization with an XB donor is surely an
appealing strategy to develop functional materials without dealing with challenging synthetic and purification
steps.

56
7.4 References [1] Lucenti, E.; Forni, A.; Botta, C.; Giannini, C.; Malpicci, D.; Marinotto, D.; Previtali, A.; Righetto, S.; Cariati,
E., Intrinsic and Extrinsic Heavy‐Atom Effects on the Multifaceted Emissive Behavior of Cyclic Triimidazole.
Chemistry – A European Journal 2019, 25 (10), 2452-2456.
[2] Sarkar, S.; Hendrickson, H. P.; Lee, D.; DeVine, F.; Jung, J.; Geva, E.; Kim, J.; Dunietz, B. D., Phosphorescence
in Bromobenzaldehyde Can Be Enhanced through Intramolecular Heavy Atom Effect. The Journal of Physical
Chemistry C 2017, 121 (7), 3771-3777.
[3] Yuan, W. Z.; Shen, X. Y.; Zhao, H.; Lam, J. W. Y.; Tang, L.; Lu, P.; Wang, C.; Liu, Y.; Wang, Z.; Zheng, Q.; Sun,
J. Z.; Ma, Y.; Tang, B. Z., Crystallization-Induced Phosphorescence of Pure Organic Luminogens at Room
Temperature. The Journal of Physical Chemistry C 2010, 114 (13), 6090-6099.
[4] Pan, S.; Chen, Z.; Zheng, X.; Wu, D.; Chen, G.; Xu, J.; Feng, H.; Qian, Z., Ultralong Room-Temperature
Phosphorescence from Supramolecular Behavior via Intermolecular Electronic Coupling in Pure Organic
Crystals. The Journal of Physical Chemistry Letters 2018, 9 (14), 3939-3945.
[5] Bolton, O.; Lee, K.; Kim, H.-J.; Lin, K. Y.; Kim, J., Activating efficient phosphorescence from purely organic
materials by crystal design. Nature Chemistry 2011, 3 (5), 415-415.
[6] Maity, S. K.; Bera, S.; Paikar, A.; Pramanik, A.; Haldar, D., Halogen bond induced phosphorescence of
capped γ-amino acid in the solid state. Chemical Communications 2013, 49 (79), 9051-9053.
[7] Shi, H.; An, Z.; Li, P.-Z.; Yin, J.; Xing, G.; He, T.; Chen, H.; Wang, J.; Sun, H.; Huang, W.; Zhao, Y., Enhancing
Organic Phosphorescence by Manipulating Heavy-Atom Interaction. Crystal Growth & Design 2016, 16 (2),
808-813.
[8] Sun, X.; Zhang, B.; Li, X.; Trindle, C. O.; Zhang, G., External Heavy-Atom Effect via Orbital Interactions
Revealed by Single-Crystal X-ray Diffraction. The Journal of Physical Chemistry A 2016, 120 (29), 5791-5797.
[9] Bolton, O.; Lee, D.; Jung, J.; Kim, J., Tuning the Photophysical Properties of Metal-Free Room Temperature
Organic Phosphors via Compositional Variations in Bromobenzaldehyde/Dibromobenzene Mixed Crystals.
Chemistry of Materials 2014, 26 (22), 6644-6649.
[10] Pang, X.; Wang, H.; Wang, W.; Jin, W. J., Phosphorescent π-Hole···π Bonding Cocrystals of Pyrene with
Halo-perfluorobenzenes (F, Cl, Br, I). Crystal Growth & Design 2015, 15 (10), 4938-4945.
[11] d’Agostino, S.; Spinelli, F.; Taddei, P.; Ventura, B.; Grepioni, F., Ultralong Organic Phosphorescence in the
Solid State: The Case of Triphenylene Cocrystals with Halo- and Dihalo-penta/tetrafluorobenzene. Crystal
Growth & Design 2019, 19 (1), 336-346.
[12] Li, C.; Tang, X.; Zhang, L.; Li, C.; Liu, Z.; Bo, Z.; Dong, Y. Q.; Tian, Y.-H.; Dong, Y.; Tang, B. Z., Reversible
Luminescence Switching of an Organic Solid: Controllable On–Off Persistent Room Temperature
Phosphorescence and Stimulated Multiple Fluorescence Conversion. Advanced Optical Materials 2015, 3 (9),
1184-1190.
[13] Lucenti, E.; Forni, A.; Botta, C.; Carlucci, L.; Colombo, A.; Giannini, C.; Marinotto, D.; Previtali, A.; Righetto,
S.; Cariati, E., The Effect of Bromo Substituents on the Multifaceted Emissive and Crystal-Packing Features of
Cyclic Triimidazole Derivatives. ChemPhotoChem 2018, 2 (9), 801-805.
[14] Lucenti, E.; Forni, A.; Botta, C.; Carlucci, L.; Giannini, C.; Marinotto, D.; Pavanello, A.; Previtali, A.;
Righetto, S.; Cariati, E., Cyclic Triimidazole Derivatives: Intriguing Examples of Multiple Emissions and
Ultralong Phosphorescence at Room Temperature. Angewandte Chemie International Edition 2017, 56 (51),
16302-16307.

57
[15] Lucenti, E.; Forni, A.; Botta, C.; Carlucci, L.; Giannini, C.; Marinotto, D.; Previtali, A.; Righetto, S.; Cariati,
E., H-Aggregates Granting Crystallization-Induced Emissive Behavior and Ultralong Phosphorescence from a
Pure Organic Molecule. The Journal of Physical Chemistry Letters 2017, 8 (8), 1894-1898.

58
8 Pyridinyl fragment conjugation: (2-fluoropyridin-4-yl)
8.1 Introduction The greater attention gained by molecules with prolonged solid state emission[1,2], that can find various
applications in the development of new technologies, makes the development of these materials an hot-
topic today[3-7].
As reported in the previous chapters, the introduction of Br and I atoms on the trimidazolic scaffold strongly
affects its photophysical behaviour that comprises dual fluorescence, molecular phosphorescence,
supramolecular room temperature phosphorescence (RTP) and RTUP[8–10]. Unfortunately, the Ф of these
compounds dramatically drops in comparison with the PLQY measured for TT, probably because of the
introduction of heavy atoms that promotes new non-radiative deactivation processes in addition to the
emissive ones, reducing their potential applications.
To solve this drawback, a step forward in the chemistry and photophysics of TT-derivatives has been
accomplished by insertion of a chromophoric fragment (2-fluoropyridine) on the trimidazolic scaffold.
Organic substituents are expected to modify the emissive properties at both molecular and, through different
packing arrangement, solid-state levels[11–15]. These effects were not predictable, so that any new member of
the TT-family represents a building block worth studying to get information on this new and very intriguing
class of emitters.
The halo-derivatization of the TT scaffold open up to a greater reactivity towards coupling reaction giving the
opportunity to introduce others organic fragment.
3-(2-fluoropyridin-4-yl)triimidazo[1,2-a:1′,2′-c:1″,2″-e][1,3,5]triazine, TTFPy, containing the 2-fluoropyridine
moiety, has been synthetized by Suzuki-Miyaura coupling between TT1Br and 2-fluoropyridine-4-boronic
acid pinacol ester (See Scheme 1) [16].
Scheme 1: Synthesis of TTFPy.
The compound’s photophysical behavior is markedly different from that of parent TT being, already as a
molecule, quite fluorescent at room temperature and showing additional molecular phosphorescence at 77
K.
8.2 Photophysical characterization Solutions of TTFPy in CH3CN (10-5 M) display at 298 K absorption maxima at 227 and 291 nm, and an emission
band at 358 nm (Ф = 50 %), corresponding to radiative S1-S0 deactivation (τ = 4.26 ns) (See Figure 1).
Absorption and emission spectra in solvents of different polarity reveal a weak positive solvatochromism for
the low energy band and a negative one for the high energy band (λ = 3 and 17 nm, respectively, from CHCl3
to CH3CN).

59
200 300 400 500 600 700
Em
issio
n In
ten
sity
Abso
rba
nce
Wavelength (nm)
Figure 1: Solution of TTFPy in CH3CN (10−5 M) at 298 K: normalized absorption (black line), emission (λexc = 300 nm, red line) and excitation spectra (λem = 358 nm, blue line). Reproduced from ref.[16] free of charge; https://www.mdpi.com.
At 77 K, a slight blue shift (344 nm, τav = 4.05 ns) of the fluorescent emission is observed by exciting at 300
nm. Interestingly, at this low temperature, a weak phosphorescent low energy tail appears in the PL spectrum
and can be isolated (454 nm, τav = 1.63 s) from the fluorescent component by selectively populating the T1
level (λexc = 350 nm) (See Figure 2). In this regard, the importance of direct S0-T1 excitation of organic
phosphorescent compounds has been highlighted by Huang and coworkers[17].
300 400 500 600 700 800
Em
issio
n in
ten
sity
Wavelength (nm)
Figure 2: Solution of TTFPy in CH3CN (10−5 M) at 77 K: normalized emission (λexc = 300 nm, black line; λexc = 350 nm, red line) and excitation (λem = 343 nm, black dashed line; λem = 450 nm, red dashed line) spectra. Reproduced from ref.[16] free of charge;
https://www.mdpi.com.
To deepen the knowledge of the photophysic of TTFPy, spin coated thin films dispersed in
polymethylmethacrylate (PMMA) (6% w/w) have been prepared. The thin films display at 298 K an intense
fluorescent emission at 348 nm (τav = 1.89 ns) together with a weak phosphorescent component which can

60
be isolated (415, 436 nm, τav = 3.09 ms) from the fast emission by exciting at low energy (λexc = 360 nm) (See
Figure 3).
250 300 350 400 450 500 550 600
Em
issio
n Inte
nsity
wavelength (nm)
Figure 3: TTFPy:PMMA film (6% w/w loading) at 298 K: normalized emission (λexc = 300 nm, black line; λexc = 360 nm, blue line) and excitation (λem = 348nm, black dashed line; λem = 436 nm, blue dashed line) spectra. Reproduced from ref.[16] free of charge;
https://www.mdpi.com.
Crystals of TTFPy, manually selected using a microscope, are characterized by multiple emissions. In
particular, at 298 K, a fluorescent (373 nm, τav = 4.77 ns) and two phosphorescent (403, 424 and 446 nm, τav
= 11.64 ms; 547 nm, τav = 417.78 ms) bands, with overall quantum efficiency equal to 25%, are observed in
the PL spectrum by exciting at 300, 360 and 480 nm respectively. The two phosphorescences can be
separated from the prompt emission in the delayed spectra where the longest-lived component displays
peaks at 546 and 592nm (See Figure 4).
Figure 4: Crystals of TTFPy at 298 K. Upper panel: normalized emission (λexc = 300 nm, black solid line; λexc = 360 nm, blue solid line; λexc = 480 nm, red solid line) and excitation (λem = 373 nm, black dashed line; λem = 425 nm, blue dashed line; λem = 570 nm, red
dashed line) spectra. Bottom panel: normalized phosphorescence spectra (λexc = 300 nm; delay 200 μs, window 1 ms, blue dashed line; delay 5 ms, window 20 ms, red solid line). Reproduced from ref.[16] free of charge; https://www.mdpi.com.
300 400 500 600 700
Em
issio
n Inte
nsity
Wavelength (nm)

61
At 77 K the three emissions are still visible in almost the same position, but, for the lower energy
phosphorescent band, much longer lifetimes (up to 2s) are measured (See figure 5).
300 400 500 600 700 800
Em
isssio
n I
nte
nsity
Wavelength (nm)
Figure 5: Crystals of TTFPy at 77 K: normalized emission (λexc = 300 nm, black line; λexc = 360 nm, red line; λexc = 480 nm, blue line) and excitation (λem = 375 nm, black dashed line; λem = 570 nm, blue dashed line line) spectra. Reproduced from ref.[16] free of
charge; https://www.mdpi.com.
Both phosphorescent emissions display vibronic replicas with energy separation (about 180 meV) that can
be associated to a vibronic progression involving the imidazole ring modes[18].
8.3 Discussion Theoretical calculations and single-crystal X-ray diffraction analysis have been performed on TTFPy in order
to interpret its photophysical behaviour. Starting from its X-ray analysis, molecular structure DFT geometry
optimization was firstly performed to investigate the behavior of the luminophor in solution. The rotability
of the C-C bond connecting the TT and the pyridinic moiety requires to calculate the presence of local minima
besides that observed in the crystal. The asymmetry due to the presence of the fluorine atom generates two
independent almost isoenergetic minima in the potential energy surface besides the symmetric ones with
respect to the TT least squares (l.s.) plane. The two conformations are similar, the one derived from the X-
ray geometry forms a dihedral angle of 47° between the l.s planes through TT and the 2-fluoropyridine while
the one corresponding to additional minimum forms a 43° angle, the major difference consists in the fluorine
position. The twisted conformation suggests a reduced conjugation between the two aromatic moieties
within the molecule. Moreover, the presence of the fluorine atom grants some degree of polarity to the
molecule (μg = 4.03 and 3.75 D in the two conformations, respectively).
Similar results are provided by TDDFT calculations of the two optimized conformations of TTFPy. For the most
stable they give a strong π→π* transition (S0→S1 at 245 nm, f = 0.353), dominated by the HOMO→LUMO
contribution with charge transfer (CT) character (from TT to 2-fluoropyridine) in the same direction as the
ground state dipole moment, followed by a weak one (S0→S2 at 234 nm, f=0.043) of mixed σ/π→π*
character. One of the occupied MOs involved in the latter (HOMO-5) is, in fact, a π orbital except for a σ
contribution localized on a TT nitrogen atom (Figure 6).

62
The other computed π→π* transitions well reproduce the observed absorption band at high energy. The
HOMO→LUMO+1 contribution is the strongest one(S0→S6 at 205 nm, f = 0.421) with a CT character from the
2-fluoropyridine to the TT with opposite direction with respect to the S0→S1. Consequently, the difference
between different state dipole moment (μeg = μe − μg) for S0→S6 (0.24 D) is almost null while for S0→S1 (2.88
D) is high. An even bigger difference between these transitions is computed with IEFPCM (TD)DFT in
acetonitrile and chloroform with a dipole moment equal to 4.75 and 5.03 D, S0→S1 equal to 4.68 and 5.47 D
and S0→S6 equal to −1.74 and −2.32 D. The results completely agree with the solvatochromism observed for
the low and high energy absorption bands in different solvents, even if the IEFPCM method can only
reproduce the positive solvatochromism observed for the low energy band. The high energy band does not
undergo any particular change probably because S0→S6 is not the only transition contained in the band so its
weight is limited.
Figure 6: Electronic levels computed for TTFPy (left) and selected MO involved in the transitions (right) at molecular level. In blue are reported the singlet levels with the corresponding oscillator strengths f. Reproduced from ref.[16] free of charge;
https://www.mdpi.com.

63
Regarding the emission at 450 nm observed in solution at 77 K, the calculation computed a Tn level (T7 at 250
nm) with (σ,π*) symmetry that can be responsible for a fast ISC from the close S1 (π,π*) level (computed at
245 nm) and the consequent relaxation through IC to T1 from where the phosphorescence is observed. This
explanation is furtherly confirmed by the presence of a similar component at 430 nm in the PMMA film at
RT.
In opposition to the fluorescent emission and the high energy phosphorescence, which can be assigned to
radiative deactivation from molecular S1 and T1 even in the crystal, the nature of the additional
phosphorescence is not clear and cannot be associated with a simple molecular contribution. To disclose the
origin of this radiative process, single-crystal structure must be analysed.
TTFPy crystallizes in the P-1 space group with equidistant face-to-face stacking along the crystallographic axis
forming infinite columns. Taking into consideration a single axis, molecules of TTFPy lie iso-oriented on planes
with distances of 3.366 Å and a rather small slippage (1.9 Å), with a distance between triazinic centroids equal
to (3.831 Å) and high angle θ (61°) between the centroid axis and the molecular plane (Figure 7). This
disposition suggests the formation of H-aggregate even for this molecule even if some differences with the
stacking pattern of TT is evident. In the case of triimidazole, an infinite ABAB alternate sequence is formed
by the molecules in which every molecule is rotate of 180° respect the adjacent one with alternate distances
equal to 3.204 and 3.290 Å and centroid-centroid distances of 3.733 and 3.949 Å. The TTFPy packing mode
is much more similar to that of the TT1I[10] where the molecules are iso-oriented and disposed face-to-face
with larger slippage (2.3 Å, θ = 55°) and longer distance between centroids of triazinic rings (4.097 Å).
Molecules of TTFPy are laterally connected through several C-H···N and C-H···F close contacts (the shorter
one being C8-H8···N1, H···N = 2.52 Å, C-H···N = 170.5°) forming slightly corrugated planes. The dihedral angle
between l.s. planes through TT and pyridine moieties measures 49.80°. This value, close to that computed
for the isolated molecule (47.00°), suggests minor conformational rearrangement from solution to the solid
state.
Figure 7: Partial views along bc (left) and a directions (right) of TTFPy crystal structure showing columnar H-aggregates (centroids of the triazinic rings shown as red circles) and hydrogen bonds (light blue dashed lines). Reproduced from ref.[16] free of charge;
https://www.mdpi.com.
The disposition of TTFPy molecules in the crystal structure justifies the observed long-last component in the
solid state together with the observation that H-aggregates, as well as in the others case regarding the TT-
family[8-10, 12], efficiently trap the triplet exciton. Moreover, the rigidification and oxygen protection associated
with intramolecular interactions allow the arise of the high energy phosphorescence in the solid state even

64
at RT. In perfect agreement, the same effect is observed in the PMMA blend where the rigidification provided
by the polymeric matric allows the arise of the high energy component, while the low energy one is absent
due to the lack of H-aggregates.
8.4 Conclusion The TTFPy derivative represents the first attempt to conjugate TT with another aromatic structure in order
to tune its photophysical behaviour. Despite the presence of an additional 2-fluoropyridinic fragment the
formation of H-aggregates motifs is not prevented but the strength of the interchromophoric π-π interactions
is decreased and consequently the associated phosphorescence decay time becomes shorter. However, the
presence of the fluoropyridinyl moiety strongly enhances the solution emissive properties and contributes in
the arise of an additional molecular phosphorescence. These promising results obtained with this first
conjugation attempt open up to further modification with different fragments.
65
8.5 References [1] Gu, L.; Shi, H.; Bian, L.; Gu, M.; Ling, K.; Wang, X.; Ma, H.; Cai, S.; Ning, W.; Fu, L.; Wang, H.; Wang, S.; Gao,
Y.; Yao, W.; Huo, F.; Tao, Y.; An, Z.; Liu, X.; Huang, W., Colour-tunable ultra-long organic phosphorescence of
a single-component molecular crystal. Nature Photonics 2019, 13 (6), 406-411.
[2] Zhao, W.; Cheung, T. S.; Jiang, N.; Huang, W.; Lam, J. W. Y.; Zhang, X.; He, Z.; Tang, B. Z., Boosting the
efficiency of organic persistent room-temperature phosphorescence by intramolecular triplet-triplet energy
transfer. Nature Communications 2019, 10 (1), 1595.
[3] Jiang, K.; Wang, Y.; Cai, C.; Lin, H., Conversion of Carbon Dots from Fluorescence to Ultralong Room-
Temperature Phosphorescence by Heating for Security Applications. Advanced Materials 2018, 30 (26), 7.
[4] Sun, H.; Liu, S.; Lin, W.; Zhang, K. Y.; Lv, W.; Huang, X.; Huo, F.; Yang, H.; Jenkins, G.; Zhao, Q.; Huang, W.,
Smart responsive phosphorescent materials for data recording and security protection. Nature
Communications 2014, 5 (1), 3601.
[5] Wang, X.-F.; Xiao, H.; Chen, P.-Z.; Yang, Q.-Z.; Chen, B.; Tung, C.-H.; Chen, Y.-Z.; Wu, L.-Z., Pure Organic
Room Temperature Phosphorescence from Excited Dimers in Self-Assembled Nanoparticles under Visible and
Near-Infrared Irradiation in Water. Journal of the American Chemical Society 2019, 141 (12), 5045-5050.
[6] Zhen, X.; Xie, C.; Pu, K., Temperature-Correlated Afterglow of a Semiconducting Polymer Nanococktail for
Imaging-Guided Photothermal Therapy. Angewandte Chemie International Edition 2018, 57 (15), 3938-3942.
[7] Kabe, R.; Notsuka, N.; Yoshida, K.; Adachi, C., Afterglow Organic Light-Emitting Diode. Advanced Materials
2016, 28 (4), 655-660.
[8] Lucenti, E.; Forni, A.; Botta, C.; Carlucci, L.; Colombo, A.; Giannini, C.; Marinotto, D.; Previtali, A.; Righetto,
S.; Cariati, E., The Effect of Bromo Substituents on the Multifaceted Emissive and Crystal-Packing Features of
Cyclic Triimidazole Derivatives. ChemPhotoChem 2018, 2 (9), 801-805.
[9] Lucenti, E.; Forni, A.; Botta, C.; Carlucci, L.; Giannini, C.; Marinotto, D.; Pavanello, A.; Previtali, A.; Righetto,
S.; Cariati, E., Cyclic Triimidazole Derivatives: Intriguing Examples of Multiple Emissions and Ultralong
Phosphorescence at Room Temperature. Angewandte Chemie International Edition 2017, 56 (51), 16302-
16307.
[10] Lucenti, E.; Forni, A.; Botta, C.; Giannini, C.; Malpicci, D.; Marinotto, D.; Previtali, A.; Righetto, S.; Cariati,
E., Intrinsic and Extrinsic Heavy-Atom Effects on the Multifaceted Emissive Behavior of Cyclic Triimidazole.
Chemistry – A European Journal 2019, 25 (10), 2452-2456.
[11] Xiao, L.; Fu, H., Enhanced Room-Temperature Phosphorescence through Intermolecular
Halogen/Hydrogen Bonding. Chemistry – A European Journal 2019, 25 (3), 714-723.
[12] Lucenti, E.; Forni, A.; Botta, C.; Carlucci, L.; Giannini, C.; Marinotto, D.; Previtali, A.; Righetto, S.; Cariati,
E., H-Aggregates Granting Crystallization-Induced Emissive Behavior and Ultralong Phosphorescence from a
Pure Organic Molecule. The Journal of Physical Chemistry Letters 2017, 8 (8), 1894-1898.
[13] An, Z.; Zheng, C.; Tao, Y.; Chen, R.; Shi, H.; Chen, T.; Wang, Z.; Li, H.; Deng, R.; Liu, X.; Huang, W., Stabilizing
triplet excited states for ultralong organic phosphorescence. Nature Materials 2015, 14 (7), 685-90.
[14] Pan, S.; Chen, Z.; Zheng, X.; Wu, D.; Chen, G.; Xu, J.; Feng, H.; Qian, Z., Ultralong Room-Temperature
Phosphorescence from Supramolecular Behavior via Intermolecular Electronic Coupling in Pure Organic
Crystals. The Journal of Physical Chemistry Letters 2018, 9 (14), 3939-3945.

66
[15] Wang, S.; Ma, L.; Wang, Q.; Shao, P.; Ma, D.; Yuan, S.; Lei, P.; Li, P.; Feng, X.; Wang, B., Covalent organic
frameworks: a platform for the experimental establishment of the influence of intermolecular distance on
phosphorescence. Journal of Materials Chemistry C 2018, 6 (20), 5369-5374.
[16] Previtali, A.; Lucenti, E.; Forni, A.; Mauri, L.; Botta, C.; Giannini, C.; Malpicci, D.; Marinotto, D.; Righetto,
S.; Cariati, E., Solid State Room Temperature Dual Phosphorescence from 3-(2-Fluoropyridin-4-
yl)triimidazo[1,2-a:1′,2′-c:1″,2″-e][1,3,5]triazine. Molecules 2019, 24 (14), 2552.
[17] Yuan, J.; Chen, R.; Tang, X.; Tao, Y.; Xu, S.; Jin, L.; Chen, C.; Zhou, X.; Zheng, C.; Huang, W., Direct
population of triplet excited states through singlet–triplet transition for visible-light excitable organic
afterglow. Chemical Science 2019, 10 (19), 5031-5038.
[18] Majoube, M.; Henry, M.; Chinsky, L.; Turpin, P. Y., Preresonance Raman spectra for imidazole and
imidazolium ion: interpretation of the intensity enhancement from a precise assignment of normal modes.
Chemical Physics 1993, 169 (2), 231-241.

67
9 Pyridinyl fragment conjugation: (pyridin-2-yl)
9.1 Introduction The intriguing results obtained with the insertion of the 2-fluoropyridine fragment[1] on the TT scaffold have
demonstrated that modification of the central trimidazolic ring not only preserves the formation of H-
aggregates and so the RTUP but it can even furtherly introduce new radiative deactivation processes leading
to more complex and fascinating materials. Even if it is still not possible to forecast how the introduction of
a fragment can modify the photophysical behaviour of cyclic triimidazole, due to the huge number of factors
that have to be taken into account in the solid state emission, some considerations about which is the best
kind of pendant attachable to TT can be made. On this regard, heteroaromatic substituents should be
considered as suitable chromophores in shifting the emission of TT towards the red while preserving the long
lifetime of its triplet state.
The introduction on cyclic triimidazole of a pyridine moiety, with the nitrogen atom in the ortho position, is
expected to generate a material similar to TTFPy, and to also lead to a potential candidate, as ligand, for the
formation of chelated complexes.
3-(pyridin-2-yl)triimidazotriazine (TT2Py) has been prepared by Stille coupling between TT1Br and 2-
(tributylstannyl)pyridine (See Scheme 1) and characterized by NMR spectroscopy, mass spectrometry and X-
ray analysis[2]. The compound was recrystallized three times before photophysical characterization in order
to avoid signals due to impurities.
Scheme 1: Synthesis of TT2Py.
9.2 Photophysical characterization Diluted solutions of TT2Py (10-5 M) in acetonitrile (CH3CN) and dichloromethane (CH2Cl2) in air at 298 K display
absorption bands at about 235 and 290 nm and emission around 350 nm ( 17 %) (Figure 1). Exciting the
sample at 355 nm two bands appear in the spectrum: one with short lifetime (ns) and one with long lifetime
(ms). Surprisingly, while no other bands are visible in the PL spectrum long live components are detected in
both solvents when the lifetimes are monitored at 400 and 500 nm. To better understand the processes
behind these emission steady state and time resolved studies of the deareated solutions have been
performed.
Two bands are detected in the time gated spectra of the deareated DCM solution, at about 420 nm a medium
energy phosphorescence MEP (τav= 40 μs) and a structured band at lower energy, defined low energy
phosphorescence LEP1, with peaks at 520 and 562 nm (τav= 441 μs), both these emissions are quenched by
oxygen diffusion inside the cell (Figure 1 top). In CH3CN, similarly to CH2Cl2 solution, a blue shifted LEP2
component is observed with peaks at 488, 521 and 560 nm when the sample is excited at 390 nm while no
other higher energy phosphorescences have been detected (Figure 1 bottom).

68
Figure 1: Normalized optical absorption (black solid line) and PL spectra of 10-5 M deareated solutions of TT2Py in DCM (top) and CH3CN (bottom) at 298 K. Top: λexc= 270 nm, (blue solid line); Bottom: λexc = 300nm, (blue solid line); λexc = 390 nm, (green solid line).
Phosphorescence spectra of CH2Cl2 (top) (dotted green line, delay 50 μs, window 100 μs) and CH3CN (bottom) (dotted green line, delay 200 μs, window 500 μs) λexc = 300 nm. Reproduced from ref.[2] free of charge, https://pubs.rsc.org/en.
Forcing the aggregation through the addition of water (CH3CN/H2O 1:1), while maintaining the deareated
condition, the LEP2 spectral shape is detected even in the steady state experiment (λexc= 390 nm). In parallel,
no absorption is detected at 390 nm but a weak band appears in the excitation profile of the emission. The
time gated spectra show features similar to the CH2Cl2 solution with the structured LEP1 and an additional
emission at 345 nm, a high energy phosphorescence HEP, with shorter decay time with respect to the MEP
centered at 380-420 nm. The presence of the two LEPs in the CH3CN/H2O solution could be associated with
the presence of different aggregates (Figure 2).
Figure 2: Photophysical properties of deareated solutions of TT2Py in 10-4 M CH3CN/H2O (v/v=50/50) solution at 298 K. Top: Absorption (black solid line), PLE (green dashed line, λem = 488 nm) and PL spectra (blue solid line, λexc = 270 nm, green solid line, λexc
= 390 nm). Bottom: Phosphorescence spectra (blue line, delay 100 μs, window 200 μs; red line, delay 0.5 ms, window 1 ms, λexc = 300 nm). Reproduced from ref.[2] free of charge, https://pubs.rsc.org/en.
Shortly, the two long lived component HEP and MEP are molecular components while the LEPs arise from
different aggregates.

69
At 77 K an excitation dependent PL spectrum is observed. A high energy fluorescence HEF at 340 nm is
detected in the CH2Cl2 frozen solution (τav= 2.32 ns) together with the HEP at 375 nm when the sample is
excited at 280 nm. At lower excitation energy (exc=350 nm) the MEP at 393 nm (τav= 13.16 ms) dominates
the spectrum. Time gated experiments reveal at 405 nm the MEP and the relative excitation band at 350 nm
and at 485, 520 and 555 nm a long lived component (τav= 1.31 s) similar to LEP2. Exciting with shorter
wavelength the spectra become broader (Figure 3). Lowering the temperature of other solutions (CH3CN,
CH3OH/CH3CH2OH 2:8) similar results are observed.
Figure 3: Photophysical properties of 10-5 M DCM solution of TT2Py at 77 K. Top: PL and PLE spectra (λem = 350 nm, black dotted line; λem = 400 nm, blue dotted line; λexc = 280 nm, blue solid line, λexc = 350 nm, green solid line). Bottom: Phosphorescence spectra λexc = 350 nm (delay 200 μs, window 400 μs, blue line; delay 10 ms, window 20 ms, red line). Reproduced from ref.[2] free of charge,
https://pubs.rsc.org/en.
To furtherly extend the photophysical characterization of the TT2Py and to explore its potential application
in the field of organic light emitting diodes (OLED), blended thin films in PMMA have been prepared (w/w
TT2Py/PMMA 10% and 5%). Independently from the film concentration, the photophysical behaviour
becomes even more complicated with four different emissions covering a large area of the PL spectrum
(Figure 4). However, the emissions can be selectively activated choosing different excitation wavelengths.
Figure 4: Top: Photophysical properties of TT2Py in PMMA (w/w TT2Py/PMMA 10%). λexc = 300 nm (black line), λexc = 350 nm (violet line), λexc = 390 nm (blue line), λexc = 450 nm (green line) and excitation spectra λem = 352 nm (black dotted line), λem = 400 nm (violet dotted line), λem = 440 nm (blue dotted line). Bottom: Film exposed to HCl vapors (λexc = 300 nm; black line, 30 min; red line, 45 min;
λexc = 390 nm, green line, 45 min; λem = 527 nm, green dotted line, 45 min). Reproduced from ref.[2] free of charge, https://pubs.rsc.org/en.

70
With high energy excitations (below 300 nm) the spectrum is dominated by an intense fluorescence HEF ( =
1.18 ns) at 350 nm. The MEP is observed at 395 nm (av = 13.73 ms) when the sample is excited at 350 nm
while, at 390 nm, a second fluorescence band appears at 440 nm (av = 3.47 ns, low energy fluorescence,
LEF). Unresolved LEPs at 530 nm, already observed in solution, are activated by exciting at 450 nm (Figure 4).
To better understand the articulated behaviour of TT2Py (w/w TT2Py/PMMA 10%) films, ultrafast pump-
probe experiments have been performed.
The measured signal is:
Δ𝑇(𝜆𝑃𝑅 , 𝜏)
𝑇=
𝑇𝑂𝑁(𝜆𝑃𝑅, 𝜏) − 𝑇𝑂𝐹𝐹(𝜆𝑃𝑅 , 𝜏)
𝑇𝑂𝐹𝐹(𝜆𝑃𝑅 , 𝜏)
where TON and TOFF are the probe transmission intensities with and without pump excitation at a given λPR
and τ probe delay. A positive ΔT/T signal corresponds to the bleaching of the ground state or stimulated
emission (SE) from excited states, while a negative signal indicates the presence of a photoinduced
absorption (PIA) band [3].
The ΔT/T spectra at different probe delays after excitation at the first absorption peak (290 nm) with 20 fs
time resolution [4] are reported in the left panel of Figure 5.
The spectra show an initial SE band at around 350 nm and two PIA bands, peaked at 450 nm and 550 nm,
PIA1 and PIA2 respectively. The temporal evolutions indicate that SE and PIA2 bands are instantaneously
formed, while PIA1 signal is delayed by about 100 fs with respect to the other two. Based on this observation,
SE and PIA2 bands can be assigned to the temporal evolution of the photo-generated excitons which give
origin to the HEF stimulated emission (S1-S0) or to the photoinduced absorption band PIA2 (S1-Sn), while the
band at 450 nm is associated to the generation of charged states [5]. This result shows the presence of
intermolecular interaction between the different molecules. To investigate the origin of the LEF emission,
ΔT/T spectra at different probe delays after excitation at 390 nm (with 100 fs temporal resolution) [5] have
been collected. The spectra show an initial PIA band all over the visible spectral region; moreover, at long
probe delays, a positive signal appears in the region between 420 nm and 550 nm, indicating emission
(supposedly LEF) from a newly formed state. This formation is evident looking at the temporal evolution of
the ΔT/T signal at 450 nm which clearly indicates an initial negative signal which becomes positive in around
700 ps. Moreover, after 1 ns the signal is still growing indicating that the excitation comes from a long living
initial excited state and it is likely that this emission will present a long-lived emission tail.
Figure 5: Ultrafast spectroscopy measurements on TT2Py in PMMA (w/w TT2Py/PMMA 10%). Pump-probe spectra selected at different probe delays after 290 nm (left panel) and 390 nm (right panel) excitations. Reproduced from ref.[2] free of charge,
https://pubs.rsc.org/en.
Three different polymorphs have been isolated for TT2Py: TT2Py-A as laminae from CH2Cl2/CH3OH, TT2Py-H
as needles from CH3CN/H2O, which includes disordered cocrystallized water molecules and TT2Py-X from

71
CH3CN. All the three polymorphs show the typical stacking already observed in cyclic triimidazole and
its already investigated derivatives[1, 7-10] (Figure 6). Before any photophysical measurements crystals of each
phase were manually selected using a microscope in order to avoid the presence of more than one phase.
TT2Py-A shows largely shifted triimidazole units one with respect to the other with distance of 5.358 Å
between triazinic centroids. However, short CC distances (3.234, 3.301 Å to cite the shorter ones) are
measured, indicating strong stacking interactions. Adjacent molecules along the stacks are rotated in
the plane of TT.
Shorter distances between triazinc centroids (3.736 Å) are detected in TT2Py-H, the molecules do not display
any rotation along the stacks but longer CC distances (3.309, 3.328 Å), respect to TT2Py-A, are measured.
In TT2Py-X, two molecules are contained in the asymmetric unit, the triazinic centroids of adjacent TT units
are alternately separated by 4.756 and 4.917 Å and the shorter CC contacts measure 3.373 and 3.416 Å.
Along the stacks, the molecules are slightly rotated in the TT’s plane, similarly to what observed in TT2Py-A.
It should be evidenced that in all polymorphs, the TT moieties are strongly anchored to each other by not
only stacking interactions but also several short C–HN hydrogen bonds (HBs) in the plane roughly
perpendicular to the stacking axis (the shortest ones measuring 2.44, 2.50 and 2.29 Å in TT2Py-A, TT2Py-H,
and TT2Py-X, respectively). On the contrary, the pyridinic functions of TT2Py-A and TT2Py-X are involved only
in weak C–H HBs and NC close contacts while, in TT2Py-H, the pyridinic nitrogen atom is hydrogen
bonded with the disordered cocrystallized water molecules, the high mobility of the latter could not support
a rigid environment for the pyridinic ring.
Figure 6: Top: Asymmetric unit of TT2Py-A and its crystal packing. Bottom: Crystal packing of TT2Py-H (left) and TT2Py-X (right). The centroids of triazinic rings, together with their separation, are shown in yellow. Ellipsoids at 30% probability. Reproduced from
ref.[2] free of charge, https://pubs.rsc.org/en.
It is clear that the tilting between TT and pyridine is slightly different in the three polymorphs, the dihedral
angles between the two fragments measure 41.47°, 43.7° and 37.6/39.6° in TT2Py-A, -H and -X while the DFT
optimized value in vacuo is 36.70°. In addition, the pyridine displays a different relative orientation with
respect to TT in TT2Py-A compared to TT2Py-H and TT2Py-X as evidenced by the N7-C10-C2-C1 torsion angle
that measures -35.18° in the former and 41.51 and 34.16/34.64° in the latter structures, respectively.
The photophysical studies on the three polymorphs were performed separately on crystals manually selected
using a microscope.

72
At 298 K in air, crystals of TT2Py-A show an intense high energy ultralong emission at 370 nm HEP (av= 0.7
s) with an impressive quantum efficiency equal to 52% when exciting between 270 nm and 380 nm. Exciting
at longer wavelength broad emissions peaked at 450 nm (λexc= 390 nm) and 524 nm (λexc= 460 nm) are
observed as the results of LEF and LEP, respectively. Time-gated experiments allow to resolve different
phosphorescent contributions by changing the delay times. With delays longer than 1 ms, the HEP peaked at
370 nm decreases in intensity and the spectral shape evolves revealing a contribution at about 420 nm (MEP;
av = 0.29 ms) and a longer-lived broad LEP at 575-615 nm (av = 2.09 ms) (Figure 7).
Figure 7: PL (top) and phosphorescence (bottom) spectra of crystals of TT2Py-A at 298 K. Top: Emission spectra (solid lines, λexc = 300 nm, black line; λexc = 390 nm, blue line, λexc = 460 nm, green line) and excitation spectra dotted lines λem = 390 nm, black line; λem = 460 nm, blue line; λem = 550 nm, green line) . Bottom: Phosphorescence spectra (λexc = 290 nm; delay 200 μs, window 500 μs, black
line; delay 1 ms, window 3 ms, blue line; delay 5 ms, window 10 ms, green line). Reproduced from ref.[2] free of charge, https://pubs.rsc.org/en.
Similarly, TT2Py-H crystals show HEP, LEF and LEP at 374, 450 and 520 nm (20.38 ms, 1.91 ns and 18.25 ms,
respectively). Time-gated spectra have revealed that the HEP, peaked at 375 nm, evolves into MEP (av = 0.47
ms) and the structured LEP-1 at delays longer than 1 ms (exc = 320 nm, 535, 570 and 625 nm; av = 5.98 ms)
(Figure 8). When crystals of TT2Py-H are analysed at 77 K HEF, HEP, LEF and LEP-2 (345, 373, 392, 420 and
493 nm) are resolved. In time gated spectra MEP and HEP emissions overlap, while, as previously observed
in CH2Cl2, the spectral profile of LEP-1 is selectively activated by exciting at 400 nm (Figure 9).
Figure 8: PL (top) and phosphorescence (bottom) spectra of crystals of TT2Py-H at 298 K. Top: Emission spectra: λexc = 300 nm (black line), λexc = 390 nm (blue line), λexc = 460 nm (green line) and excitation spectra λem = 390 nm (black line), λem = 460 nm (blue line), λem = 550 nm (green line). Bottom: Phosphorescence spectra (λexc = 320 nm; delay 50 μs, window 200 μs, black line; delay 100 μs, window 200 μs, blue line; delay 1 ms, window 10 ms, green line). Reproduced from ref.[2] free of charge, https://pubs.rsc.org/en.
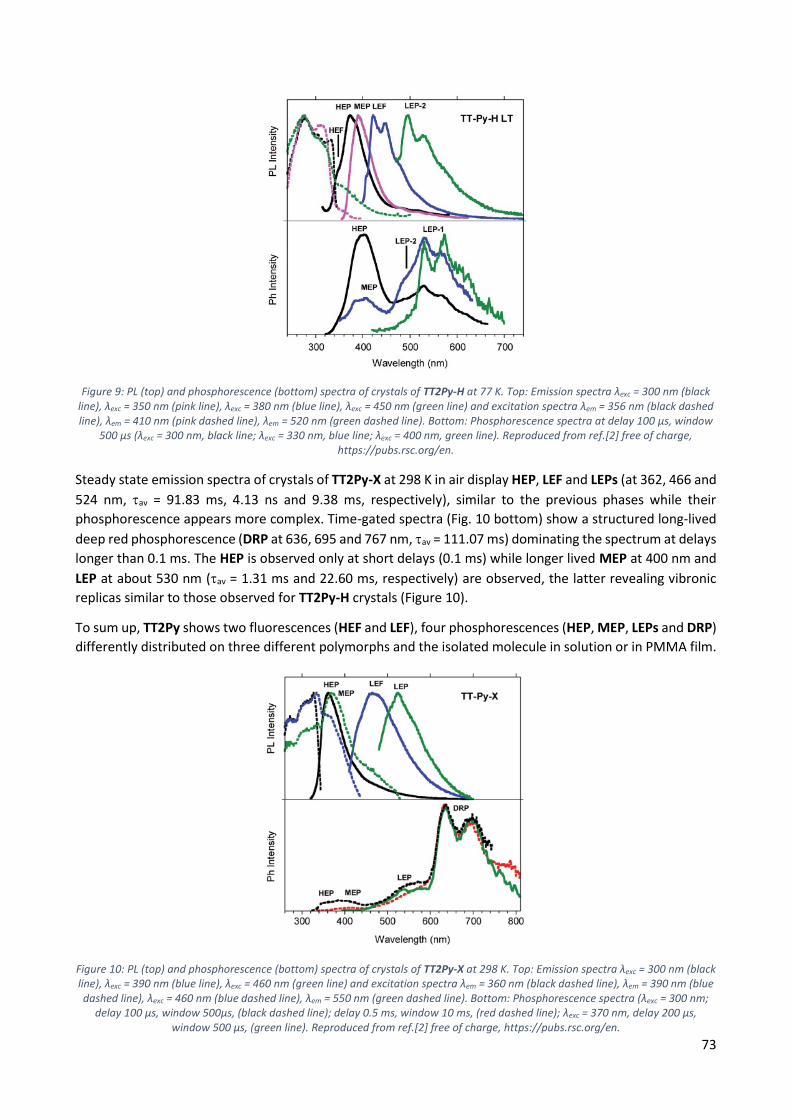
73
Figure 9: PL (top) and phosphorescence (bottom) spectra of crystals of TT2Py-H at 77 K. Top: Emission spectra λexc = 300 nm (black line), λexc = 350 nm (pink line), λexc = 380 nm (blue line), λexc = 450 nm (green line) and excitation spectra λem = 356 nm (black dashed line), λem = 410 nm (pink dashed line), λem = 520 nm (green dashed line). Bottom: Phosphorescence spectra at delay 100 μs, window
500 μs (λexc = 300 nm, black line; λexc = 330 nm, blue line; λexc = 400 nm, green line). Reproduced from ref.[2] free of charge, https://pubs.rsc.org/en.
Steady state emission spectra of crystals of TT2Py-X at 298 K in air display HEP, LEF and LEPs (at 362, 466 and
524 nm, av = 91.83 ms, 4.13 ns and 9.38 ms, respectively), similar to the previous phases while their
phosphorescence appears more complex. Time-gated spectra (Fig. 10 bottom) show a structured long-lived
deep red phosphorescence (DRP at 636, 695 and 767 nm, av = 111.07 ms) dominating the spectrum at delays
longer than 0.1 ms. The HEP is observed only at short delays (0.1 ms) while longer lived MEP at 400 nm and
LEP at about 530 nm (av = 1.31 ms and 22.60 ms, respectively) are observed, the latter revealing vibronic
replicas similar to those observed for TT2Py-H crystals (Figure 10).
To sum up, TT2Py shows two fluorescences (HEF and LEF), four phosphorescences (HEP, MEP, LEPs and DRP)
differently distributed on three different polymorphs and the isolated molecule in solution or in PMMA film.
Figure 10: PL (top) and phosphorescence (bottom) spectra of crystals of TT2Py-X at 298 K. Top: Emission spectra λexc = 300 nm (black line), λexc = 390 nm (blue line), λexc = 460 nm (green line) and excitation spectra λem = 360 nm (black dashed line), λem = 390 nm (blue dashed line), λexc = 460 nm (blue dashed line), λem = 550 nm (green dashed line). Bottom: Phosphorescence spectra (λexc = 300 nm;
delay 100 μs, window 500μs, (black dashed line); delay 0.5 ms, window 10 ms, (red dashed line); λexc = 370 nm, delay 200 μs, window 500 μs, (green line). Reproduced from ref.[2] free of charge, https://pubs.rsc.org/en.

74
9.3 Discussion As previously reported in literature[1, 7-10], LEPs and DRP can be reasonably associated to dimeric or
supramolecular columnar - interactions among TT units, even if the LEP components have been detected
in diluted (10-5 M) CH2Cl2 and CH3CN solutions where the presence of aggregated species cannot be
completely excluded[11]. The geometrical optimization of dimeric units extracted from the three crystal
structure converges in three different but almost isoenergetic stationary states with large interaction
energies (11.92 kcal/mol BSSE-corrected, for the most stable one). LEP1 and LEP2, which are present in all
the structures, may derive from TT2Py units interacting in different conformations or/and relative
orientations [12], as supported by the polymorphism shown by this molecule. On the contrary, DRP is observed
only for TT2Py-X so, it is to be related to a specific interchromoforic interaction. The X-ray structures point
out that TT2Py-X and TT2Py-H have a high H-aggregated character but the water contained in the TT2Py-H
may acts as a vibrational quencher for this low energy emission [13].
The other emissions HEF, HEP, MEP and LEF, seem to be generated from molecular electronic states. In fact,
even if LEF is not visible in solutions, it is present in the blended films (and in all polymorphs), probably the
rigidification of the environment is necessary to activate this emission.
The comparison with the TTFPy analogue allows to clarify the behaviour[1]. This latter derivative shows a
fluorescent deactivation from S1 at 370 nm, a molecular phosphorescence from T1 at 420 nm and a long lived
component arising from the presence of H-aggregates at 560 nm. In the same way, the HEF band observed
for TT2Py can be associated with a deactivation from S1, as well as the MEP can be originated from T1.
The nature of LEF and HEP is more complex and requires the support of DFT and TDDFT calculations on the
optimized molecular geometry of TT2Py (Figure 11). Two almost isoenergetic minima, separated by a small
barrier(B), were provided through energy scan calculations around the single bond connecting the TT to the
pyridine. In the two minima the pyridinic nitrogen atom lies below (polymorph A) or above (polymorph H, X)
the plane of cyclic triimidazole. Another local minimum (D), higher by only 1 kcal/mol than the absolute
one, corresponds to the conformation with the pyridinic N atom close to the TT one, none of the isolated
polymorphs display this conformation which however might be taken in consideration in solution due to the
low barrier (C; 2 kcal/mol) that divides it from the absolute minimum. Finally, a rotation barrier as high as 7
kcal/mol (E) corresponds to the conformation where two nitrogen atoms (one from Py and the other from
TT) face one against the other.
The absolute minimum geometry (A conformation) simulated absorption spectrum has a good overlap with
the experimental UV with mainly two bands, with 1(,*) character and intermediate weaker transition of 1(,*),1(/,*) and 1(,*) character, corresponding to S0-S1,A and to S0-S7,A (at 256 with f= 0.478 and at 207
with f= 0.428, respectively), where the contribution is mostly related to occupied MOs localized on one TT
nitrogen atom. Even if the calculated maxima are blue-shifted with respect the experimental ones the
calculated separation (1.16 eV) well matches the observed one (1.05 eV). Two triplet states, T7,A 3(/,*)and
T6,A 3(,*), are computed closely to S1,A from where ISC can easily occurs. These triplets could be associated
with the HEP observed in the emission spectrum.
A deeper investigation has revealed that another triplet state, T9,A at 254 nm, with 3(,*) character is closed
to S2,A (241 nm, oscillator strength f = 0.021) of 1(,*) character, this explains the slower MEP from T1,A,
having the same 3(,*) character as T9,A, from which it is populated by internal conversion.
HEP is an anti-Kasha emission[14] from T6,A with (/,*) symmetry which is different from the (,*) of the
T1,A. Compared to the TTFPy, for which HEP is not observed, the closest triplet states to S1 have the same
(/,*) symmetry as T1 so the IC to this state produces only a low energy molecular phosphorescence.

75
Figure 11: Scan of the relaxed potential energy surface of the S1 and S0 states of TT2Py along the N7-C10-C2-C1 torsion angle, , at
the (TD)-B97X/6-311++G(d,p) level of theory. Energies are relative to the S0 state equilibrium geometry. A, H and X refer to the optimized molecular structures of TT2Py-A, -H, and -X, respectively. B, C, D and E denote the other stationary states. Reproduced
from ref.[2] free of charge, https://pubs.rsc.org/en.
The geometrical optimization of S1,A of (,*) with (,*) leads to a planar conformation which corresponds
to the B geometry of the ground state at only slightly lower energy with respect to the Franck-Condon one.
The HEF observed in solution, films and solid state at 350-370 nm when excited at 3700-300 nm can occur
from this state. The excitation energies calculated in the local minimum’s geometry D provide a S0,D-S1,D
transition, with mixed (/,*) character, at higher energy with respect to that computed for A,
consequently, a molecule in this conformation cannot reach the S1,D using the same excitation energies (270-
300nm). However, geometry optimization of S1,D leads to the planar conformation corresponding to the
ground state’s E geometry and associated with much lower energy than the Franck-Condon one. The LEF
observed in films and in the solid state at 450 nm when exciting at 390 nm can be associated to this new S1,E.
The low excitation energy allows for population of a triplet state with proper (,*) symmetry which crosses
S1,E and finally decays on the ground state. Such a complicated mechanism, S0,D→Tm,D→S1,E→S0,E , has to be
invoked since no singlet states are computed at such low (390 nm) energy neither for the molecule nor for
its dimeric aggregates (Figure 12). The pump-probe results support these conclusions. Upon pumping directly
the Tm,D triplet state (recognizable in the spectrum from the negative PIA band Tm,D→Tn,D) the S1,E state
responsible for the LEF emission is populated by intersystem crossing [4]. The same process could occur even
from S1,D but it cannot be observed because obscured by the efficient HEF. Moreover, LEF can be observed
only in a rigid environment, as films or crystals, but in the latter case, it arises from crystal defects
where a portion of molecules, inside the crystals as well as on the surface, should be found in the D
conformation. To completely understand the intricate behaviour of the TT2PyH+, the PMMA film was
exposed to acidic vapour in order to protonate the pyridinic nitrogen and consequently block the free
rotation around the bond connecting the triimidazole and the pyridine. After 30 minutes of exposition the
film is not fully protonated, in fact, steady state experiment revealed the high energy fluorescence of the
TT2Py together with the additional red shifted fluorescence of the TT2PyH+ (412 nm, τav= 3.56 ns). After 45
minutes only the 412 nm fluorescence is visible. Exciting at 390 the protonated film, a phosphorescence at
425 nm (τav= 13.94 ms) is observed, while the 450 nm LEF is missing. The original spectrum is restored by
exposing the film of TT2PyH+ to NH3 vapors (Figure 4).

76
Figure 12: Schematic photophysical processes of TT2Py (fluorescences and phosphorescences shown as blue and red arrows, respectively). Reproduced from ref.[2] free of charge, https://pubs.rsc.org/en.
As revealed by the geometrical optimization, the simple addition of a proton on the basic nitrogen atom of
the TT2Py generate a metastable conformation (Figure 13). The relaxed energy scan for TT2PyH+shows a
more stable conformation (>10 kcal/mol) where the pyridinic protonated nitrogen and one nitrogen of the
triimidazole are facing each other, according to a geometry reminiscent of the proton sponges’ one [15]. The
small barrier (2 kcal/mol) between these two states allows the quantitative transformation from the higher
to the lower energy minimum at RT. In agreement, the TDDFT calculation has confirmed the origin of the red-
shifted fluorescence observed and the stable conformation calculated. Importantly, the absence of the low
energy fluorescence at 450 nm is predicted by the rigidity of the TT2PyH+ scaffold.
Figure 13: Scan of the relaxed potential energy surface of TT2PyH+ along the N7-C10-C2-C1 torsion angle, , at the (TD)-B97X/6-
311++G(d,p) level of theory. Energies are relative to the minimum energy geometry. Reproduced from ref.[2] free of charge,
https://pubs.rsc.org/en.
9.4 Conclusions In conclusion we can claim that TT2Py displays excitation-dependent emissions and in particular HEF, HEP,
MEP and LEF emissions of molecular origin, together with LEPs and DRP aggregated RTPs. The tunable
properties and the complex photophysic shown by this dye make TT2PY an elegible candidate for industrial
application in the anticounterfieding area, in the displays fabrication and in sensoristic field.

77
9.5 References [1] Lucenti, E.; Forni, A.; Botta, C.; Giannini, C.; Malpicci, D.; Marinotto, D.; Previtali, A.; Righetto, S.; Cariati,
E., Intrinsic and Extrinsic Heavy-Atom Effects on the Multifaceted Emissive Behavior of Cyclic Triimidazole.
Chemistry – A European Journal 2019, 25 (10), 2452-2456.
[2] Lucenti, E.; Forni, A.; Previtali, A.; Marinotto, D.; Malpicci, D.; Righetto, S.; Giannini, C.; Virgili, T.;
Kabacinski, P.; Ganzer, L.; Giovanella, U.; Botta, C.; Cariati, E., Unravelling the intricate photophysical behavior
of 3-(pyridin-2-yl)triimidazotriazine AIE and RTP polymorphs. Chemical Science 2020, 11 (29), 7599-7608.
[3] Cerullo, G.; Manzoni, C.; Lüer, L.; Polli, D., Time-resolved methods in biophysics. 4. Broadband pump–
probe spectroscopy system with sub-20 fs temporal resolution for the study of energy transfer processes in
photosynthesis. Photochemical & Photobiological Sciences 2007, 6 (2), 135-144.
[4] Borrego-Varillas, R.; Ganzer, L.; Cerullo, G.; Manzoni, C., Ultraviolet Transient Absorption Spectrometer
with Sub-20-fs Time Resolution. Applied Sciences 2018, 8 (6), 989.
[5] Svelto O. (2010), Principles of Lasers. Springer, Boston, MA. https://doi.org/10.1007/978-1-4419-1302-9
[6] Portone, A.; Ganzer, L.; Branchi, F.; Ramos, R.; Caldas, M. J.; Pisignano, D.; Molinari, E.; Cerullo, G.;
Persano, L.; Prezzi, D.; Virgili, T., Tailoring optical properties and stimulated emission in nanostructured
polythiophene. Scientific Reports 2019, 9 (1), 7370.
[7] Lucenti, E.; Forni, A.; Botta, C.; Carlucci, L.; Giannini, C.; Marinotto, D.; Previtali, A.; Righetto, S.; Cariati, E.,
H-Aggregates Granting Crystallization-Induced Emissive Behavior and Ultralong Phosphorescence from a
Pure Organic Molecule. The Journal of Physical Chemistry Letters 2017, 8 (8), 1894-1898.
[8] Lucenti, E.; Forni, A.; Botta, C.; Carlucci, L.; Giannini, C.; Marinotto, D.; Pavanello, A.; Previtali, A.; Righetto,
S.; Cariati, E., Cyclic Triimidazole Derivatives: Intriguing Examples of Multiple Emissions and Ultralong
Phosphorescence at Room Temperature. Angewandte Chemie International Edition 2017, 56 (51), 16302-
16307.
[9] Lucenti, E.; Forni, A.; Botta, C.; Carlucci, L.; Colombo, A.; Giannini, C.; Marinotto, D.; Previtali, A.; Righetto,
S.; Cariati, E., The Effect of Bromo Substituents on the Multifaceted Emissive and Crystal-Packing Features of
Cyclic Triimidazole Derivatives. ChemPhotoChem 2018, 2 (9), 801-805.
[10] Lucenti, E.; Forni, A.; Botta, C.; Giannini, C.; Malpicci, D.; Marinotto, D.; Previtali, A.; Righetto, S.; Cariati,
E., Intrinsic and Extrinsic Heavy-Atom Effects on the Multifaceted Emissive Behavior of Cyclic Triimidazole.
Chemistry – A European Journal 2019, 25 (10), 2452-2456.
[11] Kang, H.; Facchetti, A.; Zhu, P.; Jiang, H.; Yang, Y.; Cariati, E.; Righetto, S.; Ugo, R.; Zuccaccia, C.;
Macchioni, A.; Stern, C. L.; Liu, Z.; Ho, S.-T.; Marks, T. J., Exceptional Molecular Hyperpolarizabilities in Twisted
π-Electron System Chromophores. Angewandte Chemie International Edition 2005, 44 (48), 7922-7925.
[12] Wang, Y.; Yang, J.; Tian, Y.; Fang, M.; Liao, Q.; Wang, L.; Hu, W.; Tang, B. Z.; Li, Z., Persistent organic room
temperature phosphorescence: what is the role of molecular dimers? Chemical Science 2020, 11 (3), 833-
838.
[13] Bünzli, J.-C. G.; Piguet, C., Taking advantage of luminescent lanthanide ions. Chemical Society Reviews
2005, 34 (12), 1048-1077.
[14] Wu, Y.-H.; Xiao, H.; Chen, B.; Weiss, R. G.; Chen, Y.-Z.; Tung, C.-H.; Wu, L.-Z., Multiple-State Emissions
from Neat, Single-Component Molecular Solids: Suppression of Kasha's Rule. Angewandte Chemie
International Edition 2020, 59 (25), 10173-10178.

78
[15] Llamas-Saiz, A. L.; Foces-Foces, C.; Elguero, J., Proton sponges. Journal of Molecular Structure 1994, 328,
297-323.

79
10 TT-Pyrene derivative
10.1 Introduction The appealing of purely organic dyes has suffered from their well-known Aggregation Caused Quenching
(ACQ) behaviour especially in those fields requiring water as the main media since most of the more attractive
organic luminophores are nonpolar polycyclic aromatic hydrocarbons[1]. However, the ever growing
discovery of new, Aggregation Induced organic Emitters (AIE) with high quantum yields, has open up to the
possibility of using very unsoluble molecules in the biological area as markers for specific organelles or as
photodynamic therapy agents[2][3][4]. In this regard, the recently reported CIE (crystallization Induced
emission) and RTUP (room temperature ultralong phosphorescent) properties of triimidazo[1,2-a:1',2'-
c:1'',2''-e][1,3,5]triazine, TT[5][6], seem particularly intriguing from a biological point of view in which
autofluorescence and background interference problems cannot be completely overcome in direct
microscopy[7][8][9]. Experimentally, when using a strong intensity excitation source, dye photobleaching,
background interference and autofluorescence, are important concerns[10]. In particular, autofluorescence is
due to the fact that biological environment normally contains a large number of different chemicals some of
which emissive themselves (NAD, FAD, riboflavin, porphyrins). Luckily, most of them show a low intensity
signal which, however, becomes relevant with high intensity source. These interferences can be overcome
either by using a low intensity source with a very highly efficient emitter or, even more interestingly, a stable
phosphorescent dye whose signal is freed from prompt autofluorescence.
Unfortunately, being the emission intensity of TT strictly related to its crystallinity grade, the preparation of
small aggregate dispersion through the direct addition of the dye in a non-solvent results in a very weak
fluorescent signal due to the amorphous nature of the aggregates[11].
In order to solve this problem and obtain highly emissive aggregates we have decided, to couple TT with
pyrene (Pyr), a traditional ACQ emitter suffering from excimer whose formation could be inhibited by the
presence of the TT fragment[12][13].
10.2 Synthesis and Crystal Structure Analysis TTPyr can be synthetized in high yields by Suzuki coupling reaction between mono-brominated TT1Br [14] and
the corresponding boronic acid derivative (Scheme 1) and further purified by standard chromatography
techniques and crystallization.
Scheme 1: Syntethetic pathway for the preparation of TTPyr.
TTPyr forms long needled shaped crystals suitable for single crystal X-ray diffraction analysis by slow diffusion
of a non-solvent, such as HEX (TTPyr(H)), EtOH (TTPyr(Et)) or MeOH (TTPyr(Me)), in a DCM solution of the
chromophore.

80
Figure 1: X-ray structure of TTPyr(H) single crystal obtained from DCM/HEX.
TTPyr(H), obtained from a DCM/HEX solution, crystallizes in the monoclinic P21/c space group with the
asymmetric unit containing one molecule with Z=4. Molecules of TTPyr are characterized by a dihedral angle
() between Pyr and TT mean planes of 49.3°. The bond connecting the TT and Pyr units measures 1.470 Å.
The triimidazole unit of one molecule stacks in between two Pyr units of neighbour molecules with distances
of 3.78 and 4.04 Å between the TT and pyrene centroids forming infinite columns of H-aggregates. This
arrangement is unusual for the reported members of the TT-family, all having stacking interactions between
TT-units of adjacent molecules and represents an interesting case of study for the photophysical behaviour
associated with the presence of H aggregates (Figure 1)[15][16].
Figure 2: X-ray structure of TTPyr(Et) single crystal obtained from DCM/EtOH.
The ethanol solvated from, TTPyr(Et), has been isolated from DCM solution with EtOH. This solvate derivative
crystallize in the C2/c monoclic space group with the asymmetric unit containing one TTPyr molecule and
half molecule of ethanol which is disordered over two positions (Figure 2). The dihedral angle between the
mean planes of TT and pyrene fragments within a molecule is 46.8°. The ethanol molecule is disordered on
two positions allowing it to interact one by one via hydrogen bond with two TTPyr molecules (O-H···N = 3.261
Å) (Figure 2). The packing show that TTPyr molecules align in antiparallel fashion along the crystallographic
b direction giving rise to columns similar to that found in the crystal structure of TTPyr(H). Along this columns
TT and pyrene fragments are parallel disposed with alternating distances of 3.78 and 3.98 Å between their
respective centroids.
Intriguingly, another conformationally stable structure was obtain. In fact, trying to prepare better shaped
crystals we have thermally treated a semi-crystalline TTPyr(Me) sample few grades below its melting point
(m.p.= 232°C). By slowly cooling (0.2 °/min) the sample to RT, crystals of a new phase, TTPyr(HT), were
formed.

81
Figure 3: X-ray structure of TTPyr(HT) single crystal obtained after thermal treatment of a crystalline sample obtained from DCM/MeOH.
The anhydrous form obtained at high temperature, TTPyr(HT), crystallizes in the orthorhombic Pna21 space
group, the asymmetric unit contain one molecule with Z = 4. The dihedral angle between mean planes of TT
and pyrene in a molecule is 52.8°, slightly larger with respect to that found for the low temperature
polymorph (Figure 3). The packing here is completely different from that found for the LT form. The molecules
form columns along the crystallographic a direction and only the TT fragments are facing each other while
the pyrene units of adjacent molecules orient in opposite directions. Along the columns the mean planes of
two adjacent TT units are not parallel showing a dihedral angle of 8.2°. The distance between centroids of
adjacent TT fragments along the crystallographic a direction is 4.15 Å.
Thermal treatments have then been performed in order to prepare all the different phase/polymorphs
starting from TTPyr(Et). In particular, we have acquired the X-ray powders diffraction spectra of:
• Starting crystals
5,0 7,5 10,0 12,5
0,0
0,2
0,4
0,6
0,8
1,0
Inte
nsity
2
DCM/EtOH Experimental
DCM/EtOH Simulated
Figure 4: XRPD of TTPyr(Et) (Black line) and its simulated pattern (Red line).
TTPyr(Et) simulated spectra and the experimental one are identical except for a small shift, probably due to
instrumental factors, and the relative intensity of the peaks that is distorted by the preferential orientation
of the crystalline powders analysed (These considerations about the small discrepancy between simulated
and experimental spectra are valid even for the following experiments) (Figure 4).

82
• Crystals after 1h at 110°C
5,0 7,5 10,0 12,5 15,0
0,0
0,2
0,4
0,6
0,8
1,0
Inte
nsity
2
DCM/EtOH 110°C Experimental
DCM/EtOH Experimental
DCM/HEX Simulated
Figure 5: XRPD of TTPyr(Et) before (Red line) and after(Black line) thermal treatment at 110°C and TTPyr(H) simulated pattern.
The powders diffraction spectrum after the thermal treatment at 110°C perfectly matches with that of the
starting material indicating that the solvent is strongly bonded in the structure and higher temperatures are
needed for its removal (Figure 5).
• Crystals after 1h at 180°C
5,0 7,5 10,0 12,5
0,0
0,2
0,4
0,6
0,8
1,0
Inte
nsity
2
DCM/EtOH 180°C Experimental
DCM/EtOH Experimental
DCM/HEX Simulated
Figure 6: XRPD of TTPyr(Et) before (Red line) and after(Black line) thermal treatment at 180°C and TTPyr(H) simulated pattern.
The ethanol is efficiently removed when the sample is heated at 180°C resulting in the formation of TTPyr(H)
(Figure 6) which is the same phase obtained from DCM/HEX.

83
• Crystals after 2h at 220°C and slowly cooled to RT
5,0 7,5 10,0 12,5 15,0
0,0
0,2
0,4
0,6
0,8
1,0
Inte
nsity
2
DCM/EtOH 220°C Experimental
DCM/EtOH 180°C Experimental
HT Simulated
Figure 7: XRPD of TTPyr(Et) after thermal treatment at 180°C (Red line) and after thermal treatment at 220°C (Black line), and TTPyr(HT) simulated pattern.
Finally, the thermal treatment at 220°C allows to obtain the third phase TTPyr(HT) (Figure 7).
10.3 Photophysical characterization
10.3.1 DMSO Solutions Diluted DMSO solutions of TT-Pyr (10-5 M) show two absorptions with replicas at 257, 268, 279 nm and 332,
347 nm respectively; only slightly red-shifted with respect to those of pyrene itself in the same condition
(with peaks at 254, 264, 274 nm and 309, 322, 338 nm). At 298 K, the solution displays an intense fluorescent
emission peaked at 420 nm (Ф = 92%, τav= 2.76 ns) ascribable to deactivation from an excited state (S1) with
main pyrene character as suggested by the similarity of the corresponding excitation spectrum (displaying
components at 275 nm and 346 nm) with the absorption spectrum of pyrene itself (Figure 8).
400 500
10-5 M DMSO
exc = 280 nm
10-5 M DMSO
exc = 346 nm
PL
Inte
nsity
Wavelength (nm)
A
300 400 500
DMSO exc
= 420 nm
DMSO absorption
Op
tica
l A
bso
rban
ce
PL
Inte
nsity
Wavelength (nm)
B
Figure 8: A) Normalized emission spectra of TTPyr in DMSO 10-5M. λexc= 280 nm (Black line); λexc= 346 nm (Red line); B) Normalized excitation spectra of TTPyr. DMSO 10-5M. λem= 420 nm (Black line); DMSO 10-5 M Normalized absorbance (Red line).
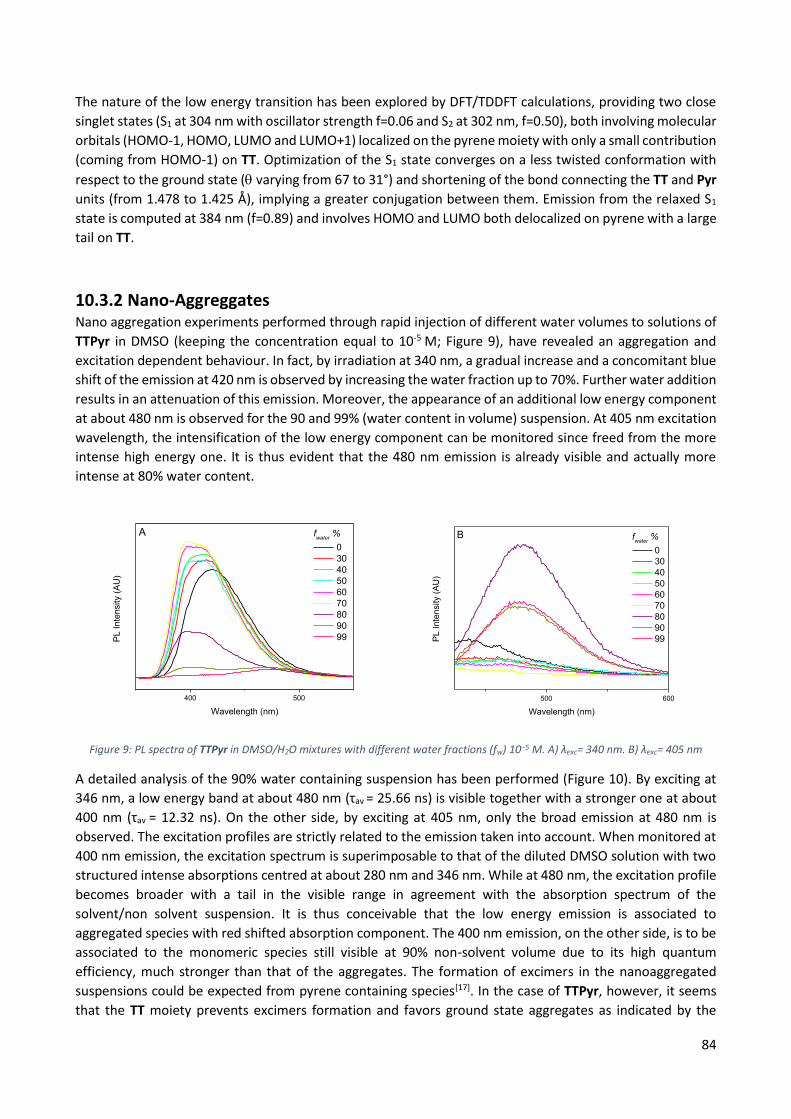
84
The nature of the low energy transition has been explored by DFT/TDDFT calculations, providing two close
singlet states (S1 at 304 nm with oscillator strength f=0.06 and S2 at 302 nm, f=0.50), both involving molecular
orbitals (HOMO-1, HOMO, LUMO and LUMO+1) localized on the pyrene moiety with only a small contribution
(coming from HOMO-1) on TT. Optimization of the S1 state converges on a less twisted conformation with
respect to the ground state ( varying from 67 to 31°) and shortening of the bond connecting the TT and Pyr
units (from 1.478 to 1.425 Å), implying a greater conjugation between them. Emission from the relaxed S1
state is computed at 384 nm (f=0.89) and involves HOMO and LUMO both delocalized on pyrene with a large
tail on TT.
10.3.2 Nano-Aggreggates Nano aggregation experiments performed through rapid injection of different water volumes to solutions of
TTPyr in DMSO (keeping the concentration equal to 10-5 M; Figure 9), have revealed an aggregation and
excitation dependent behaviour. In fact, by irradiation at 340 nm, a gradual increase and a concomitant blue
shift of the emission at 420 nm is observed by increasing the water fraction up to 70%. Further water addition
results in an attenuation of this emission. Moreover, the appearance of an additional low energy component
at about 480 nm is observed for the 90 and 99% (water content in volume) suspension. At 405 nm excitation
wavelength, the intensification of the low energy component can be monitored since freed from the more
intense high energy one. It is thus evident that the 480 nm emission is already visible and actually more
intense at 80% water content.
400 500
PL
Inte
nsity (
AU
)
Wavelength (nm)
fwater
%
0
30
40
50
60
70
80
90
99
A
500 600
PL
Inte
nsity (
AU
)
Wavelength (nm)
fwater
%
0
30
40
50
60
70
80
90
99
B
Figure 9: PL spectra of TTPyr in DMSO/H2O mixtures with different water fractions (fw) 10−5 M. A) λexc= 340 nm. B) λexc= 405 nm
A detailed analysis of the 90% water containing suspension has been performed (Figure 10). By exciting at
346 nm, a low energy band at about 480 nm (τav = 25.66 ns) is visible together with a stronger one at about
400 nm (τav = 12.32 ns). On the other side, by exciting at 405 nm, only the broad emission at 480 nm is
observed. The excitation profiles are strictly related to the emission taken into account. When monitored at
400 nm emission, the excitation spectrum is superimposable to that of the diluted DMSO solution with two
structured intense absorptions centred at about 280 nm and 346 nm. While at 480 nm, the excitation profile
becomes broader with a tail in the visible range in agreement with the absorption spectrum of the
solvent/non solvent suspension. It is thus conceivable that the low energy emission is associated to
aggregated species with red shifted absorption component. The 400 nm emission, on the other side, is to be
associated to the monomeric species still visible at 90% non-solvent volume due to its high quantum
efficiency, much stronger than that of the aggregates. The formation of excimers in the nanoaggregated
suspensions could be expected from pyrene containing species[17]. In the case of TTPyr, however, it seems
that the TT moiety prevents excimers formation and favors ground state aggregates as indicated by the

85
excitation dependent emission and the presence of an aggregate fingerprint absorption in the excitation
spectrum[18].
400 500 600
10-5 M agg
exc = 346 nm
10-5 M agg
exc = 405 nm
No
rma
lize
d P
L I
nte
nsity
Wavelength (nm)
A
300 400
10-5 M agg
em = 398 nm
10-5 M agg
em = 480 nm
PL
Inte
nsity
Wavelength (nm)
B
Figure 10: A) Normalized Emission spectra of TTPyr aggregates in DMSO/H2O (10/90 v/v) 10-5 M at 298 K λexc= 346 nm (Red line); λexc= 405 nm (Black line); B) Normalized Excitation spectra of TTPyr aggregates in DMSO/H2O (10/90 v/v) 10-5 M at 298 K λem= 398
nm (Red line); λem= 480 nm (Black line).
10.3.3 Crystals
10.3.3.1 TTPyr(Et) Crystals of TTPyr(Et) at RT display an intense fluorescence at 493 nm (Ф = 53.2%, τav= 2.97 ns) when excited
in the 300-400 nm range. Through selective excitation at 495 nm a phosphorescent component appears at
555 nm (τav= 4.90 ms) (Figure 11). The excitation spectrum monitored at 610 nm clearly shows the presence
of a direct triplet population at 525 nm which is furtherly intensify by lowering the temperature at 77K. At
low temperature, the two emissions become more vibronically resolved as shown by the structure shoulder
at 595 nm for the phosphorescence (τav= 5.37 ms) and at 460 and 520 nm for the fluorescence (τav= 4.17 ns)
(Figure 12).
250 300 350 400 450 500 550 600 650 700 750 800
PL
Inte
nsity (
au
)
Wavelength (nm)
exc
= 300 nm
exc
= 405 nm
exc
= 495 nm
em
= 494 nm
em
= 610 nm
TTPyr Cryst. DCM/EtOH RT
Figure 11: Normalized PL spectra of TTPyr(Et) crystals at 298K. λexc= 300 nm (Black line); λexc= 405 nm (Red line); λexc= 495 nm (Green line); ); λem= 494 nm (Blue line); λem= 610 nm (Orange line).

86
250 300 350 400 450 500 550 600 650 700 750 800
PL Inte
nsity (
au)
Wavelength (nm)
exc
= 300 nm
exc
= 405 nm
exc
= 495 nm
em
= 491 nm
em
= 617 nm
TTPyr Cryst. DCM/EtOH 77K
Figure 12: Normalized PL spectra of TTPyr(Et) crystals at 77K. λexc= 300 nm (Black line); λexc= 405 nm (Red line); λexc= 495 nm (Green line); ); λem= 491 nm (Blue line); λem= 617 nm (Orange line).
10.3.3.2 TTPyr(Me) TTPyr(Me) displays at RT a vibronically resolved fluorescent emission (470, 499 and 530 nm; Ф = 42.1 %;
τav= 3.38 ns) and a phosphorescent component (τav = 5.18 ms) (Figure 13) as already observed for TTPyr(Et).
250 300 350 400 450 500 550 600 650 700 750 800
PL
Inte
nsity (
au
)
Wavelength (nm)
exc
= 300 nm
exc
= 405 nm
exc
= 498 nm
em
= 498 nm
em
= 550 nm
TTPyr Cryst. DCM/MeOH RT
Figure 13: Normalized PL spectra of TTPyr(Me) crystals at 298K. λexc= 300 nm (Black line); λexc= 405 nm (Red line); λexc= 498 nm (Green line); ); λem= 498 nm (Blue line); λem= 550 nm (Orange line).

87
10.3.3.3 TTPyr(H) Some differences with respect to previous phases are observed for TTPyr(H). In particular, a small blue shift
and a lower vibronical resolution is measured for the fluorescent (491 nm; Ф = 38.2 %; τav= 3.03 ns) and the
phosphorescent (549 nm; τav = 4.54 ms) emissions with respect to TTPyr(Et) (Figure 14).
250 300 350 400 450 500 550 600 650 700 750 800
PL Inte
nsity (
au)
Wavelength (nm)
exc
= 300 nm
exc
= 405 nm
exc
= 490 nm
em
= 490 nm
em
= 555 nm
TTPyr Cryst. DCM/HEX RT
Figure 14: Normalized PL spectra of TTPyr(H) crystals at 298K. λexc= 300 nm (Black line); λexc= 405 nm (Red line); λexc= 490 nm (Green line); ); λem= 490 nm (Blue line); λem= 555 nm (Orange line).
10.3.3.4 TTPyr(HT) The high temperature polymorph, TTPyr(HT) (Ф = 43.0 %), displays an emissive behavior quite different from
that of the other phases. In fact, at room temperature, this polymorph shows a fluorescence at 480 nm (τav =
2.28 ns) and a quite intense phosphorescence at 546 nm (τav = 6.08 ms) (Figure 15). An additional high energy
fluorescence, which becomes better resolved lowering the temperature to 77K (Figure 16), is detected at 420
nm (τav = 1.01 ns). At 77 K all emissive components acquire a better vibronic resolution.
Moreover, the TTPyr(HT) phase crystallize in a non-centrosymmetric space group. This is a strict
requirement to have non-zero second order non-linear optical properties (NLO). The second harmonic
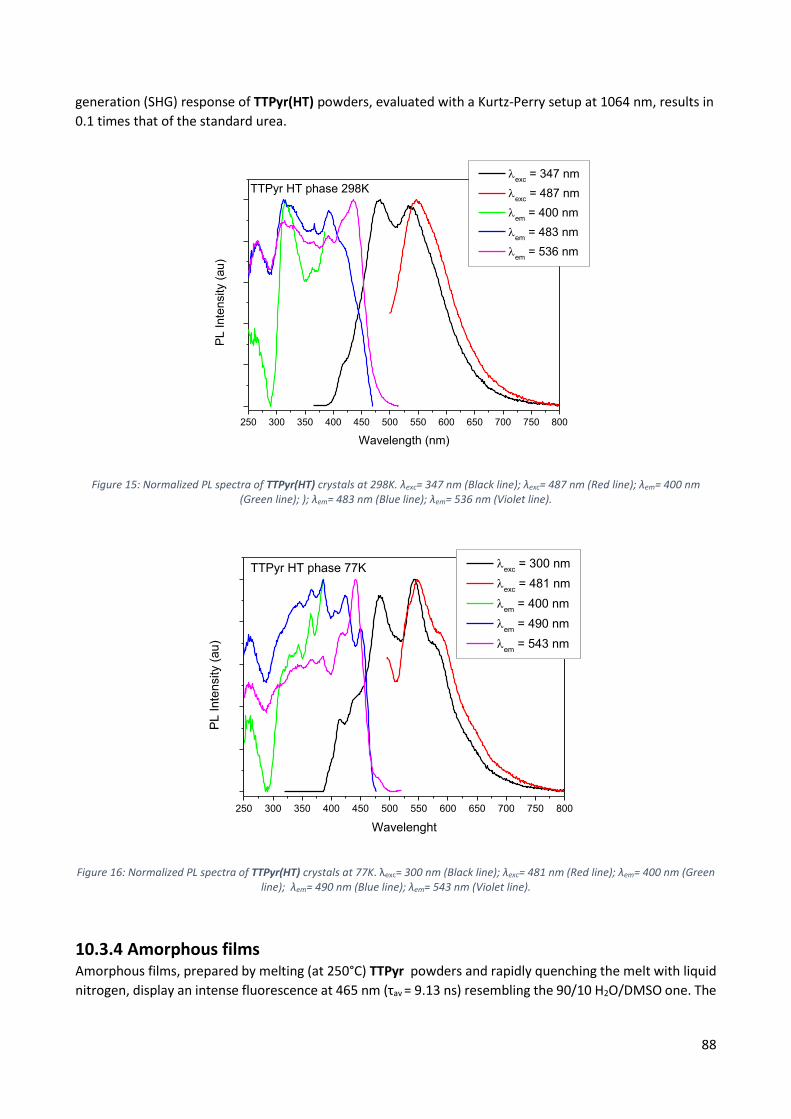
88
generation (SHG) response of TTPyr(HT) powders, evaluated with a Kurtz-Perry setup at 1064 nm, results in
0.1 times that of the standard urea.
250 300 350 400 450 500 550 600 650 700 750 800
exc
= 347 nm
exc
= 487 nm
em
= 400 nm
em
= 483 nm
em
= 536 nm
PL Inte
nsity (
au
)
Wavelength (nm)
TTPyr HT phase 298K
Figure 15: Normalized PL spectra of TTPyr(HT) crystals at 298K. λexc= 347 nm (Black line); λexc= 487 nm (Red line); λem= 400 nm (Green line); ); λem= 483 nm (Blue line); λem= 536 nm (Violet line).
250 300 350 400 450 500 550 600 650 700 750 800
exc
= 300 nm
exc
= 481 nm
em
= 400 nm
em
= 490 nm
em
= 543 nm
TTPyr HT phase 77K
PL
Inte
nsity (
au
)
Wavelenght
Figure 16: Normalized PL spectra of TTPyr(HT) crystals at 77K. λexc= 300 nm (Black line); λexc= 481 nm (Red line); λem= 400 nm (Green line); λem= 490 nm (Blue line); λem= 543 nm (Violet line).
10.3.4 Amorphous films Amorphous films, prepared by melting (at 250°C) TTPyr powders and rapidly quenching the melt with liquid
nitrogen, display an intense fluorescence at 465 nm (τav = 9.13 ns) resembling the 90/10 H2O/DMSO one. The

89
excitation spectrum at 470 nm is characterized by peaks at 265, 310 and 390 nm which are ascribable to the
pyrene moiety similarly to what observed for solutions and nano-aggregates (Figure 17).
250 300 350 400 450 500 550 600 650 700 750 800
exc
= 340 nm
em
= 470 nmP
L I
nte
nsity (
au
)
Wavelength (nm)
TTPyr Amorphous film RT
Figure 17: Normalized PL spectra of TTPyr amorphous film at 298K. λexc= 340 nm (Black line); λem= 470 nm (Red line).
10.3.5 Discussion All TTPyr phases display both short and long-lived components whose origin is still under investigation since
the isolation of all pure phases has revealed to be very time consuming. In particular, the effect of the
different packing arrangements (TTPyr(Et), TTPyr(Me) and TTPyr(H) display dual-component TT/pyrene H-
aggregation while in TTPyr(HT) only the triimidazolic fragments are involved in the H-aggregates) on the
emissive behavior of the different polymorphs require to be better and fully analyzed. From a preliminary
analysis, it seems that fluorescent emission in the solid state is significantly red-shifted (by about 60 and 30
nm) with respect to what observed in solution. Such red shift could be explained by the effect of packing
forces that impose a lower twisting of the two molecular moieties resulting in a higher conjugation. In fact,
a prototype dimeric DFT model has shown that the dihedral angle decreases from 67 (isolated monomer)
to 53°, approaching the X-ray value (46.8° for TTPyr(H) and 52.8 for TTPyr(HT)). The smaller red shift
measured for aggregates and amorphous film may be due to the formation of small dimers or small
aggregates that, as demonstrated by DFT calculations, can only partially force the planarization.
TTPyr(Et), TTPyr(Me) and TTPyr(H) share the same crystalline structure apart for the presence of disordered
methanol or ethanol molecules and small differences in the intermolecular distances. These differences seem
to have low impact on TTPyr photophysic, whose emissions appears only more vibronically structured when
O-H···N bonds are formed with solvents molecules. In the same direction, the structural rigidification
provided by the H-bonds formation seems to increase Ф, in particular ФTTPyr(Et) > ФTTPyr(Me) > ФTTPyr(H) [19;20]. Such
trend could be justified by the formation of better shaped crystals with EtOH with respect to MeOH for which
no crystals suitable for X-diffraction analysis have been obtained.
Reasonably, the phosphorescence observed for every polymorph may be associated to the H-aggregates
formation as for the previous cases described [11]. The high energy fluorescence detected at 420 nm for
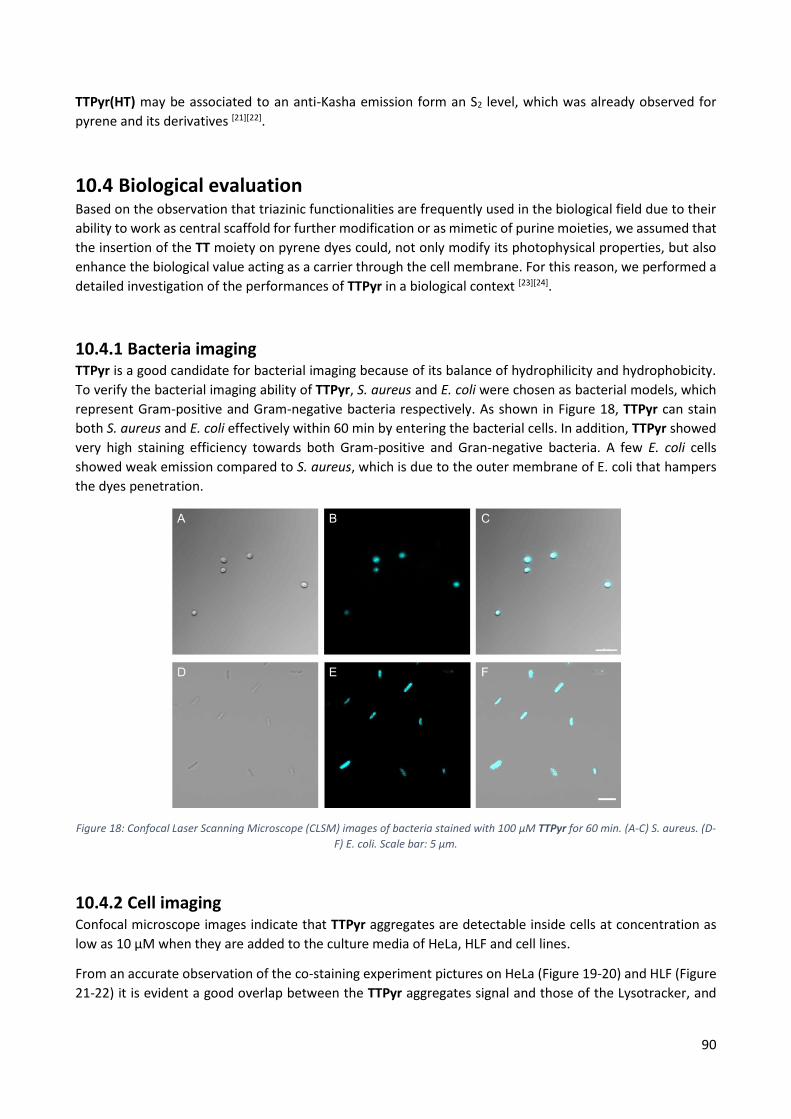
90
TTPyr(HT) may be associated to an anti-Kasha emission form an S2 level, which was already observed for
pyrene and its derivatives [21][22].
10.4 Biological evaluation Based on the observation that triazinic functionalities are frequently used in the biological field due to their
ability to work as central scaffold for further modification or as mimetic of purine moieties, we assumed that
the insertion of the TT moiety on pyrene dyes could, not only modify its photophysical properties, but also
enhance the biological value acting as a carrier through the cell membrane. For this reason, we performed a
detailed investigation of the performances of TTPyr in a biological context [23][24].
10.4.1 Bacteria imaging TTPyr is a good candidate for bacterial imaging because of its balance of hydrophilicity and hydrophobicity.
To verify the bacterial imaging ability of TTPyr, S. aureus and E. coli were chosen as bacterial models, which
represent Gram-positive and Gram-negative bacteria respectively. As shown in Figure 18, TTPyr can stain
both S. aureus and E. coli effectively within 60 min by entering the bacterial cells. In addition, TTPyr showed
very high staining efficiency towards both Gram-positive and Gran-negative bacteria. A few E. coli cells
showed weak emission compared to S. aureus, which is due to the outer membrane of E. coli that hampers
the dyes penetration.
Figure 18: Confocal Laser Scanning Microscope (CLSM) images of bacteria stained with 100 μM TTPyr for 60 min. (A-C) S. aureus. (D-
F) E. coli. Scale bar: 5 µm.
10.4.2 Cell imaging Confocal microscope images indicate that TTPyr aggregates are detectable inside cells at concentration as
low as 10 μM when they are added to the culture media of HeLa, HLF and cell lines.
From an accurate observation of the co-staining experiment pictures on HeLa (Figure 19-20) and HLF (Figure
21-22) it is evident a good overlap between the TTPyr aggregates signal and those of the Lysotracker, and

91
BODIPY 493/503, in particular in HLF cells. Only a partial overlap between TTPyr and Mitotracker signals is
detected.
Figure 19: HeLa cells co-staining experiment. A) MitoTracker Deep Red. B) LysoTracker Green DND 26. C) TTPyr 10 uM. D) Bright field. E) On screen axial fluorescent intensity of TTPyr, MitoTracker and LysoTracker. F) The fluorescence intensities of MTDR, LTG,
TTPyr along the axis.
Figure 20: HeLa cell co-staining experiment. A) Bright field. B) TTPyr 10 μM. C) BODIPY 493/503. D) Merged image of A-C. E) On screen axial fluorescent intensity of TTPyr and BODIPY 493/503. F) The fluorescence intensities of TTPyr and BODIPY 493/503 along
the axis.
Curiously, this means that the cells accumulate TTPyr aggregates in lysosomes and lipid droplets as if they
were trying to degrade or at list contain the chromophore that, however, seems to be widespread throughout
the cytoplasm. This attempt to eliminate the dye from the cells is a clear indication of TTPyr toxicity. In fact,
after sufficiently long staining time, TTPyr seems to be not well metabolized by the cells as revealed by their
round shape and the high number of vesicles which are indicative of a general unhealthy condition.

92
Figure 21: HLF cell co-staining experiment. A) MitoTracker Deep Red. B) LysoTracker Green DND 26. C) TTPyr 10 uM. D) Bright field. E) On screen axial fluorescent intensity of TTPyr, MitoTracker and LysoTracker. F) Fluorescence intensities of MTDR, LTG, TTPyr
along the axis.
Figure 22: HLF cell co-staining experiment. A) Bright field. B) TTPyr 10 μM. C) BODIPY 493/503. D) Merged image of A-C. E) On screen axial fluorescent intensity of TTPyr and BODIPY 493/503. F) The fluorescence intensities of TTPyr and BODIPY 493/503 along
the axis.
To certify the presence of TTPyr inside the cells, we have acquired the in-situ steady state spectra. As clearly
visible in Figure 23, there is a perfect match between the in-situ spectra and the one obtained with the 90%
non-solvent aggregate previously described.

93
400 450 500 550 600 650 700
TTPyr
Flu
ore
sc
en
ce
In
ten
sit
y
Emission Wavelength (nm)
Figure 23: In-situ emission spectra of 10 μM TTPyr (right) in HeLa cells obtained on CLSM. λexc = 405 nm.
In agreement with staining experiments, the MTT test (Figure 24) points out a major cytotoxicity of TTPyr. It
is expected, in fact, that the binding of TTPyr with the Mitocondria, as highlighted by the staining
experiments, could lead to the invalidation of the ATP production process causing the death of the cells.
Moreover, TTPyr showed more toxicity towards HeLa cells, which could attributed to the stronger metabolism
of HeLa cells compared to HLF cells.
0
20
40
60
80
100
120
Ce
ll V
iab
ilit
y (
%)
HeLa
HLF
0 0.3 0.6 1.2 5 102.5 20
Concentration (M)
40
Figure 24: Cell viability of HeLa cells and HLF cells treated with different concentrations of TTPyr.
10.5 Conclusions In conclusion, the high quantum efficiency shown by TTPyr solutions, aggregates and crystalline powders
makes this material an appealing resource in view of further application. In addition to the great staining
ability of this dye, its use as sensing fluorophore for the detection of explosives is ongoing and the preliminary
data are promising. A detailed analysis of TTPyr behavior is still to be completed but from the results obtained
so far some statements can be made. In particular, the conjugation of TT with pyrene does not prevent the
H-aggregates formation and the arise of the associated phosphorescence. Moreover, the flat structure of
pyrene allows to form mixed pyrene/TT H-aggregates in TTPyr(H), -(Me) and -(Et) which, from a comparison

94
with the TTPyr(HT) one, seems to be as efficient as the “pure” TT/TT H-aggregates in the generation and
stabilization of triplet excitons.
In view of the good results obtained with pyrene, triimidazole could be introduced as substituent on other
flat scaffolds in order to switch on or to enhance phosphorescent emissions.

95
10.6 References [1] Bandyopadhyay, D.; Sanchez, J. L.; Guerrero, A. M.; Chang, F.-M.; Granados, J. C.; Short, J. D.; Banik, B. K.,
Design, synthesis and biological evaluation of novel pyrenyl derivatives as anticancer agents. European
Journal of Medicinal Chemistry 2015, 89, 851-862.
[2] Islam, M. M.; Hu, Z.; Wang, Q.; Redshaw, C.; Feng, X., Pyrene-based aggregation-induced emission
luminogens and their applications. Materials Chemistry Frontiers 2019, 3 (5), 762-781 .
[3] Schnermann, M. J., Organic dyes for deep bioimaging. Nature 2017, 551 (7679), 176-177 .
[4] Banerji, B.; Chatterjee, S.; Chandrasekhar, K.; Ghosh, S.; Mukherjee, K.; Mandal, C., Detection of Lysosome
by a Fluorescent Heterocycle: Development of Fused Pyrido–Imidazo–Indole Framework via Cu-Catalyzed
Tandem N-Arylation. The Journal of Organic Chemistry 2018, 83 (21), 13011-13018.
[5] Schubert, D. M.; Natan, D. T.; Wilson, D. C.; Hardcastle, K. I., Facile Synthesis and Structures of Cyclic
Triimidazole and Its Boric Acid Adduct. Crystal Growth & Design 2011, 11 (3), 843-850.
[6] Buck, D. M.; Kunz, D., Triazine Annelated NHC Featuring Unprecedented Coordination Versatility.
Organometallics 2015, 34 (21), 5335-5340.
[7] Chelushkin, P. S.; Tunik, S. P., Phosphorescence Lifetime Imaging (PLIM): State of the Art and Perspectives.
2019, 119, 109-128.
[8] Berezin, M. Y.; Achilefu, S., Fluorescence Lifetime Measurements and Biological Imaging. Chemical
Reviews 2010, 110 (5), 2641-2684 .
[9] Baggaley, E.; Sazanovich, I. V.; Williams, J. A. G.; Haycock, J. W.; Botchway, S. W.; Weinstein, J. A., Two-
photon phosphorescence lifetime imaging of cells and tissues using a long-lived cyclometallated
Npyridyl^Cphenyl^Npyridyl Pt(ii) complex. RSC Advances 2014, 4 (66), 35003-35008 .
[10] Fu, Y.; Finney, N. S., Small-molecule fluorescent probes and their design. RSC Advances 2018, 8 (51),
29051-29061.
[11] Lucenti, E.; Forni, A.; Botta, C.; Carlucci, L.; Giannini, C.; Marinotto, D.; Previtali, A.; Righetto, S.; Cariati,
E., H-Aggregates Granting Crystallization-Induced Emissive Behavior and Ultralong Phosphorescence from a
Pure Organic Molecule. The Journal of Physical Chemistry Letters 2017, 8 (8), 1894-1898.
[12] Nie, H.; Liang, Y.; Han, C.; Zhang, R.; Zhang, X.; Yan, H., Rational design of cyanovinyl-pyrene dual-
emission AIEgens for potential application in dual-channel imaging and ratiometric sensing in living cells. Dyes
and Pigments 2019, 168, 42-48.
[13] Qian, J.; Tang, B. Z., AIE Luminogens for Bioimaging and Theranostics: From Organelles to Animals. Chem
2017, 3 (1), 56-91 .
[14] Lucenti, E.; Forni, A.; Botta, C.; Carlucci, L.; Giannini, C.; Marinotto, D.; Pavanello, A.; Previtali, A.;
Righetto, S.; Cariati, E., Cyclic Triimidazole Derivatives: Intriguing Examples of Multiple Emissions and
Ultralong Phosphorescence at Room Temperature. Angewandte Chemie International Edition 2017, 56 (51),
16302-16307.
[15] Yuan, J.; Wang, S.; Ji, Y.; Chen, R.; Zhu, Q.; Wang, Y.; Zheng, C.; Tao, Y.; Fan, Q.; Huang, W., Invoking
ultralong room temperature phosphorescence of purely organic compounds through H-aggregation
engineering. Materials Horizons 2019, 6 (6), 1259-1264.
[16] Forni, A.; Lucenti, E.; Botta, C.; Cariati, E., Metal free room temperature phosphorescence from
molecular self-interactions in the solid state. Journal of Materials Chemistry C 2018, 6 (17), 4603-4626.

96
[17] Van Dyke, D. A.; Pryor, B. A.; Smith, P. G.; Topp, M. R., Nanosecond Time-Resolved Fluorescence
Spectroscopy in the Physical Chemistry Laboratory: Formation of the Pyrene Excimer in Solution. Journal of
Chemical Education 1998, 75 (5), 615.
[18] Zhao, Z.; Chen, S.; Lam, J. W. Y.; Lu, P.; Zhong, Y.; Wong, K. S.; Kwok, H. S.; Tang, B. Z., Creation of highly
efficient solid emitter by decorating pyrene core with AIE-active tetraphenylethene peripheries. Chemical
Communications 2010, 46 (13), 2221-2223.
[19] Yang, S.; Yin, P.-A.; Li, L.; Peng, Q.; Gu, X.; Gao, G.; You, J.; Tang, B. Z., Crystallization-Induced Reversal
from Dark to Bright Excited States for Construction of Solid-Emission-Tunable Squaraines. Angewandte
Chemie International Edition 2020, 59 (25), 10136-10142.
[20] Ji, Y.; Peng, Z.; Tong, B.; Shi, J.; Zhi, J.; Dong, Y., Polymorphism-dependent aggregation-induced emission
of pyrrolopyrrole-based derivative and its multi-stimuli response behaviors. Dyes and Pigments 2017, 139,
664-671.
[21] Baba, H.; Nakajima, A.; Aoi, M.; Chihara, K., Fluorescence from the Second Excited Singlet State and
Radiationless Processes in Pyrene Vapor. The Journal of Chemical Physics 1971, 55 (5), 2433-2438.
[21] Geldof, P. A.; Rettschnick, R. P. H.; Hoytink, G. J., Fluorescence from the second excited singlets of pyrene
and 3,4-benzpyrene. Chemical Physics Letters 1969, 4 (2), 59-61.
[23] Shah, D. R.; Modh, R. P.; Chikhalia, K. H., Privileged s-triazines: structure and pharmacological
applications. Future Medicinal Chemistry 2014, 6 (4), 463-477.
[24] Chauhan, K.; Sharma, M.; Shivahare, R.; Debnath, U.; Gupta, S.; Prabhakar, Y. S.; Chauhan, P. M. S.,
Discovery of Triazine Mimetics As Potent Antileishmanial Agents. ACS Medicinal Chemistry Letters 2013, 4
(11), 1108-1113.

97
11 Ag(I) and Cu(I) cyclic-triimidazole coordination polymers
11.1 Introduction
The fundamental properties of emissive coordination compounds of monovalent coinage d10 metals Cu(I) and
Ag(I), have been the subject of extensive investigation in view of their possible applications in different fields
spanning from OLEDs to biological sensors[1-6]. In particular, Cu(I) coordination compounds have received
remarkable attention due to their usually high quantum efficiency, Cu low-cost and natural abundance.
Silver(I) compounds, on the other hand, have received much less attention mainly due to their usually high
light sensitivity.
d10 metal coordination polymers are known to display various structural formats characterized by strikingly
different emissive behavior. Among them, the double-stranded stair-step polymeric structure, {MXL} (with
M = d10 metal, X = Br, I and L = organic ligand), is a quite common motif for Cu(I) compounds[7]. On the other
side, very few Ag(I) double-stranded structures have been reported[8] and in only one study the photophysical
characterization of the two investigated compounds have been reported[9].
Based on the presence at the vertex of a regular triangle of three nitrogen atoms available for coordination
to metal ions, TT appears as a useful tecton to prepare coordination compounds and we have decided to test
the coordination capability of TT in presence of Cu(I) and Ag(I) moieties. From this work, a quite interesting
photophysical comparative analysis has been performed on two isostructural Cu(I) and Ag(I) double-stranded
stair-step polymers as reported in the following.
11.2 Results and discussion
11.2.1 1D [Ag(TT)I]n, 1-Ag
Crystals of the 1D coordination polymer [Ag(TT)I]n, hereafter 1-Ag, have been obtained by slow addition of
an acetonitrile (CH3CN) solution of TT to a saturated aqueous solution of AgI in KI or to a solution of AgI and
KI in N,N-dimethylformamide (DMF).
Figure 1: Crystal structure of 1-Ag. a) Ag(I) coordination sphere. b) Stair motif. c) Crystal packing along b axis.
1-Ag crystallizes in the P21/c monoclinic spatial group with an asymmetric unit containing one molecule of
TT, one silver ion and one iodide ion. The silver ion displays a distorted tetrahedral geometry, AgI3N-like,
(Figure 1a) with a TT nitrogen and three μ3-iodine ions which adopt a distorted trigonal pyramidal geometry
(Ag-I distances equal to: 2.869, 2.812, 2.936 Å and Ag-N: 2.331 Å; the angles formed around the silver ion are
included between 94.35 and 123.35°). The μ3-iodine ions generate a 1D stair motif [AgI]n with decorative TT

98
molecules on both sides (Figure 1b). The Ag···Ag distance is 3.192 Å significantly shorter than the sum of the
Van der Waals radii (3.44 Å). The TT ligand molecules on the two sides of the stairs form stack parallel with
distances between the triazinic centroids equal to 4.737 Å (Figure 1c). Columns belonging to the same stairs
are almost orthogonal with angles between the mean planes of adjacent ligands of different columns equal
to 85.0°. In agreement with the presence of a twofold screw axis along the b direction the ligands disposition
forms a helical stair motif but adjacent stairs have opposite handedness thus the packing is centrosymmetric
(Figure 2).
Figure 2: Portion of the coordination polymer [Ag(TT)I]n, the opposite helicity of antiguous stairs is evident.
Crystals of 1-Ag at 298 K display an intricate emissive behavior characterized by the concomitant presence of
fast and long lived components (overall quantum efficiency, Ф, equal to 19%) with relative intensities varying
according to the excitation energy and covering a large portion (from 385 to 700 nm) of the visible spectrum
(see Figure 3).
Figure 3: Normalized emission end excitation spectra of crystals of 1-Ag at 298 K. Top: PL spectra (solid line) at λexc = 397 nm (pink line), λexc = 390 nm (blue line), λexc = 355 nm (green line), λexc = 341 nm (black line) and PLE spectra (dotted line) at λem = 410 nm
(blue line), λem = 430 nm (pink line), λem = 495 nm (green line), λem = 530 nm (black line). Bottom: phosphorescence spectra (blue line,
delay 200 s, window 500 s, λexc = 360 nm; red line, delay 100 s, window 500 s, λexc = 397 nm).
300 400 500 600 700
Em
issio
n Inte
nsity
Wavelength (nm)
FL
MEP
LEPHEPRT
300 400 500 600 700
Em
issio
n Inte
nsity
Wavelength (nm)
MEP
LEP
FL
HEP LT
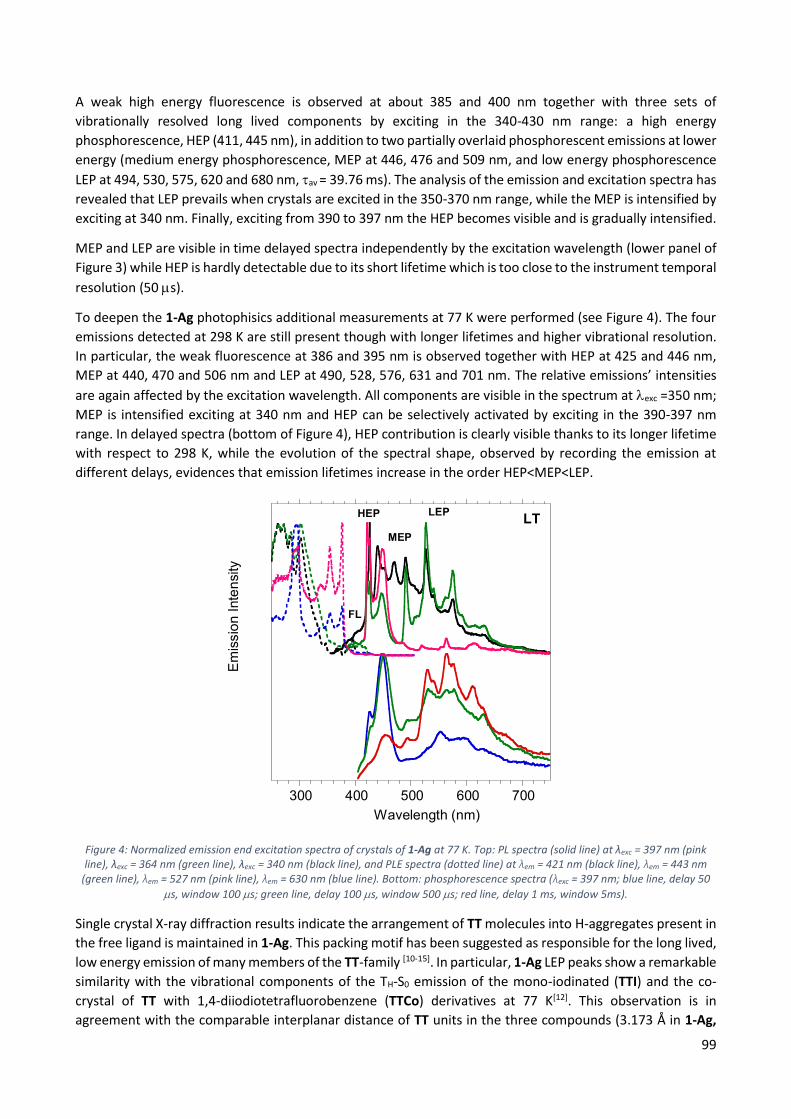
99
A weak high energy fluorescence is observed at about 385 and 400 nm together with three sets of
vibrationally resolved long lived components by exciting in the 340-430 nm range: a high energy
phosphorescence, HEP (411, 445 nm), in addition to two partially overlaid phosphorescent emissions at lower
energy (medium energy phosphorescence, MEP at 446, 476 and 509 nm, and low energy phosphorescence
LEP at 494, 530, 575, 620 and 680 nm, av = 39.76 ms). The analysis of the emission and excitation spectra has
revealed that LEP prevails when crystals are excited in the 350-370 nm range, while the MEP is intensified by
exciting at 340 nm. Finally, exciting from 390 to 397 nm the HEP becomes visible and is gradually intensified.
MEP and LEP are visible in time delayed spectra independently by the excitation wavelength (lower panel of
Figure 3) while HEP is hardly detectable due to its short lifetime which is too close to the instrument temporal
resolution (50 s).
To deepen the 1-Ag photophisics additional measurements at 77 K were performed (see Figure 4). The four
emissions detected at 298 K are still present though with longer lifetimes and higher vibrational resolution.
In particular, the weak fluorescence at 386 and 395 nm is observed together with HEP at 425 and 446 nm,
MEP at 440, 470 and 506 nm and LEP at 490, 528, 576, 631 and 701 nm. The relative emissions’ intensities
are again affected by the excitation wavelength. All components are visible in the spectrum at exc =350 nm;
MEP is intensified exciting at 340 nm and HEP can be selectively activated by exciting in the 390-397 nm
range. In delayed spectra (bottom of Figure 4), HEP contribution is clearly visible thanks to its longer lifetime
with respect to 298 K, while the evolution of the spectral shape, observed by recording the emission at
different delays, evidences that emission lifetimes increase in the order HEP<MEP<LEP.
Figure 4: Normalized emission end excitation spectra of crystals of 1-Ag at 77 K. Top: PL spectra (solid line) at λexc = 397 nm (pink line), λexc = 364 nm (green line), λexc = 340 nm (black line), and PLE spectra (dotted line) at λem = 421 nm (black line), λem = 443 nm
(green line), λem = 527 nm (pink line), λem = 630 nm (blue line). Bottom: phosphorescence spectra (λexc = 397 nm; blue line, delay 50
s, window 100 s; green line, delay 100 s, window 500 s; red line, delay 1 ms, window 5ms).
Single crystal X-ray diffraction results indicate the arrangement of TT molecules into H-aggregates present in
the free ligand is maintained in 1-Ag. This packing motif has been suggested as responsible for the long lived,
low energy emission of many members of the TT-family [10-15]. In particular, 1-Ag LEP peaks show a remarkable
similarity with the vibrational components of the TH-S0 emission of the mono-iodinated (TTI) and the co-
crystal of TT with 1,4-diiodiotetrafluorobenzene (TTCo) derivatives at 77 K[12]. This observation is in
agreement with the comparable interplanar distance of TT units in the three compounds (3.173 Å in 1-Ag,
300 400 500 600 700
Em
issio
n Inte
nsity
Wavelength (nm)
FL
MEP
LEPHEPRT
300 400 500 600 700
Em
issio
n Inte
nsity
Wavelength (nm)
MEP
LEP
FL
HEP LT

100
3.309 Å in TTI and 3.332, 3.488 Å in TTCo). Therefore, it is reasonable to assign LEP to deactivation from TH.
Impressively, close inspection of the 77 K emission spectra of 1-Ag, TTI and TTCo, reveals the same pattern
for the MEP of the former with emission from TI of the two latter. Such phosphorescence was previously
ascribed to the IN halogen bonding interaction which is present in the structures of TTI and TTCo, but
absent in 1-Ag. However, based on the similarity in position and shape of the emissions of the three systems,
all containing TT and I atoms, it seems possible a common origin (TI-S0) with a mechanism different from the
one previously suggested. Looking at the shorter contacts between adjacent stairs (in 1-Ag), helices (in TTI)
and chains (in TTCo) involving iodine atom, it is found that the three structures share a comparable IC
distance of 3.664, 3.764 and 3.736 Å compatible with intermolecular electronic coupling of two units with
partial orbital overlapping[16].
In agreement with previous findings[13][15] and theoretical calculation, HEP has to be assign to deactivation
from a ligand centered triplet state (TM-S0, where M stands for “molecular” in order to distinguish its origin
from the supramolecular one of LEP and MEP). Furtherly, the ligand centered nature of the TM-S0
phosphorescence is supported by the energy spacing (about 1300-1550 cm-1) of its vibrational components
which can be associated to a vibronic progression involving imidazole ring modes[17]. Similar values are
calculated for the vibrational peaks of MEP and LEP, having themselves a negligible contribution from the
metal.
11.2.2 1D [Cu(TT)I]n, 1-Cu Crystals of the 1D coordination polymer [Cu(TT)I]n, hereafter 1-Cu, have been obtained by addition of an
acetonitrile (CH3CN) solution of TT to a saturated aqueous solution of CuI in KI. After one night at room
temperature colorless needle-shaped 1-Cu crystals are filtered out from the solution. Single crystal X-ray
diffraction analysis revealed that 1-Cu and 1-Ag are isostructural.
Figure 5: Crystal structure of 1-Cu: a) Ag(I) coordination sphere. b) Stair motif. c) Crystal packing along b axis. Reproduced with permission from ref.[1] © 2019, American Chemical Society.
The 1D double-stranded stair motif of [CuI]n composition is quite commonly encountered for Cu(I)
coordination polymers (Figure 5a). 1-Cu crystallizes in the monoclinic P21/c space group with an asymmetric
unit containing one molecule of TT, one Cu(I) ion and one iodide ion. The copper ion displays a distorted
tetrahedral geometry, CuI3N-like, where the three μ3-iodide form a distorted trigonal pyramid (Cu-I distances
equal to: 2.611, 2.723, 2.772 Å and Cu-N: 2.028 Å; the angles formed around the copper ion are between
99.16−129.41°). As in the 1-Ag case, the μ3-iodine ions generate a 1D stair motif [CuI]n with decorative TT
molecules on both sides (Figure 5b). Unlike 1-Ag, the Cu···Cu distances (3.248 Å) are longer than the sum of
the Cu(I) ions van der Waals radii and so no interaction between metal centres can be assumed. The TT ligand
molecules on the two sides of the stair form stack parallel with a distance of 3.173 Å between their mean
planes and a distance of 4.509 Å between triazinic centroids. Columns belonging to the same stairs are almost
orthogonal with angles between the mean planes of adjacent ligands of different columns equal to 89.4°. In
a) b) c)

101
agreement with the presence of a twofold screw axis along the b direction the ligands disposition forms a
helical stair motif but adjacent stairs have opposite handedness thus the packing is centrosymmetric (Figure
5c).
By exciting 1-Cu crystals in the 300-360 nm region, the emission spectrum is dominated by an intense 3MLCT
(TM-S0) phosphorescence (τav = 32 s) (upper panel figure 6 ). However, by exciting the sample with longer
wavelength (exc >390 nm), two less intense vibronically resolved phosphorescences are detected (upper
panel of Figure 6). Specifically, at room temperature a lower energy and longer lived (τav = 302 µs) component,
LEP, peaked at 536, 582, 623 nm, impressively overlapped with the 1-Ag analogue one (the two compounds
sharing an identical interplanar TT distance equal to 3.173 Å) and a higher energy phosphorescence with
peaks at 431, 460 and 487 nm, are collected for 1-Cu (lower panel figure 6). This latter component in the 1-
Ag analogue lies in-between HEP and MEP. However, at 77 K it has revealed its close similarity with 1-Ag MEP
and since the IC interstep distance, 3.721 Å, is compatible with intermolecular electronic coupling, it is
reasonable to use the same acronym (MEP, TI-S0 emission) to refer also to it. Notably, the shorter IC
distance of 1-Ag, 3.664 Å, can justify its MEP lower energy. In the delayed spectrum at room temperature,
only the longer lived LEP is visible (lower panel figure 6).
Figure 6: Normalized emission and excitation spectra of crystals of 1-Cu at 298 K. Top: PL spectra (solid line) at λexc = 300 nm (green line), λexc = 390 nm (black line) and PLE spectra (dotted line) at λem = 460 nm (black line), λem = 563 nm (green line). Bottom:
phosphorescence spectrum (λexc = 420 nm; black line, delay 100 s, window 500 s).
The similarity of LEP detected for 1-Cu, 1-Ag, TTI and TTCo, supports its ligand’s H-aggregation origin (TH-S0)
also for the copper derivative. From the comparison between the isostructural 1-Cu and 1-Ag, it is clear that
the metal plays on LEP a secondary role and can be therefore referred to as an “external” perturber[13]. The
same observation can be made for MEP of the two compounds, in agreement with its IC intermolecular
electronic coupling origin. The metal secondary effect results in shorter emission lifetimes for MEP and LEP
of 1-Cu having a lower atomic number.
In the emission spectra collected at 77 K (see Figure 7) the broad band at 568 nm with MLCT character excited
at high energy (300-340 nm) is still present together with the structured LEP and MEP (better isolated when
exciting between 390-420 nm) (upper panel figure 7). Time delayed experiments have revealed the overlap
between the MEP and the LEP, with the latter displaying narrow peaks whose relative intensity varies with
300 400 500 600 700
Em
issio
n Inte
nsity
Wavelength (nm)
LEP
MEP
RTT
M-S
0
300 400 500 600 700
Em
issio
n I
nte
nsity
Wavelength (nm)
LEPMEP
TM-S
0 LT
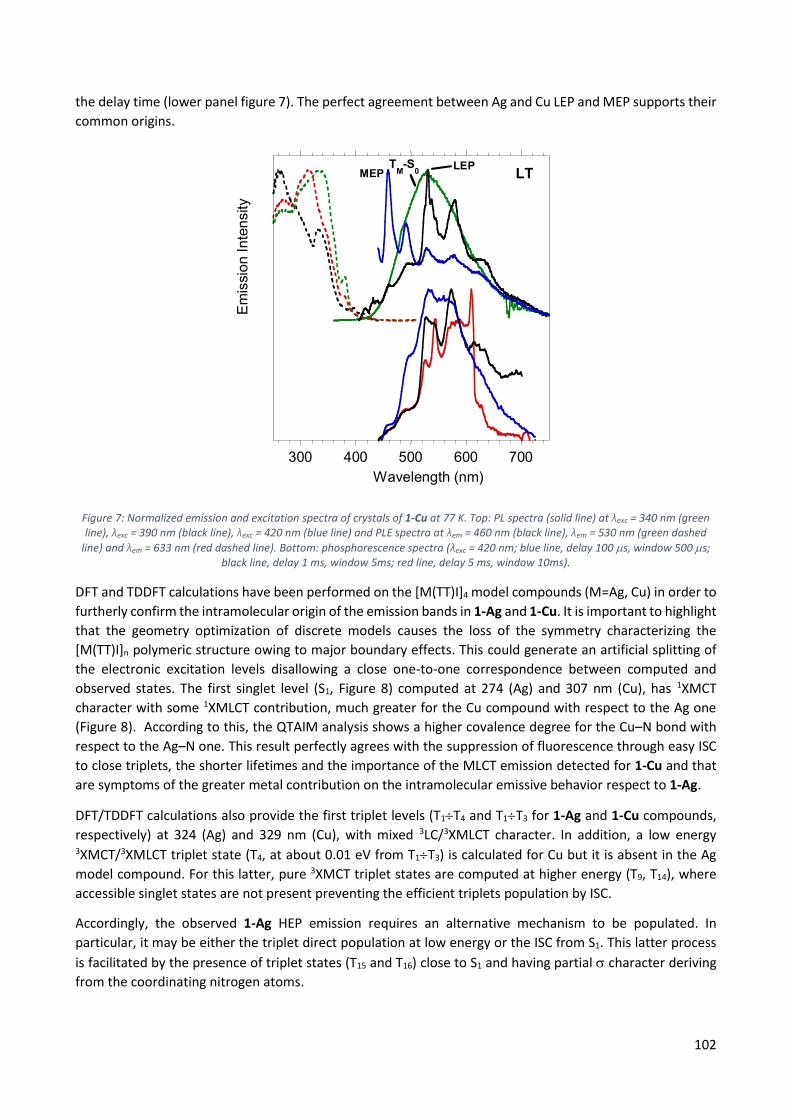
102
the delay time (lower panel figure 7). The perfect agreement between Ag and Cu LEP and MEP supports their
common origins.
Figure 7: Normalized emission and excitation spectra of crystals of 1-Cu at 77 K. Top: PL spectra (solid line) at λexc = 340 nm (green line), λexc = 390 nm (black line), λexc = 420 nm (blue line) and PLE spectra at λem = 460 nm (black line), λem = 530 nm (green dashed
line) and λem = 633 nm (red dashed line). Bottom: phosphorescence spectra (λexc = 420 nm; blue line, delay 100 s, window 500 s; black line, delay 1 ms, window 5ms; red line, delay 5 ms, window 10ms).
DFT and TDDFT calculations have been performed on the [M(TT)I]4 model compounds (M=Ag, Cu) in order to
furtherly confirm the intramolecular origin of the emission bands in 1-Ag and 1-Cu. It is important to highlight
that the geometry optimization of discrete models causes the loss of the symmetry characterizing the
[M(TT)I]n polymeric structure owing to major boundary effects. This could generate an artificial splitting of
the electronic excitation levels disallowing a close one-to-one correspondence between computed and
observed states. The first singlet level (S1, Figure 8) computed at 274 (Ag) and 307 nm (Cu), has 1XMCT
character with some 1XMLCT contribution, much greater for the Cu compound with respect to the Ag one
(Figure 8). According to this, the QTAIM analysis shows a higher covalence degree for the Cu–N bond with
respect to the Ag–N one. This result perfectly agrees with the suppression of fluorescence through easy ISC
to close triplets, the shorter lifetimes and the importance of the MLCT emission detected for 1-Cu and that
are symptoms of the greater metal contribution on the intramolecular emissive behavior respect to 1-Ag.
DFT/TDDFT calculations also provide the first triplet levels (T1T4 and T1T3 for 1-Ag and 1-Cu compounds,
respectively) at 324 (Ag) and 329 nm (Cu), with mixed 3LC/3XMLCT character. In addition, a low energy 3XMCT/3XMLCT triplet state (T4, at about 0.01 eV from T1T3) is calculated for Cu but it is absent in the Ag
model compound. For this latter, pure 3XMCT triplet states are computed at higher energy (T9, T14), where
accessible singlet states are not present preventing the efficient triplets population by ISC.
Accordingly, the observed 1-Ag HEP emission requires an alternative mechanism to be populated. In
particular, it may be either the triplet direct population at low energy or the ISC from S1. This latter process
is facilitated by the presence of triplet states (T15 and T16) close to S1 and having partial character deriving
from the coordinating nitrogen atoms.
300 400 500 600 700
Em
issio
n Inte
nsity
Wavelength (nm)
LEP
MEP
RTT
M-S
0
300 400 500 600 700
Em
issio
n I
nte
nsity
Wavelength (nm)
LEPMEP
TM-S
0 LT
103
Concerning the broad low energy phosphorescence observed at 568 nm for 1-Cu when exciting at high energy
(about 300 nm), it may be assigned to emission from T4, which could relax to lower energy than that of T1T3
states. T4 can be populated either by IC from higher triplet states having the same character, that are
populated by ISC from close high energy singlet states, or by ISC from S1.
11.3 Conclusions The detailed photophysical comparative study of 1-Ag and 1-Cu has revealed some interesting aspects. The
two compounds display excitation dependent photoluminescence. For the Ag(I) derivative the decay paths,
all of ligand-centered nature, are simultaneously activated but varied in intensity by changing the excitation
energy. On the contrary, 1-Cu shows non-thermally equilibrated XMLCT and Ligand-centered emissive states.

104
11.4 References [1] Lucenti, E.; Cariati, E.; Previtali, A.; Marinotto, D.; Forni, A.; Bold, V.; Kravtsov, V. C.; Fonari, M. S.; Galli,
S.; Carlucci, L., Versatility of Cyclic Triimidazole to Assemble 1D, 2D, and 3D Cu(I) Halide Coordination
Networks. Crystal Growth & Design 2019, 19 (3), 1567-1575.
[2] Leitl, M. J.; Zink, D. M.; Schinabeck, A.; Baumann, T.; Volz, D.; Yersin, H., Copper(I) Complexes for
Thermally Activated Delayed Fluorescence: From Photophysical to Device Properties. Topics in Current
Chemistry 2016, 374 (3), 25.
[3] Katsuyuki, S.; Jiyoung, L.; Hiroyuki, T.; Hiroko, N.; Takuma, Y.; Hironori, K.; Chihaya, A., Highly efficient
electroluminescence from purely organic donor–acceptor systems. Pure and Applied Chemistry 2015, 87
(7), 627-638.
[4] Cariati, E.; Lucenti, E.; Botta, C.; Giovanella, U.; Marinotto, D.; Righetto, S., Cu(I) hybrid inorganic–
organic materials with intriguing stimuli responsive and optoelectronic properties. Coordination Chemistry
Reviews 2016, 306, 566-614.
[5] Kakizoe, D.; Nishikawa, M.; Degawa, T.; Tsubomura, T., Intense blue emission and a reversible
hypsochromic shift of luminescence caused by grinding based on silver(i) complexes. Inorganic Chemistry
Frontiers 2016, 3 (11), 1381-1387.
[6] Xiang, H.; Cheng, J.; Ma, X.; Zhou, X.; Chruma, J. J., Near-infrared phosphorescence: materials and
applications. Chemical Society Reviews 2013, 42 (14), 6128-6185.
[7] Cariati, E.; Lucenti, E.; Botta, C.; Giovanella, U.; Marinotto, D.; Righetto, S., Cu(I) hybrid inorganic–
organic materials with intriguing stimuli responsive and optoelectronic properties. Coordination Chemistry
Reviews 2016, 306, 566-614.
[8] Christoph, W.; María Dolores Polo, B.; Ina, D.; Daniel, K.; Peter, G. J., Einfaches System, vielfältige
Strukturen: Eine Neuuntersuchung der (Amin)halogenidosilber(I)-Komplexe/ A Simple System with many
Structural Variants: A Reexamination of (Amine)halogenidosilver(I) Complexes. Zeitschrift für
Naturforschung B 2010, 65 (6), 647-673.
[9] Yang, D.; Xu, W.; Cao, X.; Zheng, S.; He, J.; Ju, Q.; Fang, Z.; Huang, W., Two Silver Coordination Network
Compounds with Colorful Photoluminescence. Inorganic Chemistry 2016, 55 (16), 7954-7961.
[10] Lucenti, E.; Forni, A.; Botta, C.; Carlucci, L.; Giannini, C.; Marinotto, D.; Pavanello, A.; Previtali, A.;
Righetto, S.; Cariati, E., Cyclic Triimidazole Derivatives: Intriguing Examples of Multiple Emissions and
Ultralong Phosphorescence at Room Temperature. Angewandte Chemie International Edition 2017, 56 (51),
16302-16307.
[11] Lucenti, E.; Forni, A.; Botta, C.; Carlucci, L.; Giannini, C.; Marinotto, D.; Previtali, A.; Righetto, S.; Cariati,
E., H-Aggregates Granting Crystallization-Induced Emissive Behavior and Ultralong Phosphorescence from a
Pure Organic Molecule. The Journal of Physical Chemistry Letters 2017, 8 (8), 1894-1898.
[12] Lucenti, E.; Forni, A.; Botta, C.; Giannini, C.; Malpicci, D.; Marinotto, D.; Previtali, A.; Righetto, S.;
Cariati, E., Intrinsic and Extrinsic Heavy‐Atom Effects on the Multifaceted Emissive Behavior of Cyclic
Triimidazole. Chemistry – A European Journal 2019, 25 (10), 2452-2456.
[13] Previtali, A.; Lucenti, E.; Forni, A.; Mauri, L.; Botta, C.; Giannini, C.; Malpicci, D.; Marinotto, D.; Righetto,
S.; Cariati, E., Solid State Room Temperature Dual Phosphorescence from 3-(2-Fluoropyridin-4-
yl)triimidazo[1,2-a:1′,2′-c:1″,2″-e][1,3,5]triazine. Molecules 2019, 24 (14), 2552.

105
[14] Lucenti, E.; Forni, A.; Botta, C.; Carlucci, L.; Colombo, A.; Giannini, C.; Marinotto, D.; Previtali, A.;
Righetto, S.; Cariati, E., The Effect of Bromo Substituents on the Multifaceted Emissive and Crystal-Packing
Features of Cyclic Triimidazole Derivatives. ChemPhotoChem 2018, 2 (9), 801-805.
[15] Lucenti, E.; Forni, A.; Previtali, A.; Marinotto, D.; Malpicci, D.; Righetto, S.; Giannini, C.; Virgili, T.;
Kabacinski, P.; Ganzer, L.; Giovanella, U.; Botta, C.; Cariati, E., Unravelling the intricate photophysical
behavior of 3-(pyridin-2-yl)triimidazotriazine AIE and RTP polymorphs. Chemical Science 2020, 11 (29),
7599-7608
[16] Forni, A.; Lucenti, E.; Botta, C.; Cariati, E., Metal free room temperature phosphorescence from
molecular self-interactions in the solid state. Journal of Materials Chemistry C 2018, 6 (17), 4603-4626.
[17] Majoube, M.; Henry, M.; Chinsky, L.; Turpin, P. Y., Preresonance Raman spectra for imidazole and
imidazolium ion: interpretation of the intensity enhancement from a precise assignment of normal modes.
Chemical Physics 1993, 169 (2), 231-241.

106
12 Procedures and methods.
12.1 General information All reagents and model molecules were purchased from chemical suppliers and used without further
purification unless otherwise stated.
1H, 13C and 15N NMR spectra were recorded on a Bruker AVANCE-400 instrument (400 MHz). Chemical shifts
are reported in parts per million (ppm) and are referenced to the residual solvent peak (DMSO, 1H 2.50 ppm, 13C 39.50 ppm) and to the NH3 for 15N resonances. Coupling constants (J) are given in hertz (Hz) and are
quoted to the nearest 0.5 Hz. Peak multiplicities are described in the following way: s, singlet; d, doublet; t.
triplet; m, multiplet.
Mass spectra were recorded on a Thermo Fisher LCQ Fleet Ion Trap Mass Spectrometer equipped with
UltiMate™ 3000 HPLC system.
UV-Visible spectra were collected by a Shimadzu UV3600 spectrophotometer.
Photoluminescence quantum yields were measured using a C11347 Quantaurus–Absolute
Photoluminescence Quantum Yield Spectrometer (Hamamatsu Photonics K.K), equipped with a 150 W Xenon
lamp, an integrating sphere and a multichannel detector.
Steady state emission and excitation spectra and photoluminescence lifetimes were obtained using both a
FLS 980 (Edinburg Instrument Ltd) and a Nanolog (Horiba Scientific) spectrofluorimeter composed of an
iH320 spectrograph equipped with a Synapse QExtra charge-coupled device. The steady state measurements
were recorded by excitation with a monochromated 450 W Xenon arc lamp and the spectra are corrected
for the instrument response. Phosphorescence spectra are obtained with a PPD-850 single photon detector
module with time-gated separation by exciting with a pulsed Xe lamp. Photoluminescence lifetime
measurements were performed using: Edinburgh Picosecond Pulsed Diode Laser EPL-375, EPLED-300,
(Edinburg Instrument Ltd) and microsecond flash Xe-lamp (60W, 0.1÷100 Hz) with data acquisition devices
time correlated single-photon counting (TCSPC) and multi-channel scaling (MCS) methods, respectively.
Nanolog TCSPC measurements are performed using DeltaTime series DD-300 DeltaDiode and a DD-405L
DeltaDiode Laser, with a PPD-850 single photon detector module and are analysed with the instrument
software DAS6. Average lifetimes are obtained as τav =∑𝑨𝒊𝝉𝒊
𝟐
𝑨𝒊𝝉𝒊 from bi-exponential or three-exponential fits.
Low temperature measurements are performed by immersion of the sample in a LN2 quartz dewar or with a
variable temperature liquid nitrogen cryostat Oxford DN1704.
Microscopy fluorescence images were collected with a Nikon Eclipse TE2000-U inverted confocal microscope
by exciting with a 100 W Hg lamp with a 330–380 nm band-pass excitation filter.
X-ray data were collected on a Bruker Apex II diffractometer using MoKα radiation. The structures were
solved using direct methods and refined using a full-matrix least squares procedure based on F2 using all data.
Hydrogen atoms were placed at geometrically estimated positions.
DFT and TDDFT calculations were performed with Gaussian 16 program (Revision A.03) using the 6-
311++G(d,p) basis set. The geometries have been optimized starting from the experimental structures as
derived from X-ray studies.
Ultrafast pump-probe measurements exciting at 290 nm were carried out on a pump-probe setup fed by a
Ti:sapphire laser (780-nm central wavelength, 100-fs pulses, 1-kHz repetition rate; Libra, Coherent). A
fraction of the fundamental wavelength (FW) pulse was used to seed a home-built visible non-collinear
optical parametric amplifier (NOPA). The broadband output centered at 580 nm was up-converted by second-
harmonic generation in a 20-μm-thick BBO crystal, providing sub-20-fs pump pulses in the UV range (290

107
nm). The fluence used was of ∼ 0.7 mJ/cm2 on the sample. The probe pulses were obtained by focusing a
~1μJ fraction of the FW onto a 3-mm-thick calcium fluoride plate. Through white-light continuum generation
we obtained a broadband probe pulse in the range between 320 and 650 nm. The transmitted probe beam
was dispersed in a spectrometer (SP2300 Acton, Princeton Instruments) and detected using a linear image
sensor driven and read out by a custom-built board (Stresing Entwicklungsbüro, Berlin, Germany).
Ultrafast pump-probe measurements exciting at 390 nm were carried out on a pump-probe setup fed by a
Ti:sapphire regenerative amplifier (780-nm central wavelength, 100-fs pulses, 2-kHz repetition rate; Libra,
Coherent). As excitation pulses, the second harmonic of the FW has been used (λ = 390 nm). The excitation
density was kept ∼ 9 mJ/cm2 on the sample. White light generated with a 2 mm-thick sapphire plate was
used as a probe in the visible-near infrared range from 450 to 750 nm. For a spectrally-resolved detection of
the probe light, spectrographs and CCD arrays were used. The chirp in the white light pulse was taken into
account during the analysis and evaluation of the two-dimensional (wavelength and time) ΔT/T maps before
extraction of the spectral and temporal data using homemade software. Overall, a temporal resolution of at
least 100 fs was achieved for all excitation wavelengths.
12.2 Triimidazo[1,2-a:1',2'-c:1'',2''-e][1,3,5]triazine (Cyclic Triimidazole
or TT)
12.2.1 Synthesis Cyclic riimidazole (TT) is prepared starting from Copper(II) bisimidazolate by using the synthesis proposed by
Schubert and coworkers [1]. In a 3 L two-necked flask equipped with a condenser, a solution of 70.23 g of
imidazole (1.03 mol) and 180.15 g of NaHCO3 (2.14 mol) in 1L of H2O was heated at reflux for 3 h. To this
solution CuSO4·5H2O (61.23 g, 0.24 mol) dissolved in 200 mL of H2O was added dropwise under vigorous
stirring. The formation of a violet precipitate is immediately observed. By leaving the mixture under reaction
conditions, the violet compound is gradually transformed into the blue polymorph of Cu(im)2. After 5 h the
blue compound is filtered off, washed with water, and dried at 110°C overnight in an oven[2].
Figure 1: Synthetic pathway for Cu(im)2.
A 1 L round-bottom flask was charged with the blue polymorph of Cu(im)2 (100.61 g, 0.51 mol). The flask is
then connected through an L-shaped glass connection, to a 50 cm long glass tube equipped with a vacuum
adapter. The system under vacuum (10-2 Torr) was heated with a surrounding heating mantle to 200 °C. The
temperature was then slowly increased to 300 °C over ca. 3 h and maintained in vacuo for another 4 h at 300
°C. A progressive formation of a white sublimate in the glass tube was observed along the reaction time. After
cooling, 28.23 g of crude organic products containing TT, its isomer ISO-A which is the product showing a 1,5-
instead of 1,2-annelation in one imidazole ring and imidazole, are collected by using a heat gun. The crude is
than crystallized from hot toluene (150 mL) to separate the imidazole crystals from the desired product which
remains in the toluene solution. After evaporation 6.87 g of crude triimidazole are obtained, after
semiautomatic direct chromatography with DCM/MeOH mixture 4.32 g of pure TT are collected.

108
Figure 2: Synthetic pathway for TT.
13C NMR (400 MHz, DMSO-d6, 298 K, , ppm) 136.12, 129.61, 127.68, 113.04, 111.04. 1H NMR (400 MHz, DMSO-d6, 298 K, , ppm) 7.96 (3H, d, J= 1.6 Hz), 7.28 (3H, d, J= 1.6 Hz).
12.2.2 1H NMR 400 MHz, DMSO-d6, 298 K
400 MHz, DMSO-d6, 298 K, expanded region

109
12.2.3 13C NMR 100 MHz, DMSO-d6, 298 K
12.2.4 XRDP TT simulated pattern calculated from crystal structure data (Refcode OSEXEQ) (black line); experimental
collected on gently ground single crystals (red line).
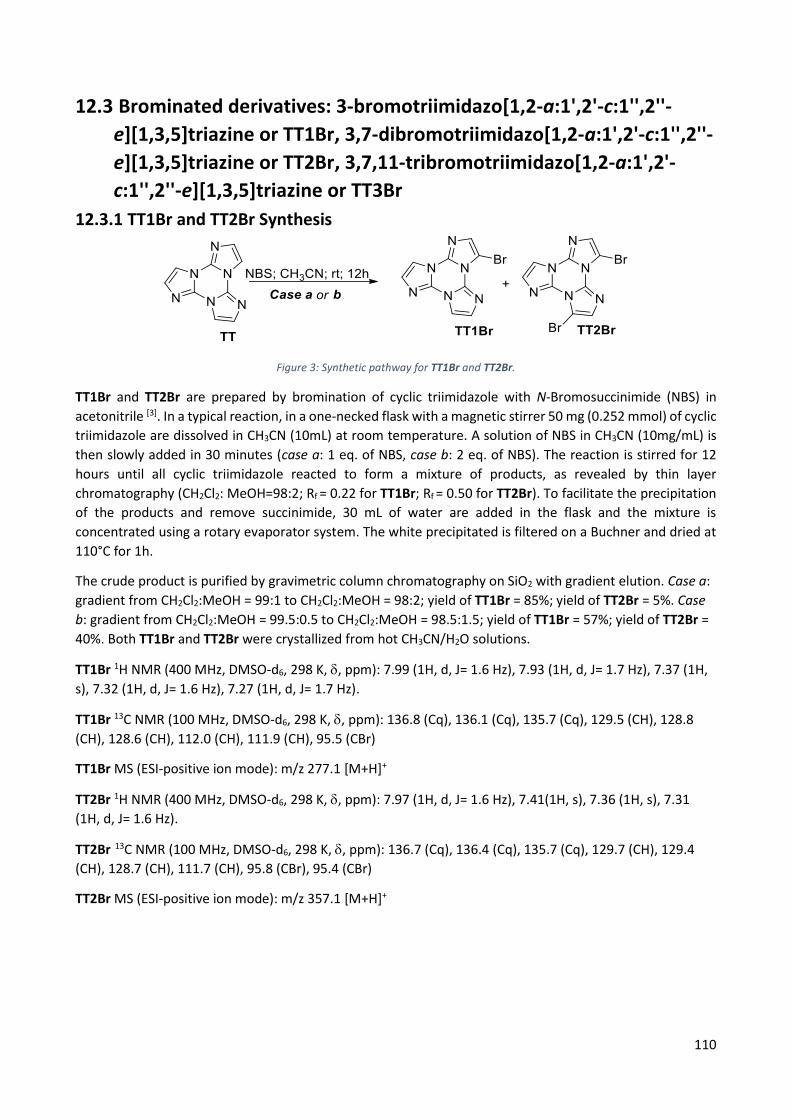
110
12.3 Brominated derivatives: 3-bromotriimidazo[1,2-a:1',2'-c:1'',2''-
e][1,3,5]triazine or TT1Br, 3,7-dibromotriimidazo[1,2-a:1',2'-c:1'',2''-
e][1,3,5]triazine or TT2Br, 3,7,11-tribromotriimidazo[1,2-a:1',2'-
c:1'',2''-e][1,3,5]triazine or TT3Br
12.3.1 TT1Br and TT2Br Synthesis
Figure 3: Synthetic pathway for TT1Br and TT2Br.
TT1Br and TT2Br are prepared by bromination of cyclic triimidazole with N-Bromosuccinimide (NBS) in
acetonitrile [3]. In a typical reaction, in a one-necked flask with a magnetic stirrer 50 mg (0.252 mmol) of cyclic
triimidazole are dissolved in CH3CN (10mL) at room temperature. A solution of NBS in CH3CN (10mg/mL) is
then slowly added in 30 minutes (case a: 1 eq. of NBS, case b: 2 eq. of NBS). The reaction is stirred for 12
hours until all cyclic triimidazole reacted to form a mixture of products, as revealed by thin layer
chromatography (CH2Cl2: MeOH=98:2; Rf = 0.22 for TT1Br; Rf = 0.50 for TT2Br). To facilitate the precipitation
of the products and remove succinimide, 30 mL of water are added in the flask and the mixture is
concentrated using a rotary evaporator system. The white precipitated is filtered on a Buchner and dried at
110°C for 1h.
The crude product is purified by gravimetric column chromatography on SiO2 with gradient elution. Case a:
gradient from CH2Cl2:MeOH = 99:1 to CH2Cl2:MeOH = 98:2; yield of TT1Br = 85%; yield of TT2Br = 5%. Case
b: gradient from CH2Cl2:MeOH = 99.5:0.5 to CH2Cl2:MeOH = 98.5:1.5; yield of TT1Br = 57%; yield of TT2Br =
40%. Both TT1Br and TT2Br were crystallized from hot CH3CN/H2O solutions.
TT1Br 1H NMR (400 MHz, DMSO-d6, 298 K, , ppm): 7.99 (1H, d, J= 1.6 Hz), 7.93 (1H, d, J= 1.7 Hz), 7.37 (1H,
s), 7.32 (1H, d, J= 1.6 Hz), 7.27 (1H, d, J= 1.7 Hz).
TT1Br 13C NMR (100 MHz, DMSO-d6, 298 K, , ppm): 136.8 (Cq), 136.1 (Cq), 135.7 (Cq), 129.5 (CH), 128.8
(CH), 128.6 (CH), 112.0 (CH), 111.9 (CH), 95.5 (CBr)
TT1Br MS (ESI-positive ion mode): m/z 277.1 [M+H]+
TT2Br 1H NMR (400 MHz, DMSO-d6, 298 K, , ppm): 7.97 (1H, d, J= 1.6 Hz), 7.41(1H, s), 7.36 (1H, s), 7.31
(1H, d, J= 1.6 Hz).
TT2Br 13C NMR (100 MHz, DMSO-d6, 298 K, , ppm): 136.7 (Cq), 136.4 (Cq), 135.7 (Cq), 129.7 (CH), 129.4
(CH), 128.7 (CH), 111.7 (CH), 95.8 (CBr), 95.4 (CBr)
TT2Br MS (ESI-positive ion mode): m/z 357.1 [M+H]+

111
12.3.2 1H NMR TT1Br 400 MHz, DMSO-d6, 298 K
400 MHz, DMSO-d6, 298 K, expanded region

112
12.3.3 1H NMR TT2Br 400 MHz, DMSO-d6, 298 K
400 MHz, DMSO-d6, 298 K, expanded region
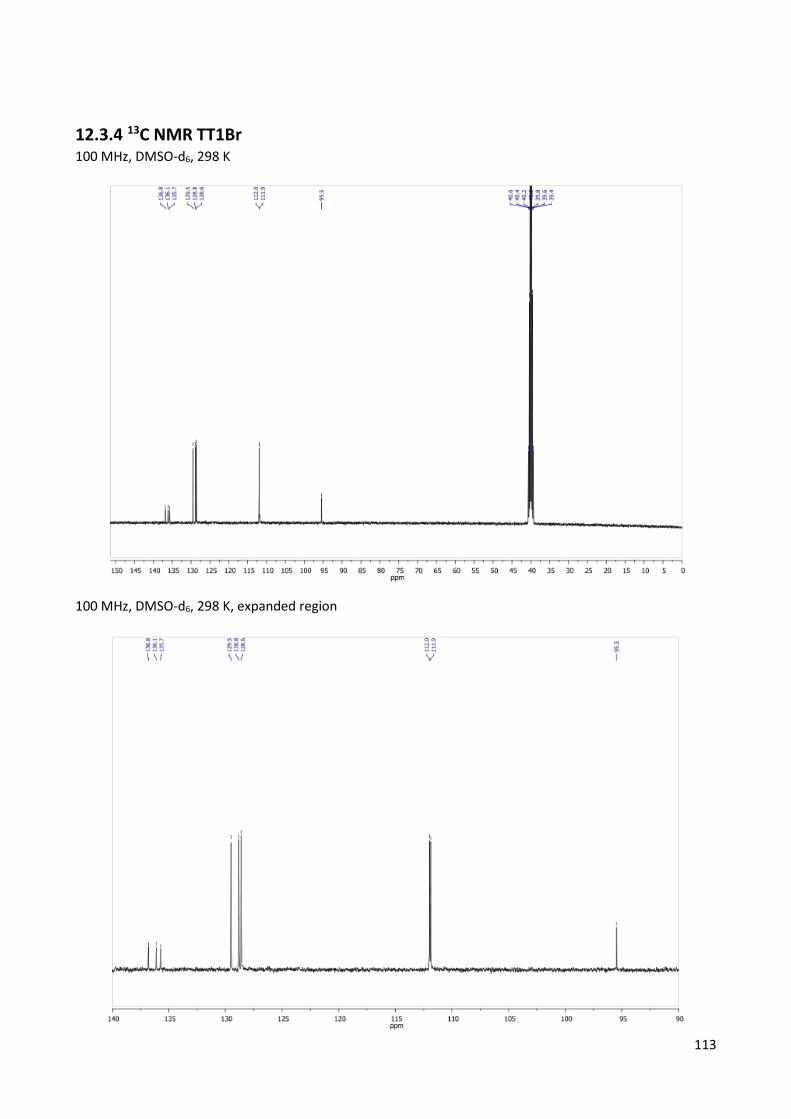
113
12.3.4 13C NMR TT1Br 100 MHz, DMSO-d6, 298 K
100 MHz, DMSO-d6, 298 K, expanded region
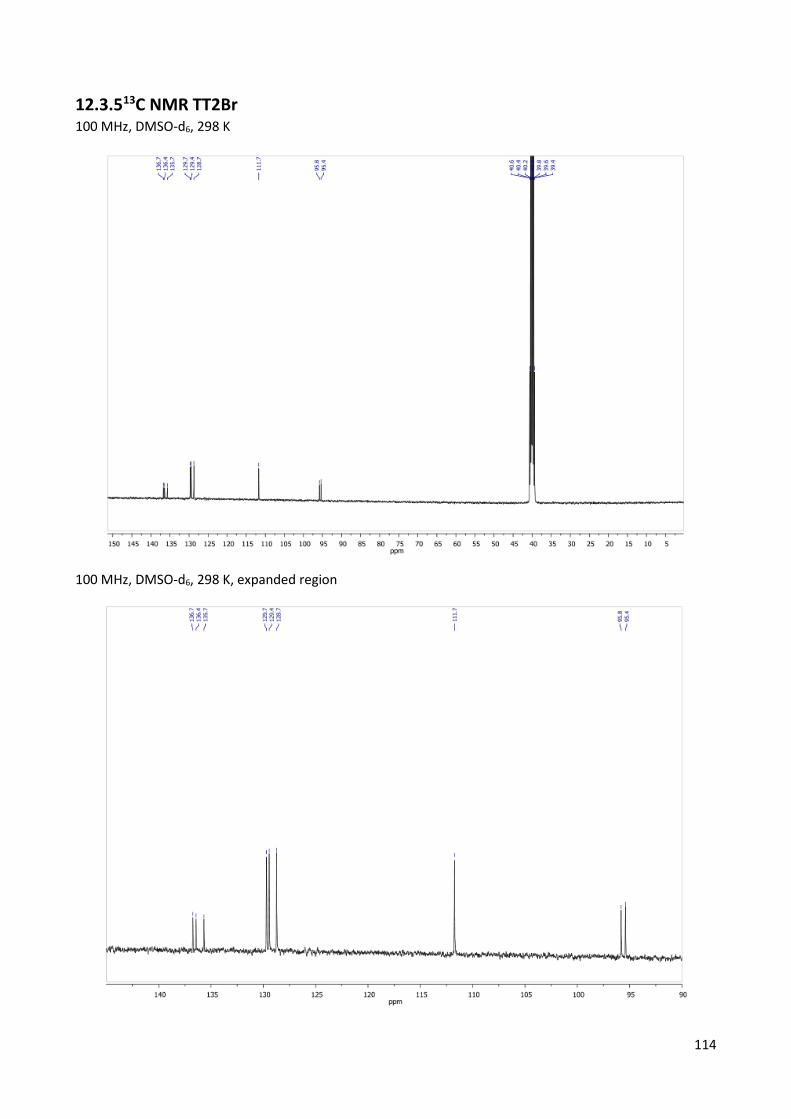
114
12.3.5 13C NMR TT2Br 100 MHz, DMSO-d6, 298 K
100 MHz, DMSO-d6, 298 K, expanded region

115
12.3.6 TT3Br Synthesis
Figure 4: Synthetic pathway for TT3Br.
TT3Br is prepared by polybromination of cyclic triimidazole with N-Bromosuccinimide (NBS) in
acetonitrile/dichloromethane mixture and acid condition [4]. In a 250mL one-necked flask with a magnetic
stirrer, cyclic triimidazole (240 mg, 1.21 mmol, 1 eq) is dissolved in 30mL of CH2Cl2 and added with few drops
of trifluoroacetic acid (TFA). To this flask, a solution of NBS (703 mg, 3.94 mmol, 3.3 eq) in CH3CN (30 mL) is
slowly added through a dropping funnel. The reaction is stirred overnight at room temperature and checked
by TLC (2% MeOH in CH2Cl2 Rf = 0.70) to verify the complete disappearance of the starting material. The
reaction is added with 10 mL of acetone and the solution was evaporated to obtain a white solid. The crude
product was suspended in water and added with a dilute solution of NaOH up to neutrality. The white powder
obtained was filtered on a Buchner and washed thoroughly with water to give 470 mg of pure product (yield
90%). The spectroscopical characterization was performed on samples which were further purified by column
chromatography on silica gel (0.5% MeOH in CH2Cl2) and crystallization from hot CH3CN.
1H NMR (400 MHz, DMSO-d6, 298 K, , ppm): 7.41 (3H, s).
13C NMR (100 MHz, DMSO-d6, 298 K, , ppm): 36.4 (Cq), 129.6 (CH), 95.7 (CBr)
TT3Br MS (ESI-positive ion mode): m/z 437.0 [M+H]+
12.3.7 1H NMR TT3Br 400 MHz, DMSO-d6, 298 K
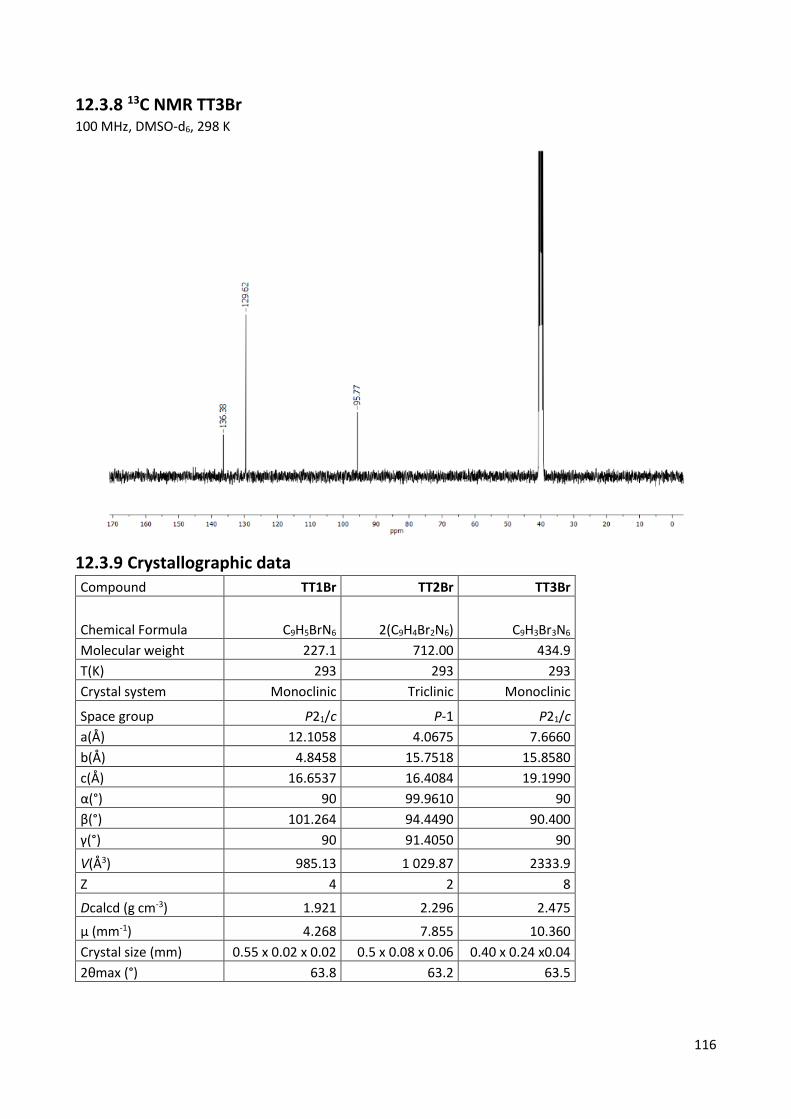
116
12.3.8 13C NMR TT3Br 100 MHz, DMSO-d6, 298 K
12.3.9 Crystallographic data Compound TT1Br TT2Br TT3Br
Chemical Formula C9H5BrN6 2(C9H4Br2N6) C9H3Br3N6
Molecular weight 227.1 712.00 434.9
T(K) 293 293 293
Crystal system Monoclinic Triclinic Monoclinic
Space group P21/c P-1 P21/c
a(Å) 12.1058 4.0675 7.6660
b(Å) 4.8458 15.7518 15.8580
c(Å) 16.6537 16.4084 19.1990
α(°) 90 99.9610 90
β(°) 101.264 94.4490 90.400
γ(°) 90 91.4050 90
V(Å3) 985.13 1 029.87 2333.9
Z 4 2 8
Dcalcd (g cm-3) 1.921 2.296 2.475
μ (mm-1) 4.268 7.855 10.360
Crystal size (mm) 0.55 x 0.02 x 0.02 0.5 x 0.08 x 0.06 0.40 x 0.24 x0.04
2θmax (°) 63.8 63.2 63.5

117
No. of measured, independent and observed [I >2σ(I)] reflections 18528/3145/2231 24402/6440/2231 51490/7358/5522
(Rint)/ (Rσ) 0.0466/0.0372 0.0236/0.0228 0.0494/0.0347
data/restraints/params 3145/0/145 6440/0/307 7358/0/325
R[F2> 2σ(F2)], wR(F2), S 0.0375, 0.0899,
1.015 0.0283, 0.0701,
1.032 0.0690, 0.1695,
1.183
Δρmax, Δρmin (e Å-3) 0.79, -0.33 0.64, -0.46 1.987, -1.033
12.4 3-iodotriimidazo[1,2-a:1',2'-c:1'',2''-e][1,3,5]triazine or TT1I, 3,7-
diiodotriimidazo[1,2-a:1',2'-c:1'',2''-e][1,3,5]triazine or TT2I and
Triimidazale/Diiodotetrafluorobenzene or TTCo.
12.4.1 TT1I synthesis
Figure 5: Synthetic pathway for TT1I.
TT1I was prepared by iodination of cyclic triimidazole with N-Iodosuccinimide (NIS) and catalytic
trifluoroacetic acid (TFA) in acetonitrile [5]. In a typical reaction, in a 100 mL one-necked flask with a magnetic
stirrer, 100 mg (0.505 mmol) of TT were dissolved in CH3CN (30 mL) at room temperature and few drops of
TFA were added to the solution. A solution of NIS (116 mg, 0.515 mmol) in CH3CN (30 mL) was then slowly
added through a dropping funnel in 15 minutes. The reaction was stirred at room temperature for 12 hours
and checked by TLC (CH2Cl2:MeOH = 98:2; Rf= 0.33 for TT1I). Then the reaction mixture was quenched with
10 mL of acetone and the solvent was evaporated to dryness. The crude product was purified by gravimetric
column chromatography on SiO2 with CH2Cl2 and MeOH as eluent. After crystallization from H2O/CH3CN (1:1)
pure TT1I was isolated in 55% yield (90 mg, 0.278 mmol).
1H NMR (400 MHz, DMSO-d6, 298 K, , ppm): 7.94 (1H, d, J= 1.5 Hz), 7.89 (1H, d, J= 1.5 Hz), 7.34 (1H, s), 7.32
(1H, d, J= 1.5 Hz), 7.24 (1H, d, J= 1.5 Hz).
13C NMR (100 MHz, DMSO-d6, 298 K, , ppm): 137.5 (Cq), 135.9 (CH), 135.6 (Cq), 135.5 (Cq), 128.1 (CH), 128.0
(CH), 111.5 (CH), 111.4 (CH), 60.9 (CI).
MS (ESI-positive ion mode): m/z 325.1 [M+H]+

118
12.4.2 TT2I synthesis
Figure 6: Synthetic pathway for TT2I.
TT2I is prepared by iodination of cyclic triimidazole with N-Iodosuccinimide (NIS) and catalytic trifluoroacetic
acid (TFA)in acetonitrile [5]. In a typical reaction, in a 250 mL one-necked flask with a magnetic stirrer, 300 mg
(1.514 mmol) of TT is dissolved in CH3CN (60 mL) at room temperature and few drops of TFA are added to
the solution. A solution of NIS (760 mg, 2.206 mmol) in CH3CN (60mL) is then slowly added through a dropping
funnel in 30 minutes. The reaction was stirred at room temperature for 3.5 hours and checked by TLC
(CH2Cl2:MeOH = 98:2; Rf= 0.62 for TT2I). Then the reaction mixture is added with 15 mL of acetone and the
solvent is evaporated to dryness. The crude product is washed with 2 x 40 mL of water (stirred for 1 hour)
and the precipitate filtered on büchner. The precipitate is purified by gravimetric column chromatography
on SiO2 with CH2Cl2and MeOH as eluent, crystallized from CH3CN and water (2:1 ratio) and washed with
hexane. Pure TT2I is isolated in 25% yield (166 mg, 0.37mmol).
1H NMR (400 MHz, DMSO-d6, 298 K, , ppm): 7.91(1H, d, J= 1.7Hz), 7.39(1H, s), 7.31(1H, s), 7.28(1H, d, J=
1.7 Hz).
13C NMR (100 MHz, DMSO-d6, 298 K, , ppm): 137.6 (Cq),137.4 (Cq), 136.0 (CH), 135.8(CH), 135.6 (Cq),
127.9(CH), 111.2(CH), 61.2(CI), 60.7(CI).
MS (ESI-positive ion mode): m/z 450.74[M+H]+
12.4.3 TTCo cocrystallization
Figure 7: TTCo chemical structure
In the same 50 mL one-necked flask, TT (15 mg, 0.076 mmol) and 1,4-diiodotetrafluorobenzene (30 mg, 0.076
mmol) are dissolved in CH2Cl2 10 mL. The flask is left open at room temperature and the solvent slowly
evaporates to give cocrystals of TTCo suitable for X-ray diffraction [5].
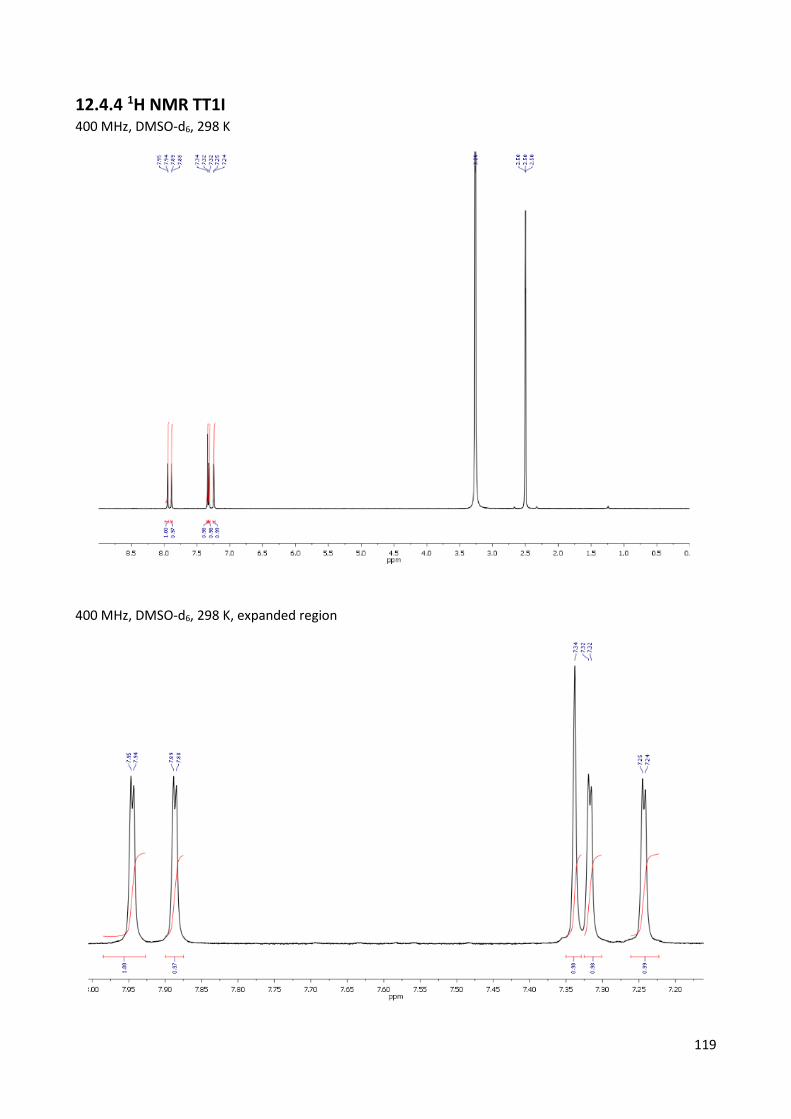
119
12.4.4 1H NMR TT1I 400 MHz, DMSO-d6, 298 K
400 MHz, DMSO-d6, 298 K, expanded region

120
12.4.5 1H NMR TT2I 400 MHz, DMSO-d6, 298 K
400 MHz, DMSO-d6, 298 K, expanded region

121
12.4.6 13C NMR TT1I 100 MHz, DMSO-d6, 298 K
100 MHz, DMSO-d6, 298 K, expanded region

122
12.4.7 13C NMR TT2I 100 MHz, DMSO-d6, 298 K
100 MHz, DMSO-d6, 298 K, expanded region

123
12.4.8 Crystallographic data Compound TT1I TT2I TTCo
Chemical Formula C9H5IN6 C9H4I2N6 C9H6N6·C6F4I2
Molecular weight 324.09 449.98 600.06
T(K) 120 293 293
Crystal system Monoclinic Triclinic Monoclinic
Space group C2/c P-1 P21/n
a(Å) 34.18 4.3042 4.3699
b(Å) 4.097 16.0441 29.647
c(Å) 31.19 16.6604 13.3748
α(°) 90 101.7635 90
β(°) 117.37 94.5898 97.63
γ(°) 90 91.492 90
V(Å3) 3880 1121.68 1717.4
Z 16 4 4
Dcalc (g cm-3) 2.22 2.665 2.321
μ (mm-1) 3.281 5.593 3.717
Crystal size (mm) 0.46 x 0.01 x 0.01 0.45 x 0.10 x 0.03 0.50 x 0.12 x 0.02
2θmax (°) 41.2 63.7 58.2
No. of measured, independent and observed [I >2σ(I)] reflections 13464/1934/1500 22743/7190/6497 30115/4580/3725
(Rint)/ (Rσ) 0.1258/0.0841 0.0204/0.0188 0.0431/0.0295
data/restraints/params 1934/60/289 7190/0/307 4580/0/244
R[F2> 2σ(F2)], wR(F2), S 0.0451, 0.0670, 1.002
0.0202, 0.0500, 1.055
0.0463, 0.0590, 1.230
Δρmax, Δρmin (e Å-3) 1.1163, -0.688 0.684, -0.0889 1.328, -0.573
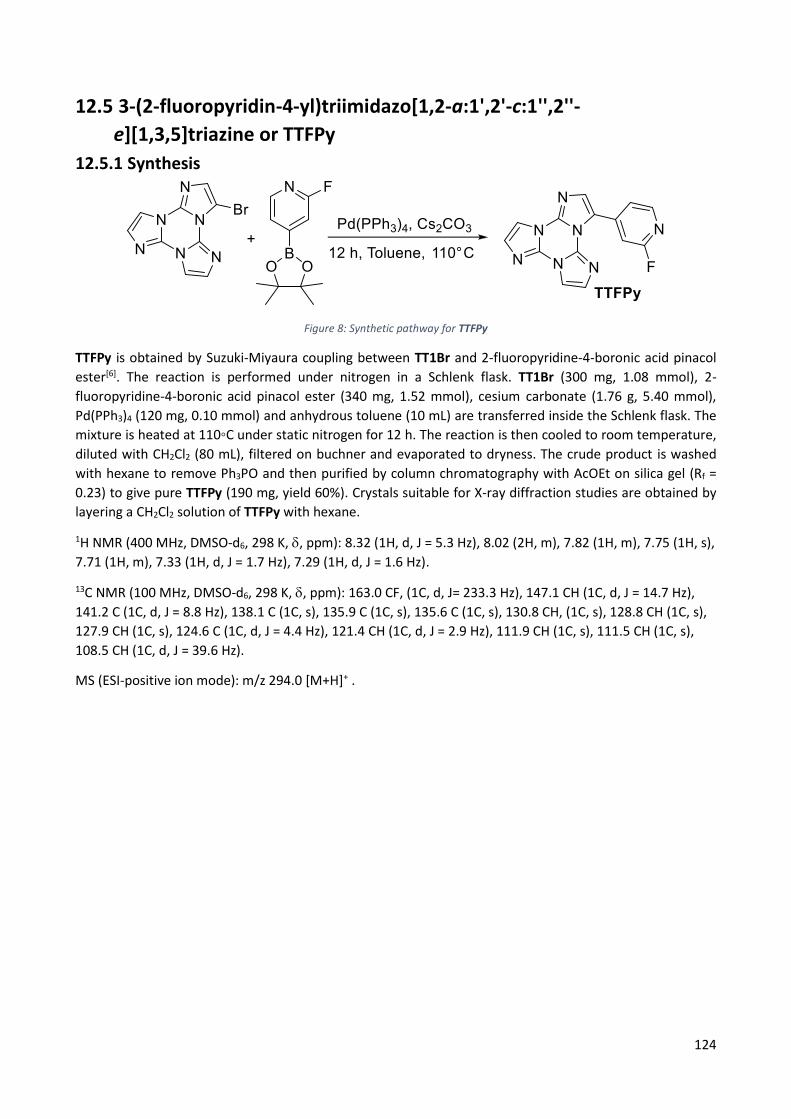
124
12.5 3-(2-fluoropyridin-4-yl)triimidazo[1,2-a:1',2'-c:1'',2''-
e][1,3,5]triazine or TTFPy
12.5.1 Synthesis
Figure 8: Synthetic pathway for TTFPy
TTFPy is obtained by Suzuki-Miyaura coupling between TT1Br and 2-fluoropyridine-4-boronic acid pinacol
ester[6]. The reaction is performed under nitrogen in a Schlenk flask. TT1Br (300 mg, 1.08 mmol), 2-
fluoropyridine-4-boronic acid pinacol ester (340 mg, 1.52 mmol), cesium carbonate (1.76 g, 5.40 mmol),
Pd(PPh3)4 (120 mg, 0.10 mmol) and anhydrous toluene (10 mL) are transferred inside the Schlenk flask. The
mixture is heated at 110◦C under static nitrogen for 12 h. The reaction is then cooled to room temperature,
diluted with CH2Cl2 (80 mL), filtered on buchner and evaporated to dryness. The crude product is washed
with hexane to remove Ph3PO and then purified by column chromatography with AcOEt on silica gel (Rf =
0.23) to give pure TTFPy (190 mg, yield 60%). Crystals suitable for X-ray diffraction studies are obtained by
layering a CH2Cl2 solution of TTFPy with hexane.
1H NMR (400 MHz, DMSO-d6, 298 K, , ppm): 8.32 (1H, d, J = 5.3 Hz), 8.02 (2H, m), 7.82 (1H, m), 7.75 (1H, s),
7.71 (1H, m), 7.33 (1H, d, J = 1.7 Hz), 7.29 (1H, d, J = 1.6 Hz).
13C NMR (100 MHz, DMSO-d6, 298 K, , ppm): 163.0 CF, (1C, d, J= 233.3 Hz), 147.1 CH (1C, d, J = 14.7 Hz),
141.2 C (1C, d, J = 8.8 Hz), 138.1 C (1C, s), 135.9 C (1C, s), 135.6 C (1C, s), 130.8 CH, (1C, s), 128.8 CH (1C, s),
127.9 CH (1C, s), 124.6 C (1C, d, J = 4.4 Hz), 121.4 CH (1C, d, J = 2.9 Hz), 111.9 CH (1C, s), 111.5 CH (1C, s),
108.5 CH (1C, d, J = 39.6 Hz).
MS (ESI-positive ion mode): m/z 294.0 [M+H]+ .

125
12.5.2 1H NMR TTFPy 400 MHz, DMSO-d6, 298 K
400 MHz, DMSO-d6, 298 K, expanded region

126
12.5.3 13C NMR TTFPy 100 MHz, DMSO-d6, 298 K
100 MHz, DMSO-d6, 298 K, expanded region

127
12.5.4 Crystallographic data Compound TTFPy
Chemical Formula C14H9FN7
Molecular weight 293.27
T(K) 291
Crystal system Triclinic
Space group P-1
a(Å) 3.8305
b(Å) 11.9825
c(Å) 13.8072
α(°) 78.411
β(°) 89.735
γ(°) 87.962
V(Å3) 620.42
Z 2
Dcalc (g cm-3) 1.57
μ (mm-1) 0.114
Crystal size (mm) 0.52 x 0.10 x 0.05
2θmax (°) 61.0
No. of measured, independent and observed [I >2σ(I)] reflections 12492/3780/2772
(Rint)/ (Rσ) 0.0251/0.0255
data/restraints/params 3780/0/199
R[F2> 2σ(F2)], wR(F2), S 0.0484, 0.0655, 1.051
Δρmax, Δρmin (e Å-3) 0.341, -0.210

128
12.6 3-(pyridin-2-yl)triimidazo[1,2-a:1',2'-c:1'',2''-e][1,3,5]triazine or
TT2Py
12.6.1 Synthesis
Figure 9: Synthetic pathway for TT2Py
TT2Py is obtained by Stille coupling between TT1Br and 2-(tributylstannyl)pyridine[7]. The reaction is
performed in a closed cylindrical Pyrex flask (diameter 30 mm, length 300 mm) fitted with a central neck
bearing a side neck equipped with a Rotaflo stopcock. TT1Br (500mg, 1.80mmol), LiCl (685mg, 16.16mmol)
and Pd(PPh3)2Cl2 (38mg, 0.054 mmol) are transferred inside the cylindrical flask, to this mixture 2-
(tributylstannyl)pyridine (assay 85%, 1mL, 2.70 mmol) and anhydrous toluene (15mL) are added and three
freeze-pump-thaw cycles are performed. The mixture is heated at 110*C under static nitrogen for 20 hours.
After cooling to room temperature, the reaction mixture is added with NaOH 1M (20mL) and stirred for 15
minutes. The biphasic solution is diluted with AcOEt (60mL) and H2O (40mL) and separated. The aqueous
phase is extracted with an additional 3×10 mL of AcOEt, and the combined organic phases are dried over
Na2SO4, filtered and evaporated to dryness. The crude product is purified by column chromatography on
silica gel (CH2Cl2:MeOH = 95:5; Rf = 0.38) to give TT2Py (370mg, yield 75%). Single crystals of the three
different polymorphs are obtained as laminae (TT2Py-A), needles (TT2Py-H) and rectangular blocks (TT2Py-
X) by slow evaporation of CH2Cl2/CH3OH, CH3CN/H2O and CH3CN solutions, respectively.
1H NMR (400 MHz, DMSO-d6, 298 K, , ppm): 8.65 (ddd, J=4.8, 1.7, 0.9 Hz, 1H), 8.10 (dt, J=8.0, 0.9 Hz, 1H),
8.0 (d, J=1.7 Hz, 1H), 7.98 (d, J=1.6 Hz, 1H), 7.9 (tt, J=5.6, 2.8 Hz, 1H), 7.54 (s, 1H), 7.41 (m, 1H), 7.31 (d,
J=1.7 Hz, 1H), 7.22 (d, J=1.6 Hz, 1H).
13C NMR (100 MHz, DMSO-d6, 298 K, , ppm): 149.1 (CH), 147.4 (Cq), 136.8 (Cq), 135.9(CH), 135.6 (Cq),
129.4 (CH), 128.6 (CH), 127.9 (Cq), 127.8 (CH), 124.8 (CH), 122.9 (CH), 111.8 (CH), 111.4(CH).
MS (ESI-positive ion mode) : m/z 276.2 [M+H]+.

129
12.6.2 1H NMR TT2Py 400 MHz, DMSO-d6, 298 K
400 MHz, DMSO-d6, 298 K, expanded region

130
12.6.3 13C NMR TT2Py 100 MHz, DMSO-d6, 298 K
100 MHz, DMSO-d6, 298 K, expanded region

131
12.6.4 Crystallographic data Compound TT2Py(A) TT2Py(H) TT2Py(X)
Chemical Formula C14H9N7 C14H9N7·1.7H2O C14H9N7
Molecular weight 275.28 307.28 275.28
T(K) 293 120 293
Crystal system Orthorhombic Monoclinic Monoclinic
Space group Pbcn P21/c P21/c
a(Å) 33.189 3.7357 18.0949
b(Å) 10.162 14.805 8.8509
c(Å) 7.2434 23.784 17.3684
α(°) 90 90 90
β(°) 90 90.284 117.796
γ(°) 90 90 90
V(Å3) 2443 1315.4 2460.69
Z 8 4 8
Dcalc (g cm-3) 1.497 1.552 1.486
μ (mm-1) 0.099 0.112 0.099
Crystal size (mm) 0.55 x 0.07 x 0.01 0.45 x 0.04 x 0.04 0.35 x 0.27 x 0.18
2θmax (°) 55 55.32 61
No. of measured, independent and observed [I >2σ(I)] reflections 66937/2803/1742 19094/3031/1577 47901/7501/5146
(Rint)/ (Rσ) 0.1067/0.0384 0.1709/0.1332 0.0285/0.0201
data/restraints/params 2803/0/190 3031/6/220 7501/0/379
R[F2> 2σ(F2)], wR(F2), S 0.0497, 0.112, 1.059
0.0665, 0.1518, 1.000
0.0468, 0.1245, 1.028
Δρmax, Δρmin (e Å-3) 0.185, -0.204 0.303, -0.349 0.166, -0.220

132
12.7 3-(pyren-1-yl)triimidazo[1,2-a:1',2'-c:1'',2''-e][1,3,5]triazine or
TTPyr
12.7.1 Synthesis
Figure 10: Synthetic pathway for TTPyr
TTPyr is obtained by Suzuki-Miyaura coupling between TT1Br and pyren-1-ylboronic acid. The reaction is
performed under nitrogen in a Schlenk flask. TT1Br (200 mg; 0.72 mmol), pyren-1-ylboronic acid (246 mg,
1.01 mmol), potassium carbonate (400 mg, 2.88 mmol), Pd(PPh3)2Cl2 (25 mg, 0.03 mmol), water (2mL) and
DMF (10 mL) are transferred inside the Schlenk flask. The mixture is heated at 130◦C under static nitrogen
for 12 h. The reaction is then cooled to room temperature, precipitated with water (100 mL) and filtered on
buchner. The crude product is purified by column chromatography with CH2Cl2 and MeOH as eluent on silica
gel to give pure TTPyr (258 mg, yield 90%) as a pale yellow solid.
1H NMR (400 MHz, DMSO-d6, 298 K, , ppm): 8.38 (m; 2H), 8.30 (m; 3H), 8.18 (m; 1H), 8.12 (m; 4H), 7.88 (d;
1H, J= 1.4 Hz), 7.46 (s; 1H), 7.36 (d; 1H, J= 1.4 Hz), 6.81(d; 1H, J= 1.4 Hz).
13C NMR (100 MHz, DMSO-d6, 298 K, , ppm): 136.97, 136.26, 131.91, 131.30, 131.20, 130.85, 130.14,
128.97, 128.90, 128.57, 128.48, 128.10, 127.79, 126.91, 126.19, 126.05, 125.92, 125.60, 124.65, 124.14,
123.95, 112.22, 111.36.
12.7.2 1H NMR TTPyr 400 MHz, DMSO-d6, 298 K

133
400 MHz, DMSO-d6, 298 K, expanded region
12.7.3 13C NMR TTPyr APT; 100 MHz, DMSO-d6, 298 K

134
APT; 100 MHz, DMSO-d6, 298 K, expanded region
12.8 Cu(I) and Ag(I) coordination polymers
12.8.1 Synthesis of [Cu(TT)I]n (1-Cu) Solid CuI is suspended in a saturated aqueous solution of KI. After vigorous stirring the suspension is filtered
and 4 mL of the resulting solution is transferred in a vial. TT (15 mg, 0.076 mmol) is dissolved in CH3CN (2 mL)
and added to the aqueous solution. After 18h at room temperature, colorless needle-shaped 1-Cu crystals
are recovered from the solution through filtration on a Buchner[8].
Figure 11: Synthetic pathway for [Cu(TT)I]n, 1-Cu
Anal. Calcd. for C9H6CuIN6 (%): C, 27.81; H, 1.56; N, 21.62. Found: C, 27.63; H, 1.61; N, 21.82.
12.8.2 Synthesis of [Ag(TT)I]n (1-Ag) AgI (55 mg, 0.234 mmol) is added to a solution of N,N-dimethylformamide (DMF, 5 mL) and KI (20 mg, 0.4
wt%) at 25 °C in the dark. After 15 minutes the resulting transparent solution is transferred into a vial. TT (47
mg, 0.238 mmol) dissolved in acetonitrile (CH3CN, 3 mL) is added to this solution. The vial is kept closed at 25
°C in the dark producing after few days a white powder which is filtered and dried over filter paper.

135
Figure 12: Synthetic pathway for [Ag(TT)I]n, 1-Ag.
Alternatively, TT (11 mg, 0.056 mmol) dissolved in CH3CN (2 mL) is added to a vial containing 4 mL of a
saturated aqueous solution of AgI in KI. The vial is kept closed at 25 °C in the dark producing after few days
needle-shaped crystals suitable for X-ray diffraction analysis.
Anal. Calcd. for C9H6AgIN6 (%): C, 25.03; H, 1.17; N, 19.46. Found: C, 25.39; H, 1.29; N, 19.63.
12.8.3 Crystallographic data Compound 1-Cu 1-Ag
Chemical Formula C9H6CuIN6 C9H6AgIN6
Molecular weight 388.64 432.97
T(K) 150 150
Crystal system Monoclinic Monoclinic
Space group P21/c P21/c
a(Å) 14.117 13.858
b(Å) 4.509 4.7312
c(Å) 17.113 17.303
α(°) 90 90
β(°) 105.6 105.388
γ(°) 90 90
V(Å3) 1049.2 1093.8
Z 4 4
Dcalc (g cm-3) 2.46 μ (mm-1) 5.008 4.65
Crystal size (mm) 0.60 x 0.04 x 0.02
0.305 × 0.045 × 0.030
2θmax (°)
No. of measured, independent and observed [I >2σ(I)] reflections 19478/2585 12349/3516/2515
(Rint)/ (Rσ) 0.0316 0.0478/0.0456
data/restraints/params 2585/0/154 3516/0/154
R[F2> 2σ(F2)], wR(F2), S 0.019, 0.041, 1.160
0.0343, 0.0692, 0.962
Δρmax, Δρmin (e Å-3) 0.875, -0.835 2.145, -1.211

136
12.9 References [1] Lucenti, E.; Forni, A.; Botta, C.; Carlucci, L.; Giannini, C.; Marinotto, D.; Previtali, A.; Righetto, S.; Cariati,
E., H-Aggregates Granting Crystallization-Induced Emissive Behavior and Ultralong Phosphorescence from a
Pure Organic Molecule. The Journal of Physical Chemistry Letters 2017, 8 (8), 1894-1898.
[2] Masciocchi, N.; Bruni, S.; Cariati, E.; Cariati, F.; Galli, S.; Sironi, A., Extended Polymorphism in Copper(II)
Imidazolate Polymers: A Spectroscopic and XRPD Structural Study. Inorganic Chemistry 2001, 40 (23), 5897-
5905.
[3] Lucenti, E.; Forni, A.; Botta, C.; Carlucci, L.; Giannini, C.; Marinotto, D.; Pavanello, A.; Previtali, A.;
Righetto, S.; Cariati, E., Cyclic Triimidazole Derivatives: Intriguing Examples of Multiple Emissions and
Ultralong Phosphorescence at Room Temperature. Angewandte Chemie International Edition 2017, 56 (51),
16302-16307.
[4] Lucenti, E.; Forni, A.; Botta, C.; Carlucci, L.; Colombo, A.; Giannini, C.; Marinotto, D.; Previtali, A.;
Righetto, S.; Cariati, E., The Effect of Bromo Substituents on the Multifaceted Emissive and Crystal-Packing
Features of Cyclic Triimidazole Derivatives. ChemPhotoChem 2018, 2 (9), 801-805.
[5] Lucenti, E.; Forni, A.; Botta, C.; Giannini, C.; Malpicci, D.; Marinotto, D.; Previtali, A.; Righetto, S.; Cariati,
E., Intrinsic and Extrinsic Heavy‐Atom Effects on the Multifaceted Emissive Behavior of Cyclic Triimidazole.
Chemistry – A European Journal 2019, 25 (10), 2452-2456.
[6] Previtali, A.; Lucenti, E.; Forni, A.; Mauri, L.; Botta, C.; Giannini, C.; Malpicci, D.; Marinotto, D.; Righetto,
S.; Cariati, E., Solid State Room Temperature Dual Phosphorescence from 3-(2-Fluoropyridin-4-
yl)triimidazo[1,2-a:1′,2′-c:1″,2″-e][1,3,5]triazine. Molecules 2019, 24 (14), 2552.
[7] Lucenti, E.; Forni, A.; Previtali, A.; Marinotto, D.; Malpicci, D.; Righetto, S.; Giannini, C.; Virgili, T.;
Kabacinski, P.; Ganzer, L.; Giovanella, U.; Botta, C.; Cariati, E., Unravelling the intricate photophysical
behavior of 3-(pyridin-2-yl)triimidazotriazine AIE and RTP polymorphs. Chemical Science 2020, 11 (29),
7599-7608.
[8] Lucenti, E.; Cariati, E.; Previtali, A.; Marinotto, D.; Forni, A.; Bold, V.; Kravtsov, V. C.; Fonari, M. S.; Galli,
S.; Carlucci, L., Versatility of Cyclic Triimidazole to Assemble 1D, 2D, and 3D Cu(I) Halide Coordination
Networks. Crystal Growth & Design 2019, 19 (3), 1567-1575.

137
13 Conclusion This work is aimed at the development of new materials with enhanced emissive properties in the solid state.
These materials are particularly appealing in view of possible application in different fields spanning from
OLED fabrication to the biological area. Research in these contexts was historically limited by the observation
that luminogens possess better properties in dispersed system than in the condensed phase due to the well-
known Aggregation Caused Quenching (ACQ) phenomenon. However, in 2001 Tang and co-workers reported
some pioneering works on luminogens displaying opposite properties, being highly emissive in the
condensed phase but not in diluted solution, a behaviour named Aggregation Induced Emission (AIE)[1].
Different mechanisms may explain the AIE phenomenon, the most frequent one being the inhibition of
molecular motions (vibrations and rotations) which works as non-radiative deactivation channels for the
molecule but is somehow locked in the aggregated state.
In parallel, great efforts have been devoted to the search of organic molecules with long-lived excited states
that enable exciton migration over long distances for increased production of free charges. Usually,
transitions from singlet (short-lived) to triplet (long-lived) states are facilitated by the presence of metals or
specific organic moieties (i.e. aromatic aldehyde, heavy halogen atoms, heteroatoms with lone pairs). In
addition, since triplet excitons generated in organic molecules are highly sensitive to oxygen and
temperature, stringent conditions are required to observe long-lived phosphorescence from purely organic
molecules. However, very recently, An et al. reported ultralong phosphorescent emission features in
structures of planar organic molecules coupled in H-aggregates, which provide an effective means of
stabilizing and protecting triplet excitons formed through intersystem crossing (ISC)[2]. The stabilized excited
state, which functions as an energy trap at a lower energy level, may delocalize on several neighbouring
molecules, offering suppressed radiative and nonradiative deactivation decay rates in favour of long-lived
excited states and room temperature ultralong phosphorescence (RTUP).
In this regard, my research work was focused on the synthesis and characterization of triimidazo[1,2-a:1',2'-
c:1'',2''-e][1,3,5]triazine (TT or cyclic triimidazole) and of its derivatives. In fact, TT has shown intriguing solid
state AIE and RTUP properties. Diluted solutions of TT in DCM display weak emission (Ф = 2%) even under
inert atmosphere, while crystalline powders (Ф = 30%) show an intense fluorescent emission at 425 nm and
an ultralong emission at 520 nm with decay time close to 1 s. This behaviour, in agreement with works by An
et al. [2] arises from the formation of H-aggregates in the crystal structure of the compound as revealed by
XRD studies [3].
The main goal of my project has been the synthesis and characterization of organic and hybrid inorganic-
organic TT-derivatives in order to expand both the photophysical features of the triimidazole family and our
comprehension of the mechanisms involved in view of future applications. In hybrid materials, TT and its
derivatives have been used as ligands thanks to the presence of the three different nitrogen atoms prone to
metal coordination.
At the early stage of my research, my efforts were devoted to the preparation and characterization of the
halogenated TT-derivatives. 3-bromotriimidazo[1,2-a:1',2'-c:1'',2''-e][1,3,5]triazine, TT1Br, 3,7-
dibromotriimidazo[1,2-a:1',2'-c:1'',2''-e][1,3,5]triazine, TT2Br, 3,7,11-tribromotriimidazo[1,2-a:1',2'-c:1'',2''-
e][1,3,5], TT3Br and 3-iodotriimidazo[1,2-a:1',2'-c:1'',2''-e][1,3,5]triazine, TT1I, 3,7-diiodotriimidazo[1,2-
a:1',2'-c:1'',2''-e][1,3,5]triazine, TT2I, were easily prepared by reaction of TT with different amounts of N-
bromosuccinimmide (NBS) or N-iodosuccinimmide (NIS). In addition, cocrystallization of TT with 1,4-
diiodotetrafluorobenzene resulted in the isolation of TTCo[4-6].
The presence of halogens strongly affects the TT photophysic leading to the generation of new deactivation
channels. In fact, the heavy halogen atoms allow efficient ISC to populate high energy triplet levels resulting
in molecular phosphorescence (MP) both in the solid state and in diluted solution at 77 K. Besides MP, an

138
additional long lived emission in the solid state is observed for TT2Br, TT3Br, TT1I and TTCo, due to
supramolecular interactions through Br···Br or N···I halogen bonds. Moreover, since H-aggregation is
preserved in crystalline TT2Br, TT3Br, TT1I, TT2I and TTCo, these compounds manifest also RTUP features.
Importantly, evaluation of the extrinsic vs intrinsic heavy-atom effect on the photophysics of TT was
performed by comparing results obtained for TTCo and TT1I. Specifically, a more efficient ISC is observed
when the iodine plays the role of an intrinsic perturber, in fact, while TT1I displays MP already at 298 K, it is
visible only at 77 K for TTCo.
The halo-derivatization of the TT scaffold opens to a greater reactivity towards coupling reaction and to the
functionalization with different chromophoric fragments which are expected to modify the emissive
properties at both molecular and, through different packing arrangement, solid-state levels.
In particular, pyrenyl and pyridinyl fragments were conjugate to TT through coupling reaction.
3-(pyren-1-yl)triimidazo[1,2-a:1',2'-c:1'',2''-e][1,3,5]triazine, TTPyr, was easily prepared by Suzuki-Miyaura
coupling reaction between TT1Br and pyren-1-ylboronic acid. The full explanation of the photophysical
phenomena observed for TTPyr is still ongoing due the difficulties associated to the concomitant formation
of at least three different crystalline phases. However, during the five months spent in Prof. Tang’s
laboratories at the Hong Kong university of Science and technology, the possibility to use TTPyr as a dye for
cellular staining was investigated. Nano-aggregates of TTPyr are characterized by a high emission quantum
efficiency (Ф = 67% for DMSO/water 90/10; prepared through rapid injection of water in a TTPyr DMSO
solution).
The preliminary staining experiments on TTPyr have revealed that the dye diffusion starts immediately after
the addition of 10-5M TTPyr (99% water) aggregates to the culture media of HeLa, COS-7 or HLF cells as
revealed by confocal microscope images. After few hours of staining, the cells display a round shape
indicative of unhealthy conditions, confirming the cytotoxicity of this molecules as highlighted by the MTT
assay.
For what concern the pyridinyl derivatization, 3-(2-fluoropyridin-4-yl)triimidazo[1,2-a:1′,2′-c:1″,2″-
e][1,3,5]triazine, TTFPy, containing the 2-fluoropyridine moiety, was synthetized by Suzuki-Miyaura coupling
between TT1Br and 2-fluoropyridine-4-boronic acid pinacol ester. The compound’s photophysical behavior
is markedly different from that of the parent TT being, already as a molecule, quite fluorescent at room
temperature (Ф = 50 %, 10-5 M in CH3CN). In addition, crystals of TTFPy are characterized by multiple
emissions comprising one fluorescence and two phosphorescences, with overall quantum efficiency equal to
25%. Through experimental, theoretical and X-ray diffraction studies, the fluorescence and the high energy
phosphorescence were assigned to radiative deactivation from molecular S1 and T1 while the low energy,
long lived (up to 0.1 s) phosphorescence was ascribed to the formation of H-aggregates in the compound’s
crystal structure[7].
Moreover, even a different pyridinyl fragment was used to modified the triimidazole structure. TT2Py (3-
(pyridin-2-yl)triimidazo[1,2-a:1',2'-c:1'',2''-e][1,3,5]triazine) was prepared by Stille coupling between TT1Br
and 2-(tributylstannyl)pyridine. The compounds crystallizes in three different polymorphic forms (TT2Py-A,
TT2Py-H and TT2Py-X) all characterized by the stacking already observed in TT and its derivatives.
Crystals of the three phases are characterized by a very complex emissive behaviour comprising two
fluorescent and three phosphorescent components which, through detailed experimental and theoretical
investigations, were selectively assigned to molecular and supramolecular effects[8].
Besides its intriguing photophysical behaviour, TT2Py, can be identified as an interesting ligand due to
presence of multiple nitrogen atoms available for coordination to different metal atoms.

139
Positive results on the use of TT itself as ligand have been obtained by its reaction with Cu(I) or Ag(I) halides.
In fact, the preparation of the isostructural [M(TT)I]n coordination polymers (with M = Ag; Cu) has allow to
compare their photophysics[9].
In conclusion, these studies have allowed to deepen the knowledge of the effects played by molecular and
supramolecular features on TT emissive properties. In particular, the role played by halogen atoms, metals
and aromatic substituents have been deeply investigated. New and intriguing properties have emerged that
will be further exploited in various application fields.

140
13.1 References [1] Luo, J.; Xie, Z.; Lam, J. W. Y.; Cheng, L.; Chen, H.; Qiu, C.; Kwok, H. S.; Zhan, X.; Liu, Y.; Zhu, D.; Tang, B. Z.,
Aggregation-induced emission of 1-methyl-1,2,3,4,5-pentaphenylsilole. Chemical Communications 2001,
(18), 1740-1741.
[2] An, Z.; Zheng, C.; Tao, Y.; Chen, R.; Shi, H.; Chen, T.; Wang, Z.; Li, H.; Deng, R.; Liu, X.; Huang, W., Stabilizing
triplet excited states for ultralong organic phosphorescence. Nature Materials 2015, 14 (7), 685-690.
[3] Lucenti, E.; Forni, A.; Botta, C.; Carlucci, L.; Giannini, C.; Marinotto, D.; Previtali, A.; Righetto, S.; Cariati, E.,
H-Aggregates Granting Crystallization-Induced Emissive Behavior and Ultralong Phosphorescence from a
Pure Organic Molecule. The Journal of Physical Chemistry Letters 2017, 8 (8), 1894-1898.
[4] Lucenti, E.; Forni, A.; Botta, C.; Carlucci, L.; Giannini, C.; Marinotto, D.; Pavanello, A.; Previtali, A.; Righetto,
S.; Cariati, E., Cyclic Triimidazole Derivatives: Intriguing Examples of Multiple Emissions and Ultralong
Phosphorescence at Room Temperature. Angewandte Chemie International Edition 2017, 56 (51), 16302-
16307.
[5] Lucenti, E.; Forni, A.; Botta, C.; Carlucci, L.; Colombo, A.; Giannini, C.; Marinotto, D.; Previtali, A.; Righetto,
S.; Cariati, E., The Effect of Bromo Substituents on the Multifaceted Emissive and Crystal-Packing Features of
Cyclic Triimidazole Derivatives. ChemPhotoChem 2018, 2 (9), 801-805.
[6] Lucenti, E.; Forni, A.; Botta, C.; Giannini, C.; Malpicci, D.; Marinotto, D.; Previtali, A.; Righetto, S.; Cariati,
E., Intrinsic and Extrinsic Heavy‐Atom Effects on the Multifaceted Emissive Behavior of Cyclic Triimidazole.
Chemistry – A European Journal 2019, 25 (10), 2452-2456.
[7] Previtali, A.; Lucenti, E.; Forni, A.; Mauri, L.; Botta, C.; Giannini, C.; Malpicci, D.; Marinotto, D.; Righetto,
S.; Cariati, E., Solid State Room Temperature Dual Phosphorescence from 3-(2-Fluoropyridin-4-
yl)triimidazo[1,2-a:1′,2′-c:1″,2″-e][1,3,5]triazine. Molecules 2019, 24 (14), 2552.
[8] Lucenti, E.; Forni, A.; Previtali, A.; Marinotto, D.; Malpicci, D.; Righetto, S.; Giannini, C.; Virgili, T.;
Kabacinski, P.; Ganzer, L.; Giovanella, U.; Botta, C.; Cariati, E., Unravelling the intricate photophysical behavior
of 3-(pyridin-2-yl)triimidazotriazine AIE and RTP polymorphs. Chemical Science 2020, 11 (29), 7599-7608.
[9] Lucenti, E.; Cariati, E.; Previtali, A.; Marinotto, D.; Forni, A.; Bold, V.; Kravtsov, V. C.; Fonari, M. S.; Galli, S.;
Carlucci, L., Versatility of Cyclic Triimidazole to Assemble 1D, 2D, and 3D Cu(I) Halide Coordination Networks.
Crystal Growth & Design 2019, 19 (3), 1567-1575.