Face to Face Summary Slides Data
25
The Face-to-Face Book Summary Data Slides Prepared by Ed Keller, CEO Brad Fay, COO © 2012 Keller Fay Group May be used for non-commercial purposes with attribution to The Face- to-Face Book (Free Press: 2012) and The Keller Fay Group LLC
-
Upload
keller-fay-group -
Category
Education
-
view
901 -
download
0
Transcript of Face to Face Summary Slides Data
The Face-to-Face BookSummary Data Slides
Prepared byEd Keller, CEO
Brad Fay, COO
© 2012 Keller Fay Group
May be used for non-commercial purposes with attribution to The Face-to-Face Book (Free Press: 2012) and The Keller Fay Group LLC
www.kellerfay.com 2
About The Face-to-Face Book
The Face-to-Face Book presents a unique, research-backed point of view about the value of real relationships in a time when social media has taken center stage. Companies are pouring billions into Facebook and Twitter, hoping that they have finally found the holy grail of marketing. But, the fact remains that it is the in-person conversations that still matter most. Based on six years of research by the award-winning word of mouth research firm, the Keller Fay Group, the Face-to-Face Book presents a multitude of case studies and research studies that show that:
•Over 90% of conversations still take place offline, primarily face to face, with less than 8% occurring online
•Human beings are fundamentally wired to be social and are highly influenced by direct, in-person conversations
•Large companies, such as Apple, General Mills, Kimberly Clark and Toyota have been successful by integrating WOM into their advertising and marketing campaigns
•Consumers often reference other forms of media when they are talking about a brand, making the case that advertising can be designed to spark WOM conversation
www.kellerfay.com 3
About the Keller Fay Group
About Keller FayThe Keller Fay Group is the first full-service market research company focused exclusively on word of mouth (WOM) and brand advocacy. The firm’s founders, Ed Keller and Brad Fay are authors of The Face-to-Face Book, “a celebration of the supremely social nature of all human beings and how that drives the consumer marketplace.” The book is based on research from Keller Fay’s TalkTrack® program is the only continuous study of WOM in all channels (online and offline) designed to closely monitor and measure the marketing-relevant attributes of actual consumer conversations. TalkTrack® was launched in the U.S. in 2006 and in the United Kingdom in 2011. For further information about the Keller Fay Group, visit our website www.kellerfay.com.
Join our Network:
www.facebook.com/kellerfay www.twitter.com/kellerfaywww.slideshare.net/kellerfay/www.linkedin.com/company/keller-fay-group
CONTACT: Kristen Beveridge, Vice President, 732-846-6800, [email protected]
www.kellerfay.com 4
Table of Contents
Section I: Word of Mouth Overview Stats……….page 5
Section II: Conversation Catalysts®…………………page 8
Section III: Advertising and Word of Mouth……page 12
Section IV: The Internet and Word of Mouth….page 16
Section V: Brands and Word of Mouth…………...page 19
Section VI: Summary WOM Tactics………………...page 24
www.kellerfay.com 5
WOM Stats
WOM Overview Stats
www.kellerfay.com 6
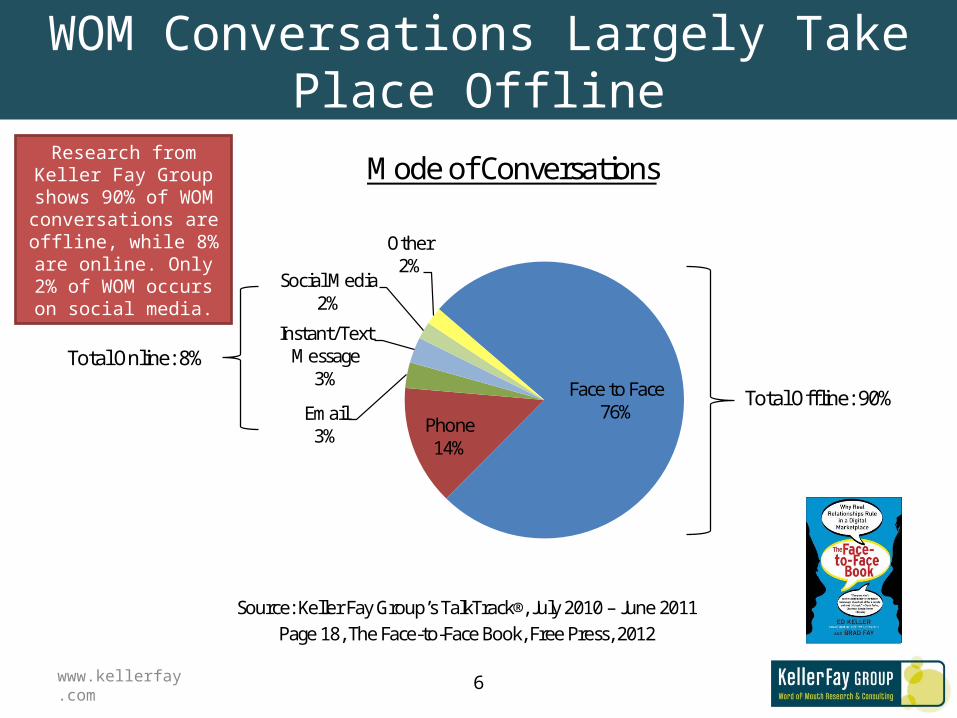
WOM Conversations Largely Take Place Offline
Mode of Conversations
Source: Keller Fay Group’s TalkTrack®, July 2010 – June 2011 Page 18, The Face-to-Face Book, Free Press, 2012
Face to Face76%
Phone14%
Email3%
Instant/Text Message
3%
Social Media2%
Other2%
Total Online: 8%
Total Offline: 90%
Research from Keller Fay Group shows 90% of
WOM conversations are offline, while 8% are
online. Only 2% of WOM occurs on social media.
www.kellerfay.com
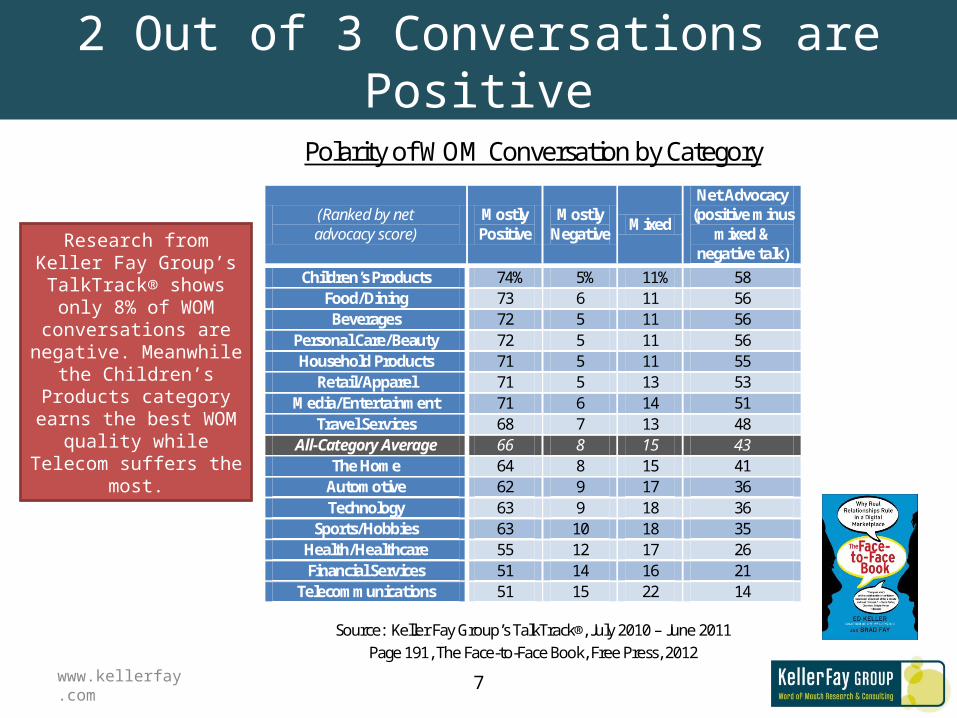
2 Out of 3 Conversations are Positive
Polarity of WOM Conversation by Category
Source: Keller Fay Group’s TalkTrack®, July 2010 – June 2011 Page 191, The Face-to-Face Book, Free Press, 2012
(Ranked by net advocacy score)
Mostly Positive
Mostly Negative
Mixed
Net Advocacy (positive minus
mixed & negative talk)
Children’s Products 74% 5% 11% 58 Food/Dining 73 6 11 56 Beverages 72 5 11 56
Personal Care/Beauty 72 5 11 56 Household Products 71 5 11 55
Retail/Apparel 71 5 13 53 Media/Entertainment 71 6 14 51
Travel Services 68 7 13 48 All-Category Average 66 8 15 43
The Home 64 8 15 41 Automotive 62 9 17 36 Technology 63 9 18 36
Sports/Hobbies 63 10 18 35 Health/Healthcare 55 12 17 26 Financial Services 51 14 16 21
Telecommunications 51 15 22 14
Research from Keller Fay Group’s TalkTrack® shows
only 8% of WOM conversations are negative. Meanwhile the Children’s
Products category earns the best WOM quality while
Telecom suffers the most.
7
www.kellerfay.com 8
WOM Stats
Conversation Catalysts®
www.kellerfay.com 9
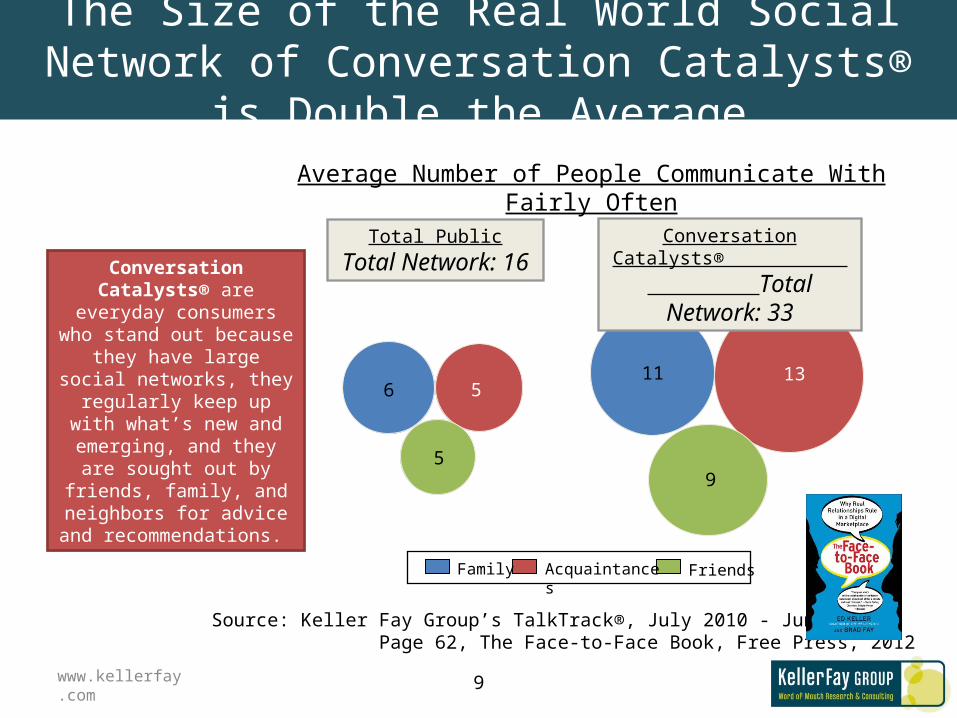
The Size of the Real World Social Network of Conversation Catalysts® is Double the Average
Conversation Catalysts® are everyday consumers who
stand out because they have large social networks, they
regularly keep up with what’s new and emerging, and they
are sought out by friends, family, and neighbors for
advice and recommendations.
Total PublicTotal Network: 16
6
5
5
9
1311
FriendsAcquaintancesFamily
Conversation Catalysts® Total Network: 33
Average Number of People Communicate With Fairly Often
Source: Keller Fay Group’s TalkTrack®, July 2010 - June 2011 Page 62, The Face-to-Face Book, Free Press, 2012
www.kellerfay.com 10
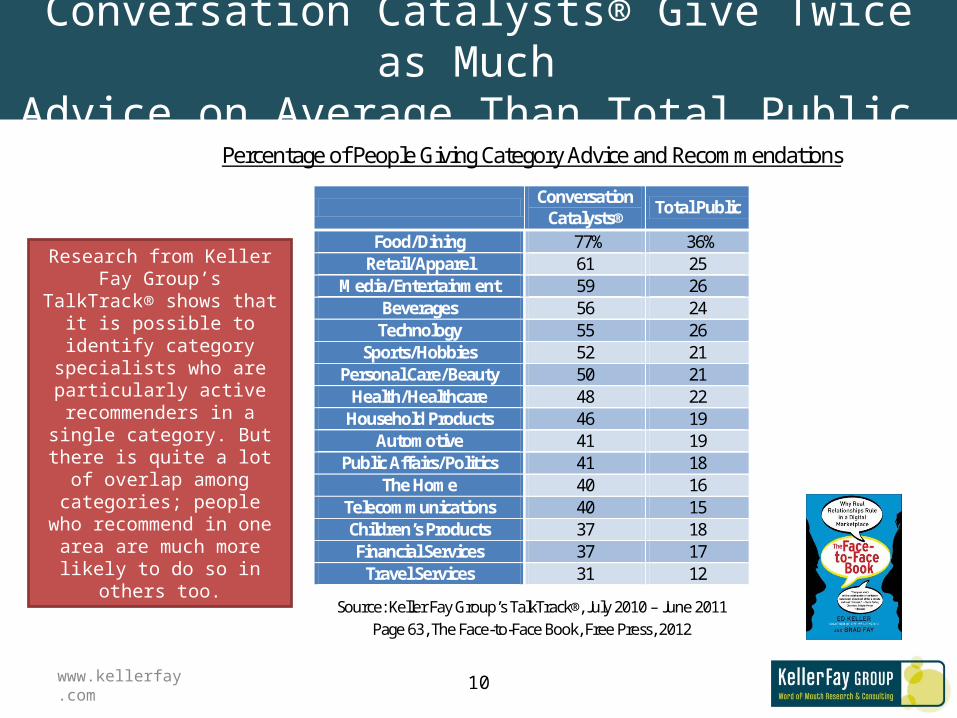
Conversation Catalysts® Give Twice as Much Advice on Average Than Total Public
Percentage of People Giving Category Advice and Recommendations
Conversation
Catalysts® Total Public
Food/Dining 77% 36% Retail/Apparel 61 25
Media/Entertainment 59 26 Beverages 56 24
Technology 55 26 Sports/Hobbies 52 21
Personal Care/Beauty 50 21 Health/Healthcare 48 22
Household Products 46 19 Automotive 41 19
Public Affairs/Politics 41 18 The Home 40 16
Telecommunications 40 15 Children’s Products 37 18 Financial Services 37 17
Travel Services 31 12
Source: Keller Fay Group’s TalkTrack®, July 2010 – June 2011 Page 63, The Face-to-Face Book, Free Press, 2012
Research from Keller Fay Group’s TalkTrack® shows that
it is possible to identify category specialists who are particularly
active recommenders in a single category. But there is quite a lot
of overlap among categories; people who recommend in one area are much more likely to do
so in others too.
www.kellerfay.com
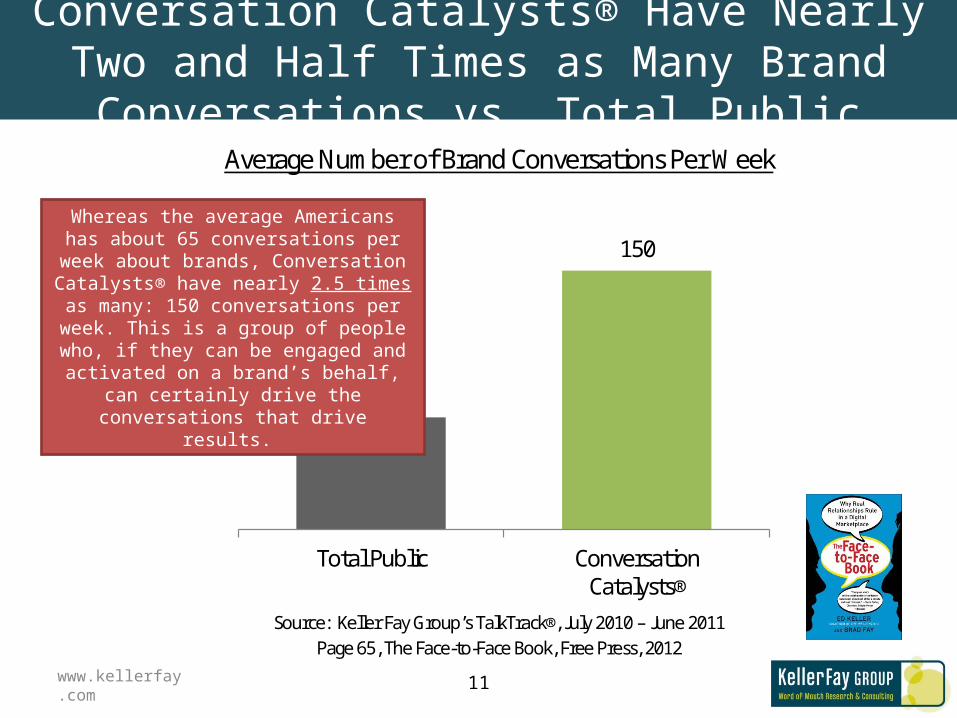
Conversation Catalysts® Have Nearly Two and Half Times as Many Brand Conversations vs. Total Public
Average Number of Brand Conversations Per Week
Source: Keller Fay Group’s TalkTrack®, July 2010 – June 2011
Page 65, The Face-to-Face Book, Free Press, 2012
65
150
Total Public ConversationCatalysts®
Whereas the average Americans has about 65 conversations per week about brands,
Conversation Catalysts® have nearly 2.5 times as many: 150 conversations per week. This is a group of people who, if they can be engaged
and activated on a brand’s behalf, can certainly drive the conversations that drive results.
11
www.kellerfay.com 12
WOM Stats
Advertising and WOM
www.kellerfay.com
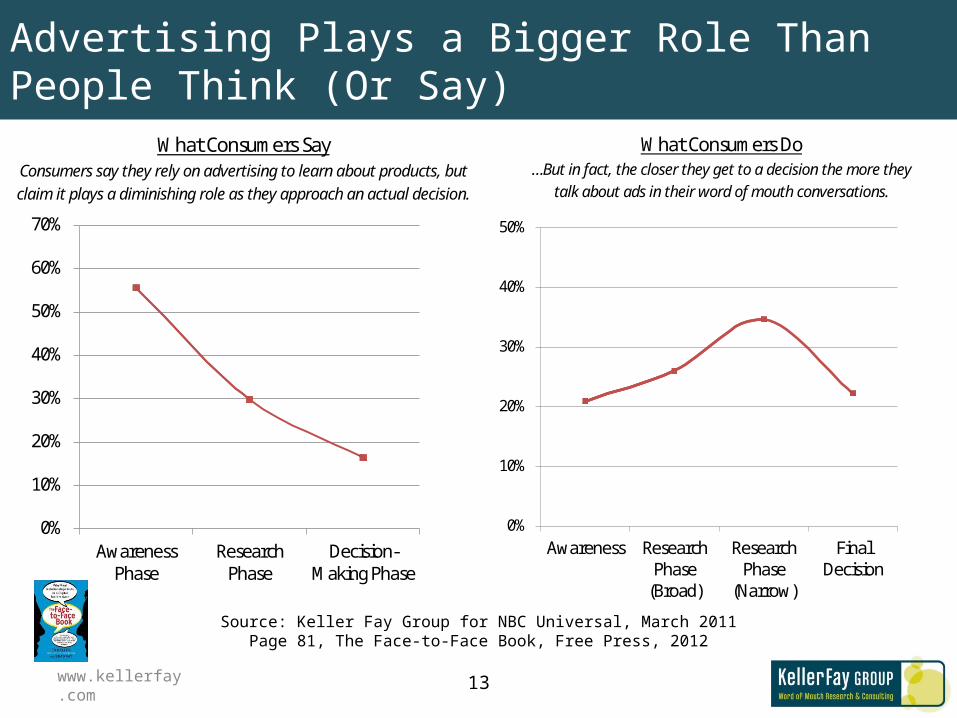
Advertising Plays a Bigger Role Than People Think (Or Say)
13
What Consumers Say Consumers say they rely on advertising to learn about products, but claim it plays a diminishing role as they approach an actual decision.
0%
10%
20%
30%
40%
50%
60%
70%
AwarenessPhase
ResearchPhase
Decision-Making Phase
What Consumers Do …But in fact, the closer they get to a decision the more they
talk about ads in their word of mouth conversations.
0%
10%
20%
30%
40%
50%
Awareness ResearchPhase
(Broad)
ResearchPhase
(Narrow)
FinalDecision
Source: Keller Fay Group for NBC Universal, March 2011Page 81, The Face-to-Face Book, Free Press, 2012
www.kellerfay.com
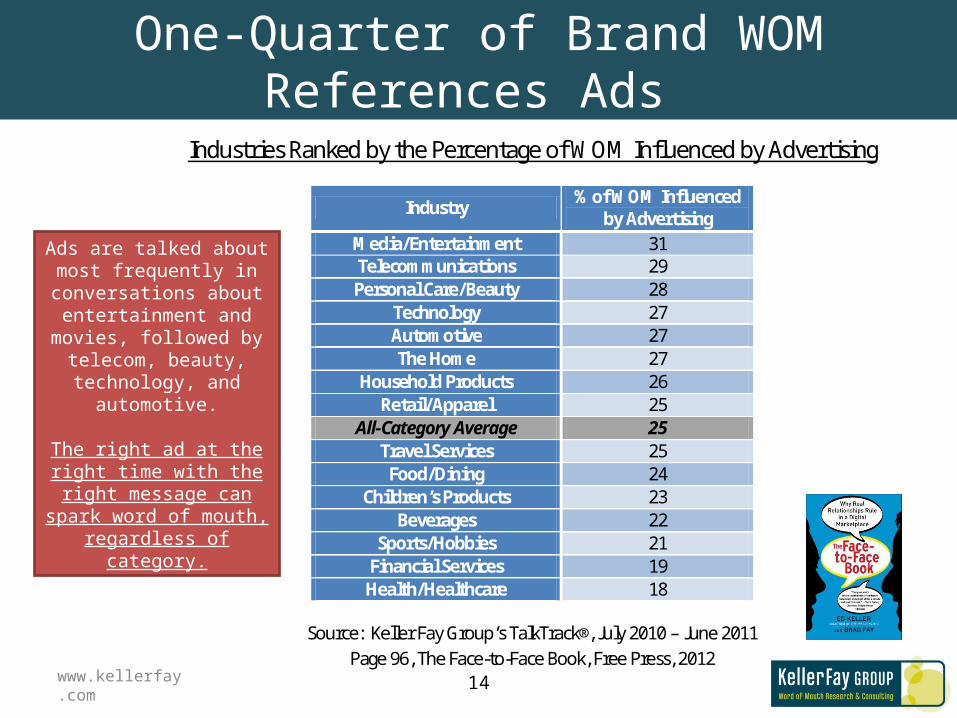
One-Quarter of Brand WOM References Ads
Industries Ranked by the Percentage of WOM Influenced by Advertising
Source: Keller Fay Group’s TalkTrack®, July 2010 – June 2011 Page 96, The Face-to-Face Book, Free Press, 2012
Industry % of WOM Influenced by Advertising
Media/Entertainment 31 Telecommunications 29 Personal Care/Beauty 28
Technology 27 Automotive 27 The Home 27
Household Products 26 Retail/Apparel 25
All-Category Average 25 Travel Services 25
Food/Dining 24 Children’s Products 23
Beverages 22 Sports/Hobbies 21
Financial Services 19 Health/Healthcare 18
Ads are talked about most frequently in conversations about entertainment and
movies, followed by telecom, beauty, technology, and
automotive.
The right ad at the right time with the right message can
spark word of mouth, regardless of category.
14
www.kellerfay.com
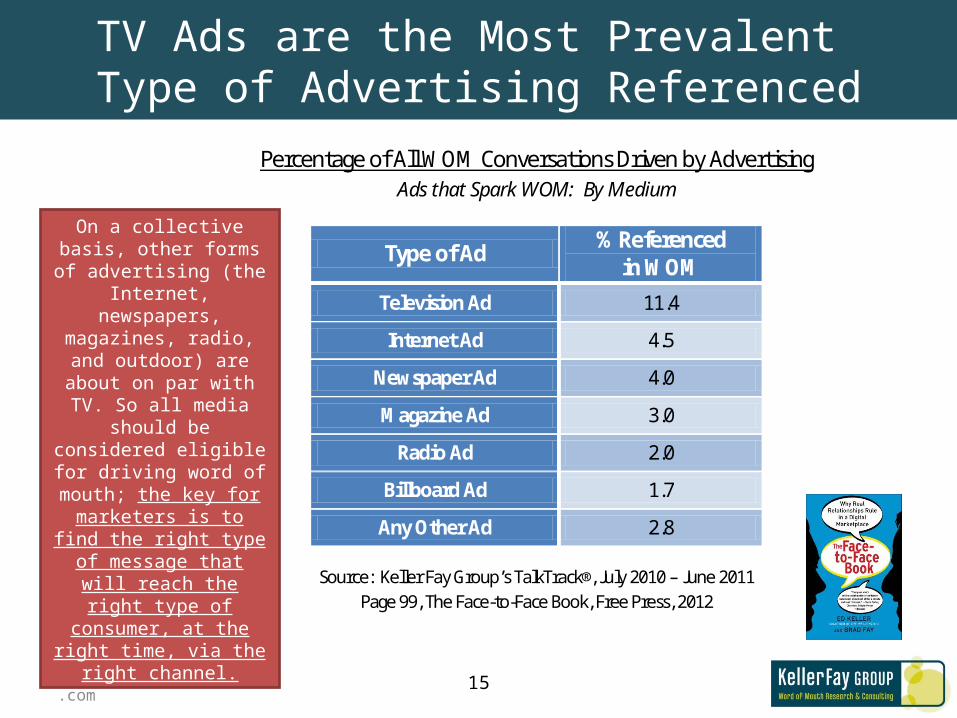
TV Ads are the Most Prevalent Type of Advertising Referenced
Percentage of All WOM Conversations Driven by Advertising Ads that Spark WOM: By Medium
Type of Ad % Referenced in WOM
Television Ad 11.4
Internet Ad 4.5
Newspaper Ad 4.0
Magazine Ad 3.0
Radio Ad 2.0
Billboard Ad 1.7
Any Other Ad 2.8
Source: Keller Fay Group’s TalkTrack®, July 2010 – June 2011 Page 99, The Face-to-Face Book, Free Press, 2012
On a collective basis, other forms of advertising (the
Internet, newspapers, magazines, radio, and
outdoor) are about on par with TV. So all media should
be considered eligible for driving word of mouth; the key for marketers is to find the right type of message
that will reach the right type of consumer, at the right
time, via the right channel.
15
www.kellerfay.com 16
WOM Stats
The Internet and WOM
www.kellerfay.com
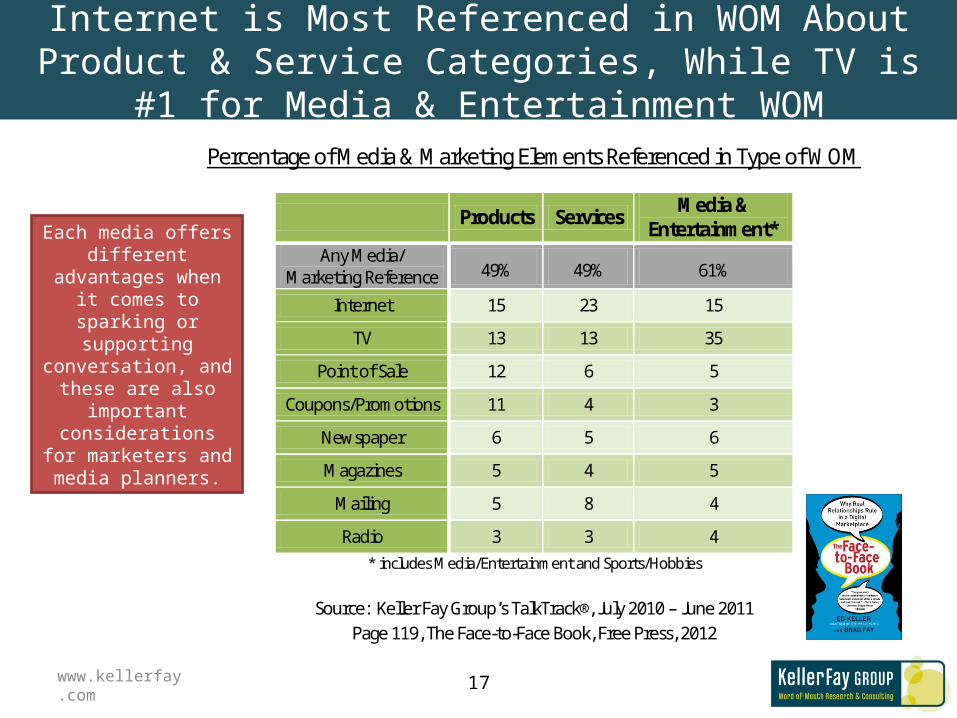
Internet is Most Referenced in WOM About Product & Service Categories, While TV is #1 for Media & Entertainment WOM
Percentage of Media & Marketing Elements Referenced in Type of WOM
Products Services Media &
Entertainment* Any Media/
Marketing Reference 49% 49% 61%
Internet 15 23 15
TV 13 13 35
Point of Sale 12 6 5
Coupons/Promotions 11 4 3
Newspaper 6 5 6
Magazines 5 4 5
Mailing 5 8 4
Radio 3 3 4 * includes Media/Entertainment and Sports/Hobbies
Source: Keller Fay Group’s TalkTrack®, July 2010 – June 2011 Page 119, The Face-to-Face Book, Free Press, 2012
Each media offers different advantages
when it comes to sparking or supporting
conversation, and these are also important considerations for
marketers and media planners.
17
www.kellerfay.com
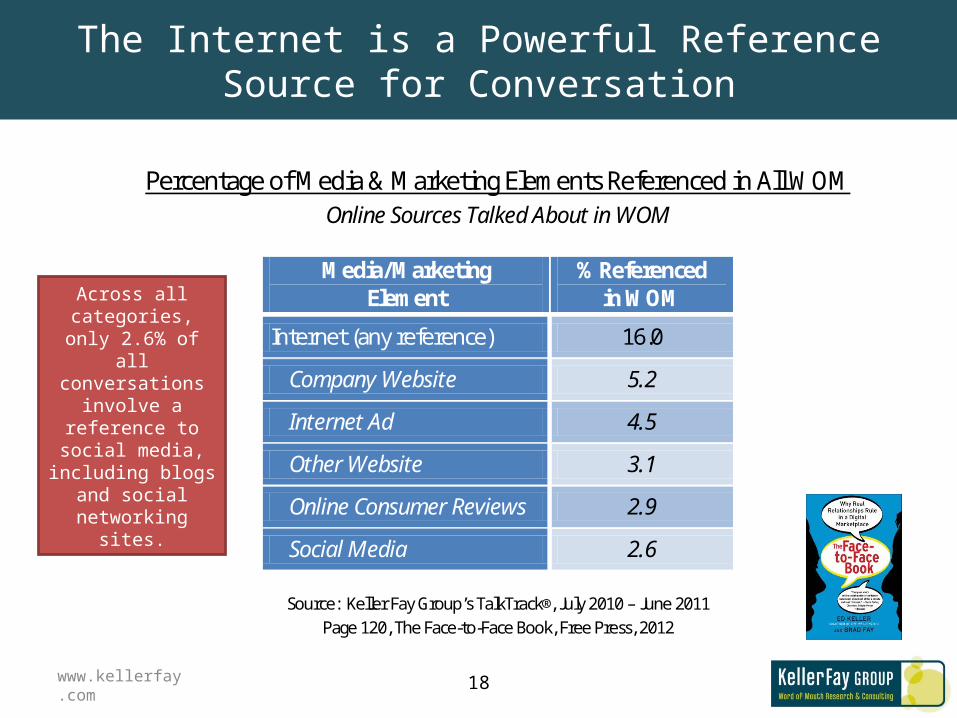
The Internet is a Powerful Reference Source for Conversation
Percentage of Media & Marketing Elements Referenced in All WOM Online Sources Talked About in WOM
Media/Marketing Element
% Referenced in WOM
Internet (any reference) 16.0
Company Website 5.2
Internet Ad 4.5
Other Website 3.1
Online Consumer Reviews 2.9
Social Media 2.6
Source: Keller Fay Group’s TalkTrack®, July 2010 – June 2011 Page 120, The Face-to-Face Book, Free Press, 2012
Across all categories, only 2.6% of all
conversations involve a reference to social
media, including blogs and social
networking sites.
18

www.kellerfay.com 19
WOM Stats
Brands and WOM
www.kellerfay.com 20
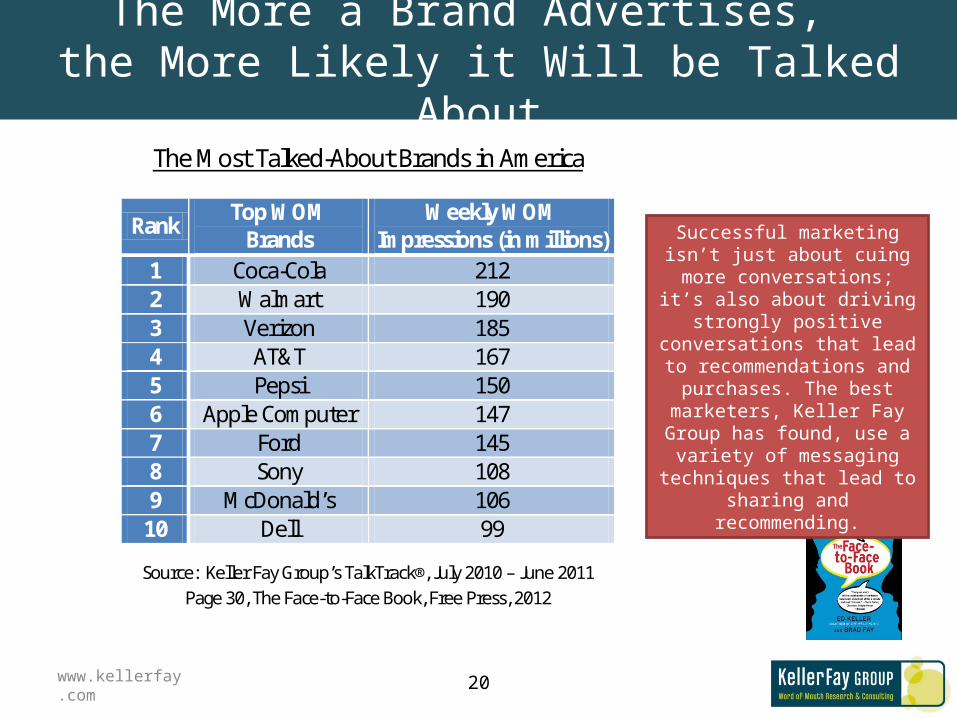
The More a Brand Advertises, the More Likely it Will be Talked AboutThe Most Talked-About Brands in America
Rank Top WOM
Brands Weekly WOM
Impressions (in millions) 1 Coca-Cola 212 2 Walmart 190 3 Verizon 185 4 AT&T 167 5 Pepsi 150 6 Apple Computer 147 7 Ford 145 8 Sony 108 9 McDonald’s 106
10 Dell 99
Source: Keller Fay Group’s TalkTrack®, July 2010 – June 2011 Page 30, The Face-to-Face Book, Free Press, 2012
Successful marketing isn’t just about cuing more conversations;
it’s also about driving strongly positive conversations that lead to recommendations and purchases.
The best marketers, Keller Fay Group has found, use a variety of messaging techniques that lead to
sharing and recommending.
www.kellerfay.com
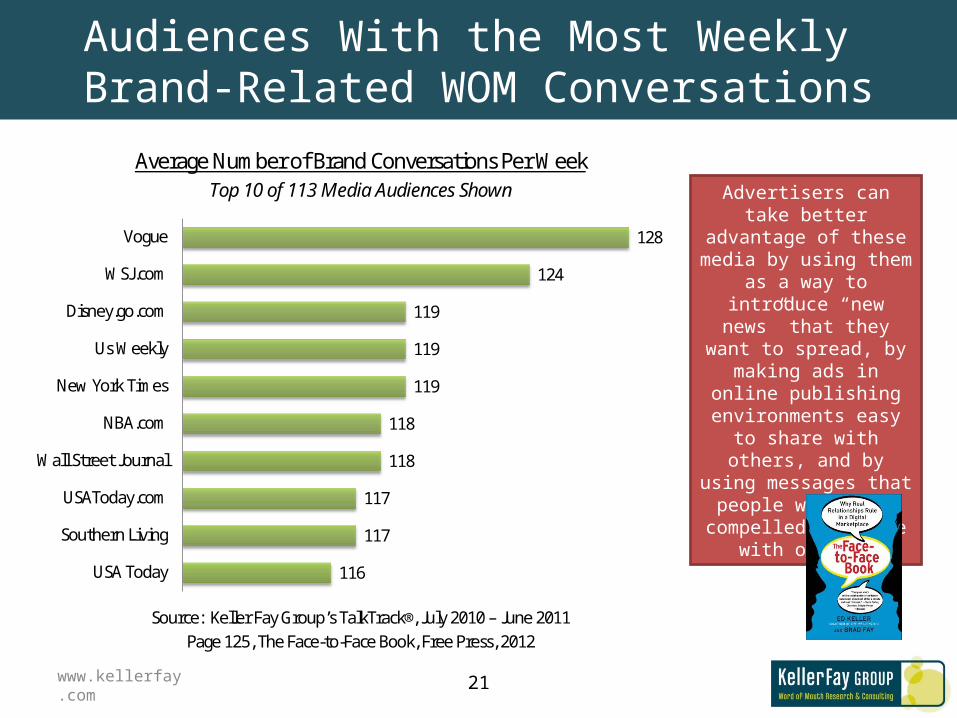
Audiences With the Most Weekly Brand-Related WOM Conversations
Average Number of Brand Conversations Per Week Top 10 of 113 Media Audiences Shown
Source: Keller Fay Group’s TalkTrack®, July 2010 – June 2011
Page 125, The Face-to-Face Book, Free Press, 2012
116
117
117
118
118
119
119
119
124
128
USA Today
Southern Living
USAToday.com
Wall Street Journal
NBA.com
New York Times
Us Weekly
Disney.go.com
WSJ.com
Vogue
Advertisers can take better advantage of these media by using them as a way to
introduce “new news” that they want to spread, by
making ads in online publishing environments
easy to share with others, and by using messages that people will feel compelled
to share with others.
21

www.kellerfay.com
Brand WOM in Stores is More Likely to Lead to Purchase Intent
Percentage Rating WOM Highly Likely to Inspire Purchase Intent “9” or “10” on 0-10 scale
Source: Keller Fay Group’s TalkTrack®, July 2010 – June 2011
Page 129, The Face-to-Face Book, Free Press, 2012
50%57%
Any Location In a Store
5% of all brand conversations actually occurs inside a store.
Though not a very large percentage, this is a very
large volume, as consumers are exposed
to in-store conversations some 750 million times per week.
22
www.kellerfay.com
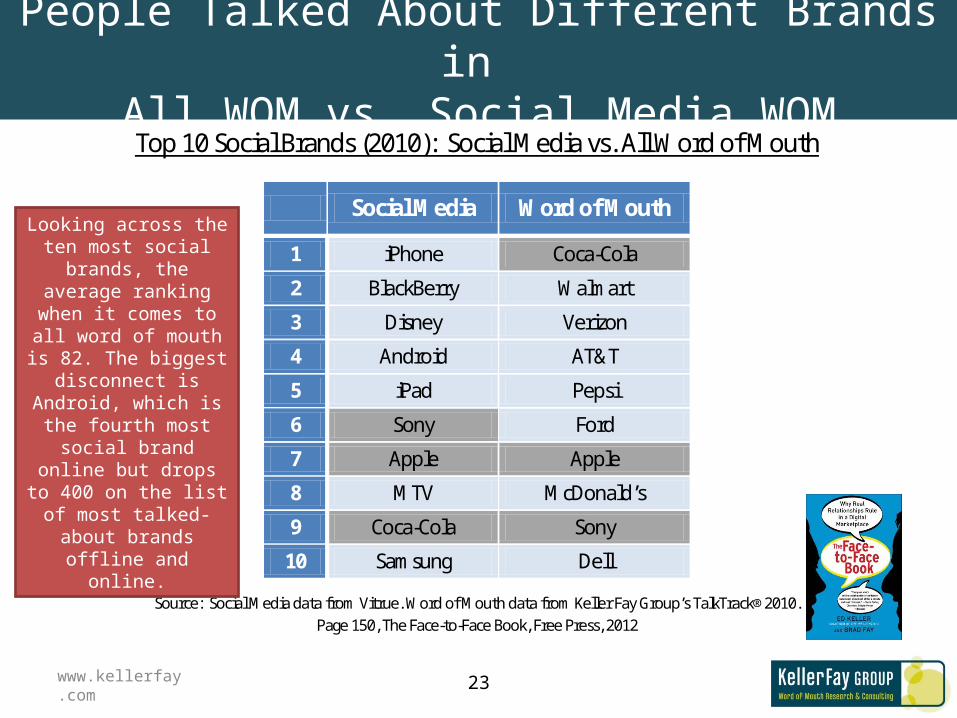
People Talked About Different Brands in All WOM vs. Social Media WOM
Top 10 Social Brands (2010): Social Media vs. All Word of Mouth
Social Media Word of Mouth
1 iPhone Coca-Cola
2 BlackBerry Walmart
3 Disney Verizon
4 Android AT&T
5 iPad Pepsi
6 Sony Ford
7 Apple Apple
8 MTV McDonald’s
9 Coca-Cola Sony
10 Samsung Dell
Source: Social Media data from Vitrue. Word of Mouth data from Keller Fay Group’s TalkTrack® 2010. Page 150, The Face-to-Face Book, Free Press, 2012
Looking across the ten most social brands, the average ranking when it
comes to all word of mouth is 82. The biggest
disconnect is Android, which is the fourth most social brand online but
drops to 400 on the list of most talked-about brands
offline and online.
23
www.kellerfay.com 24
WOM Stats
Summary Tactics
www.kellerfay.com 25
Consider WOM in all stages of planning
Consumers are social, and the goal of all marketing is to activate our true, social nature
•Start with your story – make it compelling and “talkworthy”
•Tap the right talkers – put your media in front of the people who will most likely talk about you. We call them Conversation Catalysts®
•Choose your channels – focus on the media outlets that will be most effective 1) telling your story and 2) targeting your Conversation Catalysts®