
Face Recognition using FSS-DSOP for Small Sample … · 2009-11-06 · metric-based NN classifiers,...
14
Int. J. Advance. Soft Comput. Appl., Vol. 1, No. 2, November 2009 ISSN 2074-8523; Copyright © ICSRS Publication, 2009 www.i-csrs.org Face Recognition using FSS-DSOP for Small Sample Size Problem with Illumination Variations Ganesh Bhat, K.K. Achary Canara Engineering College,Department of Electronics, India e-mail:[email protected] Department of Statistics,Mangalore University, India e-mail:[email protected] Abstract In this paper we propose a method termed as Face-Specific Subspace DCT Sign Only Product (FSS–DSOP), for face recognition. The proposed method is based on Face-Specific Subspace (FSS) technique using Discrete Cosine Transform (DCT) sign only product as similarity measure. The proposed approach aims to improve the recognition rate of the FSS technique under small size scenario with illumination variations by making use of DCT sign-only inner product similarity measure for classification. Results obtained from a set of experiments using small training sets sampled from illumination subset of extended Yale-B and PIE face database indicate that the proposed methodology achieves better recognition rate when compared to FSS. Keywords: Correlation filters, Discrete cosine transform, Pattern classification, Principal component analysis. 1 Introduction The goal in face recognition task is to classify a given test image to one of the N classes present in the database. The most commonly used global approaches for face recognition are based on Principal component Analysis (PCA) [18] and Linear Discrimenant Analysis (LDA) [2]. Recently methods such as correlation filters [20] and FSS [14] have been proposed to solve the face recognition problem, these techniques rely on local or class information and are hence commonly termed as domain description approaches. In domain description techniques the task is not to look for subspace such that the class centers are far
-
Upload
hoangquynh -
Category
Documents
-
view
217 -
download
0
Transcript of Face Recognition using FSS-DSOP for Small Sample … · 2009-11-06 · metric-based NN classifiers,...
Int. J. Advance. Soft Comput. Appl., Vol. 1, No. 2, November 2009 ISSN 2074-8523; Copyright © ICSRS Publication, 2009 www.i-csrs.org
Face Recognition using FSS-DSOP for Small Sample Size Problem with Illumination
Variations
Ganesh Bhat, K.K. Achary Canara Engineering College,Department of Electronics, India
e-mail:[email protected]
Department of Statistics,Mangalore University, India e-mail:[email protected]
Abstract
In this paper we propose a method termed as Face-Specific Subspace DCT Sign Only Product (FSS–DSOP), for face recognition. The proposed method is based on Face-Specific Subspace (FSS) technique using Discrete Cosine Transform (DCT) sign only product as similarity measure. The proposed approach aims to improve the recognition rate of the FSS technique under small size scenario with illumination variations by making use of DCT sign-only inner product similarity measure for classification. Results obtained from a set of experiments using small training sets sampled from illumination subset of extended Yale-B and PIE face database indicate that the proposed methodology achieves better recognition rate when compared to FSS.
Keywords: Correlation filters, Discrete cosine transform, Pattern classification, Principal component analysis.
1 Introduction
The goal in face recognition task is to classify a given test image to one of the N classes present in the database. The most commonly used global approaches for face recognition are based on Principal component Analysis (PCA) [18] and Linear Discrimenant Analysis (LDA) [2]. Recently methods such as correlation filters [20] and FSS [14] have been proposed to solve the face recognition problem, these techniques rely on local or class information and are hence commonly termed as domain description approaches. In domain description techniques the task is not to look for subspace such that the class centers are far
Ganesh Bhat et al. 106
apart while the spread within each class is small as in the case of LDA based classifiers, but to give a general description for a class of objects represented by the training set. Making use of the reconstruction error nature of the Eigenface method an approach termed as FSS has been proposed [14,15] and its superiority over PCA and template matching technique in recognizing human faces under varying illumination conditions has been demonstrated.
Learning in most of the global discriminant learning algorithms is based on a distance metric as similarity measure where as domain description techniques such as canonical correlation analysis [4], correlation filters and correlation based nearest neighbor (NN) classifiers use correlation as similarity measure.Compared to Euclidean and Mahalanobis distance, correlation is not a metric as it cannot satisfy the non-negativity and the triangle inequality. Based on the fact that correlation-based NN classifiers achieve better performance than Euclidean metric-based NN classifiers, face recognition algorithm combining PCA, LDA, and NN classifier based on correlation measure has been proposed [7] to achieve superior performance to other frameworks. It is just this point that inspires us on using correlation similarity measure over error residue distance measure used in the FSS approach. The main idea of the proposed FSS -DSOP approach is very similar to the FSS approach where each of the class is represented by a set of domain description vector which captures most of the structural information of the class in the data space.Under small sample size (SSS) scenario with illumination variations Fisherfaces/LDA approach [1] may not perform as well as some of the domain description classifiers, however recently a variation in multi-class LDA approach based on regularization termed as Regularized Linear Discrimenant Analysis (R-LDA) has been proposed [21,10,6] to obtain optimal recognition rates for a given size of training set. Since the proposed FSS-DSOP approach is based on FSS a comparative study of identification rate is made between FSS-DSOP, FSS, and R-LDA which is used as a base line algorithm for comparison of recognition rate with varying size of training data.
The rest of the paper is organized as follows. Section 2 provides some background on FSS, sign only correlation and R-LDA. Section 3 gives details of the proposed approach and evaluation procedure. Section 4 provides evaluation results of the FSS–DSOP approach along with a comparison with the FSS and R-LDA methods using illumination subset of Extended Yale-B and PIE face database. Finally, conclusions are provided in section 5.
2 Background
2.1 Face-Specific Subspace (FSS) approach
The eigenface approach to face recognition, also known as PCA, was introduced by Turk and Pentland [18] where in training images from all the classes are used to construct an eigenspace within which face images of each of the classes form a

107 Face Recognition using FSS-DSOP
cluster. The eigenspace so formed not only captures variation between different training class, but also the variation within a given class making it venerable to errors in recognizing images with change in expression and illumination. Making use of the fact that eigenface transform is the optimal transform in terms of minimum square error, it is found that face authentication performance can be improved by constructing eigenspaces from the face images of one person since it is optimally tuned to that person [14,15]. This approach is termed as FSS approach. The outline of FSS approach is as follows. Suppose the training set is made up of r classes each consisting of nr training images with mr rows and mc columns arranged lexicographically as a m dimensional column vector
,1 11
,r
r c rn ri
m n m m m n nR where=
×⎡ ⎤ ⎡ ⎤ = × =∑⎣ ⎦ ⎣ ⎦= = ∈A a a A A,....., ..... , ,
Let, iN be the index set of data items in the class iA . The average face of subject r
is 1r
nr jj Nr
n ∈= ∑µ a , The difference between each face of subject r and average rµ of
the class is computed as i i i= −S A µ . Based on Ti iS S , q eigenvectors derived from
class r and denoted as m qi R ×∈U .
( )Ti i ieig=U S S (1)
For a given test image f the projections of f in the eigenspace of class i is obtained as ( )i i= −λ U f µ , using these projections the test image f can be reconstructed as ˆ i=y U λ . Classification of a given test image is based on reconstruction error between the mean-adjusted test image ( )i= −y f µ and
reconstructed image y ,i.e., 2ˆe = −y y which is also commonly termed as residue and the test image is categorized to the class with least residue .
Fig.1 illustrates the first 10 Eigenfaces visualized. It is obvious that the leading Eigenfaces express face patterns to a greater extent, whereas the lower ones portray variance among different faces. The visual effect of Eigenfaces suggests that the leading Eigenfaces represent the common patterns of all faces learnt in the training set, whereas the secondary Eigenfaces collect the between-face variance and noise.
Fig 1. Leading 10 Eigenfaces trained from 44 images of a sample subject of the
PIE illumination face database.
Ganesh Bhat et al. 108
2.2 Regularized Linear Discriminant Analysis (R-LDA)
The basic idea behind the design of global linear classifiers such as LDA is to find a low dimensional subspace by means of a linear transformation so as to maximize the between-class scatter and minimize the within-class scatter so that the subspace obtained exhibits maximum class separation. For a given training set as denoted in section 2.1 the between-class scatter bS , within-class scatter wS and total scatter bS matrix are defined as,
1
( )r
i ib in µ µ
== −∑S
1( )( )
n Tw i i i i
j Ni ia aµ µ
∈== − −∑ ∑S
1( )( )
n Tw i i i i
j Ni ia aµ µ
∈== − −∑ ∑S (2)
Where,
1
1 1n ri
ri i ii j N jia andn r∈ =
= =∑ ∑µ µ µ (3)
The optimization criterion in LDA is to find a linear transform TW which
maximizes,
( ) ( )1T Tw btrace
−⎛ ⎞⎜ ⎟⎝ ⎠
W S W W S W (4)
This criterion is maximized when the columns of W are the eigenvectors corresponding to the 1r − largest eigenvalues of,
,i i iB Wλ=S w S w 1. . ( )i B Wi e Eig −=w S S
However in many practical problems there are situations where in number of data samples available are much smaller than dimension of the data space, making application of classical LDA difficult due the ill-posed problem resulting from the limited learning dataset. In order to make LDA applicable to high dimensional small sample size data, a variation in the original LDA technique called as R-LDA is derived, where a diagonal matrix αI with 1 0α> > is added to wS when wS is singular or ill-conditioned. Since wS is symmetric positive semi-definite, w α+S I is nonsingular for any 0α > , therefore one can apply the classical LDA to solve the eigenvalue problem, see [6] for further discussion.
2.3 DCT sign-only correlation and sign-only inner product
Correlation filters [3,11,13] and kernel correlation filters make use of correlation similarity measure in frequency domain using Discrete Fourier Transform (DFT) to build authorization systems where the objective is to decide on the authenticity of the test image. In this work we use DCT as the frequency domain transformation. DCT can consider as a special case of DFT where in the phase component is zero and the structural information present in the phase part of the DFT is contained in the sign of the DCT coefficients. Similar to the concept of Fourier phase only correlation [15,16], the idea behind DCT sign only correlation
109 Face Recognition using FSS-DSOP
is to use the important information about the features and details in an image at reduced representation cost [5]. Also, the sign information of the DCT coefficients (called DCT signs) is robust against scalar quantization noise because positive signs do not change to negative signs and vice versa. Moreover, the concise expression of DCT signs saves physical space to calculate and store them. Because of these DCT properties, target image search and retrieval taking advantage of the DCT signs in coded image has been studied [8].
Unlike DFT which transforms real input into complex coefficients, DCT transforms real inputs in to real coefficients. There are four different types of DCT, type II is the one which is commonly used for image coding. The 2D version of DCT type II transform and its inverse is given as
( )
( )( ) ( )( )1 2
1 1 2 21 2 1 2 1 21 2
( , )
2 1 2 12 ( ) ( ) ( , ) cos cos2 2
C
n n
x k k
n k n kw k w k x n nN N N
π π
=
+ +⋅ ⋅∑ ∑
F
(5)
( )
( ) ( )1 2 1 2
1 1 2 21 2 1 2
1 2 1 2
( , ) ( , )
2 1 2 12( ) ( ) ( , ) cos cos
2 2
C
k k
x n n x k k
k n k nw n w n x k k
N N N
π π
= =
+ +⋅ ⋅∑ ∑
⎛ ⎞ ⎛ ⎞⎜ ⎟ ⎜ ⎟⎝ ⎠ ⎝ ⎠
IF
(6)
Where, 1 2( , )x n n is the 2D matrix with 0≤n1<N1 & 0≤n2<N2, FC(x(k1,k2)) represents the 2D-DCT with 0≤k1<N1 & 0≤k2<N2, with normalization coefficient w(k) is given as
{1 / 2 ( 0)( )1 ( 0)
nw nn
==
≠ (7)
The signs of ( )1 2( , )C x k kF are computed as,
( ) { 1 ( ( , ) 0)sgn ( , )
1 ( ( , ) 0)x i j
x i jx i j
− <=
+ ≥ (8)
For given image X and a template G with their respective DCT coefficients
FC ( )X , FC ( )G , let FC ( )x and FC ( )g represent vectors obtained by lexicographically arranging FC ( )X and FC ( )G , then the normalized correlation surface in frequency domain can be expressed in terms of cross product between these vectors as
( ) ( )
( )( )C C
C CC= ⊗
F x F gR F gF x (9)
But since DCT coefficients are real numbers sgn( )/ xx x = , so the above equation can be written as
( ) ( )( ) ( )
sgn ( ) sgn ( ) ( ) ( )( )( )C C
C C CCCs s= ⊗ = ⊗ = ⊗
F x F gR F x F g F x F gF gF x (10)
Ganesh Bhat et al. 110
The correlation surface/plane of ,x g in spatial domain is obtained by computing the inverse 2D-DCT of CR ie. ( )C CIF R .
While correlation similarity metric has attractive properties such as shift-invariance and tolerance to illumination over the commonly used distance measures such as L1-norm and L2-norm, determining the correlation plane can be computationally demanding during the testing/identification phase because of the need to carry out multiple 2D-IDCT and cross products. In case of face recognition problem methods which are computationally less complex are sought during the testing phase as the decision processes is based on similarity /distance of the given test image over a large number of classes. One of the ways to reduce this computational complexity is to replace the cross product by inner product (dot product). The normalized inner product between lexicographically arranged vectors FC ( )x and FC ( )g can hence be computed as.
( ) ( )( , ) ( ) ( )
C CCC
d = ⋅F FF F
x gx g x g (11)
3 FSS-DSOP
Making use of the distance from subspace, i.e., reconstruction error nature of the Eigenface method which is used to detect occurrence of face S.Shan, W. Gao, and D. Zhao [15], proposed the FSS approach and demonstrated the superiority of the FSS approach over traditional Eigenface and template matching approach for recognizing human faces under variation in lighting using Yale face database B. Though the FSS approach outperformed the Eigenface and template matching approach and its computational complexity is linear, it demands more storage requirements as one needs to store the dominant eigenvectors as well as the mean vector of each class in order to compute the residue error between the mean-adjusted test image and reconstructed image. FSS-DSOP approach uses DCT Sign-Only Inner Product similarity measure between the scaled version of the dominant principal components and the test image.
Using DCT sign-only inner product as a similarity measure not only reduces the memory storage requirement as it eliminates the need to store each of the class mean vector and the m dimensional real valued eigenvector is replaced by m dimensional bipolar vector, but is also expected to makes the similarity measure less sensitive to lighting variations in the test image and the training set. Our experimental listed in Section 4.1 and 4.2 strongly support this conclusion.
For a given set of N training images per subject the design procedure for the proposed algorithm termed as FSS–DSOP is given in section 3.1.

111 Face Recognition using FSS-DSOP
3.1 Algorithm
Input training: A set of N images of dimension mr × mc from a given class/ subject.
I. Training Phase: Step1. Obtain the K dominant eigenvectors accounting for 98% of variance seen in a given class using equation 1. Step2. Scale the coefficients of the eigenvectors obtained from step1 to a range of 0-255 and rearrange the column vector in matrix form with mr rows and mc columns. Step3. Get the 2D DCT representation of the scaled 2D version of largest eigenvector using equation 5. Step4. Perform sign only quantization of DCT coefficients using equation 8. Step5. Repeat step 1-3 to build a vector code book consisting of M×K bipolar vectors representing M subjects.
II. Testing phase: Step1. Read the test image to be classified. Step2. Obtain DCT Sign only representation using equations 5 and 8. Step3. Determine the sum of inner product between the DCT sign only representation of the test image with each of the set of bipolar vectors in the designed vector code book. Step4. Associate the test image to the class represented by the code book vectors having the largest cumulative inner product value.
3.2 Evaluation methods
In order to have a measure of representation of the training dataset by the code book vectors obtained from the algorithm the following five tests are conducted.
A. SSS test: The SSS test lists the recognition rate of a given approach with varying number of training samples so as to evaluate its learning ability with limited number of training samples. The number of training samples per subject, L, is increased from 2 to 20 (i.e. 3% - 31% of the total dataset) in case of Extended Yale B database and 2 to 12 (i.e. 4% - 28% of the total dataset) for illumination set of PIE database. In each round, L images are randomly selected from each of the subjects in the database for training and the remaining images of the same subject are used in the test set. For each L, 10 tests were performed and the results are averaged and listed. B. Out-Database test: To test the ability of the algorithm to identify known faces with unknown variations i.e. expressions unseen during training, we use the hold out method/leave one out method by excluding all images with identical expression from the training set and use this hold out images from each of the individual as the test set. Analysis of the identification rate of this test reveals

Ganesh Bhat et al. 112
performance of the algorithm to identify subjects with a particular expression unseen during training. C. Best 2: In this model of evaluation two expressions in a given data base with best identification rate during Out-Database test method are considered for training. And the test set consisted of all the images belonging to the rest of the expressions. D. Least 2: This model of evaluation is similar to that Best 2 but instead of using expressions with best identification rate for training we use the expressions associated with least identification rate during the Out-database test method as the training set. E. Interim 2: In this mode of evaluation, the training set consists of two expressions, with intermediate identification rate during the leave one out test.
4 Experimental Evaluation and Results
In order to establish the validity of the FSS–DSOP algorithm for face recognition problem, it is tested two standard frontal face datasets (cropped versions of Extended Yale-B & illumination subset of PIE) exhibiting large illumination variations. For computational efficiency the images in all the datasets were down sampled to size of 32 32× pixels. We compare the verification results of FSS–DSOP approach with standard FSS and R-LDA approach. Since R-LDA algorithm is used as benchmark algorithm for performance evaluation of FSS and FSS–DSOP approach regularization parameter α which influences the recognition rate of the R-LDA algorithm needs to be optimally chosen, for the size of training set (L) considered the regularization parameter α of the R-LDA algorithm is evaluated initially over a test grid of α = [0.001;0.05:1] using L number of randomly selected training samples per subject. The value of α (α*) which is associated with the best recognition rate for the given L is later used for the SSS, best2, least2 and intrim2 tests. For out-database test the best value of α is obtained in a similar manner by choosing the first expression of each of the subject in the database as the test set. For the FSS and FSS–DSOP approach first K dominant eigenvectors of a class which account for 98% of the class variance are retained.
4.1 Experiments on illumination subset Extended Yale-B database
The illumination subset of extended Yale Face Database B [9] contains of 28 human subjects under 64 illumination conditions. We use the cropped version of this dataset; Fig 2. shows images/expressions of one of the subjects in this database.
Table 1 & 2 gives a comparative list of experimental results obtained using the evaluation methods discussed in section 3.2. Fig.3 gives further details of ten trials of the SSS on extended Yale b database in form of box plots. Fig.4 shows

113 Face Recognition using FSS-DSOP
the plot of identification rate of each of the expression using the holdout-expression/out-database method.
Fig 2. Images of the first subject from Extended Yale-B face database arranged
sequentially (top left to bottom right) in terms of the expression index 1-64.
Table 1: Recognition Rate/std in % of FSS-DSOP, FSS using K dominant eigen vectors and R-LDA, using SSS test on Extended Yale-B face database. Training samples/subject (L)
2 4 6 8 16 20
FSS- DSOP (K)
65/8.6 (2)
74/7.2 (3)
80/4.2 (3)
83/3.1 (3)
86/3.3 (4)
87/2.2 (5)
FSS (K)
35/4.5 (2)
53/8.8 (3)
65/5.1 (3)
74/4.3 (4)
80/6 (4)
86/4 (5)
R-LDA (α*)
50/7.1 (0.95)
62/9.7 (0.55)
72/5.6 (0.05)
76/6.2 (0.05)
80/4.3 (0.001)
83/2.4 (0.001)
Table 2. Recognition Rate in % of FSS-DSOP, FSS using K dominant eigen vectors and R-LDA on Extended Yale-B face database, using evaluation methods
B- E as listed in section 3.2. Evaluation methods
Out-Database Best 2 Least 2 Interim2
FSS –DSOP (K)
92.6 (7)
74.3 (2)
66.2 (2)
76.8 (2)
FSS (K)
93. 3(7)
43.3 (2)
37.2 (2)
74.4 (2)
R-LDA (α*)
83.4 (0.001)
58.6 (0.95)
39.7 (0.95)
60 (0.95)
From the results obtained, considerable improvement in identification rate is observed for the FSS–DSOP methodover FSS and R-LDA when learning is based on small training set (L), This conclusion is confirmed by the results obtained

Ganesh Bhat et al. 114
from the best2,worst2 and intrim2 tests listed in table2. FSS–DSOP and FSS exhibit better performance than R-LDA for larger training set i.e. for L=20 and out-database test.
Fig 3. Box plots of identification rate of FSS-DSOP, FSS and R-LDA from the ten
trials of SSS tests (Yale-B database) with varying training samples
.
Fig 4. Out-data identification rate of each of the 64 expressions of Yale-B database obtained using, FSS, R-LDA and FSS-DSOP approach.
4.2 Experiments on PIE illumination subset
We focus on the frontal face illumination subset (Pose27) of the PIE database [17] consisting of 68 persons with 43 images of different illumination for each subject. . Fig.5 shows images of one of the subjects in this database.
Table 3 & 4 gives a comparative list of experimental results obtained using the evaluation methods discussed in section 3.2. Fig.6 gives further details of the ten trials of SSS test on PIE illumination subset in form of box plots. From the results obtained, improvement in identification rate is observed for the FSS–DSOP method over FSS approach, R-LDA and the FSS–DSOP approach showed almost
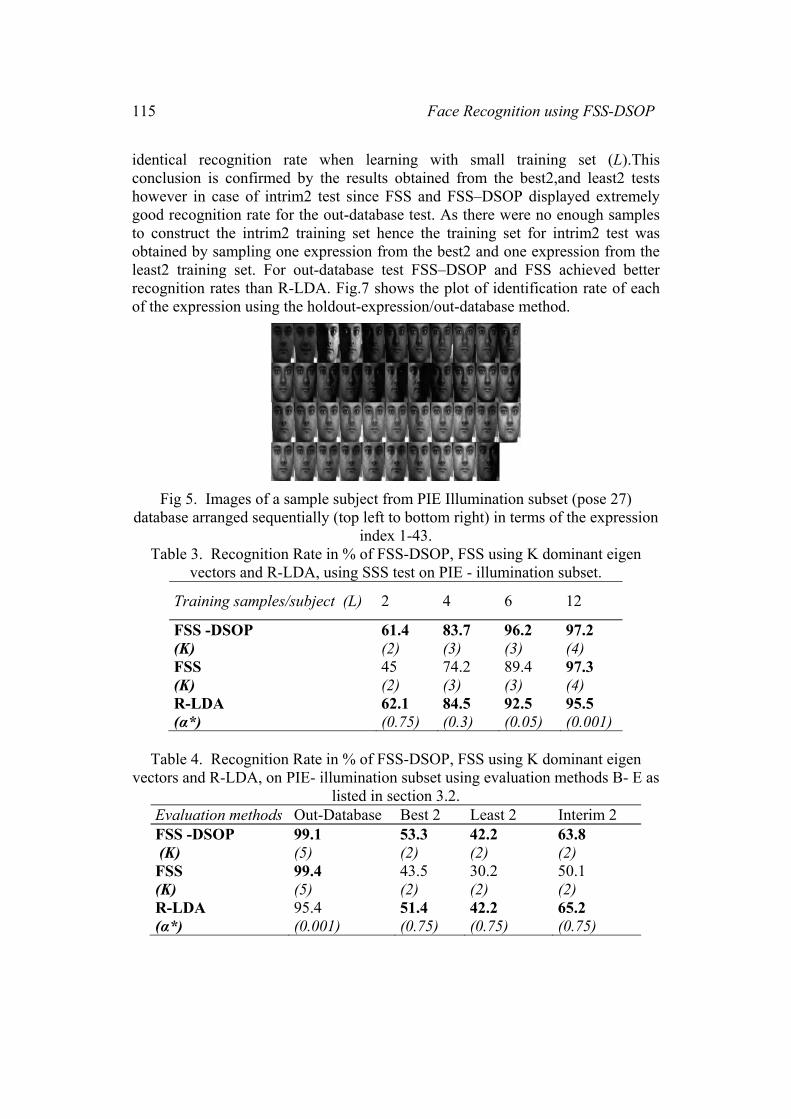
115 Face Recognition using FSS-DSOP
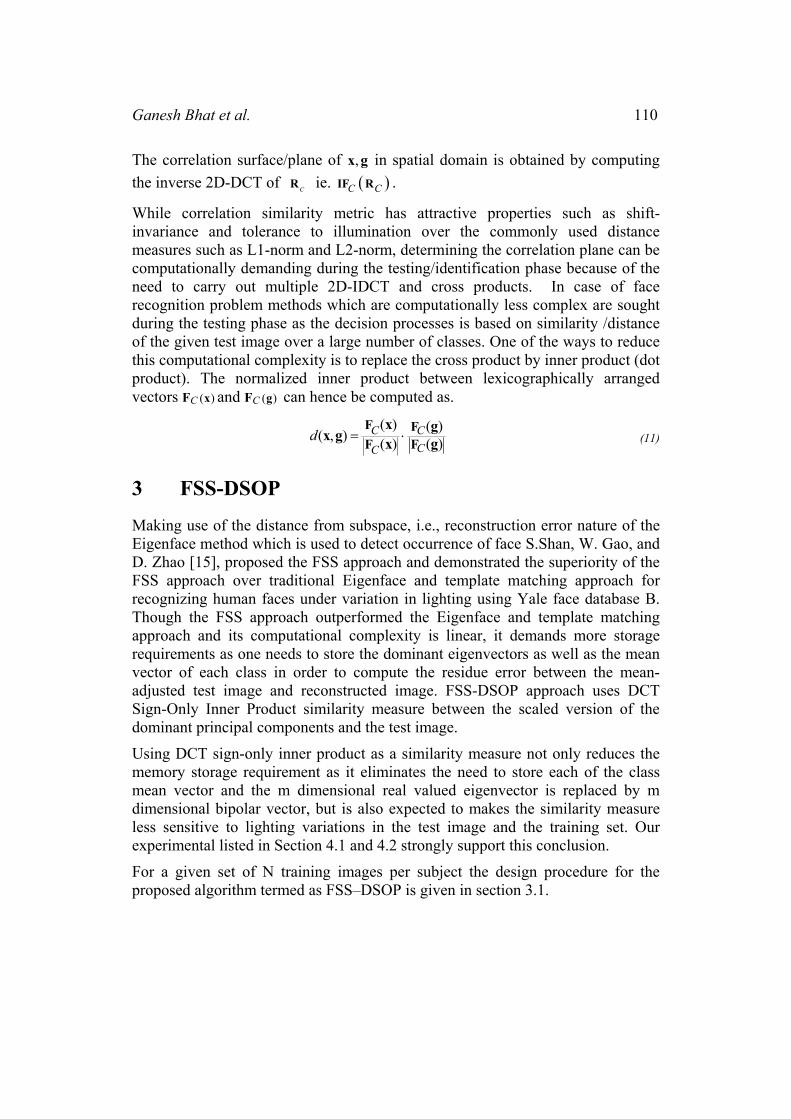
identical recognition rate when learning with small training set (L).This conclusion is confirmed by the results obtained from the best2,and least2 tests however in case of intrim2 test since FSS and FSS–DSOP displayed extremely good recognition rate for the out-database test. As there were no enough samples to construct the intrim2 training set hence the training set for intrim2 test was obtained by sampling one expression from the best2 and one expression from the least2 training set. For out-database test FSS–DSOP and FSS achieved better recognition rates than R-LDA. Fig.7 shows the plot of identification rate of each of the expression using the holdout-expression/out-database method.
Fig 5. Images of a sample subject from PIE Illumination subset (pose 27)
database arranged sequentially (top left to bottom right) in terms of the expression index 1-43.
Table 3. Recognition Rate in % of FSS-DSOP, FSS using K dominant eigen vectors and R-LDA, using SSS test on PIE - illumination subset.
Training samples/subject (L) 2 4 6 12
FSS -DSOP (K)
61.4 (2)
83.7 (3)
96.2 (3)
97.2 (4)
FSS (K)
45 (2)
74.2 (3)
89.4 (3)
97.3 (4)
R-LDA (α*)
62.1 (0.75)
84.5 (0.3)
92.5 (0.05)
95.5 (0.001)
Table 4. Recognition Rate in % of FSS-DSOP, FSS using K dominant eigen
vectors and R-LDA, on PIE- illumination subset using evaluation methods B- E as listed in section 3.2.
Evaluation methods Out-Database Best 2 Least 2 Interim 2 FSS -DSOP (K)
99.1 (5)
53.3 (2)
42.2 (2)
63.8 (2)
FSS (K)
99.4 (5)
43.5 (2)
30.2 (2)
50.1 (2)
R-LDA (α*)
95.4 (0.001)
51.4 (0.75)
42.2 (0.75)
65.2 (0.75)
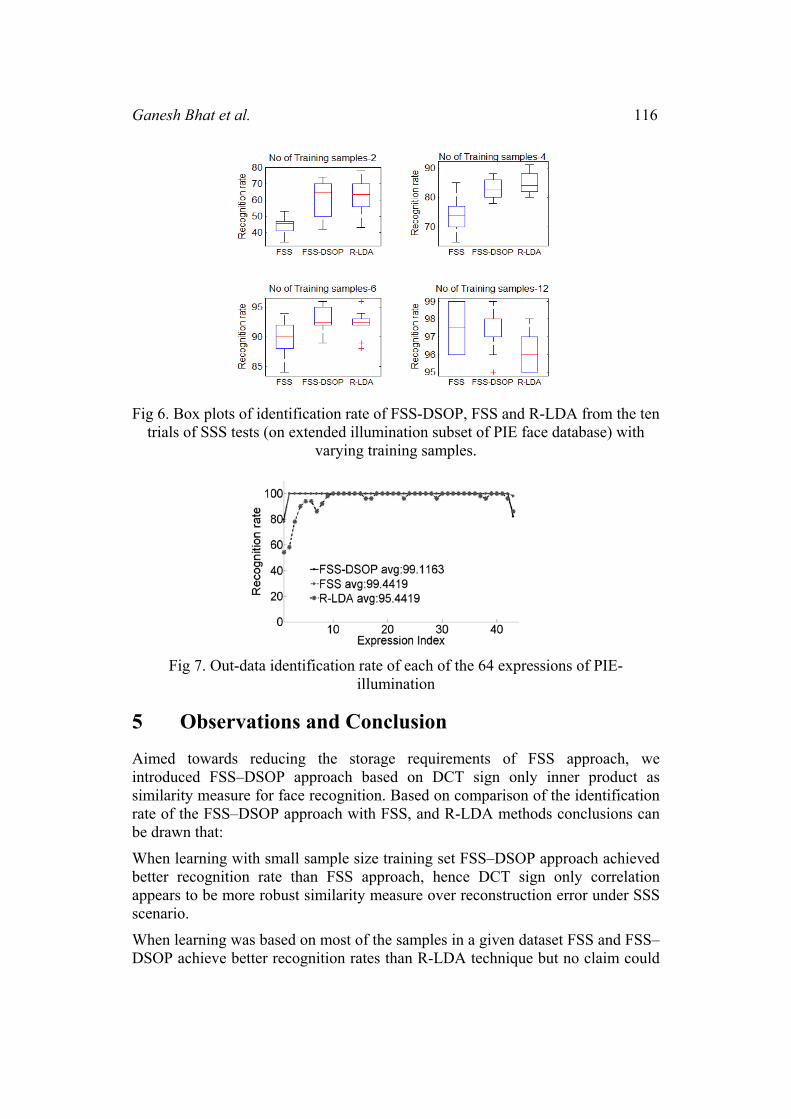
Ganesh Bhat et al. 116
Fig 6. Box plots of identification rate of FSS-DSOP, FSS and R-LDA from the ten trials of SSS tests (on extended illumination subset of PIE face database) with
varying training samples.
Fig 7. Out-data identification rate of each of the 64 expressions of PIE-
illumination
5 Observations and Conclusion
Aimed towards reducing the storage requirements of FSS approach, we introduced FSS–DSOP approach based on DCT sign only inner product as similarity measure for face recognition. Based on comparison of the identification rate of the FSS–DSOP approach with FSS, and R-LDA methods conclusions can be drawn that:
When learning with small sample size training set FSS–DSOP approach achieved better recognition rate than FSS approach, hence DCT sign only correlation appears to be more robust similarity measure over reconstruction error under SSS scenario.
When learning was based on most of the samples in a given dataset FSS and FSS–DSOP achieve better recognition rates than R-LDA technique but no claim could

117 Face Recognition using FSS-DSOP
be made between FSS and FSS–DSOP since the difference between the two seem to be insignificant, however under this scenario FSS–DSOP which uses bipolar representation of the eigenvectors in its vector code book demands lesser storage requirement compare to FSS in which one needs to store the dominant eigenvectors as well as the mean vector of each class.
Under SSS scenario from recognition rates obtained from FSS–DSOP were relatively better then R-LDA for extended Yale-B database and comparable in case of illumination subset of PIE database.
References
[1] P. Belhumeur, J. Hespanha and D. Krieman, “Eigenfaces vs. Fisherfaces: Recognition Using Class Specific linear Projections”, IEEE Trans. Pattern Analysis and Machine Intelligence Special issue on Face Recognition, 19(7), (1997) , pp.711-720.
[2] K. Etemand and R. Chellapa, “Discriminant Analysis for recognition of Human Face Images”, Journal of Optical Society of America, (1997), pp. 1724-1733.
[3] J. Friedman, “Regularized discriminant analysis”, Journal of the American Statistical association, 84(405), (1989), pp.165–175.
[4] D.R. Hardoon, S. Szedmak, and J.S. Taylor, “Canonical correlation analysis: an overview with application to learning method”, Neural Computation, (16) (2004), pp.2639-2664.
[5] Ito, H. Kiya,“DCT Sign-Only Correlation with Application to Image Matching and the Relationship with Phase-Only Correlation”, Proceedings of IEEE Conference on Acoustics, Speech and Signal Processing, Honolulu, HI, 2007, pp.1237-1240.
[6] LU Juwei, K. N. Plataniotis, and A. N. Venetsanopoulos, “Regularization studies of linear discriminant analysis in small sample size scenarios with application to face recognition”, Pattern Recognition Letters, 26(2), (2005), pp.181-191 .
[7] J. Kittler, Y.P. Li, and J. Matas, “On matching scores for LDA based face verification”, Proceedings of British Machine Vision Conference, Bristol, UK, 2000, pp. 42-51.
[8] C. D. Kuglin and C. D. Hines, “The Phase Correlation Image Alignment Method”, Proceedings of IEEE International Conference on Cybernetics and Society, New York, 1975, pp.163-165.
[9] K.C. Lee and J. Ho and D. Kriegman, “Acquiring Linear Subspaces for Face Recognition under Variable Lighting”, IEEE Trans. Pattern Anal. Mach. Intelligence, 27(5), (2005) , pp.684-698

Ganesh Bhat et al. 118
[10] J. Lu, K. Plataniotis, and A.N. Venetsanopoulos, “Face recognition using LDA based algorithms”, IEEE Transactions on Neural Networks, 14(1) (2003), pp.195–200.
[11] A. Mahalanobis, B.V.K. Vijay Kumar, and D. Casaaent, “Minimum average correlation energy filters”, Applied Optics, 26(17), (1987), pp.3633-3640.
[12] M. Savvides and B.V.K. Vijay Kumar, “Efficient Design of advanced correlation filters for robust distortion tolerant face recognition”, Proceedings of IEEE Conference on Advanced Video and Signal based Surveillance, Miami, Florida, 2003, pp.45-52.
[13] M. Savvides and B.V.K. Vijay Kumar, “Quad Phase Minimum Average Correlation Filters for Reduced Memory Illumination Tolerant Face Authentication”, Audio-and Video-Based Biometric Person Authentication 4th International Conference, Guildford, UK, 2003, pp. 45-52.
[14] S. Shan, W. Gao, X. Chen, and J. Ma, Novel face recognition based on individual Eigen-subspace , Proceedings of IEEE International Conference on Signal processing , Beijing, 2000, pp.1522-1525.
[15] S. Shan, W. Gao, and D. Zhao, Face recognition based on face-specific subspace, International Journal of Imaging Systems and Technology 13(1) (2003) , pp.23-32.
[16] K. Takita, T. Aoki, Y. Sasaki, T. Higuchi, and K. Kobayashi, “High Accuracy Subpixel Image Registration Based on Phase Only Correlation”, IEICE Transactions Fundamentals, A-86(8), (2003) , pp.1925-1934.
[17] Terence Sim, Simon Baker, and Maan Bsat, “The CMU Pose, Illumination, and Expression Database”, IEEE Transactions on Pattern Analysis and Machine Intelligence, 25(12), (2003) , pp.1615-1618.
[18] M. Turk and A. Pentland, “Eigenfaces for recognition”, Journal of Cognitive Neuroscience, (3), (1991), pp. 71-86.
[19] K. Venkataramani, S. Qidwai and B.V.K. Vijay Kumar, “Face Authentication from Cell Phone Camera Images With Illumination and Temporal Variations”, IEEE Transactions on System Man and Cybernetics, C-35(3), (2005), pp.411-418.
[20] B.V.K. Vijay Kumar, M. Savvides, C. Xie, K. Venkataramani, J. Thornton, and A. Mahalanobis, “Biometric Verification with Correlation Filters”, Applied Optics, 43(2), (2004) , pp.391-402.
[21] H. Yu, and J. Yang, “A direct LDA algorithm for high-dimensional data-with application to face recognition”, Pattern Recognition, (34), (2001), pp. 2067-2070.