Face detection method based on photoplethysmography 1: Flowchart of the face detection system based...
5
Abstract Face detection methods are in general applied frame by frame based on face characteristics. Human faces are part of a living body in which there is a constant blood flow. It has been recently demonstrated that heart rate could be estimated with simple consumer level digital cameras. In this paper, we propose a new method to detect faces in a video stream based on the detection of heart rate. Images are sliced into small regions of interest. For each region, heart rate is estimated and an index of presence is computed. A face detection map can be created by using the index of presence and the heart rate information. This system could be used to increase the robustness of face detection systems based on face characteristics only, emotion recognition or biometric systems. 1. Introduction Face detection methods are in general applied frame by frame based on face characteristics. For instance, several methods based on skin color characteristics have been proposed [1, 2]. The most commonly used method to detect faces in images or videos is the one proposed by Viola and Jones [3]. This method is based on Haar-like features for rapid face detection. Some methods have been developed to take into account time to improve the accuracy of face detection. In fact, faces are almost always moving, this information can help extracting face area over background [4] but other moving objects may be detected as faces. Another human physiological behavior is blinking. Humans blink several times per minute. This information has been successfully used to detect face liveness [5]. In fact, human faces are part of a living body in which there is a constant blood flow. Photoplethysmography (PPG) corresponds to the variations in reflected light due to cardiovascular blood volume pulse [6]. Originally, sophisticated equipment with dedicated light sources and photodetector devices was necessary to measure PPG. Recently, it has been shown that heart rate (HR) could be measured from human face with a simple consumer level digital camera under ambient light conditions of illumination of the subject’s face [7]. New noncontact methods to estimate HR have been developed [8, 9]. These methods used color video stream of subjects’ face as input. Blind source separation using Independent Component Analysis (ICA) of the color channels into independent components could isolate the cardiac pulse on one single channel. This estimation was assessed and compared to a finger blood volume pulse sensor. High accuracy and correlation were found between the two methods [8]. Another method using Principal Component Analysis (PCA) was proposed by Lewandowska et al. [9]. This second method was computationally less complex than the first one. In this study, the authors also showed that the region of interest (ROI) to use can be smaller than the whole face. In fact, the pixels on the forehead region (around 70x40 pixels) provided enough information to estimate the cardiac pulse. More physiological measurements can be estimated using similar methods. Poh et al. [10] extended their method to estimate the respiratory rate and heart rate variability. In this paper, we describe a method to detect faces by estimating physiological measures from a video (delivered by a webcam). Images from the video stream are sliced into small ROIs. The physiological measure corresponding to HR is detected and estimated for each ROI. This set of information may be used to improve the robustness of noncontact low-resolution face detection and facial expression recognition systems. 2. Methods A flowchart of the face detection system based on HR estimation is represented in Figure 1. The system consisted of a series of processing (ROI creation, HR estimation, face detection) that will be described in the following sections. 2.1. ROI creation Images were grabbed from the video stream at = 15 Hz. The video stream size was image_width x image_height = 640 x 480 pixels. Each image was sliced into ROIs. Each ROI size was roi_width x roi_height = 40 x 30 pixels. Therefore, the number of ROI was image_width/roi_width x image_heigth/roi_height = 16 x 16, i.e. 256 ROIs. Face detection method based on photoplethysmography Guillaume Gibert INSERM U846 18 avenue Doyen Lépine, 69500, Bron, France [email protected] David D’Alessandro INSERM U846 18 avenue Doyen Lépine, 69500, Bron, France [email protected] Florian Lance INSERM U846 18 avenue Doyen Lépine, 69500, Bron, France [email protected] Workshop on Low-Resolution Face Analysis (LRFA) in conjunction with 2013 10th IEEE International Conference on Advanced Video and Signal Based Surveillance 978-1-4799-0703-8/13/$31.00 ©2013 IEEE 449
Transcript of Face detection method based on photoplethysmography 1: Flowchart of the face detection system based...
Abstract
Face detection methods are in general applied frame by
frame based on face characteristics. Human faces are part
of a living body in which there is a constant blood flow. It
has been recently demonstrated that heart rate could be
estimated with simple consumer level digital cameras. In
this paper, we propose a new method to detect faces in a
video stream based on the detection of heart rate. Images
are sliced into small regions of interest. For each region,
heart rate is estimated and an index of presence is
computed. A face detection map can be created by using
the index of presence and the heart rate information. This
system could be used to increase the robustness of face
detection systems based on face characteristics only,
emotion recognition or biometric systems.
1. Introduction
Face detection methods are in general applied frame by
frame based on face characteristics. For instance, several
methods based on skin color characteristics have been
proposed [1, 2]. The most commonly used method to
detect faces in images or videos is the one proposed by
Viola and Jones [3]. This method is based on Haar-like
features for rapid face detection. Some methods have been
developed to take into account time to improve the
accuracy of face detection. In fact, faces are almost always
moving, this information can help extracting face area
over background [4] but other moving objects may be
detected as faces. Another human physiological behavior
is blinking. Humans blink several times per minute. This
information has been successfully used to detect face
liveness [5]. In fact, human faces are part of a living body
in which there is a constant blood flow.
Photoplethysmography (PPG) corresponds to the
variations in reflected light due to cardiovascular blood
volume pulse [6]. Originally, sophisticated equipment with
dedicated light sources and photodetector devices was
necessary to measure PPG. Recently, it has been shown
that heart rate (HR) could be measured from human face
with a simple consumer level digital camera under
ambient light conditions of illumination of the subject’s
face [7]. New noncontact methods to estimate HR have
been developed [8, 9]. These methods used color video
stream of subjects’ face as input. Blind source separation
using Independent Component Analysis (ICA) of the color
channels into independent components could isolate the
cardiac pulse on one single channel. This estimation was
assessed and compared to a finger blood volume pulse
sensor. High accuracy and correlation were found between
the two methods [8]. Another method using Principal
Component Analysis (PCA) was proposed by
Lewandowska et al. [9]. This second method was
computationally less complex than the first one. In this
study, the authors also showed that the region of interest
(ROI) to use can be smaller than the whole face. In fact,
the pixels on the forehead region (around 70x40 pixels)
provided enough information to estimate the cardiac pulse.
More physiological measurements can be estimated using
similar methods. Poh et al. [10] extended their method to
estimate the respiratory rate and heart rate variability.
In this paper, we describe a method to detect faces by
estimating physiological measures from a video (delivered
by a webcam). Images from the video stream are sliced
into small ROIs. The physiological measure corresponding
to HR is detected and estimated for each ROI. This set of
information may be used to improve the robustness of
noncontact low-resolution face detection and facial
expression recognition systems.
2. Methods
A flowchart of the face detection system based on HR
estimation is represented in Figure 1. The system
consisted of a series of processing (ROI creation, HR
estimation, face detection) that will be described in the
following sections.
2.1. ROI creation
Images were grabbed from the video stream at �� = 15
Hz. The video stream size was image_width x
image_height = 640 x 480 pixels. Each image was sliced
into ROIs. Each ROI size was roi_width x roi_height = 40
x 30 pixels. Therefore, the number of ROI was
image_width/roi_width x image_heigth/roi_height = 16 x
16, i.e. 256 ROIs.
Face detection method based on photoplethysmography
Guillaume Gibert
INSERM U846
18 avenue Doyen Lépine,
69500, Bron, France [email protected]
David D’Alessandro
INSERM U846
18 avenue Doyen Lépine, 69500,
Bron, France [email protected]
Florian Lance
INSERM U846
18 avenue Doyen Lépine,
69500, Bron, France [email protected]
Workshop on Low-Resolution Face Analysis (LRFA) in conjunction with 2013 10th IEEE International Conference on Advanced Video and Signal Based Surveillance
978-1-4799-0703-8/13/$31.00 ©2013 IEEE 449
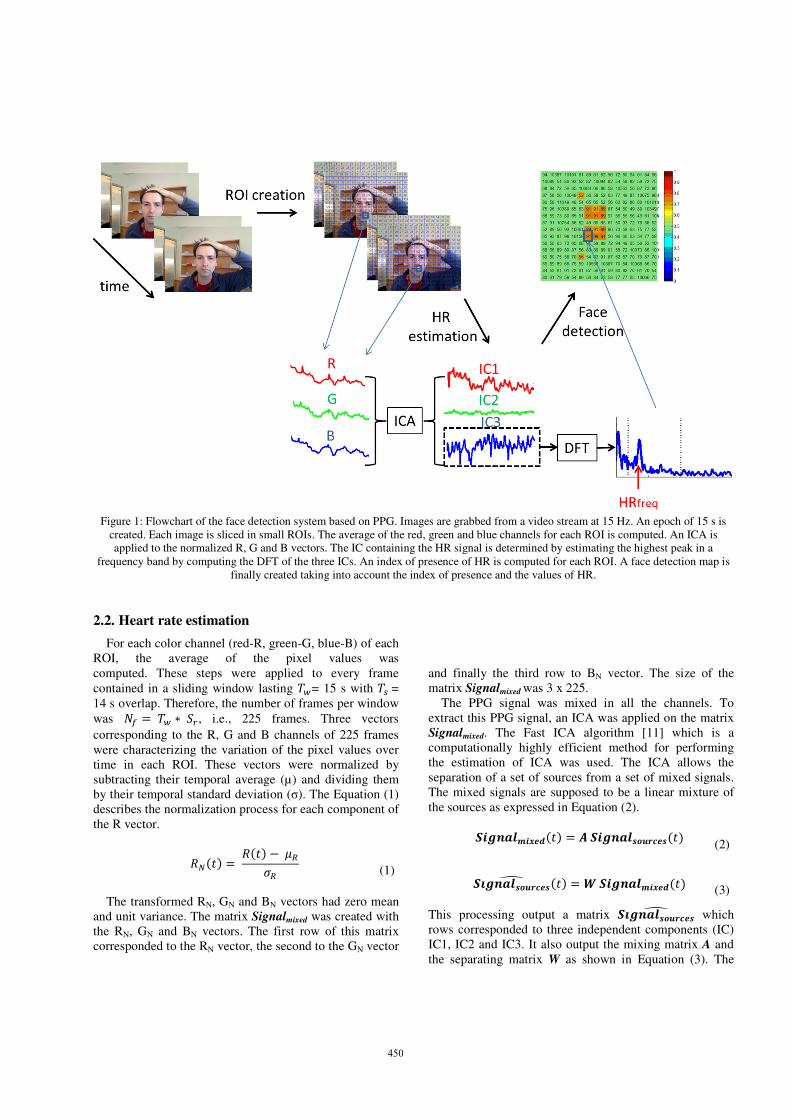
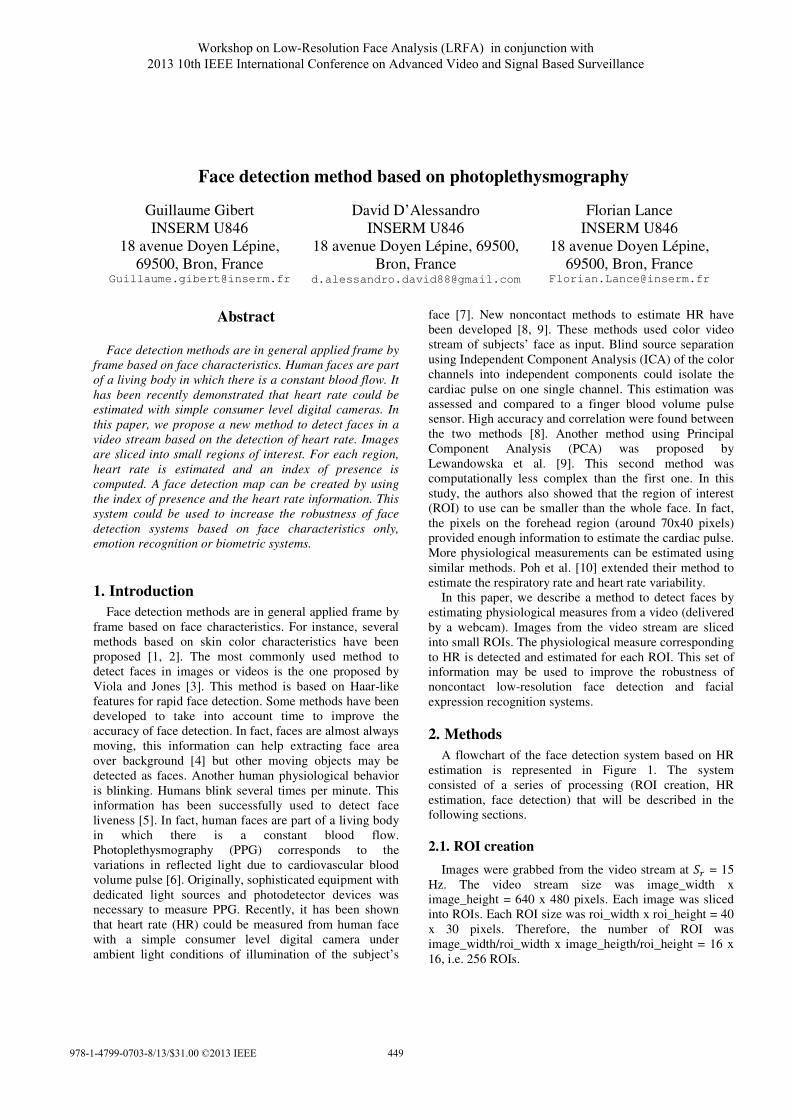
Figure 1: Flowchart of the face detection system based on PPG. Images are grabbed from a video stream at 15 Hz. An epoch of 15 s is
created. Each image is sliced in small ROIs. The average of the red, green and blue channels for each ROI is computed. An ICA is
applied to the normalized R, G and B vectors. The IC containing the HR signal is determined by estimating the highest peak in a
frequency band by computing the DFT of the three ICs. An index of presence of HR is computed for each ROI. A face detection map is
finally created taking into account the index of presence and the values of HR.
2.2. Heart rate estimation
For each color channel (red-R, green-G, blue-B) of each
ROI, the average of the pixel values was
computed. These steps were applied to every frame
contained in a sliding window lasting ��= 15 s with �� =
14 s overlap. Therefore, the number of frames per window
was �� =�� ∗ ��, i.e., 225 frames. Three vectors
corresponding to the R, G and B channels of 225 frames
were characterizing the variation of the pixel values over
time in each ROI. These vectors were normalized by
subtracting their temporal average (µ) and dividing them
by their temporal standard deviation (σ). The Equation (1)
describes the normalization process for each component of
the R vector.
�� �� = � �� −��
�� (1)
The transformed RN, GN and BN vectors had zero mean
and unit variance. The matrix Signalmixed was created with
the RN, GN and BN vectors. The first row of this matrix
corresponded to the RN vector, the second to the GN vector
and finally the third row to BN vector. The size of the
matrix Signalmixed was 3 x 225.
The PPG signal was mixed in all the channels. To
extract this PPG signal, an ICA was applied on the matrix
Signalmixed. The Fast ICA algorithm [11] which is a
computationally highly efficient method for performing
the estimation of ICA was used. The ICA allows the
separation of a set of sources from a set of mixed signals.
The mixed signals are supposed to be a linear mixture of
the sources as expressed in Equation (2).
����������� �� = �������� !"#�� �� (2)
�$����� !"#��% �� = &����������� �� (3)
This processing output a matrix �$����� !"#��% which
rows corresponded to three independent components (IC)
IC1, IC2 and IC3. It also output the mixing matrix A and
the separating matrix W as shown in Equation (3). The
450
PPG signal was separated and projected mainly on one
source. There is no ordering of the ICA components, each
component was independent from the other ones.
Therefore, the PPG signal may be on the first, the second
or the third component each time the ICA was applied to
an analysis window.
To determine which component contained the PPG
signal, a Hamming window was applied to each IC vectors
in order to avoid spectral leakage. The Discrete Fourier
Transform (DFT) was then computed for each IC vector to
determine their spectral content. The highest power of the
spectrum contained between 0.7 and 2 Hz (i.e. 42 and 120
beats per minute (bpm)) was determined for each vector.
The maximum value corresponded to the HR
measurement and the IC containing it. An example of the
three ICs extracted from the RN, GN and BN vectors and
their spectral contents can be visualized in Figure 2.
Figure 2: Top row, normalized variation of the average RN, GN
and BN channels in the ROI for an epoch of 15s; Middle row,
variation of the ICs derived from ICA for the same epoch;
Bottom row, corresponding single-side amplitude spectrum of
the three ICs. For this epoch, the HR signal has been separated
on the third IC with a peak in the amplitude spectrum around 1.4
Hz i.e., 84 beats per minute.
2.3. Face detection
The procedure described in the previous section always
returned an estimation of HR even though there was no
living body part in the ROI. In fact, the HR estimation was
just based on the highest peak in the power spectrum of
the three ICs between 0.7 and 2 Hz. An additional
processing was necessary to ensure that the detected peak
corresponded to a real HR and was not due to noise. An
index of HR presence was computed following Equation
(4) where '()*+,� corresponded to the index of
presence/absence of HR in the ROI. This index varied
from 0 to 1, a value close to 1 corresponded to a high
probability of presence of living body part in the ROI. The
other variables of this equation were -.+/0�1234 which
corresponded to the maximum value in the power
spectrum of the three ICs and -*.(/0�1234 which
corresponded to the mean value of the power spectrum
(between 0.7 and 2 Hz) of the IC containing -.+/0�1234.
'()*+,� =-.+/0�1234 −-*.(/0�1234
-.+/0�1234(4)
In the presence of a living body part in the ROI, there was
a high peak in the power spectrum of one of the IC. The
rest of the power spectrum was quite flat (see the power
spectrum of the IC3 in Figure 2). Therefore, the index of
HR presence '()*+,� would have a value close to 1. This
index of HR presence was computed for each ROI. A
threshold (equal to 0.75) was applied to create a face
detection map as represented in Figure 3. The values of
'()*+,� were set to 0.5 (for display reason: light green
color for ROIs without detected face) if they were less
than 0.75. For each ROI, the index of presence was coded
using color variation and the HR information was
displayed.
3. Results
Examples of face detection maps based on
photoplethysmography are represented in Figure 3. The
ROIs where the face was present generated a high index of
HR presence (orange-red ROIs). The ROIs containing the
eyes did not generate a high index of HR presence. In
addition to the index of HR presence, the HR value may
be used to refine the clusters. In fact, some ROIs did not
have a significant index of HR presence whereas living
body parts (such as the hand) were represented in these
ROIs. However, the right HR value was determined by the
system for these ROIs and they were adjacent to detected
ROIs. First, a cleaning processing was applied to remove
the ‘false detection’ ROIs that can be seen in Figure 3. It
consisted in removing ROIs that were not surrounded by
any other ROI in which significant HR was detected. To
refine the HR clusters, the HR value was used. For each
ROI containing significant HR, the neighbors were
analyzed and included in the cluster if the difference
between their HR information and the original one was
less than 3 bpm. Examples of final results can be seen in
the 3rd
row of Figure 3. In some cases, the detection
method provided a good HR estimation for some ROIs
corresponding to the subject’s hand or arm. However, this
result was not consistent over consecutive frames. This
specific result may be due to the fact that the arm/hand did
not provide a flat surface large enough to estimate the HR
values accurately.
451
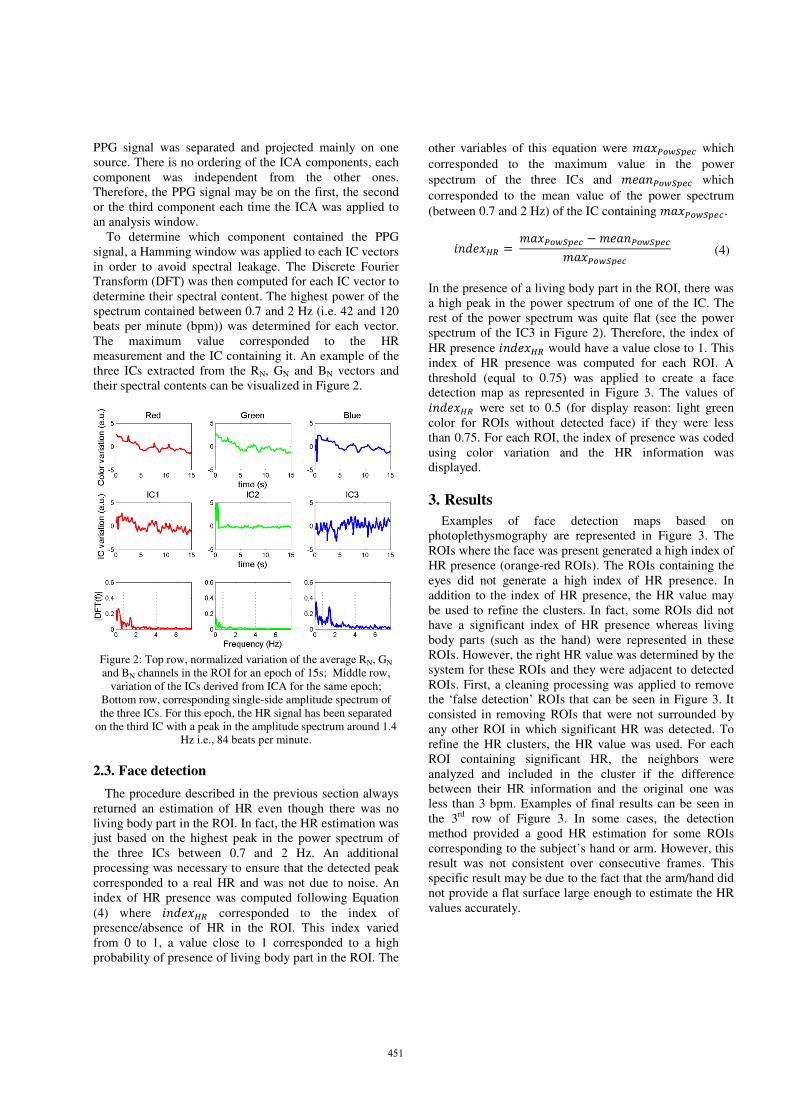
Figure 3: Examples of face detection maps based on photoplethysmography for four consecutive sliding windows time-shifted by 1s
(1st row). The ROIs where the face is present generated a high index of HR presence (2nd row). The ROIs containing the eyes did not
generate a high index of HR presence. In addition, to the index of HR presence, the HR value may be used to refine the clusters (3rd
row).
Several factors may affect the face detection method. In
the previous example, the subject was asked to stay still
during the entire recording but humans are constantly
moving. An additional video of a single subject
performing small movements was recorded. The detection
method was applied to this video. The results show that
the method is slightly affected by the subject’s
movements.
Other influencing factors may be face resolution and
ROI dimensions. Even if it has been shown in previous
study that a small ROI was sufficient to estimate HR it is
not clear what the minimal size is. The method was
applied with small ROIs (18x18 pixels). Preliminary
results show that the detection rate is lower compared to
bigger ROIs (40x30 pixels).
Finally, another important factor is the duration of the
analysis window used to estimate the HR value. The
duration of the time window was set to 15 s in the
previous examples. It is necessary to have a time window
long enough to contain several periods of HR. The
duration of the analysis window was shortened. Similar
results (detection rate) were obtained with a time window
lasting 10 s. Detection rates were lower if the time
window was shorter than 10 s.
4. Conclusions
A new method to detect faces using
photoplethysmography has been described. This method
estimates the presence/absence of HR in a series of images
sliced into small ROIs. In addition, it gives access to some
physiological data remotely. If several persons were
present in the video, there would be a high probability that
their HR would be slightly different. It would be then
possible to separate 2 or more faces even thought they
were very close to each other. Moreover, the system can
be easily parallelized because each ROI can be considered
separately.
This system may be used for other applications, e.g.
emotion recognition systems. In fact, it has already been
shown that multimodal emotion recognition systems can
use efficiently this kind of data to improve the robustness
and the accuracy of the recognition. Another application
may be biometrics. Systems based on face recognition
may increase robustness by computing the map of the
blood vessel distribution by slicing again the ROIs and
compare it to a database. In fact, it was suggested that this
map has individual features that represents a ‘pulsative
signature’ [12]. Counterfeiting attempts using latex masks
452
or images would be deceived if this map was taken into
account for instance.
The future works will be directed toward the assessment
of the method accuracy with the help of simultaneous
recording of color and thermography cameras. Several
factors (e.g. face resolution, duration of analysis window)
may affect the detection rate. Another interesting aspect is
the effect of motion. It will be evaluated using similar
simultaneous recording. The importance of illumination
will also be evaluated. In fact, the distance and angle
between the illumination source and the camera may affect
the face detection accuracy.
5. Acknowledgements
This work was supported by the SWoOZ project (ANR 11
PDOC 01901).
References
[1] K. M. Alajel, X. Wei, and J. Leis, "Face detection based on
skin color modeling and modified Hausdorff distance," in
Consumer Communications and Networking Conference
(CCNC), 2011 IEEE, 2011, pp. 399-404.
[2] J. Kovac, P. Peer, and F. Solina, "Human skin color
clustering for face detection," in EUROCON 2003.
Computer as a Tool. The IEEE Region 8, 2003, pp. 144-
148 vol.2.
[3] P. Viola and M. Jones, "Rapid object detection using a
boosted cascade of simple features," in Proceedings of the
IEEE Computer Society Conference on Computer Vision
and Pattern Recognition, 2001, pp. I511-I518.
[4] R. Vincenzo and U. Lisa, "An Improvement of AdaBoost
for Face-Detection with Motion and Color Information," in
Image Analysis and Processing, 2007. ICIAP 2007. 14th
International Conference on, 2007, pp. 518-523.
[5] L. Sun, G. Pan, Z. Wu, and S. Lao, "Blinking-Based Live
Face Detection Using Conditional Random Fields," in
Advances in Biometrics. vol. 4642, S.-W. Lee and S. Li,
Eds., ed: Springer Berlin Heidelberg, 2007, pp. 252-260.
[6] J. Allen, "Photoplethysmography and its application in
clinical physiological measurement," Physiological
Measurement, vol. 28, pp. R1-R39, 2007.
[7] W. Verkruysse, L. O. Svaasand, and J. S. Nelson, "Remote
plethysmographic imaging using ambient light," Opt.
Express, vol. 16, pp. 21434-21445, 2008.
[8] M.-Z. Poh, D. J. McDuff, and R. W. Picard, "Non-contact,
automated cardiac pulse measurements using video
imaging and blind source separation," Opt. Express, vol.
18, pp. 10762-10774, 2010.
[9] M. Lewandowska, J. Ruminski, T. Kocejko, and J. Nowak,
"Measuring Pulse Rate with a Webcam - a Non-contact
Method for evaluating Cardiac Activity," presented at the
Federated Conference on Computer Science and
Information Systems, Szczecin, Poland, 2011.
[10] M. Z. Poh, D. J. McDuff, and R. W. Picard,
"Advancements in Noncontact, Multiparameter
Physiological Measurements Using a Webcam," Ieee
Transactions on Biomedical Engineering, vol. 58, pp. 7-11,
Jan 2011.
[11] A. Hyvarinen, "Fast and robust fixed-point algorithms for
independent component analysis," Neural Networks, IEEE
Transactions on, vol. 10, pp. 626-634, 1999.
[12] A. A. Kamshilin, V. Teplov, E. Nippolainen, S. Miridonov,
and R. Giniatullin, "Variability of Microcirculation
Detected by Blood Pulsation Imaging," PLoS One, vol. 8,
p. e57117, 2013.
453