FAC Agenda Item 5e Attachment 1 Semi-Annual Treasury ... · PDF fileItem 5e - Attachment 1...
12
Item 5e - Attachment 1 Page 1 of 12 Liquidity Coverage Ratio Analysis Stressed environment LCR scenarios were calculated assuming starting assets were stressed by the percentages actually experienced over 5 days in the 1987 market crash and 30 days during September 2008. Starting assets were further reduced by a transactional liquidity % equal to the estimated % of the assets that could have been liquidated during the 30-day period. Under the stressed scenarios, asset class sources were reduced to zero and uses were doubled. Level I: In July through December, Level I LCRs were adequate had a stressed event similar to "Black Monday" occurred. Level I & II: CalPERS would not have needed to utilize Level II assets. Level I – III: CalPERS would not have needed to utilize Level III assets. Level I: In July through December, Level I LCRs were adequate had a stressed event similar to the 2008 Liquidity Crisis occurred. Level I & II: CalPERS would not have needed to utilize Level II assets. Level I – III: CalPERS would not have needed to utilize Level III assets. Semi-Annual Treasury Analysis and Liquidity Status Report Prepared for: Finance and Administration Committee - Period ending December 31, 2016 Public Employees' Retirement Fund (PERF) The PERF provides retirement benefits to the State of California, schools and other California public agency employees. The PERF benefits are funded by member contributions, employer contributions, and by investment earnings. The analysis included in this report is for the time period of July 1, 2016 through December 31, 2016. Changes in investment asset allocation and investment strategies can significantly impact data reported from period to period. Funding Sources and Graph Details Level I: Cash and cash equivalents Level II: Borrowed liquidity held in cash Level III: Sale of public assets Threshold: Indicates the Fund's ability to cover 100% of monthly obligations. Normal Environment - 30-Day Liquidity Coverage Ratios The 30-day LCR included investment and non-investment available cash flows. Level I: Level I LCR exceeded the threshold in July through December. August LCR increased due to a transition from Global Equity to Liquidity. In September, the Investment Committee approved the increase of Liquidity asset allocation from 1% (+/- 3%) to 4% (+3/-6%). The September LCR decreased due to an asset transition from Liquidity to Inflation. The December LCR increased due to quarterly State contributions and an increase in investment sources from Private Equity. Level I & II: Since Level I LCR remained above the threshold, it was not necessary to utilize Level II assets. September LCR decreased due to a decrease in security lending activity. Stressed Environments - 30-Day Liquidity Coverage Ratios 3.28 2.75 1.20 1.53 1.73 2.55 5.36 5.14 1.60 1.83 2.03 3.19 8.58 7.61 2.33 2.51 2.72 4.68 0.00 2.00 4.00 6.00 8.00 10.00 Jul 16 Aug 16 Sep 16 Oct 16 Nov 16 Dec 16 LCR Month Level I Level I & II Level I - III Threshold 4.02 5.50 3.51 4.14 3.15 4.29 8.61 10.24 4.64 5.11 4.10 6.09 0.00 2.00 4.00 6.00 8.00 10.00 12.00 Jul 16 Aug 16 Sep 16 Oct 16 Nov 16 Dec 16 LCR Month Level I Level I & II Threshold 1987 Market Crash "Black Monday" 2008 Liquidity Crisis 3.28 2.75 1.20 1.53 1.73 2.55 6.02 5.44 1.68 1.88 2.08 3.27 9.21 7.90 2.38 2.58 2.79 4.72 0.00 2.00 4.00 6.00 8.00 10.00 Jul 16 Aug 16 Sep 16 Oct 16 Nov 16 Dec 16 LCR Month Level I Level I & II Level I - III Threshold
-
Upload
trinhnguyet -
Category
Documents
-
view
223 -
download
0
Transcript of FAC Agenda Item 5e Attachment 1 Semi-Annual Treasury ... · PDF fileItem 5e - Attachment 1...
Item 5e - Attachment 1
Page 1 of 12
Liquidity Coverage Ratio Analysis
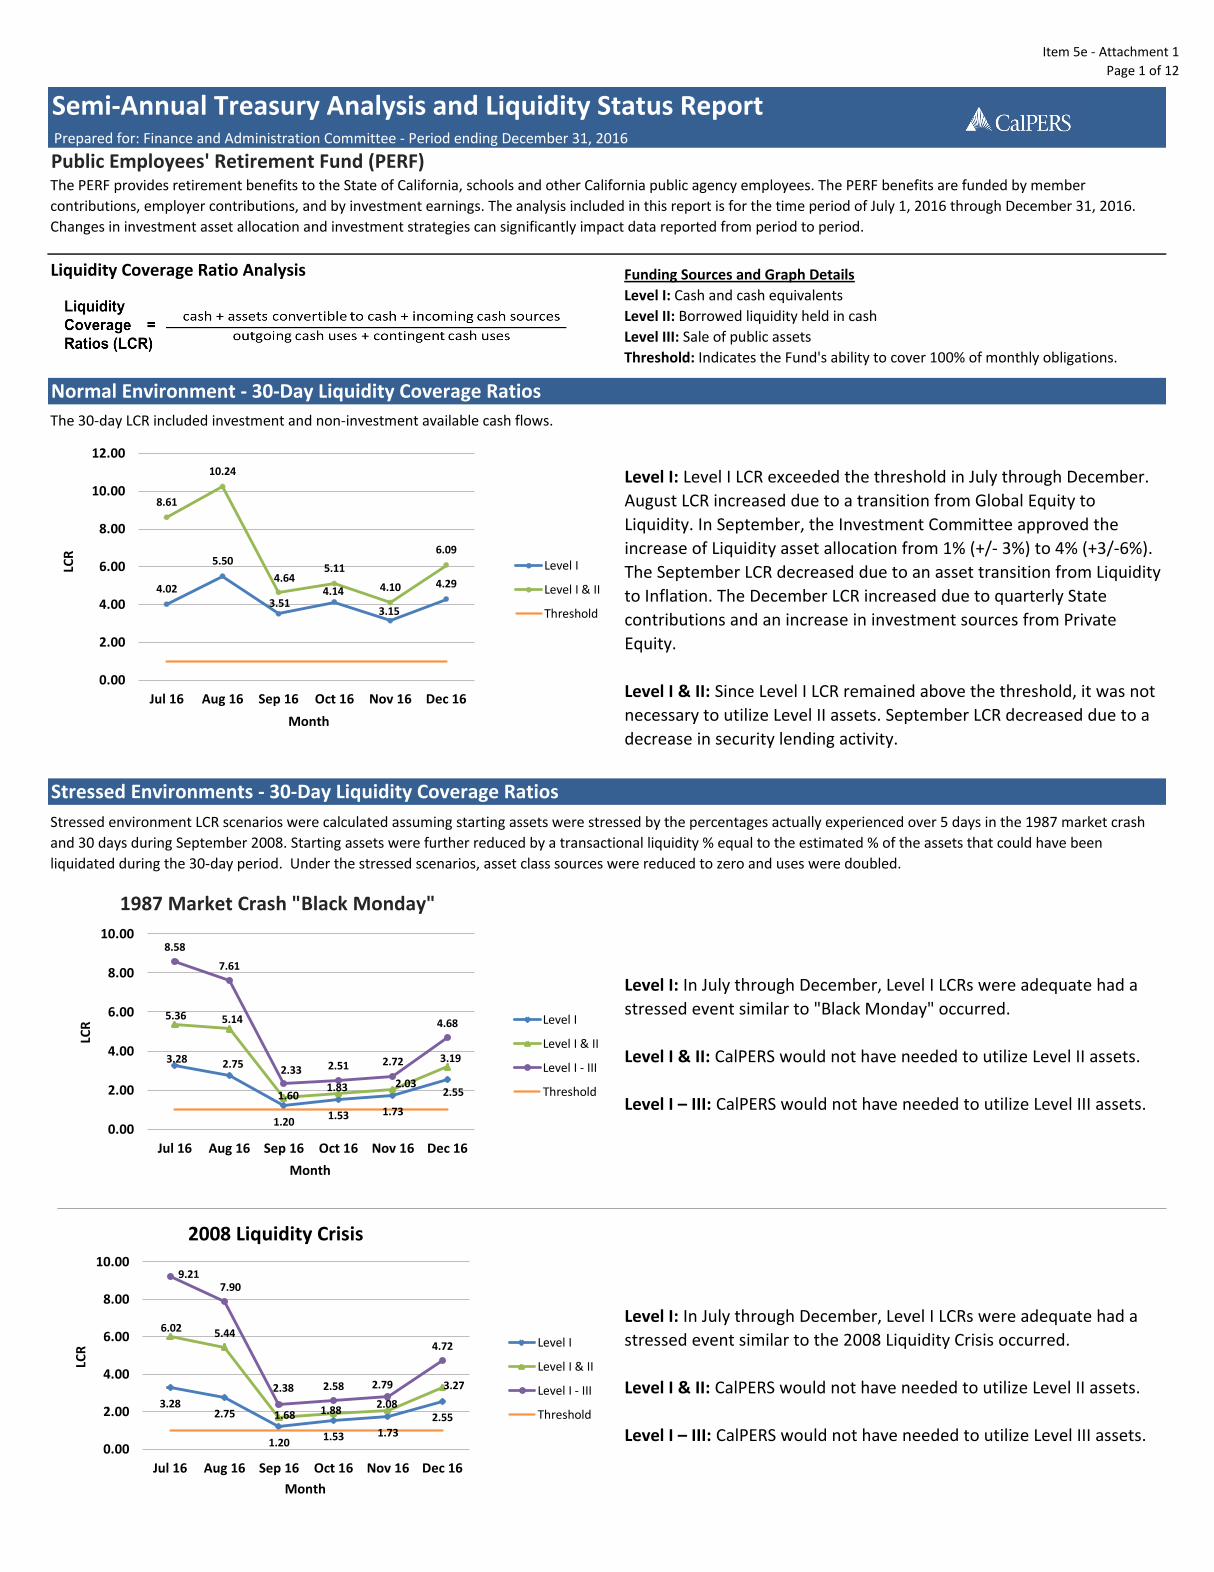
Stressed environment LCR scenarios were calculated assuming starting assets were stressed by the percentages actually experienced over 5 days in the 1987 market crash
and 30 days during September 2008. Starting assets were further reduced by a transactional liquidity % equal to the estimated % of the assets that could have been
liquidated during the 30-day period. Under the stressed scenarios, asset class sources were reduced to zero and uses were doubled.
Level I: In July through December, Level I LCRs were adequate had a
stressed event similar to "Black Monday" occurred.
Level I & II: CalPERS would not have needed to utilize Level II assets.
Level I – III: CalPERS would not have needed to utilize Level III assets.
Level I: In July through December, Level I LCRs were adequate had a
stressed event similar to the 2008 Liquidity Crisis occurred.
Level I & II: CalPERS would not have needed to utilize Level II assets.
Level I – III: CalPERS would not have needed to utilize Level III assets.
Semi-Annual Treasury Analysis and Liquidity Status Report Prepared for: Finance and Administration Committee - Period ending December 31, 2016
Public Employees' Retirement Fund (PERF)The PERF provides retirement benefits to the State of California, schools and other California public agency employees. The PERF benefits are funded by member
contributions, employer contributions, and by investment earnings. The analysis included in this report is for the time period of July 1, 2016 through December 31, 2016.
Changes in investment asset allocation and investment strategies can significantly impact data reported from period to period.
Funding Sources and Graph Details
Level I: Cash and cash equivalents
Level II: Borrowed liquidity held in cash
Level III: Sale of public assets
Threshold: Indicates the Fund's ability to cover 100% of monthly obligations.
Normal Environment - 30-Day Liquidity Coverage Ratios
The 30-day LCR included investment and non-investment available cash flows.
Level I: Level I LCR exceeded the threshold in July through December.
August LCR increased due to a transition from Global Equity to
Liquidity. In September, the Investment Committee approved the
increase of Liquidity asset allocation from 1% (+/- 3%) to 4% (+3/-6%).
The September LCR decreased due to an asset transition from Liquidity
to Inflation. The December LCR increased due to quarterly State
contributions and an increase in investment sources from Private
Equity.
Level I & II: Since Level I LCR remained above the threshold, it was not
necessary to utilize Level II assets. September LCR decreased due to a
decrease in security lending activity.
Stressed Environments - 30-Day Liquidity Coverage Ratios
3.28 2.75
1.20 1.53 1.73
2.55
5.36 5.14
1.60 1.83 2.03
3.19
8.58
7.61
2.33 2.51 2.72
4.68
0.00
2.00
4.00
6.00
8.00
10.00
Jul 16 Aug 16 Sep 16 Oct 16 Nov 16 Dec 16
LCR
Month
Level I
Level I & II
Level I - III
Threshold
4.02
5.50
3.51 4.14
3.15
4.29
8.61
10.24
4.64 5.11
4.10
6.09
0.00
2.00
4.00
6.00
8.00
10.00
12.00
Jul 16 Aug 16 Sep 16 Oct 16 Nov 16 Dec 16
LCR
Month
Level I
Level I & II
Threshold
1987 Market Crash "Black Monday"
2008 Liquidity Crisis
3.28 2.75
1.20 1.53 1.73
2.55
6.02 5.44
1.68 1.88 2.08
3.27
9.21 7.90
2.38 2.58 2.79
4.72
0.00
2.00
4.00
6.00
8.00
10.00
Jul 16 Aug 16 Sep 16 Oct 16 Nov 16 Dec 16
LCR
Month
Level I
Level I & II
Level I - III
Threshold
Item 5e - Attachment 1
Page 2 of 12
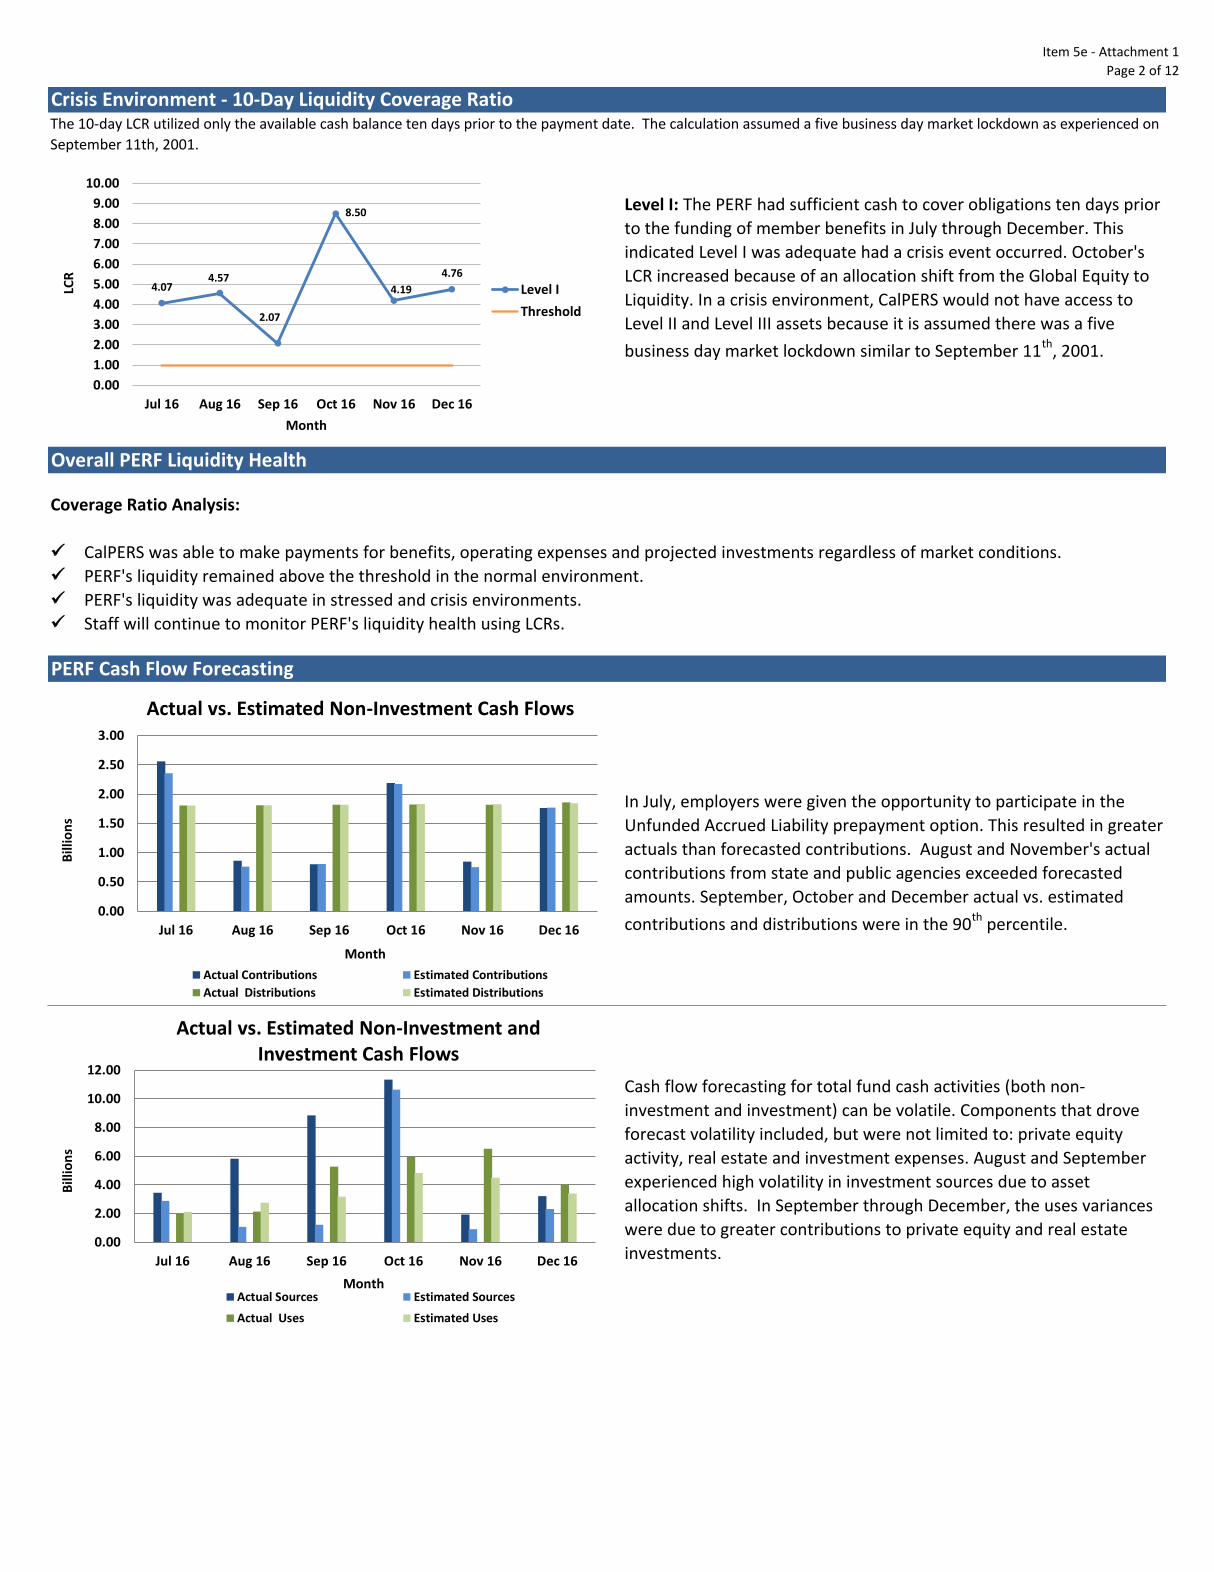
Coverage Ratio Analysis:
CalPERS was able to make payments for benefits, operating expenses and projected investments regardless of market conditions.
PERF's liquidity remained above the threshold in the normal environment.
PERF's liquidity was adequate in stressed and crisis environments.
Staff will continue to monitor PERF's liquidity health using LCRs.
PERF Cash Flow Forecasting
In July, employers were given the opportunity to participate in the
Unfunded Accrued Liability prepayment option. This resulted in greater
actuals than forecasted contributions. August and November's actual
contributions from state and public agencies exceeded forecasted
amounts. September, October and December actual vs. estimated
contributions and distributions were in the 90th
percentile.
Cash flow forecasting for total fund cash activities (both non-
investment and investment) can be volatile. Components that drove
forecast volatility included, but were not limited to: private equity
activity, real estate and investment expenses. August and September
experienced high volatility in investment sources due to asset
allocation shifts. In September through December, the uses variances
were due to greater contributions to private equity and real estate
investments.
Crisis Environment - 10-Day Liquidity Coverage RatioThe 10-day LCR utilized only the available cash balance ten days prior to the payment date. The calculation assumed a five business day market lockdown as experienced on
September 11th, 2001.
Level I: The PERF had sufficient cash to cover obligations ten days prior
to the funding of member benefits in July through December. This
indicated Level I was adequate had a crisis event occurred. October's
LCR increased because of an allocation shift from the Global Equity to
Liquidity. In a crisis environment, CalPERS would not have access to
Level II and Level III assets because it is assumed there was a five
business day market lockdown similar to September 11th, 2001.
Overall PERF Liquidity Health
4.07 4.57
2.07
8.50
4.19
4.76
0.00
1.00
2.00
3.00
4.00
5.00
6.00
7.00
8.00
9.00
10.00
Jul 16 Aug 16 Sep 16 Oct 16 Nov 16 Dec 16
LCR
Month
Level I
Threshold
Actual vs. Estimated Non-Investment Cash Flows
0.00
0.50
1.00
1.50
2.00
2.50
3.00
Jul 16 Aug 16 Sep 16 Oct 16 Nov 16 Dec 16
Bill
ion
s
Month
Actual Contributions Estimated Contributions
Actual Distributions Estimated Distributions
0.00
2.00
4.00
6.00
8.00
10.00
12.00
Jul 16 Aug 16 Sep 16 Oct 16 Nov 16 Dec 16
Bill
ion
s
Month Actual Sources Estimated Sources
Actual Uses Estimated Uses
Actual vs. Estimated Non-Investment and Investment Cash Flows
Item 5e - Attachment 1
Page 3 of 12
Liquidity Coverage Ratio Analysis
The LRF provides retirement benefits to California Legislators elected to office before November 7, 1990, and to constitutional, legislative, and statutory officers elected or
appointed prior to January 1, 2013. The Fund is closed to new participants. The number of LRF members has been declining in the last decade as eligible incumbent
Legislators leave office and are replaced by those ineligible to participate in the LRF. Actuarially determined contributions will continue to be made by the State of California
to supplement the existing assets until all benefit obligations have been fulfilled.
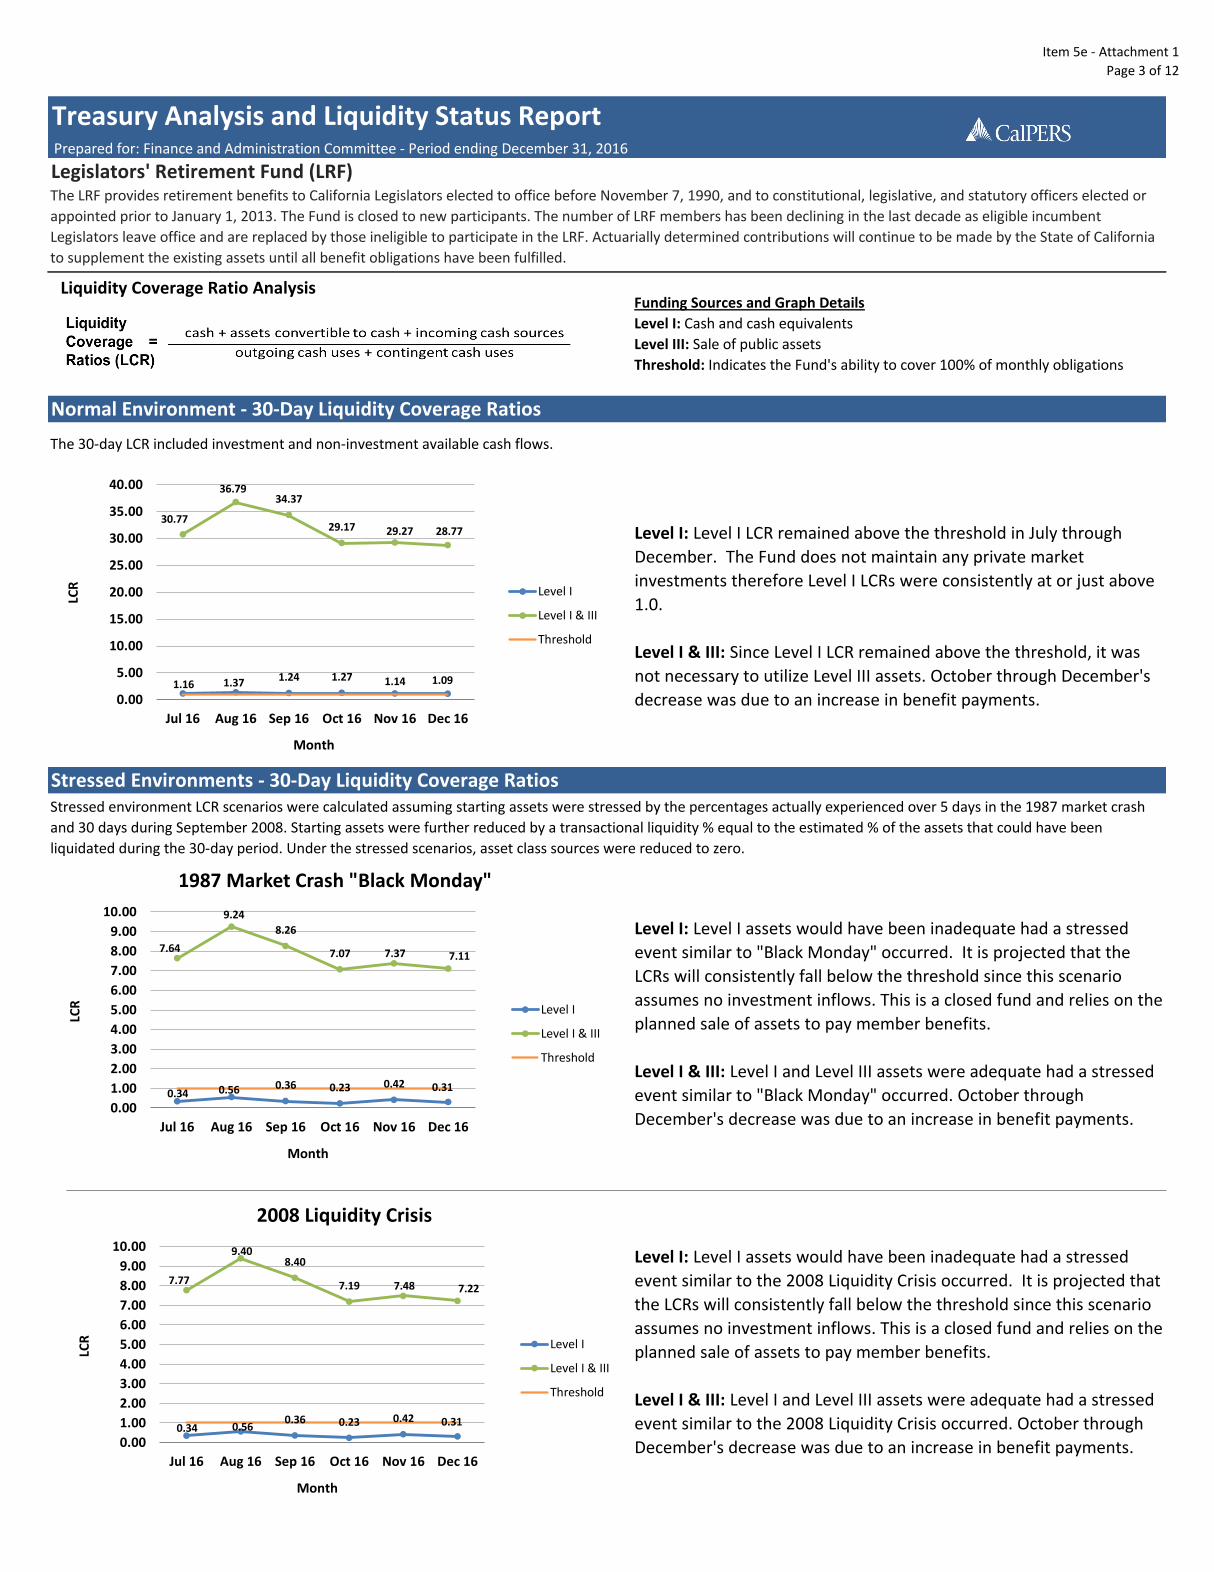
The 30-day LCR included investment and non-investment available cash flows.
Stressed environment LCR scenarios were calculated assuming starting assets were stressed by the percentages actually experienced over 5 days in the 1987 market crash
and 30 days during September 2008. Starting assets were further reduced by a transactional liquidity % equal to the estimated % of the assets that could have been
liquidated during the 30-day period. Under the stressed scenarios, asset class sources were reduced to zero.
Level I: Level I assets would have been inadequate had a stressed
event similar to the 2008 Liquidity Crisis occurred. It is projected that
the LCRs will consistently fall below the threshold since this scenario
assumes no investment inflows. This is a closed fund and relies on the
planned sale of assets to pay member benefits.
Level I & III: Level I and Level III assets were adequate had a stressed
event similar to the 2008 Liquidity Crisis occurred. October through
December's decrease was due to an increase in benefit payments.
Normal Environment - 30-Day Liquidity Coverage Ratios
Stressed Environments - 30-Day Liquidity Coverage Ratios
Funding Sources and Graph Details
Level I: Cash and cash equivalents
Level III: Sale of public assets
Threshold: Indicates the Fund's ability to cover 100% of monthly obligations
Level I: Level I LCR remained above the threshold in July through
December. The Fund does not maintain any private market
investments therefore Level I LCRs were consistently at or just above
1.0.
Level I & III: Since Level I LCR remained above the threshold, it was
not necessary to utilize Level III assets. October through December's
decrease was due to an increase in benefit payments.
Level I: Level I assets would have been inadequate had a stressed
event similar to "Black Monday" occurred. It is projected that the
LCRs will consistently fall below the threshold since this scenario
assumes no investment inflows. This is a closed fund and relies on the
planned sale of assets to pay member benefits.
Level I & III: Level I and Level III assets were adequate had a stressed
event similar to "Black Monday" occurred. October through
December's decrease was due to an increase in benefit payments.
Treasury Analysis and Liquidity Status Report Prepared for: Finance and Administration Committee - Period ending December 31, 2016
Legislators' Retirement Fund (LRF)
1.16 1.37 1.24 1.27 1.14 1.09
30.77
36.79 34.37
29.17 29.27 28.77
0.00
5.00
10.00
15.00
20.00
25.00
30.00
35.00
40.00
Jul 16 Aug 16 Sep 16 Oct 16 Nov 16 Dec 16
LCR
Month
Level I
Level I & III
Threshold
0.34 0.56 0.36 0.23 0.42 0.31
7.64
9.24
8.26
7.07 7.37 7.11
0.00
1.00
2.00
3.00
4.00
5.00
6.00
7.00
8.00
9.00
10.00
Jul 16 Aug 16 Sep 16 Oct 16 Nov 16 Dec 16
LCR
Month
1987 Market Crash "Black Monday"
Level I
Level I & III
Threshold
0.34 0.56 0.36 0.23 0.42 0.31
7.77
9.40 8.40
7.19 7.48 7.22
0.00
1.00
2.00
3.00
4.00
5.00
6.00
7.00
8.00
9.00
10.00
Jul 16 Aug 16 Sep 16 Oct 16 Nov 16 Dec 16
LCR
Month
2008 Liquidity Crisis
Level I
Level I & III
Threshold
Item 5e - Attachment 1
Page 4 of 12
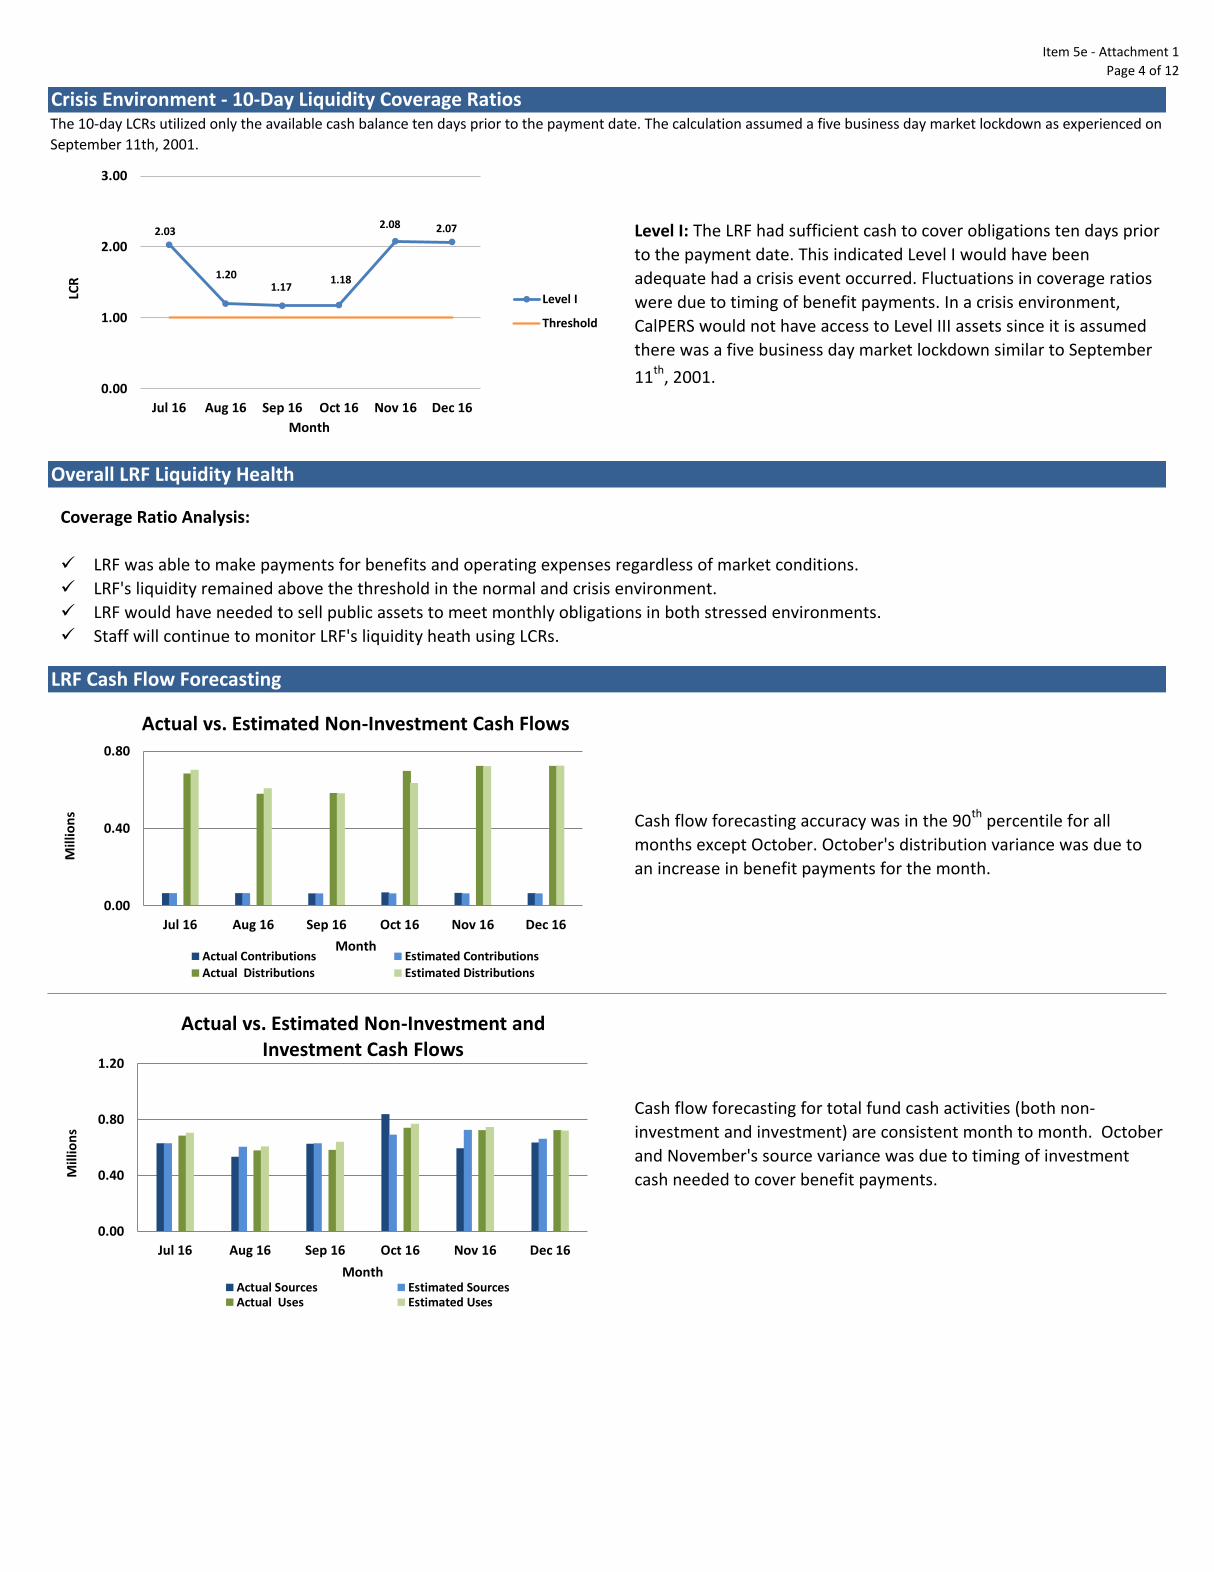
The 10-day LCRs utilized only the available cash balance ten days prior to the payment date. The calculation assumed a five business day market lockdown as experienced on
September 11th, 2001.
Cash flow forecasting accuracy was in the 90th percentile for all
months except October. October's distribution variance was due to
an increase in benefit payments for the month.
Level I: The LRF had sufficient cash to cover obligations ten days prior
to the payment date. This indicated Level I would have been
adequate had a crisis event occurred. Fluctuations in coverage ratios
were due to timing of benefit payments. In a crisis environment,
CalPERS would not have access to Level III assets since it is assumed
there was a five business day market lockdown similar to September
11th
, 2001.
Coverage Ratio Analysis:
LRF was able to make payments for benefits and operating expenses regardless of market conditions.
LRF's liquidity remained above the threshold in the normal and crisis environment.
LRF would have needed to sell public assets to meet monthly obligations in both stressed environments.
Staff will continue to monitor LRF's liquidity heath using LCRs.
Cash flow forecasting for total fund cash activities (both non-
investment and investment) are consistent month to month. October
and November's source variance was due to timing of investment
cash needed to cover benefit payments.
LRF Cash Flow Forecasting
Overall LRF Liquidity Health
Crisis Environment - 10-Day Liquidity Coverage Ratios
2.03
1.20 1.17
1.18
2.08 2.07
0.00
1.00
2.00
3.00
Jul 16 Aug 16 Sep 16 Oct 16 Nov 16 Dec 16
LCR
Month
Level I
Threshold
0.00
0.40
0.80
Jul 16 Aug 16 Sep 16 Oct 16 Nov 16 Dec 16
Mill
ion
s
Month Actual Contributions Estimated Contributions
Actual Distributions Estimated Distributions
0.00
0.40
0.80
1.20
Jul 16 Aug 16 Sep 16 Oct 16 Nov 16 Dec 16
Mill
ion
s
Month Actual Sources Estimated SourcesActual Uses Estimated Uses
Actual vs. Estimated Non-Investment and Investment Cash Flows
Actual vs. Estimated Non-Investment Cash Flows
Item 5e - Attachment 1
Page 5 of 12
Liquidity Coverage Ratio Analysis
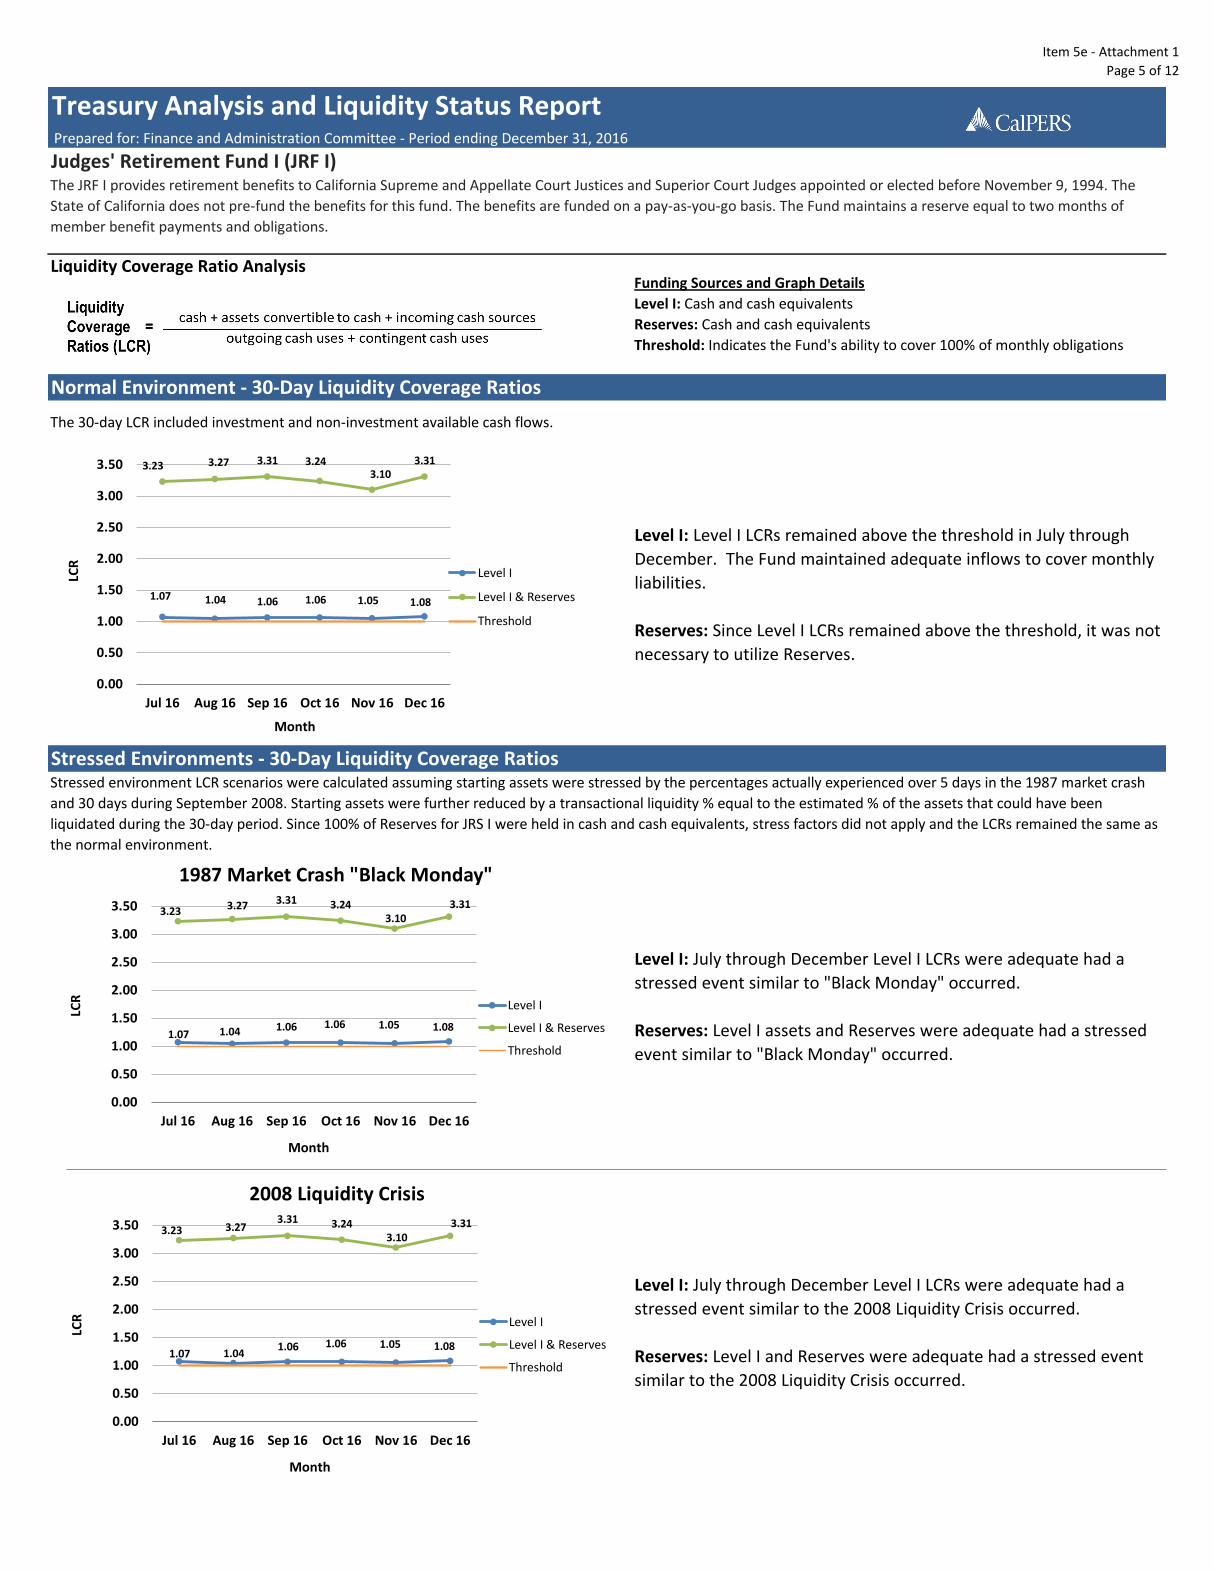
Level I: July through December Level I LCRs were adequate had a
stressed event similar to the 2008 Liquidity Crisis occurred.
Reserves: Level I and Reserves were adequate had a stressed event
similar to the 2008 Liquidity Crisis occurred.
Normal Environment - 30-Day Liquidity Coverage Ratios
Level I: Level I LCRs remained above the threshold in July through
December. The Fund maintained adequate inflows to cover monthly
liabilities.
Reserves: Since Level I LCRs remained above the threshold, it was not
necessary to utilize Reserves.
Stressed Environments - 30-Day Liquidity Coverage Ratios
Level I: July through December Level I LCRs were adequate had a
stressed event similar to "Black Monday" occurred.
Reserves: Level I assets and Reserves were adequate had a stressed
event similar to "Black Monday" occurred.
The 30-day LCR included investment and non-investment available cash flows.
Stressed environment LCR scenarios were calculated assuming starting assets were stressed by the percentages actually experienced over 5 days in the 1987 market crash
and 30 days during September 2008. Starting assets were further reduced by a transactional liquidity % equal to the estimated % of the assets that could have been
liquidated during the 30-day period. Since 100% of Reserves for JRS I were held in cash and cash equivalents, stress factors did not apply and the LCRs remained the same as
the normal environment.
Treasury Analysis and Liquidity Status Report Prepared for: Finance and Administration Committee - Period ending December 31, 2016
Judges' Retirement Fund I (JRF I)The JRF I provides retirement benefits to California Supreme and Appellate Court Justices and Superior Court Judges appointed or elected before November 9, 1994. The
State of California does not pre-fund the benefits for this fund. The benefits are funded on a pay-as-you-go basis. The Fund maintains a reserve equal to two months of
member benefit payments and obligations.
Funding Sources and Graph Details
Level I: Cash and cash equivalents
Reserves: Cash and cash equivalents
Threshold: Indicates the Fund's ability to cover 100% of monthly obligations
1.07 1.04 1.06 1.06 1.05 1.08
3.23 3.27 3.31 3.24 3.10
3.31
0.00
0.50
1.00
1.50
2.00
2.50
3.00
3.50
Jul 16 Aug 16 Sep 16 Oct 16 Nov 16 Dec 16
LCR
Month
Level I
Level I & Reserves
Threshold
1.07 1.04 1.06 1.06 1.05 1.08
3.23 3.27 3.31 3.24 3.10
3.31
0.00
0.50
1.00
1.50
2.00
2.50
3.00
3.50
Jul 16 Aug 16 Sep 16 Oct 16 Nov 16 Dec 16
LCR
Month
1987 Market Crash "Black Monday"
Level I
Level I & Reserves
Threshold
1.07 1.04 1.06 1.06 1.05 1.08
3.23 3.27 3.31 3.24
3.10 3.31
0.00
0.50
1.00
1.50
2.00
2.50
3.00
3.50
Jul 16 Aug 16 Sep 16 Oct 16 Nov 16 Dec 16
LCR
Month
2008 Liquidity Crisis
Level I
Level I & Reserves
Threshold
Item 5e - Attachment 1
Page 6 of 12
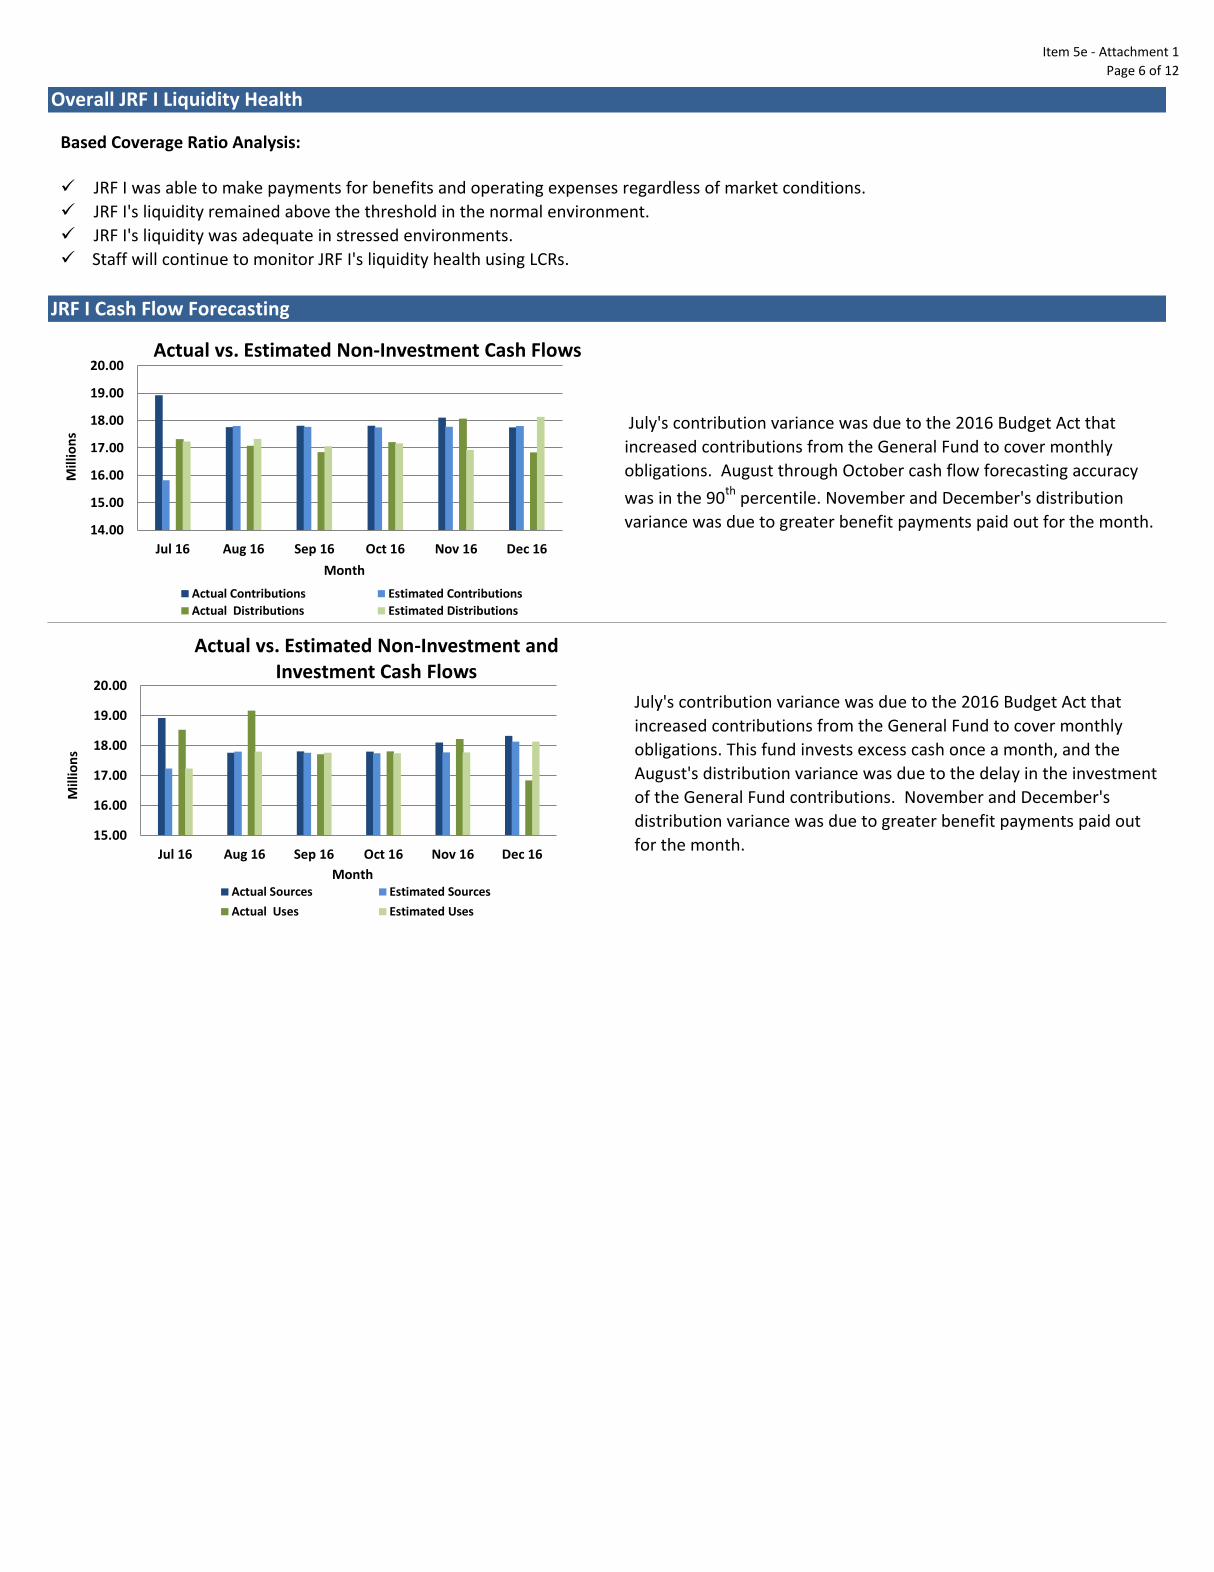
Overall JRF I Liquidity Health
Based Coverage Ratio Analysis:
JRF I was able to make payments for benefits and operating expenses regardless of market conditions.
JRF I's liquidity remained above the threshold in the normal environment.
JRF I's liquidity was adequate in stressed environments.
Staff will continue to monitor JRF I's liquidity health using LCRs.
JRF I Cash Flow Forecasting
July's contribution variance was due to the 2016 Budget Act that
increased contributions from the General Fund to cover monthly
obligations. August through October cash flow forecasting accuracy
was in the 90th percentile. November and December's distribution
variance was due to greater benefit payments paid out for the month.
July's contribution variance was due to the 2016 Budget Act that
increased contributions from the General Fund to cover monthly
obligations. This fund invests excess cash once a month, and the
August's distribution variance was due to the delay in the investment
of the General Fund contributions. November and December's
distribution variance was due to greater benefit payments paid out
for the month.
14.00
15.00
16.00
17.00
18.00
19.00
20.00
Jul 16 Aug 16 Sep 16 Oct 16 Nov 16 Dec 16
Mill
ion
s
Month
Actual Contributions Estimated Contributions
Actual Distributions Estimated Distributions
15.00
16.00
17.00
18.00
19.00
20.00
Jul 16 Aug 16 Sep 16 Oct 16 Nov 16 Dec 16
Mill
ion
s
Month Actual Sources Estimated Sources
Actual Uses Estimated Uses
Actual vs. Estimated Non-Investment Cash Flows
Actual vs. Estimated Non-Investment and Investment Cash Flows
Item 5e - Attachment 1
Page 7 of 12
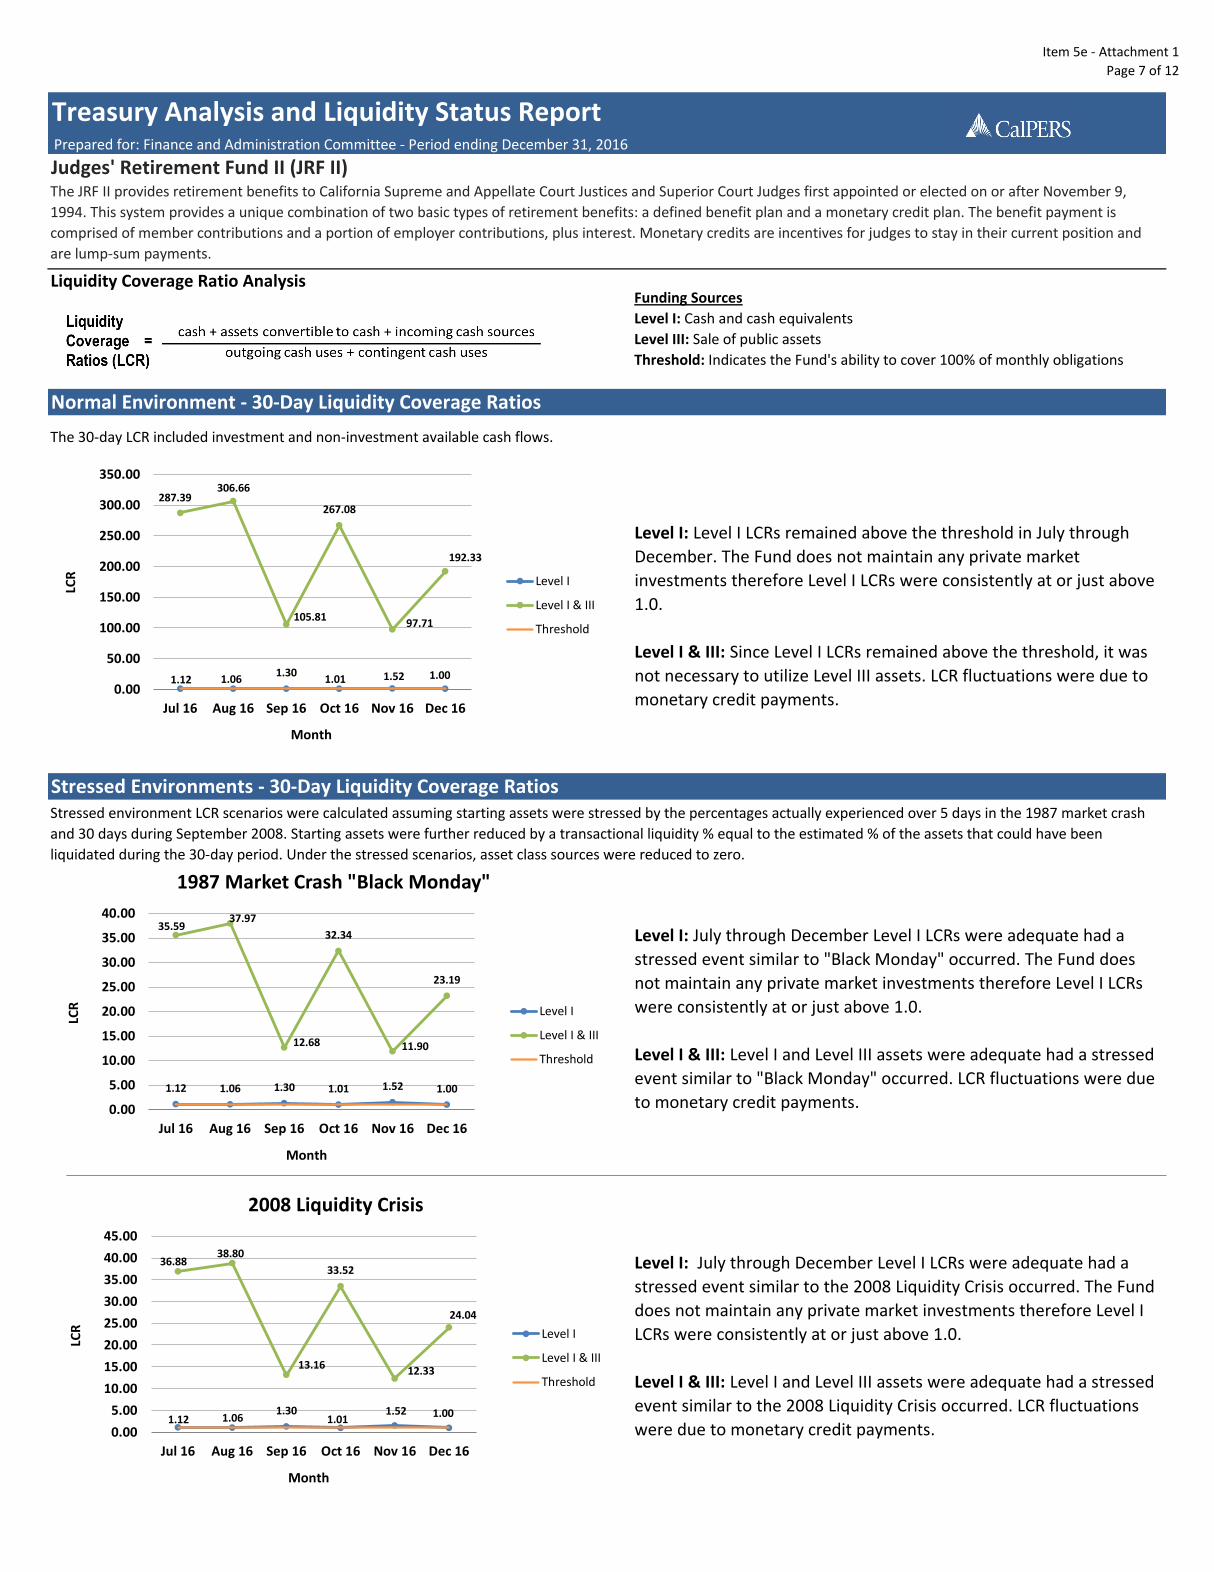
Liquidity Coverage Ratio Analysis
Level I: July through December Level I LCRs were adequate had a
stressed event similar to the 2008 Liquidity Crisis occurred. The Fund
does not maintain any private market investments therefore Level I
LCRs were consistently at or just above 1.0.
Level I & III: Level I and Level III assets were adequate had a stressed
event similar to the 2008 Liquidity Crisis occurred. LCR fluctuations
were due to monetary credit payments.
Level I: Level I LCRs remained above the threshold in July through
December. The Fund does not maintain any private market
investments therefore Level I LCRs were consistently at or just above
1.0.
Level I & III: Since Level I LCRs remained above the threshold, it was
not necessary to utilize Level III assets. LCR fluctuations were due to
monetary credit payments.
Stressed Environments - 30-Day Liquidity Coverage Ratios
Level I: July through December Level I LCRs were adequate had a
stressed event similar to "Black Monday" occurred. The Fund does
not maintain any private market investments therefore Level I LCRs
were consistently at or just above 1.0.
Level I & III: Level I and Level III assets were adequate had a stressed
event similar to "Black Monday" occurred. LCR fluctuations were due
to monetary credit payments.
Stressed environment LCR scenarios were calculated assuming starting assets were stressed by the percentages actually experienced over 5 days in the 1987 market crash
and 30 days during September 2008. Starting assets were further reduced by a transactional liquidity % equal to the estimated % of the assets that could have been
liquidated during the 30-day period. Under the stressed scenarios, asset class sources were reduced to zero.
Normal Environment - 30-Day Liquidity Coverage Ratios
Treasury Analysis and Liquidity Status Report Prepared for: Finance and Administration Committee - Period ending December 31, 2016
Judges' Retirement Fund II (JRF II)The JRF II provides retirement benefits to California Supreme and Appellate Court Justices and Superior Court Judges first appointed or elected on or after November 9,
1994. This system provides a unique combination of two basic types of retirement benefits: a defined benefit plan and a monetary credit plan. The benefit payment is
comprised of member contributions and a portion of employer contributions, plus interest. Monetary credits are incentives for judges to stay in their current position and
are lump-sum payments.
Funding Sources
Level I: Cash and cash equivalents
Level III: Sale of public assets
Threshold: Indicates the Fund's ability to cover 100% of monthly obligations
The 30-day LCR included investment and non-investment available cash flows.
Actual Uses Estimated Uses
1.12 1.06 1.30
1.01 1.52 1.00
287.39 306.66
105.81
267.08
97.71
192.33
0.00
50.00
100.00
150.00
200.00
250.00
300.00
350.00
Jul 16 Aug 16 Sep 16 Oct 16 Nov 16 Dec 16
LCR
Month
Level I
Level I & III
Threshold
1.12 1.06 1.30 1.01 1.52 1.00
35.59 37.97
12.68
32.34
11.90
23.19
0.00
5.00
10.00
15.00
20.00
25.00
30.00
35.00
40.00
Jul 16 Aug 16 Sep 16 Oct 16 Nov 16 Dec 16
LCR
Month
1987 Market Crash "Black Monday"
Level I
Level I & III
Threshold
1.12 1.06 1.30
1.01 1.52 1.00
36.88 38.80
13.16
33.52
12.33
24.04
0.00
5.00
10.00
15.00
20.00
25.00
30.00
35.00
40.00
45.00
Jul 16 Aug 16 Sep 16 Oct 16 Nov 16 Dec 16
LCR
Month
2008 Liquidity Crisis
Level I
Level I & III
Threshold
Item 5e - Attachment 1
Page 8 of 12
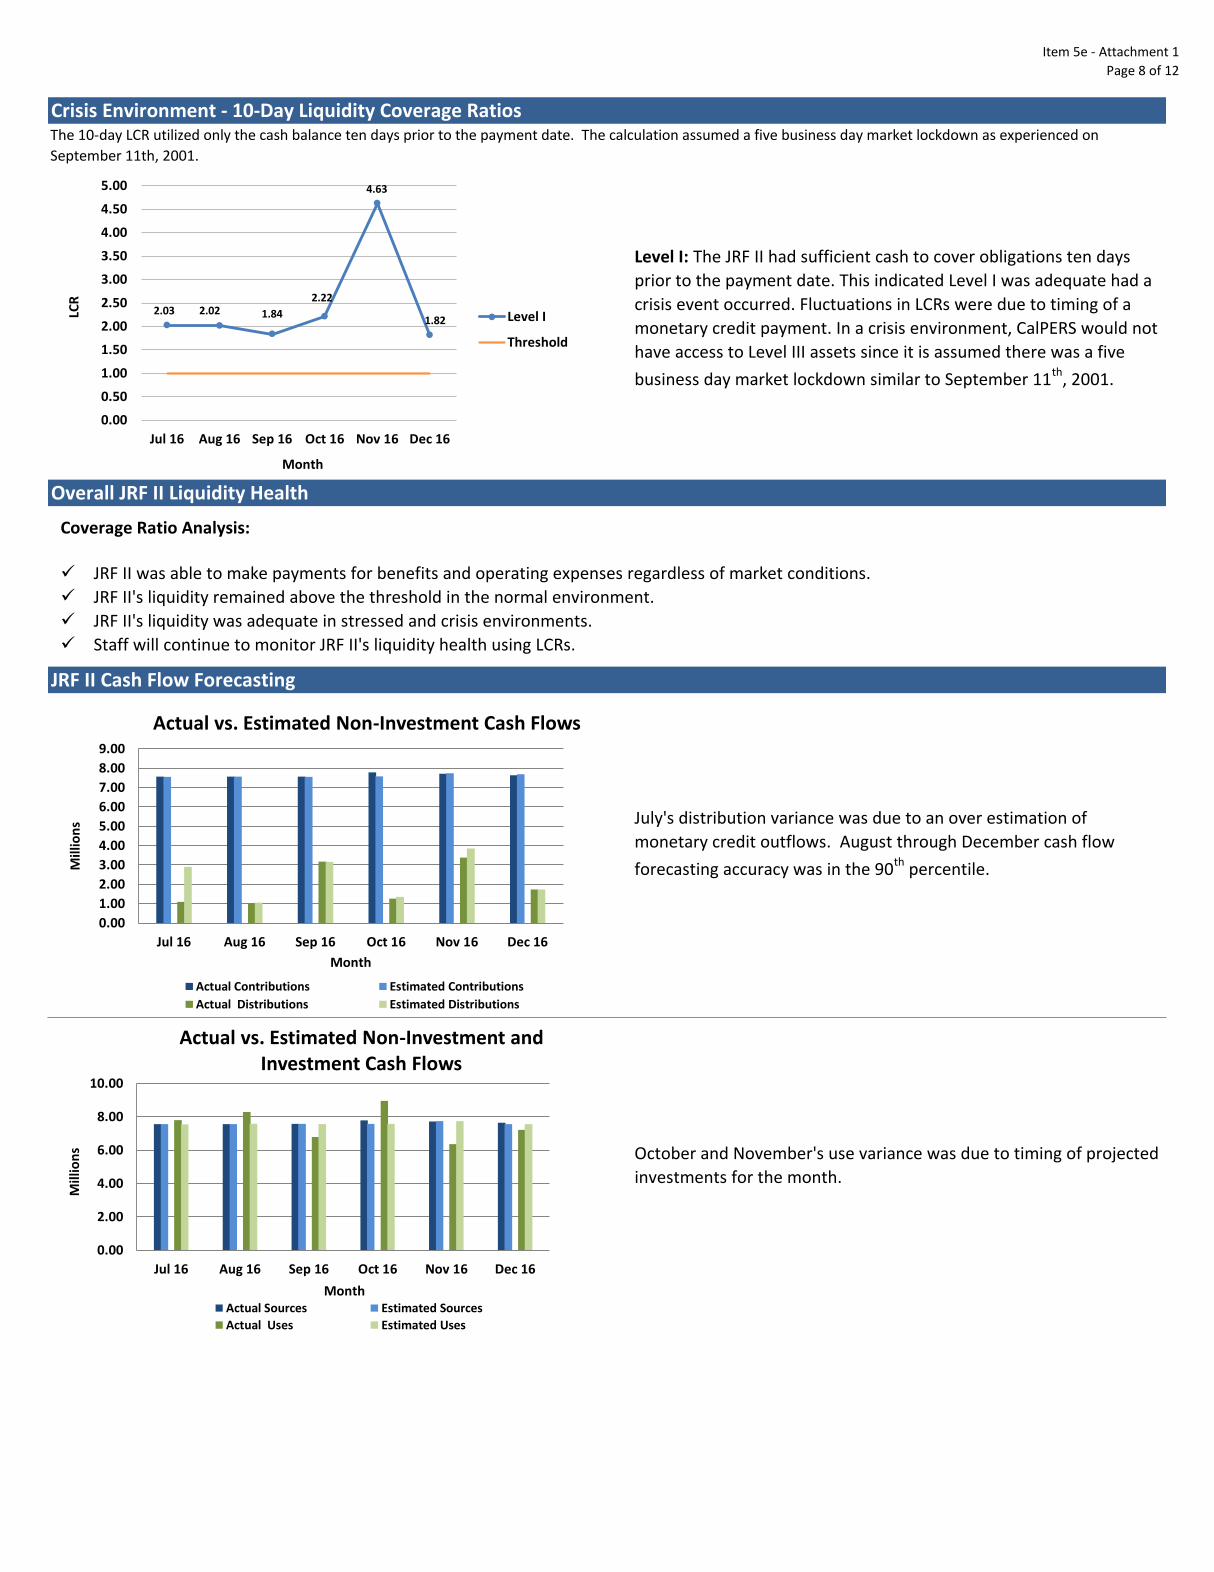
JRF II Cash Flow Forecasting
July's distribution variance was due to an over estimation of
monetary credit outflows. August through December cash flow
forecasting accuracy was in the 90th percentile.
October and November's use variance was due to timing of projected
investments for the month.
Crisis Environment - 10-Day Liquidity Coverage Ratios
Level I: The JRF II had sufficient cash to cover obligations ten days
prior to the payment date. This indicated Level I was adequate had a
crisis event occurred. Fluctuations in LCRs were due to timing of a
monetary credit payment. In a crisis environment, CalPERS would not
have access to Level III assets since it is assumed there was a five
business day market lockdown similar to September 11th
, 2001.
Overall JRF II Liquidity Health
Coverage Ratio Analysis:
JRF II was able to make payments for benefits and operating expenses regardless of market conditions.
JRF II's liquidity remained above the threshold in the normal environment.
JRF II's liquidity was adequate in stressed and crisis environments.
Staff will continue to monitor JRF II's liquidity health using LCRs.
The 10-day LCR utilized only the cash balance ten days prior to the payment date. The calculation assumed a five business day market lockdown as experienced on
September 11th, 2001.
2.03 2.02 1.84
2.22
4.63
1.82
0.00
0.50
1.00
1.50
2.00
2.50
3.00
3.50
4.00
4.50
5.00
Jul 16 Aug 16 Sep 16 Oct 16 Nov 16 Dec 16
LCR
Month
Level I
Threshold
Actual vs. Estimated Non-Investment Cash Flows
0.00
1.00
2.00
3.00
4.00
5.00
6.00
7.00
8.00
9.00
Jul 16 Aug 16 Sep 16 Oct 16 Nov 16 Dec 16
Mill
ion
s
Month
Actual Contributions Estimated Contributions
Actual Distributions Estimated Distributions
0.00
2.00
4.00
6.00
8.00
10.00
Jul 16 Aug 16 Sep 16 Oct 16 Nov 16 Dec 16
Mill
ion
s
Month Actual Sources Estimated Sources
Actual Uses Estimated Uses
Actual vs. Estimated Non-Investment and Investment Cash Flows
Item 5e - Attachment 1
Page 9 of 12
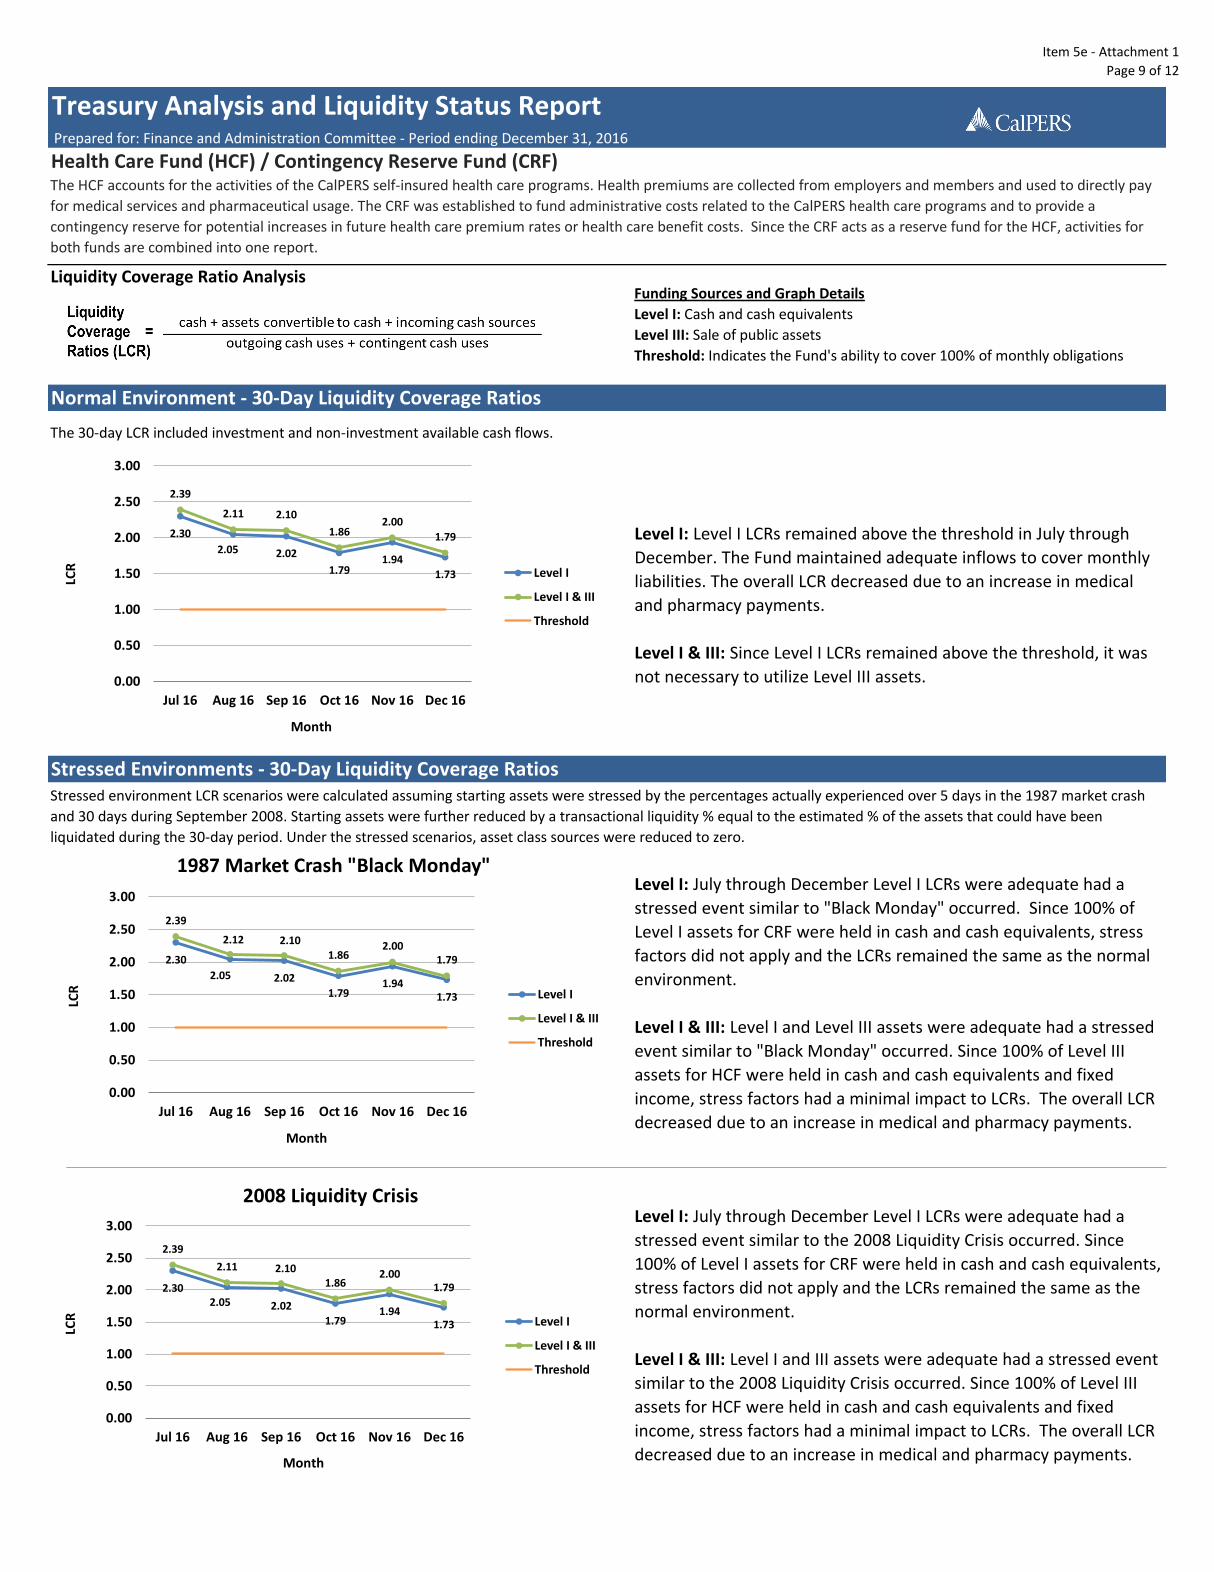
Liquidity Coverage Ratio Analysis
Normal Environment - 30-Day Liquidity Coverage Ratios
Level I: Level I LCRs remained above the threshold in July through
December. The Fund maintained adequate inflows to cover monthly
liabilities. The overall LCR decreased due to an increase in medical
and pharmacy payments.
Level I & III: Since Level I LCRs remained above the threshold, it was
not necessary to utilize Level III assets.
Stressed Environments - 30-Day Liquidity Coverage Ratios
Level I: July through December Level I LCRs were adequate had a
stressed event similar to the 2008 Liquidity Crisis occurred. Since
100% of Level I assets for CRF were held in cash and cash equivalents,
stress factors did not apply and the LCRs remained the same as the
normal environment.
Level I & III: Level I and III assets were adequate had a stressed event
similar to the 2008 Liquidity Crisis occurred. Since 100% of Level III
assets for HCF were held in cash and cash equivalents and fixed
income, stress factors had a minimal impact to LCRs. The overall LCR
decreased due to an increase in medical and pharmacy payments.
Level I: July through December Level I LCRs were adequate had a
stressed event similar to "Black Monday" occurred. Since 100% of
Level I assets for CRF were held in cash and cash equivalents, stress
factors did not apply and the LCRs remained the same as the normal
environment.
Level I & III: Level I and Level III assets were adequate had a stressed
event similar to "Black Monday" occurred. Since 100% of Level III
assets for HCF were held in cash and cash equivalents and fixed
income, stress factors had a minimal impact to LCRs. The overall LCR
decreased due to an increase in medical and pharmacy payments.
Treasury Analysis and Liquidity Status Report Prepared for: Finance and Administration Committee - Period ending December 31, 2016
Health Care Fund (HCF) / Contingency Reserve Fund (CRF)The HCF accounts for the activities of the CalPERS self-insured health care programs. Health premiums are collected from employers and members and used to directly pay
for medical services and pharmaceutical usage. The CRF was established to fund administrative costs related to the CalPERS health care programs and to provide a
contingency reserve for potential increases in future health care premium rates or health care benefit costs. Since the CRF acts as a reserve fund for the HCF, activities for
both funds are combined into one report.
Funding Sources and Graph Details
Level I: Cash and cash equivalents
Level III: Sale of public assets
Threshold: Indicates the Fund's ability to cover 100% of monthly obligations
The 30-day LCR included investment and non-investment available cash flows.
Stressed environment LCR scenarios were calculated assuming starting assets were stressed by the percentages actually experienced over 5 days in the 1987 market crash
and 30 days during September 2008. Starting assets were further reduced by a transactional liquidity % equal to the estimated % of the assets that could have been
liquidated during the 30-day period. Under the stressed scenarios, asset class sources were reduced to zero.
Actual Uses Estimated Uses
2.30
2.05 2.02
1.79 1.94
1.73
2.39
2.11 2.10
1.86 2.00
1.79
0.00
0.50
1.00
1.50
2.00
2.50
3.00
Jul 16 Aug 16 Sep 16 Oct 16 Nov 16 Dec 16
LCR
Month
Level I
Level I & III
Threshold
2.30
2.05 2.02
1.79 1.94
1.73
2.39
2.12 2.10 1.86
2.00 1.79
0.00
0.50
1.00
1.50
2.00
2.50
3.00
Jul 16 Aug 16 Sep 16 Oct 16 Nov 16 Dec 16
LCR
Month
1987 Market Crash "Black Monday"
Level I
Level I & III
Threshold
2.30 2.05 2.02
1.79 1.94
1.73
2.39
2.11 2.10 1.86
2.00 1.79
0.00
0.50
1.00
1.50
2.00
2.50
3.00
Jul 16 Aug 16 Sep 16 Oct 16 Nov 16 Dec 16
LCR
Month
2008 Liquidity Crisis
Level I
Level I & III
Threshold
Item 5e - Attachment 1
Page 10 of 12
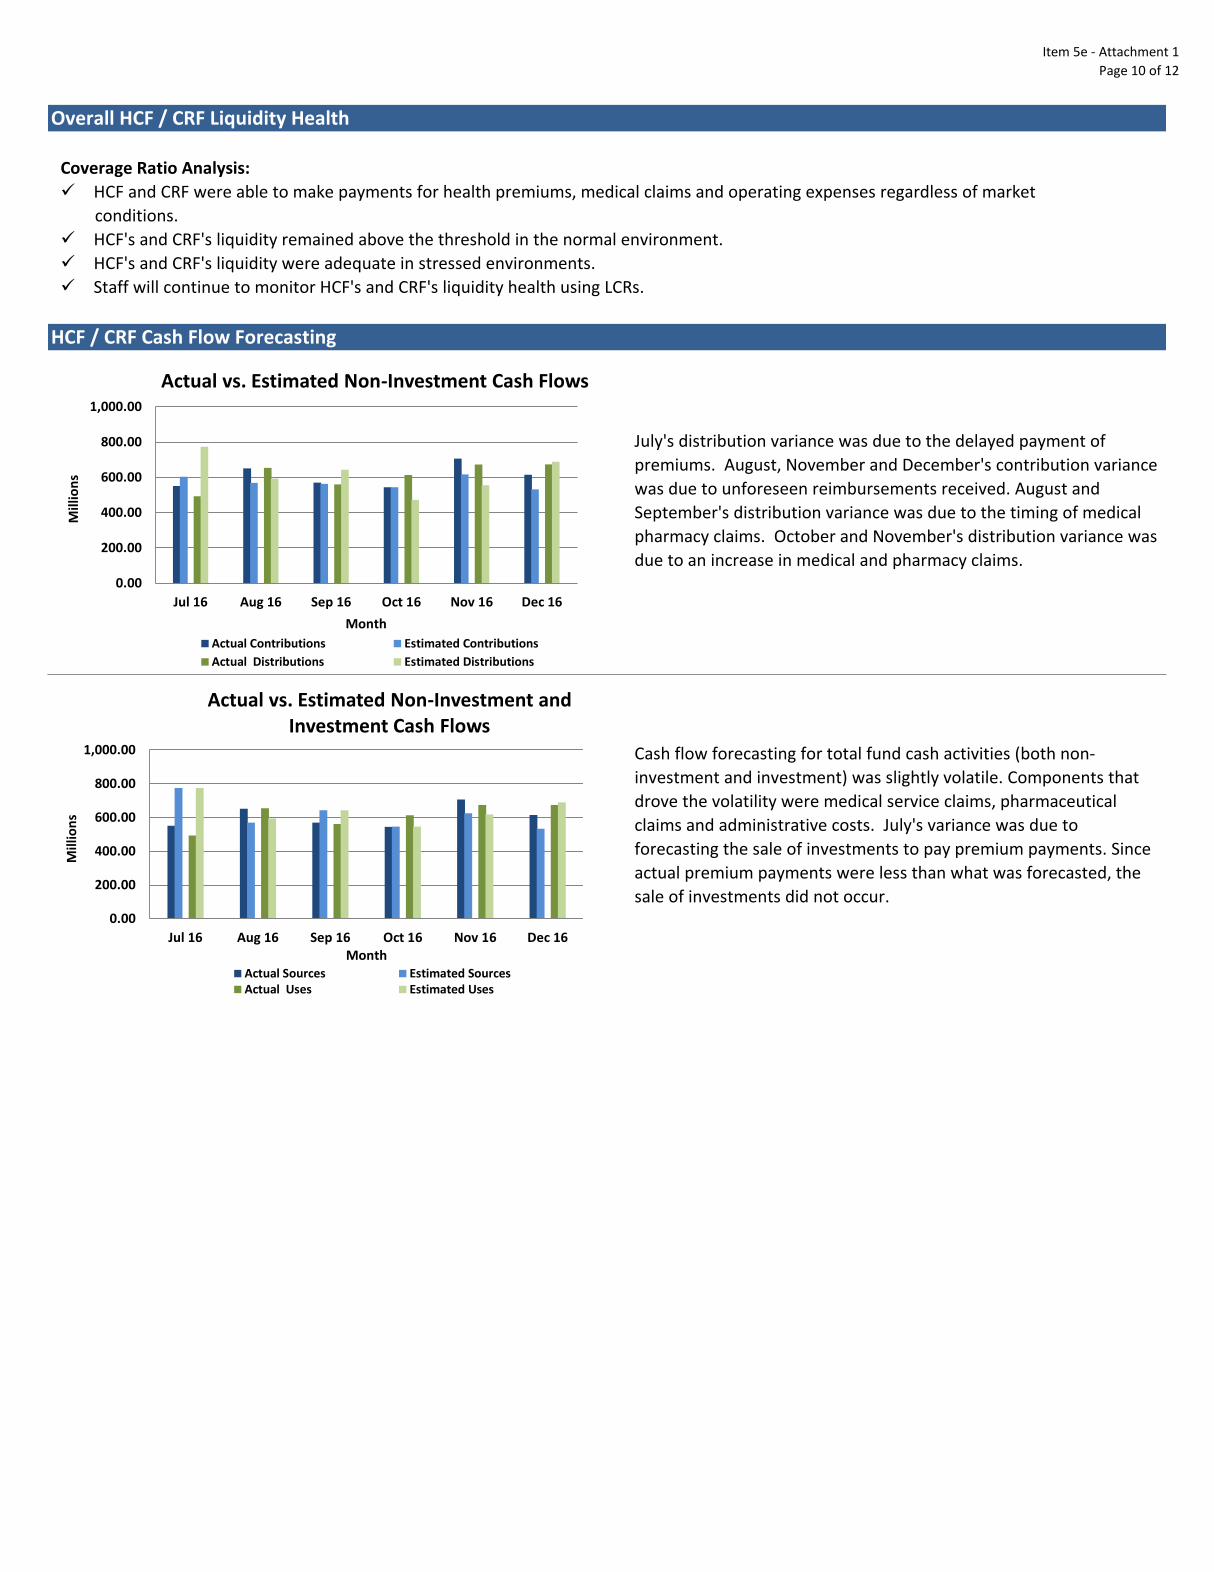
Overall HCF / CRF Liquidity Health
Coverage Ratio Analysis:
HCF and CRF were able to make payments for health premiums, medical claims and operating expenses regardless of market
conditions.
HCF's and CRF's liquidity remained above the threshold in the normal environment.
HCF's and CRF's liquidity were adequate in stressed environments.
Staff will continue to monitor HCF's and CRF's liquidity health using LCRs.
HCF / CRF Cash Flow Forecasting
July's distribution variance was due to the delayed payment of
premiums. August, November and December's contribution variance
was due to unforeseen reimbursements received. August and
September's distribution variance was due to the timing of medical
pharmacy claims. October and November's distribution variance was
due to an increase in medical and pharmacy claims.
Cash flow forecasting for total fund cash activities (both non-
investment and investment) was slightly volatile. Components that
drove the volatility were medical service claims, pharmaceutical
claims and administrative costs. July's variance was due to
forecasting the sale of investments to pay premium payments. Since
actual premium payments were less than what was forecasted, the
sale of investments did not occur.
0.00
200.00
400.00
600.00
800.00
1,000.00
Jul 16 Aug 16 Sep 16 Oct 16 Nov 16 Dec 16
Mill
ion
s
Month
Actual Contributions Estimated Contributions
Actual Distributions Estimated Distributions
0.00
200.00
400.00
600.00
800.00
1,000.00
Jul 16 Aug 16 Sep 16 Oct 16 Nov 16 Dec 16
Mill
ion
s
Month Actual Sources Estimated SourcesActual Uses Estimated Uses
Actual vs. Estimated Non-Investment Cash Flows
Actual vs. Estimated Non-Investment and Investment Cash Flows
Item 5e - Attachment 1
Page 11 of 12
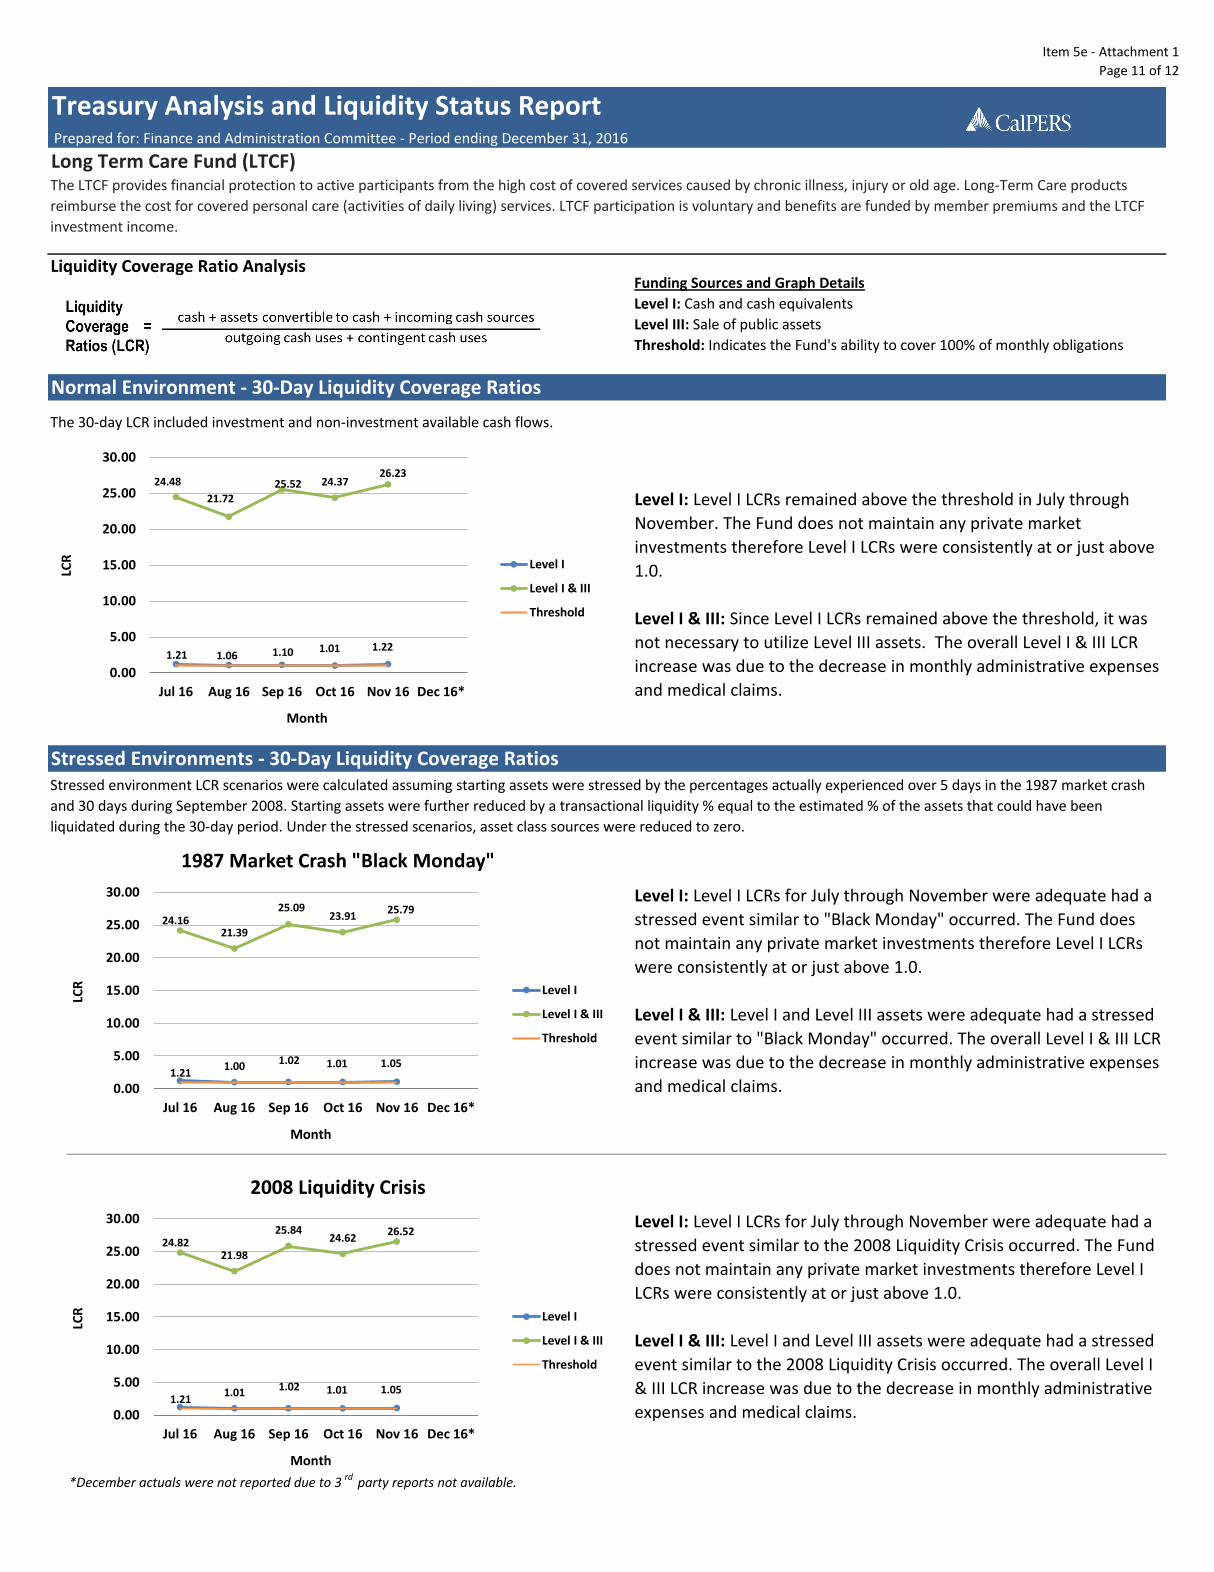
Liquidity Coverage Ratio Analysis
*December actuals were not reported due to 3 rd party reports not available.
Level I: Level I LCRs for July through November were adequate had a
stressed event similar to the 2008 Liquidity Crisis occurred. The Fund
does not maintain any private market investments therefore Level I
LCRs were consistently at or just above 1.0.
Level I & III: Level I and Level III assets were adequate had a stressed
event similar to the 2008 Liquidity Crisis occurred. The overall Level I
& III LCR increase was due to the decrease in monthly administrative
expenses and medical claims.
Normal Environment - 30-Day Liquidity Coverage Ratios
Level I: Level I LCRs remained above the threshold in July through
November. The Fund does not maintain any private market
investments therefore Level I LCRs were consistently at or just above
1.0.
Level I & III: Since Level I LCRs remained above the threshold, it was
not necessary to utilize Level III assets. The overall Level I & III LCR
increase was due to the decrease in monthly administrative expenses
and medical claims.
Stressed Environments - 30-Day Liquidity Coverage Ratios
Level I: Level I LCRs for July through November were adequate had a
stressed event similar to "Black Monday" occurred. The Fund does
not maintain any private market investments therefore Level I LCRs
were consistently at or just above 1.0.
Level I & III: Level I and Level III assets were adequate had a stressed
event similar to "Black Monday" occurred. The overall Level I & III LCR
increase was due to the decrease in monthly administrative expenses
and medical claims.
Treasury Analysis and Liquidity Status Report Prepared for: Finance and Administration Committee - Period ending December 31, 2016
Long Term Care Fund (LTCF)The LTCF provides financial protection to active participants from the high cost of covered services caused by chronic illness, injury or old age. Long-Term Care products
reimburse the cost for covered personal care (activities of daily living) services. LTCF participation is voluntary and benefits are funded by member premiums and the LTCF
investment income.
Funding Sources and Graph Details
Level I: Cash and cash equivalents
Level III: Sale of public assets
Threshold: Indicates the Fund's ability to cover 100% of monthly obligations
Stressed environment LCR scenarios were calculated assuming starting assets were stressed by the percentages actually experienced over 5 days in the 1987 market crash
and 30 days during September 2008. Starting assets were further reduced by a transactional liquidity % equal to the estimated % of the assets that could have been
liquidated during the 30-day period. Under the stressed scenarios, asset class sources were reduced to zero.
The 30-day LCR included investment and non-investment available cash flows.
Actual Uses Estimated Uses
1.21 1.06 1.10 1.01 1.22
24.48
21.72 25.52 24.37
26.23
0.00
5.00
10.00
15.00
20.00
25.00
30.00
Jul 16 Aug 16 Sep 16 Oct 16 Nov 16 Dec 16*
LCR
Month
Level I
Level I & III
Threshold
1.21 1.02 1.01 1.05
24.16 21.39
25.09 23.91
25.79
1.00
0.00
5.00
10.00
15.00
20.00
25.00
30.00
Jul 16 Aug 16 Sep 16 Oct 16 Nov 16 Dec 16*
LCR
Month
1987 Market Crash "Black Monday"
Level I
Level I & III
Threshold
1.21 1.01 1.02 1.01 1.05
24.82 21.98
25.84 24.62
26.52
0.00
5.00
10.00
15.00
20.00
25.00
30.00
Jul 16 Aug 16 Sep 16 Oct 16 Nov 16 Dec 16*
LCR
Month
2008 Liquidity Crisis
Level I
Level I & III
Threshold
Item 5e - Attachment 1
Page 12 of 12
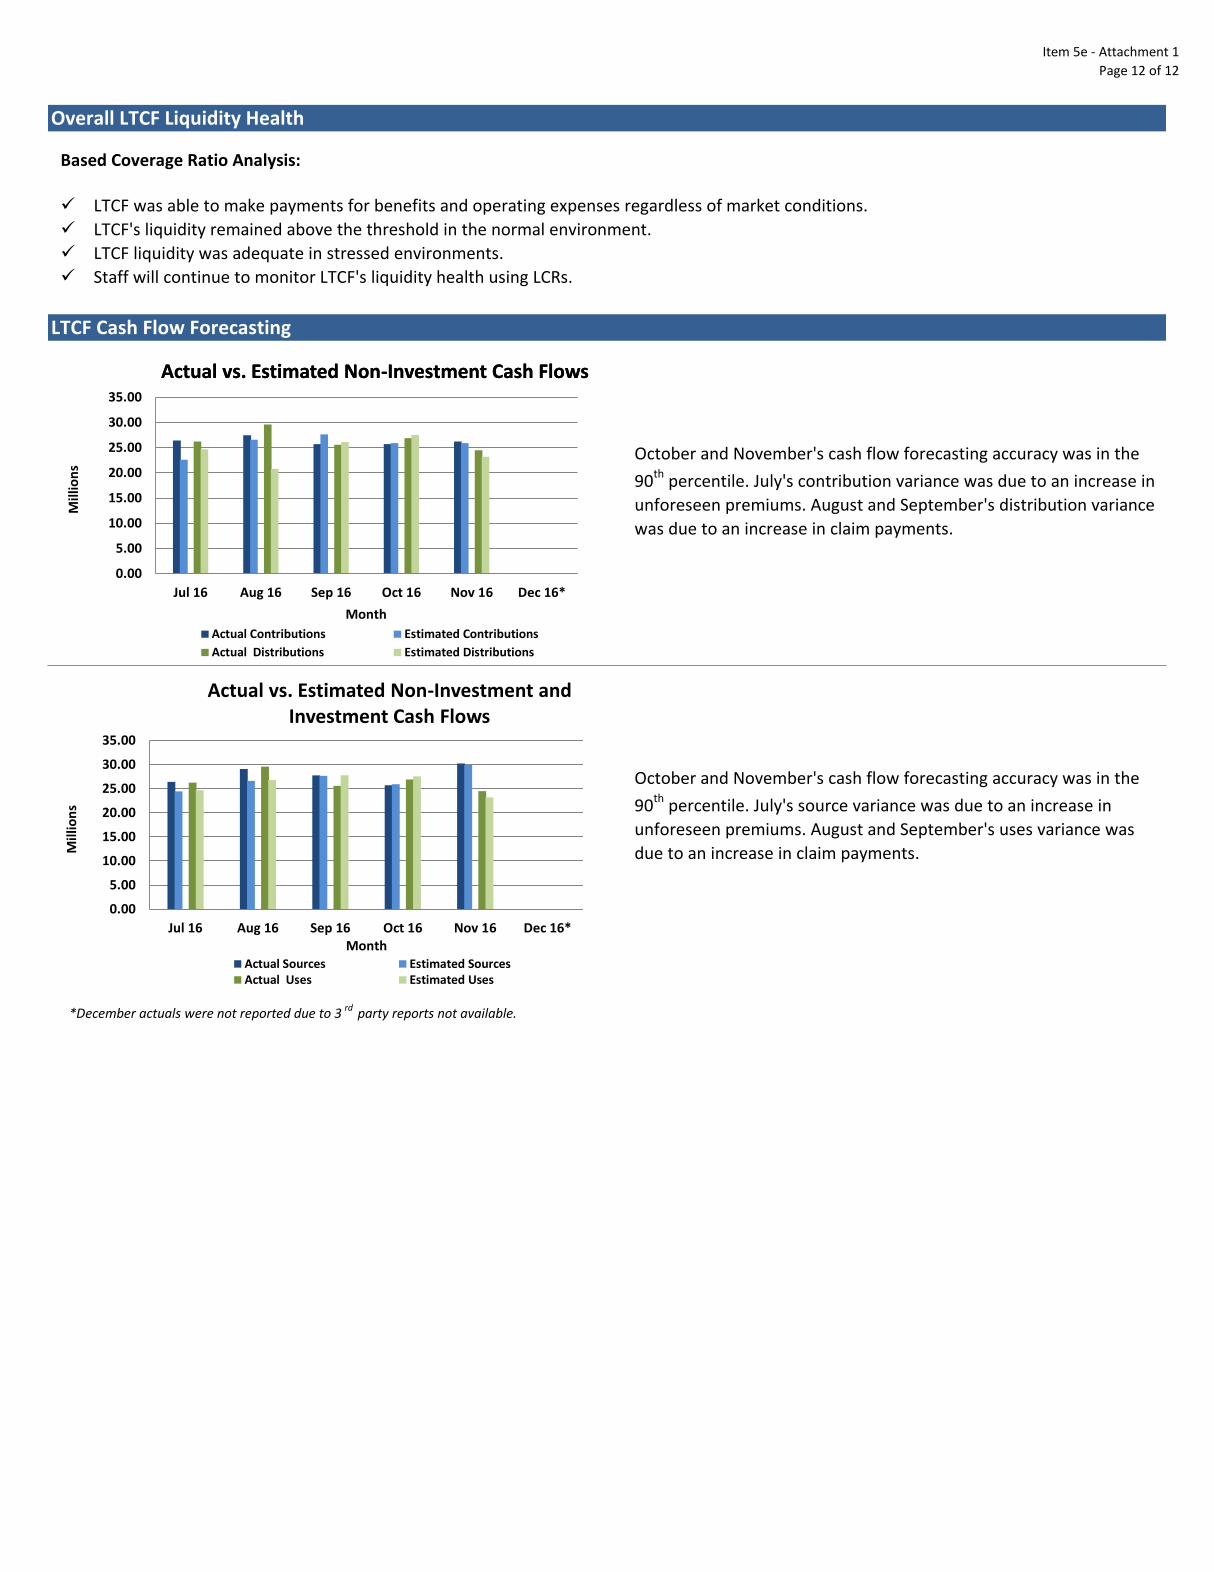
*December actuals were not reported due to 3 rd party reports not available.
October and November's cash flow forecasting accuracy was in the
90th
percentile. July's contribution variance was due to an increase in
unforeseen premiums. August and September's distribution variance
was due to an increase in claim payments.
October and November's cash flow forecasting accuracy was in the
90th
percentile. July's source variance was due to an increase in
unforeseen premiums. August and September's uses variance was
due to an increase in claim payments.
LTCF Cash Flow Forecasting
Overall LTCF Liquidity Health
Based Coverage Ratio Analysis:
LTCF was able to make payments for benefits and operating expenses regardless of market conditions.
LTCF's liquidity remained above the threshold in the normal environment.
LTCF liquidity was adequate in stressed environments.
Staff will continue to monitor LTCF's liquidity health using LCRs.
0.00
5.00
10.00
15.00
20.00
25.00
30.00
35.00
Jul 16 Aug 16 Sep 16 Oct 16 Nov 16 Dec 16*
Mill
ion
s
Month Actual Sources Estimated SourcesActual Uses Estimated Uses
Actual vs. Estimated Non-Investment Cash Flows
Actual vs. Estimated Non-Investment and Investment Cash Flows
0.00
5.00
10.00
15.00
20.00
25.00
30.00
35.00
Jul 16 Aug 16 Sep 16 Oct 16 Nov 16 Dec 16*
Mill
ion
s
Month
Actual Contributions Estimated Contributions
Actual Distributions Estimated Distributions
Actual vs. Estimated Non-Investment Cash Flows