FABRICATION OF DYE-SENSITIZED SOLAR CELL USING NATURAL ...
53
FABRICATION OF DYE-SENSITIZED SOLAR CELL USING NATURAL DYES FROM Lawsonia inermis (HENNA), Mangifera indica (MANGO), AND Terminalia catappa (TROPICAL ALMOND) LEAVES WITH POLYANILINE/GRAPHITE AS A COUNTER ELECTRODE SENIOR RESEARCH PROJECT BY CHUKWUMA VALENTINE ONWUJIUBA [A00017542] A thesis submitted in partial fulfillment of the requirements for the degree of Bachelor of Science (Petroleum Chemistry) American University of Nigeria, Yola Spring 2018 Approved by Dr. Wan Jin Jahng Supervisor Name, PhD. School of Arts & Sciences, AUN Committee Member Date:
Transcript of FABRICATION OF DYE-SENSITIZED SOLAR CELL USING NATURAL ...
FABRICATION OF DYE-SENSITIZED SOLAR CELL USING NATURAL
DYES FROM Lawsonia inermis (HENNA), Mangifera indica (MANGO), AND
Terminalia catappa (TROPICAL ALMOND) LEAVES WITH
POLYANILINE/GRAPHITE AS A COUNTER ELECTRODE
SENIOR RESEARCH PROJECT
BY
CHUKWUMA VALENTINE ONWUJIUBA
[A00017542]
A thesis submitted in partial fulfillment of the requirements for the degree of
Bachelor of Science (Petroleum Chemistry)
American University of Nigeria, Yola
Spring 2018
Approved by
Dr. Wan Jin Jahng
Supervisor Name, PhD. School of Arts & Sciences, AUN
Committee Member
Date:

II
CERTIFICATION OF STATEMENT
This project represents my own work in accordance with University regulations.
I authorize the American University of Nigeria to lend this thesis to other institutions or
individuals for the purpose of scholarly research.
Chukwuma V. Onwujiuba
I further authorize the American university of Nigeria to reproduce this thesis by
photocopying or by other means, in total or in part, at the request of other institutions or
individuals for the purpose of scholarly research.
Chukwuma V. Onwujiuba
Dr. Wan Jin Jahng
Dr. Bolade O. Agboola, PhD (Department Chair)
External Examiner

III
ABSTRACT
This study used natural extracts from Lawsonia inermis L. (Henna), Terminalia catappa L.
(Tropical Almond), and Mangifera indica L. (Mango) as photosensitizers for dye-sensitized
solar cells. The mango and tropical almond extracts were extracted using ethanol while the
henna extract was gotten using alkaline extraction. The choice of extraction solvent was
based on the ability to permeate the plant membranes and toxicity of the solvent. This study
used TiO2 as the semiconductor material, iodide/triiodide as the redox electrolyte, and
PANI/Graphite couple as the counter electrode. From the results gotten from the study, the
henna extract produced the highest voltage and current when tested under projector light
(57.6mV and 0.018mA) and sunlight (0.188V and 0.282mA). In contrast, the mango extract
produced the lowest results under the same conditions (no electricity under projector light;
0.892mV and 0.0164mA under sunlight). Additionally, the results showed that the voltage
output of the henna DSSC increased every week.

IV
DEDICATION
I dedicate this research to God almighty because it is by His grace I was able to see it
through. I also wish to dedicate this work to my family, friends, colleagues, and instructors
for always showing me support, believing in me, and motivating me throughout the duration
of this research.

V
ACKNOWLEGDEMENT
I am thankful to God for keeping me and giving me the strength to carry out this research,
even when I felt discouraged. I am also grateful to God for giving me a loving and supporting
family and friends. They always cheered me on and encouraged me throughout this research,
and for that I am thankful to them.
I want to appreciate my supervisor, Dr. Wan Jin Jahng, for always creating time out of his
busy schedule to attend to my needs during the period of this research. He gave me insights,
made corrections, and motivated me at all times. His belief in me was absolute and I think it
is safe to say that without his support, this research would not be complete. Additionally, I
want to say a big thank you to the Department chair, Dr. Bolade, for always making
suggestions on how to improve my work during our progress report classes. To the Research
Officers: Mr. Madu, Mr. Chikaodili, Mr. Mohammed, and Tosin, I would like to say a big
thank you for always assisting me in the lab. To those whose names are not mentioned, please
know that I appreciate all the help you rendered to me.
Last but not the least; I am greatly appreciative of the Yar’adua Foundation and AUN for
sponsoring my education. They showed faith in my potentials and gave me an opportunity to
develop them in an environment like AUN and for this; I am greatly indebted to them.

VI
TABLE OF CONTENTS
CERTIFICATION STATEMENT………………………………………………….…….II
ABSTRACT……………………………………………………………………….……..III
DEDICATION…………………………………………………………………………...IV
ACKNOWLEDMENT…………………………………………………………………....V
TABLE OF CONTENTS………………………………………………………………...VI
LIST OF TABLES……………………………………………………………………..VIII
LIST OF FIGURES……………………………………………………………………...IX
1.0 INTRODUCTION…………………………………………………………...….....1
1.1: Historical Backgroung of Solar Cells and Their Working Mechanism………….....3
1.2: Dye Sensitized Solar Cell (DSSC)……………………………………………….....4
1.3: How DSSCs Work………………………………………………………………….5
1.4: Counter Electrode: Polyaniline (PANI) Coupled with Graphite…………………...7
1.5: Natural Dyes………………………………………………………………………..9
1.6: Problem Statement…………………………………………………………………9
1.7: Aims and Objectives……………………………………………………………....10
1.8: Motivation and Hypothesis………………………………………………………..10
1.9: Significance………………………………………………………………………..10
1.10: Scope of Project………………………………………………………………….11
2.0 LITERATURE REVIEW……………………………………………………………13
2.1: Overview …………………………………………………………………………13
2.2: Components of a Dye Sensitized Solar cells……………………………………...13
2.3: Photosensitizer…………………………………………………………………….13
2.4: Semiconductor Electrode (Photoanode)…………………………………………..14
2.5: Redox Electrolyte…………………………………………………………………15
2.6: Transparent Conducting Oxide (TCO)……………………………………………16
2.7: Counter Electrode (CE)…………………………………………………………...17
2.8: Natural Dyes and Extraction Methods……………………………………………18
2.9: TiO2 Paste Preparation…………………………………………………………….19
3.0 METHODOLOGY…………………………………………………………………..20
3.1: Overview………………………………………………………………………….20
3.2: Materials…………………………………………………………………………..20

VII
3.3: Chemicals…………………………………………………………………………20
3.4: Preparation of Natural Dye Sensitizers…………………………………………...21
3.5: Alkaline Extraction of Henna Dye………………………………………………..21
3.6: Ethanolic Extraction of Mango and Tropical Almond Dyes……………………..22
3.7: Phytochemical Tests for the Leaf Extracts………………………………….……23
3.8: Preparation of the Photoelectrode………………………………………………..23
3.9: Synthesis of Polyaniline (PANI)………………………………………………....24
3.10: Preparation of Redox Electrolyte……………………………………………….24
3.11: Preparation of Counter Electrode……………………………………………….25
3.12: Assembling of DSSC…………………………………………………………...25
3.13: Testing of DSSC………………………………………………………………..26
4.0 RESULTS AND DISCUSSION……………………………………………………27
4.1: Overview…………………………………………………………………………27
4.2: UV/Vis of the Extracted Dyes…………………………………………………...27
4.3: IR Analysis of the Extracted Dyes……………………………………………….28
4.4: Phytochemical Tests of Leaf Extracts…………………………………………....30
4.5: GCMS Analysis of Lawsonia inermis………...………………………………….31
4.6: Conductivity of PANI……………………………………………………………32
4.7: Electricity under Projector Light…………………………………………………33
4.8: Electricity under Sunlight………………………………………………………...35
4.9: Study of Lawsonia inermis DSSC over Time…………………………………….38
5.0 CONCLUSION……………………………………………………………………...40
5.1 Suggestion for Future Research…………………………………………………...40
REFERENCES…………………………………………………………………………..42

VIII
LIST OF TABLES
Table 1: Phytochemical test results................................................................................... 30
Table 2: Polyaniline table of values .................................................................................. 32
Table 3: Terminalia catappa DSSC under projector light. ............................................... 33
Table 4: Statistical data for Terminalia catappa DSSC under projector light .................. 34
Table 5: Lawsonia inermis DSSC under projector light. .................................................. 34
Table 6: Statistical data for Lawsonia inermis DSSC under projector light ..................... 34
Table 7: Terminalia catappa DSSC under sunlight……………………………………...35
Table 8: Statistical data for Terminalia catappa DSSC under sunlight………………….36
Table 9: Mangifera indica DSSC under sunlight………………………………………...36
Table 10: Statistical data for Mangifera indica DSSC under sunlight…………………...36
Table 11: Lawsonia inermis DSSC under sunlight………………………………………37
Table 12: Statistical data for Lawsonia inermis DSSC under sunlight…………………..37
Table 13: Performance of Lawsonia inermis DSSC over time…………………………..39
IX
LIST OF FIGURES
Figure 1: Structure and mechanism of a DSSC ............................................................................... 6
Figure 2: Chemical structures of different forms of polyaniline .............................................. 8
Figure 3: Left to right: Mango; Tropical Almond; Henna powder .......................................... 21
Figure 4: Structure of Lawsone pigment in Henna extract ..................................................... 22
Figure 5: Plant extract .................................................................................................................... 22
Figure 6: Left to right: TiO2 paste; Photoanode after sintering. .................................................... 23
Figure 7: Synthesis of PANI………….………………………………………………………….24
Figure 8: Iodide/triiodide redox electrolyte……………………………………………..……….25
Figure 9: PANI/Graphite counter electrode…...............................................................................25
Figure 10: Left to right: Dye adsorbed on photoanode; Assembled DSSC…………..………….26
Figure 11: DSSC being tested under sunlight……………………………………………………26
Figure 12: UV-Vis absorption spectra of Henna Dye ………………………………………..….28
Figure 13: UV-Vis absorption spectra of Mangifera indica extract……………………………..28
Figure 14: UV-Vis absorption spectra for Terminalia catappa extract………………………….28
Figure 15: Mangifera indica dye IR spectrum…………………………………………………...29
Figure 16: Terminalia catappa dye IR spectrum………………………………………………...29
Figure 17: Lawsonia inermis dye IR spectrum……………………………………….….………29
Figure 18: a) Flavonoids; b) Tannins......................................................................................…...30
Figure 19: Structure and mass spectra of γ-tocopherol...………………………………………...31
Figure 20: a) Voltage under projector light; b) Current under projector light………….………..35
Figure 21: a) Voltage under sunlight; b) Current under sunlight………………………………...37
Figure 22: Graph of voltage against time……………………………………………………...…40
1
Chapter 1: Introduction
Electricity is a form of energy that improves the quality of human life to a great extent. Its
demand has increased exponentially over the years thereby causing a strain on its sources.
Currently, the major source of electricity is burning of fossil fuels. The usage of fossil fuels
as a source of electricity results in the emission of greenhouse gases such as carbon dioxide
(CO2) and methane (CH4). These gases are very harmful to the environment as they
contribute to global warming. Furthermore, during mining and exploration of fossil fuels, the
environment in which they are mined usually gets polluted or degraded. Research shows that
this may lead to acid rain, drastic climate change, pollution of aquatic life, spread of diseases
that can kill both humans and animals, and other unfavorable and uncontrollable conditions
that damage the ecosystems.1 There is also concern that fossil fuel reserves are quickly
depleting and may not actually be limitless.
Another energy source that is being used to generate electricity is nuclear energy. Nuclear
power is mostly used in developed countries. Nuclear energy is advantageous because it
generates electricity through a self-sustained reaction; however, disposal of nuclear waste is a
major challenge. Also, in the event of an accident at the power plant, radioactive components
are released to the environment. Nuclear radiation is very hazardous to humans, plants,
animals, and the environment at large. A good example is the Chernobyl accident of 1986 at
the Chernobyl nuclear power plant in Ukraine. The accident left many dead, thousands ended
up with thyroid cancer, and the environment was polluted.2 This knowledge has sparked
research into other sources of energy that are both renewable and relatively harmless to the
environment.
Renewable energy sources are those energy sources that are inexhaustible, such as wind,
solar, geothermal energy, biomass, tidal energy, hydropower and many more. A good

2
characteristic of most renewable energy sources that makes them very attractive is the fact
they are ecofriendly.3 Although renewable energy is a good alternative to the use of fossil
fuels and nuclear energy, its implementation is quite challenging. This owes to the fact that
some renewable energy sources are intermittent, for example solar energy can only be
harnessed in the day and its supply decreases with increasing latitude.
Additionally, some renewable energy sources are limited by geography, and so cannot be
implemented in certain areas. For example hydroelectric energy is not feasible in regions with
very dry climates. Another challenge with renewable energy is the heavy investment needed
for development and installation of infrastructure. This is often coupled with a certain level of
risk and uncertainty. This is especially a challenge for developing nations such as countries in
Africa.4,5
Currently, on a global scale, 16% of primary energy sources are accounted for by
renewable energy sources. With the increasing consumption of electricity, there is a heavy
demand for more renewable energy sources to be developed.
Among all the current renewable energy sources, solar energy can be considered as one with
many advantages. This is especially more advantageous for nations in Africa because they are
located in tropical areas that receive massive solar radiation year in year out. Solar energy is a
form of energy that is totally clean and free. It is estimated that the sun delivers 120,000TW
of energy to the earth per hour and the earth currently needs 13TW of energy per year (0.01%
of the energy the sun provides the earth per hour).1 This shows that the energy from the sun is
more than adequate to meet the global energy needs if well harnessed.
Solar energy can be harnessed using two categories of technology known as concentrating
solar power and solar photovoltaics (SPVs).1 Concentrating solar power uses mirrors to focus
the sun’s thermal energy on a fluid that is capable of heat transfer. The fluid generates steam
which is then used to drive a turbine that generates electricity. In contrast, in SPVs, donor

3
molecules undergo electronic excitation when exposed to photons. The excited electrons
migrate to electrodes present in the system to generate electricity. SPVs are also known as
Solar Cell. 1,6,7
1.1 Historical Background of Solar Cells and Their Working Mechanism
Solar cell or photovoltaics was first discovered in 1839 by French scientist Alexandre
Edmond Becquerel. He made the discovery when he observed that on exposure to sunlight,
metal electrodes coated with copper oxide or silver electrode produced a voltage.3 Much later
in 1873, it was discovered by Hernan Vogel that some organic dyes when used in silver
halide photographic films enhanced the response of some colors. Subsequent research helped
explain that electron transfer from the chromophore of the organic dyes to the silver halide
was responsible for this mechanism.8 This discovery would then go on to shape modern
photography. In 1877, scientists Adams and Day were able to make the first solid-state
Photovoltaic cell from selenium.9 Between 1930-1933, scientists such as B. Lange and L. O.
Grondahl were able to develop oxide/copper cells that were used in photography and optical
instruments as light meters.10
Photovoltaic (PV) effect was applied for the first time in 1954 at Bell Labs in the United
States by D. Chapin and G. Pearson and also at RCA Laboratories by Paul Rappaport.8,11
In
the papers they submitted in 1954, Rappaport explored the electron-voltaic effect in p-n
junctions induced by beta bombardment, while Chapin and Pearson explored a new silicon p-
n junction photocell for converting solar radiation into electrical power. The common ground
between these papers was their description of how incident light can be converted to
electricity by some semiconductor p-n junction devices. This marked the beginning of the
modern PV age. The cuprous oxide/copper cells and selenium cells were then tested to see

4
how efficient they were in converting solar energy to electricity. Their efficiencies were
about 0.1-0.5%, and by far less than the 6% efficiencies of the PV cells developed in 1954.11
In these solar cells, holes were created whenever light was absorbed by the silicon wafer and
the p-n junction served as a barrier between the electron and holes conduction points.
The use of sensitization in solar cells was also explored by several scientists and in 1991,
there was a significant breakthrough in the use of sensitization in solar cells. A Swiss
research group headed by Michael Graetzel was able to develop a new low-cost solar which
was called Dye-Sensitized Solar Cell (DSSC). This solar cell was able to produce an
efficiency of 7%~8%. The DSSC was inspired by the principle of photosynthesis combined
with the idea from the working mechanism of dye-sensitized silver halide emulsions that is
used in photography.2,12
The working mechanism of a solar cell is quite simple. When light is incident on a solar cell,
electrons gain energy and are excited from the semiconductor material. A circuit can be
created by connecting conductors to the positive and negative ends of the cell. These
conductors then capture the excited electrons thereby forming a flow of electric current which
can then be used to power up a device if the current is large enough.
1.2 Dye Sensitized Solar Cell (DSSC)
Dye-Sensitized Solar Cells was first researched in the year 1991 by scientist Michael
Graetzel. He proposed DSSC as an alternative to silicon solar cell. Compared with silicon cell
solar cells, DSSCs have a lot of advantages. It is very cost-effective and its performance is
not as affected as silicon cells in low light situations.13
A DSSC consists of a nanocrystalline
metal oxide semiconducting layer deposited on transparent fluorine doped tin oxide (FTO)

5
conductive glass, adsorbed dye on the semiconducting material, counter electrode, and an
electrolyte containing iodide and triiodide ions. The dye is the sensitizer and helps in
absorbing light. The counter electrode plays a vital role in collecting electrons and
regeneration of redox species used as a mediator. The entire process of converting solar
energy to electricity is based on charge separation. In a nutshell, the dyes absorb photon
which leads to electron excitation. The excited electrons transfer to the TiO2 conductive
electrode and through the electrolyte where redox reaction occurs. The electrons then return
to the dye through the counter electrode.13
In DSSCs, semiconductors that have wide bandgaps are sensitized with dyes so as to make
them convert visible light to electricity. Natural dyes are very advantageous because they are
ecofriendly and cost-effective. DSSCs also use nanostructured electrodes alongside the dye
for efficient charge injection by photoelectron. Conducting polymers show promise for use as
counter electrode materials in DSSCs, for example Polyaniline (PANI).14
It is very attractive
because it is cheap and can be easily synthesized, it exhibits high conductivity and is very
stable, and it has good redox properties for I3- reduction. The DSSC includes an anode which
is fluorine doped tin oxide (FTO) glass coated with TiO2 nanoparticles with dye adsorbed on
it, a cathode which is FTO glass with Polyaniline deposit on it and a redox I-/I3
- couple
electrolyte.13,14
1.3 How DSSCs Work
The working principle of DSSC is very similar to the process of photosynthesis. In DSSC, the
dye absorbs light and electrons gain energy and undergo excitation. In photosynthesis, CO2
accepts the excited electrons whereas in DSSC, titanium dioxide (TiO2) functions as the
electron acceptor. While water and oxygen play the role of redox electrolyte in
6
photosynthesis, this role is being played by iodide/triiodide (I−/I3
−). DSSC is structured in
multilayers to boost absorption of light as well as optimize electron collection and transfer.
This structure and its function can be likened to that of the thylakoid membrane in plants.12
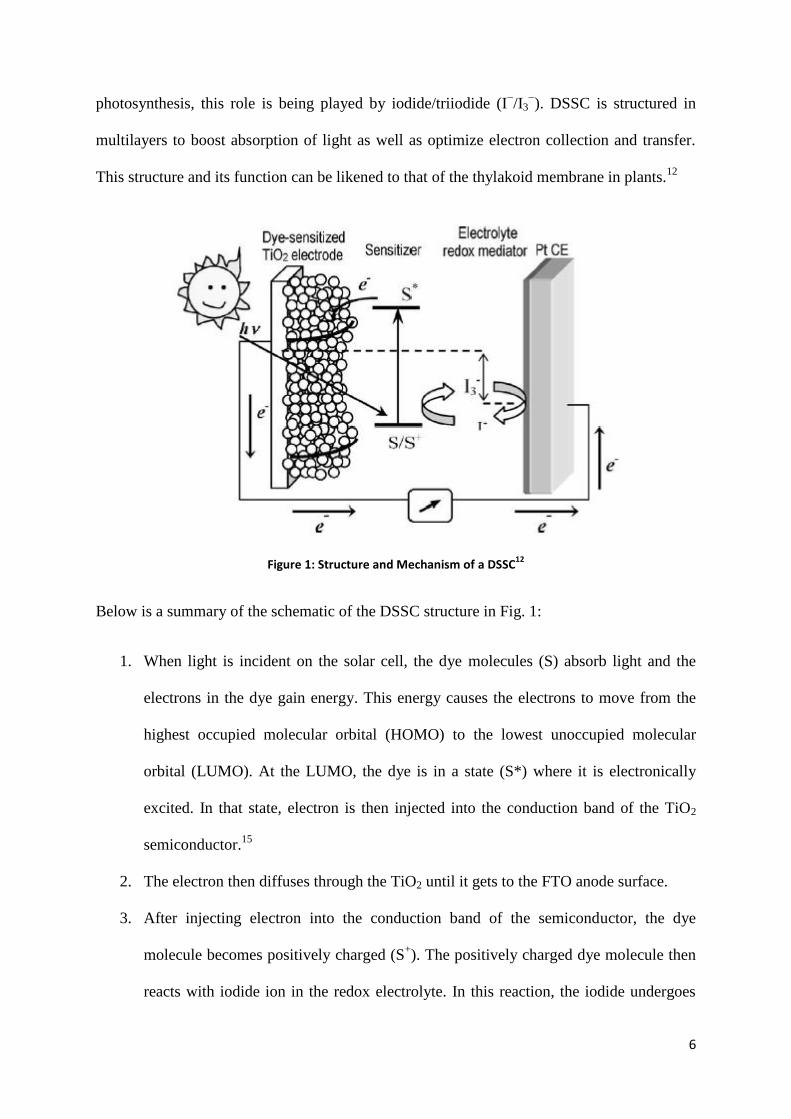
Figure 1: Structure and Mechanism of a DSSC12
Below is a summary of the schematic of the DSSC structure in Fig. 1:
1. When light is incident on the solar cell, the dye molecules (S) absorb light and the
electrons in the dye gain energy. This energy causes the electrons to move from the
highest occupied molecular orbital (HOMO) to the lowest unoccupied molecular
orbital (LUMO). At the LUMO, the dye is in a state (S*) where it is electronically
excited. In that state, electron is then injected into the conduction band of the TiO2
semiconductor.15
2. The electron then diffuses through the TiO2 until it gets to the FTO anode surface.
3. After injecting electron into the conduction band of the semiconductor, the dye
molecule becomes positively charged (S+). The positively charged dye molecule then
reacts with iodide ion in the redox electrolyte. In this reaction, the iodide undergoes

7
oxidation by giving electrons to the dye cation in order to regenerate the dye. The
oxidized form of the electrolyte is the triiodide ion.
4. The I3- then migrates to the cathode and gets reduced by accepting the electrons
excited from the dye in the first place. This reduction process regenerates the
electrolyte to iodide form.15
Using equations, the process can be summarized into three steps:
Absorption
Electron Injection
Regeneration
In the operation of the cell, no chemicals are used up and no new chemicals are formed. This
means that DSSC undergoes a regenerative process.12
1.4 Counter Electrode: Polyaniline (PANI) Coupled with Graphite
The counter electrode completes the circuit of a DSSC. Its function is to intercept the excited
electron and redirect it to the electrolyte solution. There are certain criteria a material must

8
meet to be considered for use as a counter electrode for DSSC. The first and most important
criterion is conductivity. A counter electrode must be conductive so that electrons can flow
with very little resistance. It should also possess good redox property for the reduction of the
redox couple.12
Platinum remains the choice counter electrode because of its catalytic
property and it has produced the best efficiency so far, however, platinum is very expensive.
This has caused researchers to devote time into discovering alternatives that are capable of
replacing platinum as counter electrode. So far, carbonaceous materials like graphite and
carbon black have been explored with a certain level of success. Some conducting polymers
have also been explored because of their ease of production, high conductivity and stability,
as well their redox abilities for redox electrolytes like iodide/triiodide.16,17
Polyaniline is a conducting polymer which has been experimented on as a counter electrode
for DSSC. It possesses some qualities and characteristics that make it advantageous over
many existing counter electrodes. Conducting polyaniline is very cheap and easy to
synthesize, highly conductive and has a high level of stability. PANI also possesses a very
good redox property which makes it advantageous to the redox couple used in the DSSC.
Graphite is coupled with PANI for this research so as to induce catalytic ability.16
Figure 2: Chemical structures of different forms of polyaniline.

9
1.5 Natural Dyes
Natural dyes have been used as an alternative to organic dyes as photosensitizers in DSSCs.
The function of the natural dyes is to absorb light and excite electrons as a result of the light
it has absorbed. Natural dyes are more advantageous than organic dyes for so many reasons.
For one, natural dyes are inexpensive as they can be easily gotten from different plants and
they are abundantly available in nature. Furthermore, natural dyes are environmentally
friendly and contain no carcinogens. Unlike organic dyes, natural dyes can be used directly
after extraction without the need for purification.12
For this study, natural dyes from Terminalia catappa (tropical almond) leaves, Mangifera
indica (mango) leaves, and Lawsonia inermis (Henna) leaves will be used. Mango belongs to
the family of evergreen trees and has a genus of Anacardiaceae. The major components of
mango dye pigment are anthraquinones and flavonoids. These components also contain
lupeol, tannins, and saponnins.18
Henna dye is used in body painting and cosmetics in the
Northern part of Nigeria. It belongs to the Lawsonia genus and it is a flowering plant. It has a
reddish brown pigment that is solely made up of hennotanic acid or Lawsone.19
Tropical
almond is a tree that belongs to the family of Combretaceae. It has a lot of medicinal uses
such as anti-diabetic, antibacterial, anti-inflammatory, anti-fungal and even anti-HIV uses. It
has components such as cyclic triterpenes, flavonoids, and tannins among others.20
1.6 Problem Statement
Constant supply of electricity is one of the major challenges facing Nigeria. There are a lot of
industries in Nigeria that can function better and cut their costs if there were constant power
supply. The use of solar energy in Nigeria will not only improve the power supply in the
10
country, but also reduce our greenhouse gases emission by reducing our dependence on fossil
fuels like coal, and hydrothermal energy as a source of electricity. Dye Sensitized Solar Cell
is a form of solar cell that will be very advantageous for Nigeria as it is highly budget-
friendly. The materials required to build DSSCs can be easily sourced within the country as
well.
1.7 Aims and Objectives
The aims of this research are:
to extract natural dyes from Terminalia catappa (tropical almond) leaves, Mangifera
indica (mango) leaves, and Lawsonia inermis (Henna) leaves
to build a dye sensitized solar cell with PANI/Graphite as counter electrode
to determine and compare the efficiencies of the dyes used in the research
1.8 Motivation and Hypothesis
A lot of research needs to be done to improve DSSCs and make it commercially available. I
propose that all chromophore can be used as dyes for DSSC. Furthermore, I hypothesize that
the dyes used in this research will produce a high efficiency in a DSSC where PANI coupled
with graphite is the counter electrode.
1.9 Significance
Dye sensitized solar cell is very economical and ecofriendly. The raw materials are readily
and abundantly available in Nigeria. If the efficiency is improved, it will help solve the
11
problem of intermittent power supply in Nigeria and also reduce our dependence on
hydrothermal energy and fossil fuel power plants as sources of electricity. This also applies to
the world at large. One of DSSCs greatest achievement in the world would be reduction of
greenhouse gases that are emitted into the atmosphere through burning of fossil fuels to
generate electricity.
1.10 Scope of Project
The following scopes of study were covered in this research:
Chapter 1: This chapter looks into introduction, aims and objectives of the research, as well
as the significance of the research. This chapter also looks into some background information
on the area of research.
Chapter 2: This chapter reviews some of the work done on DSSCs by various researchers. It
looks into reviews on the components of a DSSC such as photosensitizer, semiconductor
electrode, redox electrolyte, and counter electrode. It also covers the role of transparent
conducting oxides in DSSC, natural dyes and various techniques used to extract them,
titanium (IV) oxide and various methods of preparing its paste.
Chapter 3: This chapter covers the materials used throughout the research and the methods
used to carry out the research. It provides thorough information on the methods of extraction
used to extract natural dyes from the Terminalia catappa L., Mangifera indica L., and
Lawsonia inermis L. This chapter also provides information on the every step involved in
assembling the DSSC. These steps are preparation of TiO2 paste, preparation of photoanode,
synthesis of polyaniline emeraldine salt and iodide/triiodide redox electrolyte, preparation of

12
counter electrode, and the assembling of the DSSC. Finally, the chapter provides information
on how the DSSC was tested.
Chapter 4: This chapter looks into the results gotten from the IR and UV/Vis analysis of the
natural dyes extracted from the plants. The results gotten after measuring the conductivity of
the polyaniline are discussed in this chapter as well. Further, this chapter covers all the results
pertaining to the performance of the DSSC of each dye under projector light and sunlight.
These results are also discussed thoroughly in this chapter.
Chapter 5: This chapter summarizes the entire research and provides a conclusion based on
the results obtained from the research. Some of the challenges faced during the course of the
research and suggestions on ways to improve further research in this area are also provided in
this chapter.

13
Chapter 2: Literature Review
2.1 Overview
This chapter discusses the role of the various components of a DSSC. It also looks into the
use of natural dyes as photosensitizers and reviews various techniques used by various
researchers to extract natural dyes from plants. This chapter also covers the significance of
the homogeneity of the TiO2 paste used to prepare the photoanode. It also reviews some
techniques that have been used in some researches to prepare homogenous pastes.
2.2 Components of a Dye Sensitized Solar Cell
According to Monishka, DSSC functions by the sensitization of semiconductors with wide
bandgaps.12
This implies that a DSSC cannot function without a photosensitizer and
semiconductor material. Other components of a DSSC that are vital to its operation are redox
electrolyte, counter electrode, and transparent conducting oxide (TCO).
2.3 Photosensitizer
The function of a photosensitizer in a DSSC is the absorption of light and excitation of
electron as a result. There are certain criteria a photosensitizer should meet to be considered
efficient. Firstly, it should be able to absorb a reasonable amount of light in the visible region.
This is important because in the absence of a storage mechanism, the DSSC can be used in a
room setting and not just under the sun or with a UV light device. It should also be able to
adsorb strongly to the semiconductor surface, and have the ability to inject electron into the
conduction band of the semiconductor. Furthermore, the photosensitizer should have

14
components that contain groups such as =O and ─OH. This boosts its ability to chelate to the
Ti(IV) sites of the TiO2.12
A DSSC operates using a regenerative mechanism where the
excited state of the photosensitizer is regenerated to its ground state; hence, an ideal sensitizer
should be able to undergo this process swiftly and be stable in its ground state and excited
state.
The sensitizer also contributes to the efficiency of the solar cell. Qualities of a sensitizer that
increases the efficiency of a DSSC are: how well incident light is absorbed by the sensitizer
molecules, how well the absorbed photons get converted to electron-hole pairs, and the rate at
which separation and collection occurs. According to Monishka, polypyridyl complexes of
Ruthenium (N3 and N719) produced by Graetzel and his group have yielded the best results
so far, though with cost and environmental challenges. Natural dyes have also been used as a
better alternative in terms of availability, cost, and environmental friendliness.12
2.4 Semiconductor Electrode (Photoanode)
A semiconductor film for DSSC is usually a nanocrystalline material with a very thin layer of
about with a high porosity for the absorption of the dye sensitizer.12
According to
Mohsen et al, there are generally two types of semiconductor materials, and the type of
photonic cell the material can be used for depends on the type of semiconductor material. The
n-type semiconductor material has mobile electrons in its conduction band (CB). By virtue of
this characteristic, n-type semiconductors are generally used in photo-electrochemical cells
(liquid junction solar cells) such as DSSC or Quasi Dot Solar Cell (QDSC). Example of an n-
type semiconductor material is ZnO and TiO2.21

15
The second type of semiconductor materials is the p-type semiconductor material. They have
mobile holes in their valence band (VB) and are mostly applied in the fabrication of thin-film
PVs and photocathodes as well. Examples of this class of semiconductor materials are
Cu2ZnSnS4 (CZTS) and CuInS2.21
Metal oxides like ZnO, Nb2O5, and SnO2 have been
explored as semiconductor materials for DSSCs because they have suitable bandgaps,
physical properties and electronic mobility. However, TiO2 has proven to be the best option
because of its ability to combine all these qualities to a higher degree.22
Research is still ongoing to develop new semiconductor materials as well as improve on the
current breed of semiconductor materials for DSSC. In the research done by Mohsen et al,
facile electrochemical process was used to deposit Cu2+
, Zn2+
, and Sn4+
metallic cations on an
FTO glass to form a p-type semiconductor electrode. To achieve this, they prepared 0.01M
solutions of the copper and tin cations, and 0.005M solution of the zinc cation. By applying a
negative potential, the cations were simultaneously deposited on the FTO glass for 90mins
after which the FTO with the substrates were annealed at 823K for 4 hours. Silver was
deposited on the electrode photochemically and the electrode was illuminated with xenon for
an hour. According to their report, this was a novel method which generated good results.21
2.5 Redox Electrolyte
The function of the redox electrolyte is the mediation of electrons between the two
electrodes. According to Monishka, Iodide/triiodide in an organic solvent is the most used
redox electrolyte in DSSC.12
The organic solvent serves to create an environment in which
the I‾/I3
‾ can easily dissolve and diffuse. The I
‾ feeds the excited state of the dye in the
photoanode with electron to regenerate the ground state of the dye. This process leads to the
formation of I3‾ ion which moves to the cathode to be regenerated to I
‾ in a fast chemical

16
reaction. This process occurs very fast and the redox potential of the bulk electrolyte
maintained during the redox process. The redox reaction is a two-electron reaction with a
series of successive intermediate reactions
Two-electron reaction
Charge transfer reaction (1)
Fast chemical reaction (2)
Fast chemical reaction (3)
Reactions 1, 2, and 3 are the successive intermediate reactions that take place during the
redox reaction. Other electrolytes that have been used in DSSC are lithium iodide/iodine,
bromine (Br‾/Br2), and hydroquinone among others, but the best results have been achieved
using iodide/triiodide.12
2.6 Transparent Conducting Oxide (TCO)
TCOs have become an integral component of electronics over the years. Their ability to
combine optical and electrical properties makes them very attractive for applications in
photovoltaic devices, organic light-emitting diodes (OLED), liquid crystal displays (LCD),
gas sensors and touch panels among others. TCOs have the ability to conduct electricity and
its transparency allows light to pass through it effectively, especially in the visible domain.23
TCOs are usually doped with other elements like fluorine, indium, silicon and many more to
increase their conductivity to the level comparable to those of metals. Some of these
materials have wide bandgaps and as a result, the TCO also becomes a wide bandgap

17
material.23
A TCO material must have a very low resistivity (about ) and high
transmittance in the visible region because they have wide bandgaps.23
The most used TCOs are indium doped tin oxide (ITO) and fluorine doped tin oxide (FTO).
More recently, zinc oxide based TCOs are making waves in the market because they are
cheaper, abundant, and non-toxic.24
For the purpose of this research, fluorine doped tin oxide
(FTO) was used.
2.7 Counter Electrode (CE)
The counter electrode helps in the regeneration of the oxidized form of the redox electrolyte
through a reduction reaction. There are certain criteria a material must meet to be used as a
counter electrode. These criteria are:
low charge transfer resistance
high exchange current density
very conducting
low overvoltage for reduction of the oxidized redox electrolyte
When excited electron moves from the photoanode to the counter electrode, it transfers the
electron to the oxidized redox electrolyte so as to regenerate it. Platinum (Pt) is the preferred
choice for counter electrode material however it is very expensive, hence the need for other
alternatives.12
Another alternative to platinum is carbon (C) counter electrode, mostly in the form of
graphite or graphene. Graphite is a very good alternative because it is very cheap, conductive
and heat and corrosion resistant. It also catalyzes the reduction of triiodide ion to iodide ion.
A DSSC efficiency of 6.72% has been recorded with a Pt/C black counter electrode.12

18
Recently, conductive polymers like polyaniline have been tested as counter electrode
materials for DSSC. In a research by Bahramian and Vashaee, transparent polyaniline (PANI)
film was used as CE material for a DSSC that included a photoanode made coated with coral-
like TiO2 semiconductor and N719 dye molecules. The efficiency of the DSSC was found to
be 8.22%.25
2.8 Natural Dyes and Extraction Methods
Prior to the use of natural dyes as photosensitizers in DSSCs, organic dyes were used. Some
of these dyes are not environmentally friendly, while most are very expensive and hard to
source. The use of natural dyes bridges the gaps created by these challenges. Natural dyes are
cheap and readily available since they can be gotten from plants. They are also very easy to
extract and have no negative impacts on the environment.12
Natural dyes can be extracted from the leaves, seeds, and barks of plants using various
extraction methods. Some extraction methods that have been used by some researchers to
extract natural dyes are ethanol extraction, aqueous extraction, and alkaline extraction. In a
research carried out by Desalegn et al, Amaranthus caudatus, Bougainvillea spectabilis,
Delonix regia, Nerium oleander and Spathodea campanulata flowers were collected and
dried at room temperature for 30 days after they were crushed to powder. They extracted
Amaranthus caudatus and Bougainvillea spectabilis separately in 0.1M ethanol and mixed
them with dyes of same plants extracted in 0.1M HCl.7
In another research by Udeani, hot and cold water extraction methods were used to extract
Lawsonia inermis dye. In the hot water extraction method, the water was left at boiling point
for 45 minutes and extraction was left overnight before filtration. On the other hand, the cold
19
water extraction method was left for 2 days before filtration. The result showed that the hot
water extraction produced a deep red-orange dye, deeper than that of the cold water
extraction.26
2.9 TiO2 Paste Preparation
The preparation of TiO2 paste plays an important role in the efficient operation of the DSSC.
The paste must be uniform because this affects the adsorption of the dye to the surface of the
paste. Additionally, the paste needs to be able to stick to the surface of the conducting glass
so that it will not peel off or crack during annealing. Some preparation methods used by
various researchers are simple while others involve a lot of procedures. For example Sofyan
et al prepared TiO2 paste used in their research by mixing 50mg of TiO2 powder with 50mg
of polyethylene glycol. They grinded the mixture for 30 minutes so that a homogenous
mixture was formed.27
In another research, Desalegn et al prepared TiO2 paste by weighing 3g of the powder into a
mortar and adding 1mL of distilled water containing 0.1mL acetic acid into the mortar. After
rigorous shearing, they diluted by adding 4mL of water slowly while still grinding. This was
followed by the addition of 0.05mL of Triton X-100 detergent to facilitate spreading of the
colloid when pasted on the conducting glass.7 Other methods that are more rigorous exist,
however the common goal of all these methods is to prepare a homogenous paste that is able
to stick to the surface of the conducting glass without cracking when annealed at high
temperature.

20
Chapter 3: Methodology
3.1 Overview
This chapter discusses all the experimental procedures used throughout this research. It
includes the methods of extraction used to extract the natural dyes, and some of the
characterization methods used to characterize the plant extracts. It also discusses every
procedure involved in assembling the DSSC.
3.2 Materials
Beaker, Measuring Cylinder, Volumetric Flask, Stirring rod, Spatula, Foil Paper, Closed top
carton, Oven, Weighing machine, Muslin cloth, Filter Paper, Funnel, Masking tape, Ruler,
Hot plate, Ceramic mortar and pestle, Digital Multimeter, Alligator clips, pH meter, Ice bath,
Metal Clip, Fluorine doped tin oxide (FTO) conducting glass, HB pencil, Pasteur pipette.
3.3 Chemicals
96% Ethanol, NaOH pellets, n-hexane, 1M HCl, Polyethylene glycol (PEG), Titanium
dioxide (TiO2), Distilled Water, Aniline, Potassium dichromate, Iodine crystals, Potassium
Iodate, Dimethyl sulfoxide (DMSO), 1% Ammonia solution, Ferric chloride, glacial acetic
acid, sulfuric acid, Dragendoff’s reagent (potassium bismuth iodide solution).

21
3.4 Preparation of Natural Dye Sensitizers
Natural dyes were extracted from three different plant extracts: Mangifera indica leaves
(Mango), Terminalia catappa leaves (Tropical Almond), and Lawsonia inermis leaves
(Henna, locally known as lalle in Northern Nigeria). Mango leaves and tropical almond
leaves were gotten from the American University of Nigeria surroundings while Henna
powder was purchased from a local market in Yola, Adamawa State. After getting the leaves,
they were washed to remove dust. Afterwards, they were dried at room temperature for some
days and then grinded to fine powder. Ethanolic extraction method was used to extract dyes
from the mango and tropical almond leaves while alkaline extraction method was used for the
extraction of Henna dye. All the extracted dyes were stored in a fridge at 4ºC to avoid
decomposition.
Figure 3: Mango leaves
Figure 5: Lawsone powder
3.5 Alkaline Extraction of Henna Dye
A 0.3M NaOH solution was prepared by dissolving 3.08g of sodium hydroxide pellets in
250mL of distilled water. Approximately 25.g of Henna extract was measured into a beaker
and the 250mL of NaOH was poured in the beaker making the ratio of Henna extract to
NaOH 1:10 (g/mL). The mixture was stirred with a stirring rod and kept in a carton away
Figure 4: Tropical almond leaves
Figure 3: Left to right: Mango; Tropical almond; Henna powder.
22
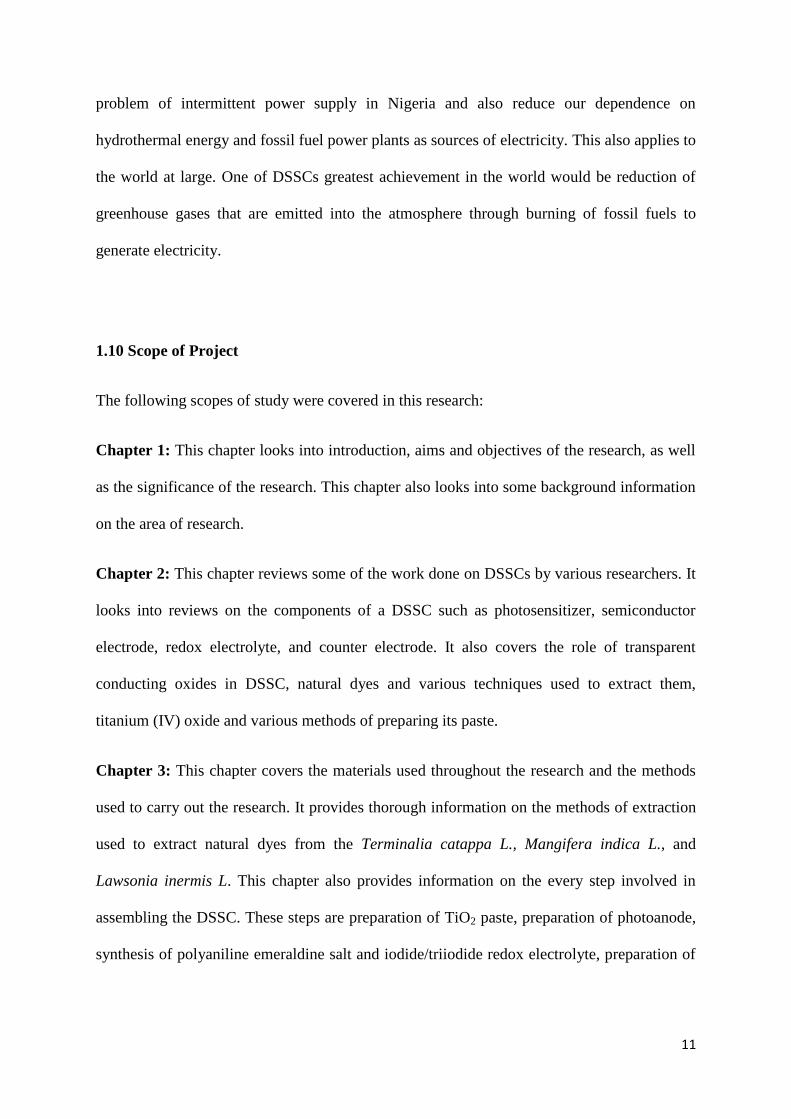
from light for 24 hours. After 24 hours, the extract was sieved using a muslin cloth to obtain a
reddish brown dye. The color of the dye is an indication of the presence of Lawsone (2-
hydroxy-1,4-naphthoquinone), also known as hennotanic acid. The pH of the dye was 9.8.
Using HCl, the dye pH was neutralized to 7.5 to prevent reaction of the base with the
hennotanic acid in the dye extract.
Figure 4: Structure of Lawsone pigment in Henna extract
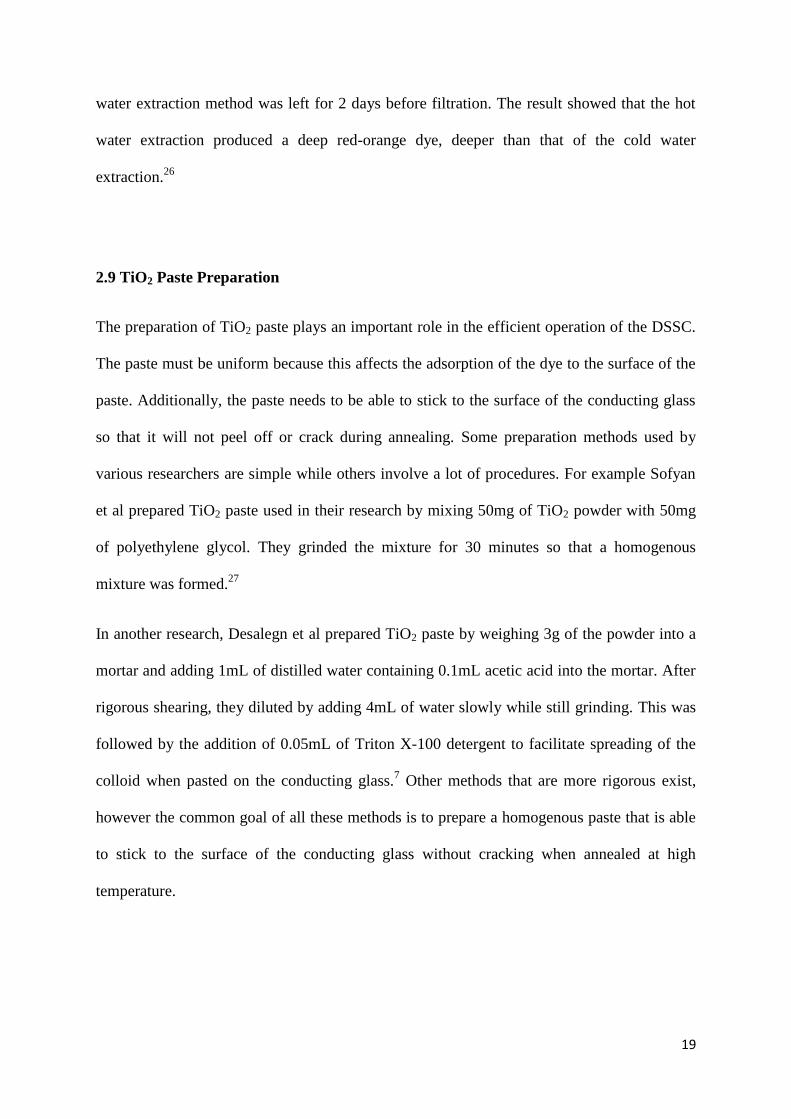
3.6 Ethanolic Extraction of Mango and Tropical Almond Dyes
For this method, 96% ethanol was used. Also, 25g (≈ 25.01g of each extract) of each extract
was weighed into a beaker and 250mL of ethanol was added to each beaker. The mixtures
were stirred with a stirring rod and then kept in a carton away from light to prevent
decomposition. The mixtures were left for 48 hours after which they were sieved with a
muslin cloth. The filtrate was further filtered using a Whatman filter paper and a funnel. The
dyes gotten after the extraction were dark green.13
Figure 5: Plant extract
23
3.7 Phytochemical Tests for the Leaf Extracts
Phytochemical test was carried out to check the presence of alkaloids, flavonoids, tannins,
phenolic compounds, cardiac glycosides, and saponnins in the plant extracts using the
procedures described by Tiwari et al.28
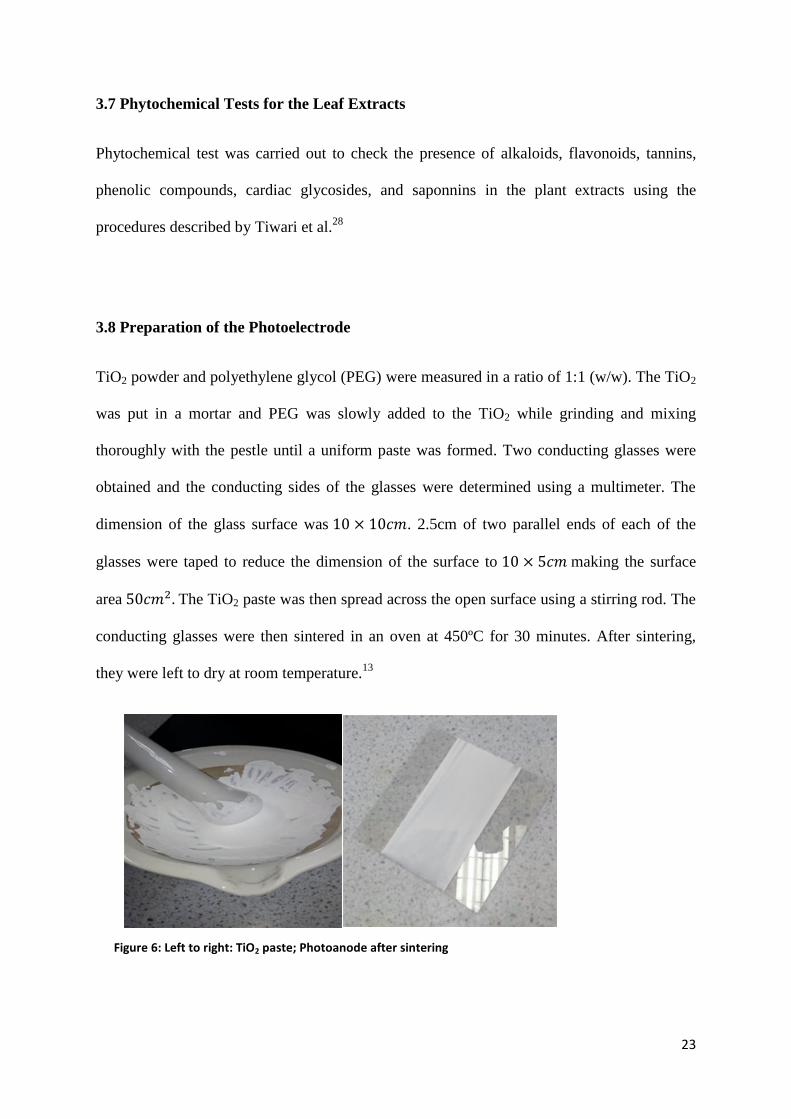
3.8 Preparation of the Photoelectrode
TiO2 powder and polyethylene glycol (PEG) were measured in a ratio of 1:1 (w/w). The TiO2
was put in a mortar and PEG was slowly added to the TiO2 while grinding and mixing
thoroughly with the pestle until a uniform paste was formed. Two conducting glasses were
obtained and the conducting sides of the glasses were determined using a multimeter. The
dimension of the glass surface was . 2.5cm of two parallel ends of each of the
glasses were taped to reduce the dimension of the surface to making the surface
area The TiO2 paste was then spread across the open surface using a stirring rod. The
conducting glasses were then sintered in an oven at 450ºC for 30 minutes. After sintering,
they were left to dry at room temperature.13
Figure 6: Left to right: TiO2 paste; Photoanode after sintering

24
3.9 Synthesis of Polyaniline (PANI)
This reaction generates toxic fumes; hence the entire experiment was carried out in a fume
hood. 200mL of 1M HCl was measured into a beaker and then placed in an ice bath. 20mL of
aniline was poured into the beaker. This was immediately followed by the addition of 1.86g
of potassium dichromate. The mixture was stirred thoroughly for 30 minutes. The resulting
mixture was then filtered using a funnel and a Whatman filter paper. The filtrate was left to
dry up while the residue was discarded safely. The yield was weighed and found to be
5.495g. The polyaniline powder was then dissolved in dimethyl sulfoxide (DMSO).
3.10 Preparation of Redox Electrolyte
Iodide/triiodide redox electrolyte was prepared by dissolving 1g of iodine crystals and 1g of
potassium iodate in 15mL of distilled water. It was covered with a foil paper to prevent
evaporation because it is volatile.
Figure 7: Synthesis of PANI

25
Figure 8: Iodide/triiodide redox electrolyte
3.11 Preparation of Counter Electrode
A FTO conducting glass was shaded with an HB pencil so as to leave graphite on
the glass surface. The polyaniline dissolved in DMSO was then applied to the surface of the
glass and spread across the glass surface using a stirring rod.
3.12 Assembling of DSSC
The sintered photoanode was dipped in the dyes for 2 hours on each trial. Afterwards, the two
electrodes were put together with the conducting sides each containing the photoanode and
the counter electrode facing each other. Some space was left one end of each electrode for
Figure 9: PANI/Graphite counter electrode

26
connection purpose. Using a Pasteur pipette, the redox electrolyte was applied to the setup
from the ends with space. Afterwards, the electrodes were held together using a metal clip. It
was ensured that the metal clip was not touching any conducting part of the electrodes.
Alligator clips were used to connect the DSSC setup to the digital multimeter so as to take
readings.
3.13 Testing the DSSC
The assembled DSSC was tested under a projector light and sunlight. While testing the
DSSC, it was ensured that light was incident on the side of the photoanode from which the
sensitized TiO2 could be seen. Voltage, current and resistance readings were taken using the
digital multimeter.
Figure 11: DSSC being tested under sunlight
Figure 10: Left to right: Dye adsorbed on photoanode; Assembled DSSC

27
Chapter 4: Results and Discussion
4.1 Overview
In this chapter, the results gotten from the characterization and of the plant extracts are
discussed. Some of these results include those gotten from the UV/IR/GCMS analysis of the
dyes, and phytochemical tests as well. This chapter also discusses the results obtained from
the testing of the DSSCs assembled with each plant extract.
4.2 UV/Vis Analysis of the Extracted Dyes
Figures 12 shows the UV-Vis absorption spectra of Lawsonia inermis (Henna). It was
observed that the henna extract absorbs across a wide range of wavelengths in the visible
region of the spectrum, notably between 400 – 500 nm. Figures 13 and 24 show the UV-Vis
absorption spectra of Mangifera indica (mango) and Terminalia catappa (tropical almond)
extracts according to literature. It can be observed that the maximum absorbance for the
mango extract occurred at about 380nm29
while the tropical almond extract absorbed at
269nm and 372nm.30
Lawsone has an extinction coefficient of 16000 ± 500 at 280nm31
and chlorophyll
has an extinction coefficient of 82 – 96 or 73,300 – 85,800 32
Lawsone is the major component of the henna extract’s reddish brown pigment while
chlorophyll is the major component of the green pigment of the mango and tropical almond
extracts.

28
Figure 12: UV-Vis absorption spectra of Henna Dye (Unpublished Data: Wan Jahng, 2018)
Figure 13: UV-Vis absorption spectra of Mangifera
indica extract.29
4.3 IR Analysis of the Extracted Dyes
The spectrogram gotten from the analysis of the dyes indicated the presence of ─OH and
C=C functional groups in the dyes. These functional groups play important roles in the
operation of the DSSC. The ─OH group is important for chelating with the TiO2 coated on
the conducting glass surface. On the other hand, electron excitation takes place at the π bonds
in the C=C group. Some other functional groups present in some of the dyes are ─C=O,
─C=N─, and ─C─O─ functional groups.
Figure 14: UV-Vis absorption spectra of Terminalia
catappa extract.30

29
Figure 15: Mangifera indica dye IR spectrum
Figure 16: Terminalia catappa dye IR spectrum
Figure 17: Lawsonia inermis dye IR spectrum (Unpublished data: Wan Jahng, 2018)
1000200030004000
Wavenumbers
-20
0
20
40
60
80
Per
cen
t T
ran
smit
tan
ce
11
64
.99
14
51
.32
15
14
.08
16
13
.87
17
03
.14
34
53
.79
1000200030004000
Wavenumbers
-20
0
20
40
60
80
Per
cen
t T
ran
smit
tan
ce
12
07
.99
13
38
.88
14
47
.14
15
24
.99
16
12
.58
23
68
.76
34
37
.53
─OH C=C
─OH C=C
C=C
C─O
30
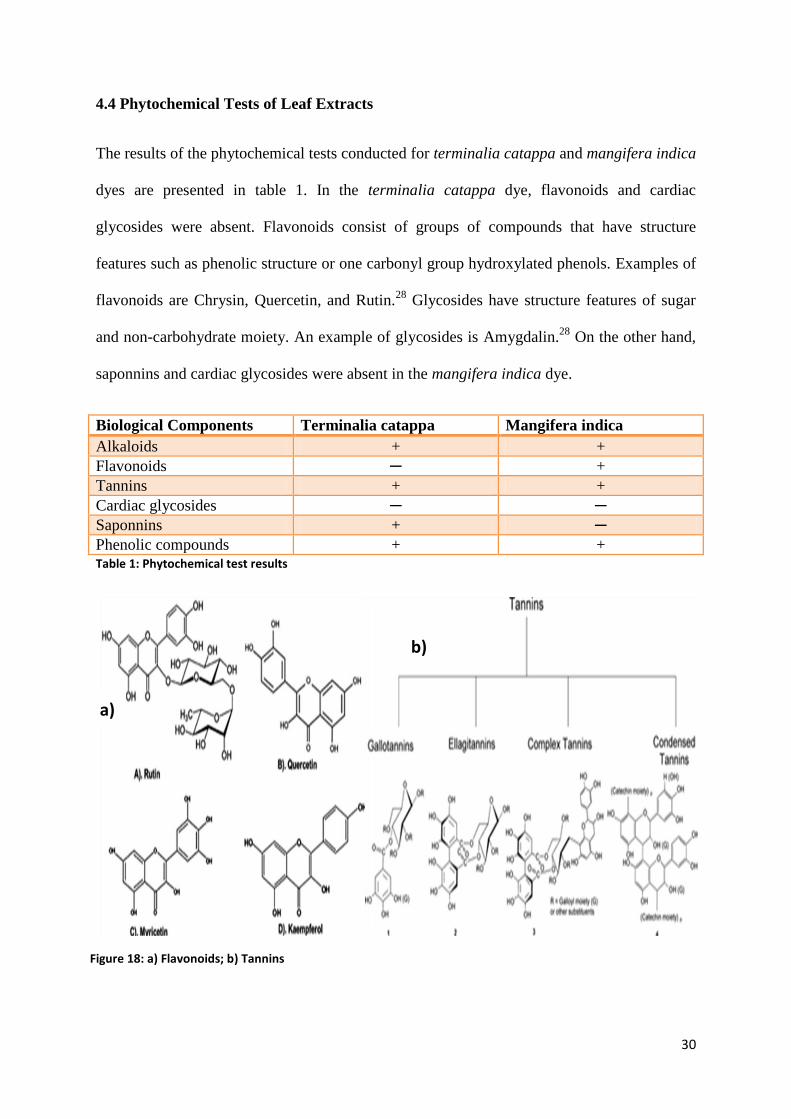
4.4 Phytochemical Tests of Leaf Extracts
The results of the phytochemical tests conducted for terminalia catappa and mangifera indica
dyes are presented in table 1. In the terminalia catappa dye, flavonoids and cardiac
glycosides were absent. Flavonoids consist of groups of compounds that have structure
features such as phenolic structure or one carbonyl group hydroxylated phenols. Examples of
flavonoids are Chrysin, Quercetin, and Rutin.28
Glycosides have structure features of sugar
and non-carbohydrate moiety. An example of glycosides is Amygdalin.28
On the other hand,
saponnins and cardiac glycosides were absent in the mangifera indica dye.
Biological Components Terminalia catappa Mangifera indica
Alkaloids + +
Flavonoids ─ +
Tannins + +
Cardiac glycosides ─ ─
Saponnins + ─
Phenolic compounds + + Table 1: Phytochemical test results
Figure 18: a) Flavonoids; b) Tannins
a)
b)

31
4.5 GCMS Analysis of Lawsonia inermis
The GCMS analysis of the Lawsonia inermis was carried out using n-hexane as the solvent.
The results gotten from the analysis showed the presence of many components; however,
only γ-tocopherol was confirmed. Figure 19 shows the structure of γ-tocopherol and its mass
spectrum. γ-tocopherol is an organic compound that belongs to the family of vitamin E
compounds.33
It has a molecular weight of 430g/mol. The presence of ─OH and C=C
functional groups in the structure confirms the results of the IR analysis. The presence of this
compound in the dye makes electron excitation possible because of the presence of π
electrons in the structure.
Figure 19: Structure and mass spectra of γ-tocopherol (Unpublished data: Wan Jahng 2018)

32
4.6 Conductivity of PANI
The conductivity of PANI is a very important factor in the operation of the DSSC. It is
important because the more the flow of electrons occurs with ease at the counter electrode,
the faster the rate at which the redox electrolyte is regenerated. Slow regeneration of the
redox electrolyte reduces the stability of the DSSC through a step by step process. When the
dye is in the excited state, the redox electrolyte is responsible for regenerating the dye to its
ground state. Hence if the redox electrolyte is not regenerated fast enough, the dye will
likewise not be regenerated quickly thereby making the cell inefficient in generating
electricity. This highlights the need for the PANI to be highly conductive. The conductivity
of the PANI was calculated using the following formulas and data.
(
)
Trials Resistance Resistivity ( Conductivity (
1 4.9 49 204
2 4.5 45 222
3 3.7 37 270
4 3.9 39 256 Table 2: Polyaniline table of values
Using the information in the table 2, the average conductivity of the PANI was calculated
as . The relatively high conductivity can be attributed to the use of hydrochloric
acid as a dopant during the synthesis.

33
4.7 Electricity under Projector Light
After assembling the DSSC for each of the dyes, they were first tested using a projector light
of light intensity 5000 lux. The voltage and current reading of each DSSC was noted several
times at intervals using a digital multimeter. The recorded values were used to calculate the
resistance, current density, and power output of each DSSC using the formulas below.
√∑
Voltage
Current
Resistance
Current Density
Power
16.0 4.0 4.0
15.0 5.0 3.0
14.0 3.0 4.7
14.0 3.0 4.7
14.0 3.0 4.7 Table 3: Terminalia catappa DSSC under projector light
The voltage and current readings of the Terminalia catappa DSSC under a projector light
were in units of mV and μA. The current density and power output of the solar cell were
calculated in units of and mW respectively. The standard deviations of the current
and voltage readings were calculated using the data contained in table 3. The average values
and standard deviations can be found in table 4.
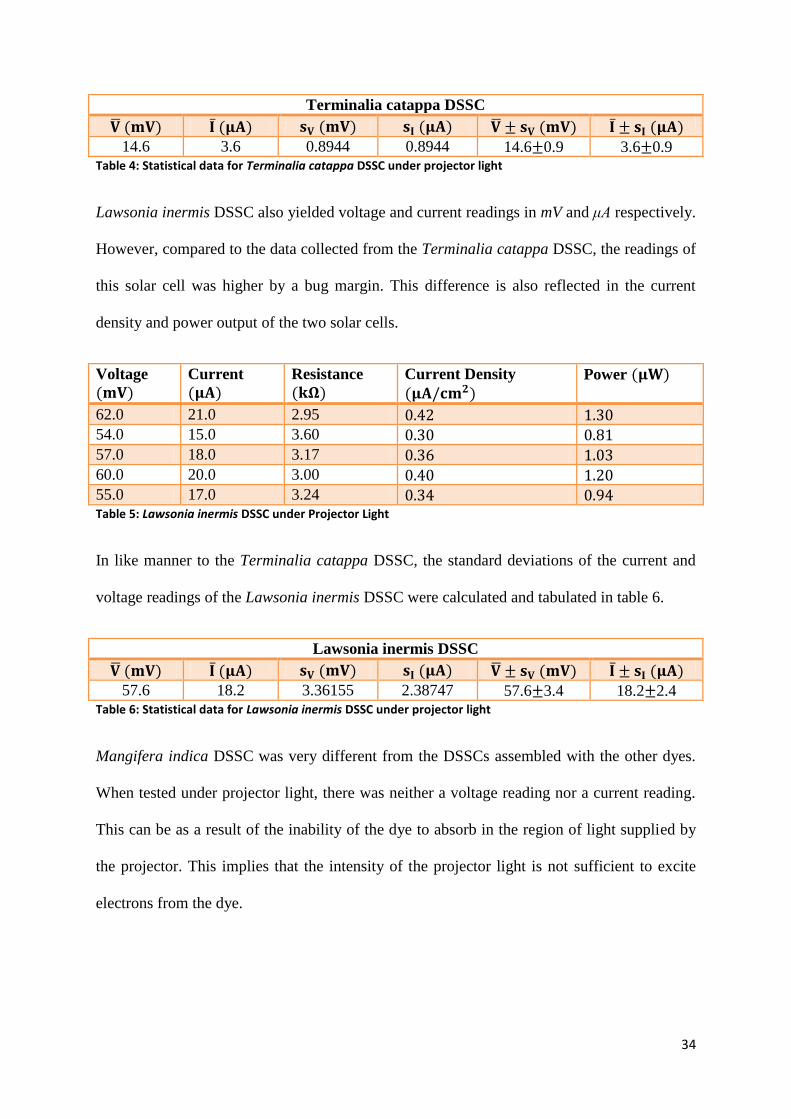
34
Terminalia catappa DSSC
14.6 3.6 0.8944 0.8944 14.6 0.9 3.6 0.9
Table 4: Statistical data for Terminalia catappa DSSC under projector light
Lawsonia inermis DSSC also yielded voltage and current readings in mV and μA respectively.
However, compared to the data collected from the Terminalia catappa DSSC, the readings of
this solar cell was higher by a bug margin. This difference is also reflected in the current
density and power output of the two solar cells.
Voltage
Current
Resistance
Current Density
Power
62.0 21.0 2.95
54.0 15.0 3.60
57.0 18.0 3.17
60.0 20.0 3.00
55.0 17.0 3.24 Table 5: Lawsonia inermis DSSC under Projector Light
In like manner to the Terminalia catappa DSSC, the standard deviations of the current and
voltage readings of the Lawsonia inermis DSSC were calculated and tabulated in table 6.
Lawsonia inermis DSSC
57.6 18.2 3.36155 2.38747 57.6 3.4 18.2 2.4
Table 6: Statistical data for Lawsonia inermis DSSC under projector light
Mangifera indica DSSC was very different from the DSSCs assembled with the other dyes.
When tested under projector light, there was neither a voltage reading nor a current reading.
This can be as a result of the inability of the dye to absorb in the region of light supplied by
the projector. This implies that the intensity of the projector light is not sufficient to excite
electrons from the dye.
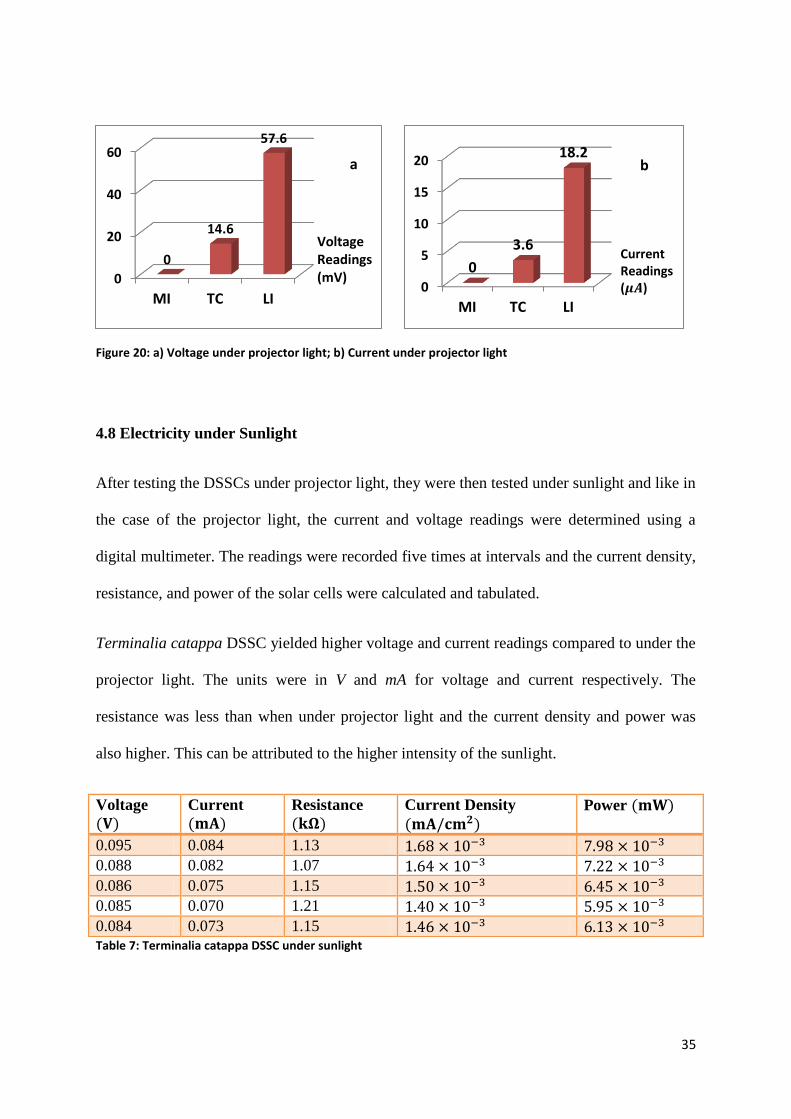
35
Figure 20: a) Voltage under projector light; b) Current under projector light
4.8 Electricity under Sunlight
After testing the DSSCs under projector light, they were then tested under sunlight and like in
the case of the projector light, the current and voltage readings were determined using a
digital multimeter. The readings were recorded five times at intervals and the current density,
resistance, and power of the solar cells were calculated and tabulated.
Terminalia catappa DSSC yielded higher voltage and current readings compared to under the
projector light. The units were in V and mA for voltage and current respectively. The
resistance was less than when under projector light and the current density and power was
also higher. This can be attributed to the higher intensity of the sunlight.
Voltage
Current
Resistance
Current Density
Power
0.095 0.084 1.13
0.088 0.082 1.07
0.086 0.075 1.15
0.085 0.070 1.21
0.084 0.073 1.15 Table 7: Terminalia catappa DSSC under sunlight
0
20
40
60
MI TC LI
0
14.6
57.6
Voltage Readings (mV)
a
0
5
10
15
20
MI TC LI
0
3.6
18.2
Current Readings (𝝁𝑨)
b
36
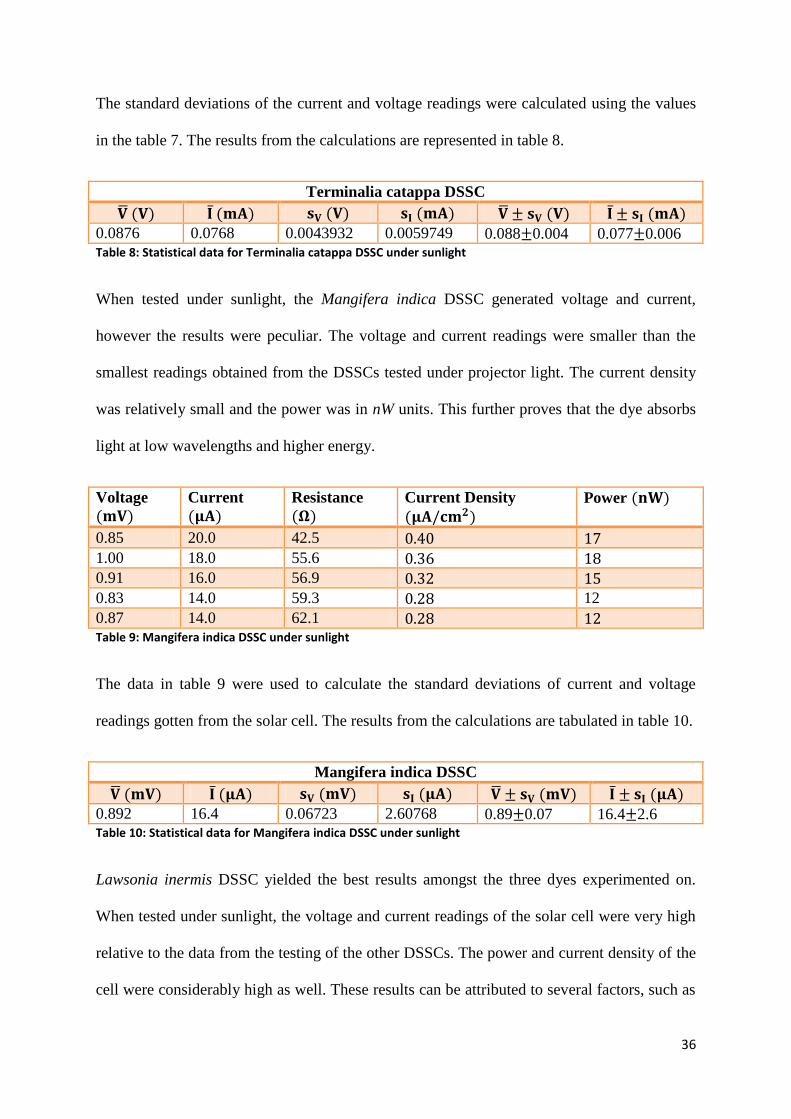
The standard deviations of the current and voltage readings were calculated using the values
in the table 7. The results from the calculations are represented in table 8.
Terminalia catappa DSSC
0.0876 0.0768 0.0043932 0.0059749 0.088 0.004 0.077 0.006 Table 8: Statistical data for Terminalia catappa DSSC under sunlight
When tested under sunlight, the Mangifera indica DSSC generated voltage and current,
however the results were peculiar. The voltage and current readings were smaller than the
smallest readings obtained from the DSSCs tested under projector light. The current density
was relatively small and the power was in nW units. This further proves that the dye absorbs
light at low wavelengths and higher energy.
Voltage
Current
Resistance
Current Density
Power
0.85 20.0 42.5
1.00 18.0 55.6
0.91 16.0 56.9
0.83 14.0 59.3 12
0.87 14.0 62.1 Table 9: Mangifera indica DSSC under sunlight
The data in table 9 were used to calculate the standard deviations of current and voltage
readings gotten from the solar cell. The results from the calculations are tabulated in table 10.
Mangifera indica DSSC
0.892 16.4 0.06723 2.60768 0.89 0.07 16.4 2.6 Table 10: Statistical data for Mangifera indica DSSC under sunlight
Lawsonia inermis DSSC yielded the best results amongst the three dyes experimented on.
When tested under sunlight, the voltage and current readings of the solar cell were very high
relative to the data from the testing of the other DSSCs. The power and current density of the
cell were considerably high as well. These results can be attributed to several factors, such as

37
the adsorption of the dye to the TiO2 surface, the absorption of the dye across longer
wavelengths, and the presence of different components in the dyes.
Voltage
Current
Resistance
Current Density
Power
0.191 0.309 0.62
0.189 0.278 0.68
0.185 0.272 0.68
0.188 0.275 0.68
0.189 0.275 0.69 Table 11: Lawsonia inermis DSSC under sunlight
The average values and standard deviations of the current and voltage readings were
calculated and tabulated in table 12.
Lawsonia inermis DSSC
0.1884 0.2818 0.00219089 0.0153525 0.188 0.002 0.282 0.015 Table 12: Statistical data for Lawsonia inermis DSSC under sunlight
Figure 21: a) Voltage under sunlight; b) Current under sunlight
The results gotten from this research suggests that any chromophore can be used for DSSC.
However, each chromophore will give different results, with some chromophores better than
the others, as can be seen in figure 21. The very low voltage gotten from the Magnifera
indica DSSC could be due to many factors.
0
0.05
0.1
0.15
0.2
MI TC LI
0.00089
0.088
0.188
Voltage Reading (V)
a
0
0.05
0.1
0.15
0.2
0.25
0.3
MI TC LI
0.0164
0.077
0.282
Current Reading (mA)
b

38
Firstly, the presence of carbonyl and hydroxyl functional groups in the structure of the dye
components is very important for chelating with the semiconductor material. In the absence
of these functional groups, the efficiency of the cell reduces.34
Also, there is the possibility
that the dye does not absorb light at high wavelengths. This implies that light of high
intensity and short wavelength is required before electrons can be excited from the dye.
Secondly, the thickness of the TiO2 layer may have affected the cell. Ideally, the thickness of
the semiconductor material should not be more than 20μm. This is important for the diffusion
of the photoelectrons.35
Furthermore, the stability of the redox electrolyte also plays a vital role in the efficiency of
the DSSC. Iodide/triiodide is very volatile and unstable. This can affect the speed with which
regeneration occurs in the DSSC.36
Lastly, the conductivity of the polymer counter electrode
is also an important factor that can affect the efficiency of the DSSC. Polyaniline can lose its
conductivity as a result of impurities such as the presence of residual aniline in the polymer.
If the polymer loses its conductivity while the cell is operating, the reduction phase of the
redox electrolyte might be slow or may not take place in the worst case scenario.
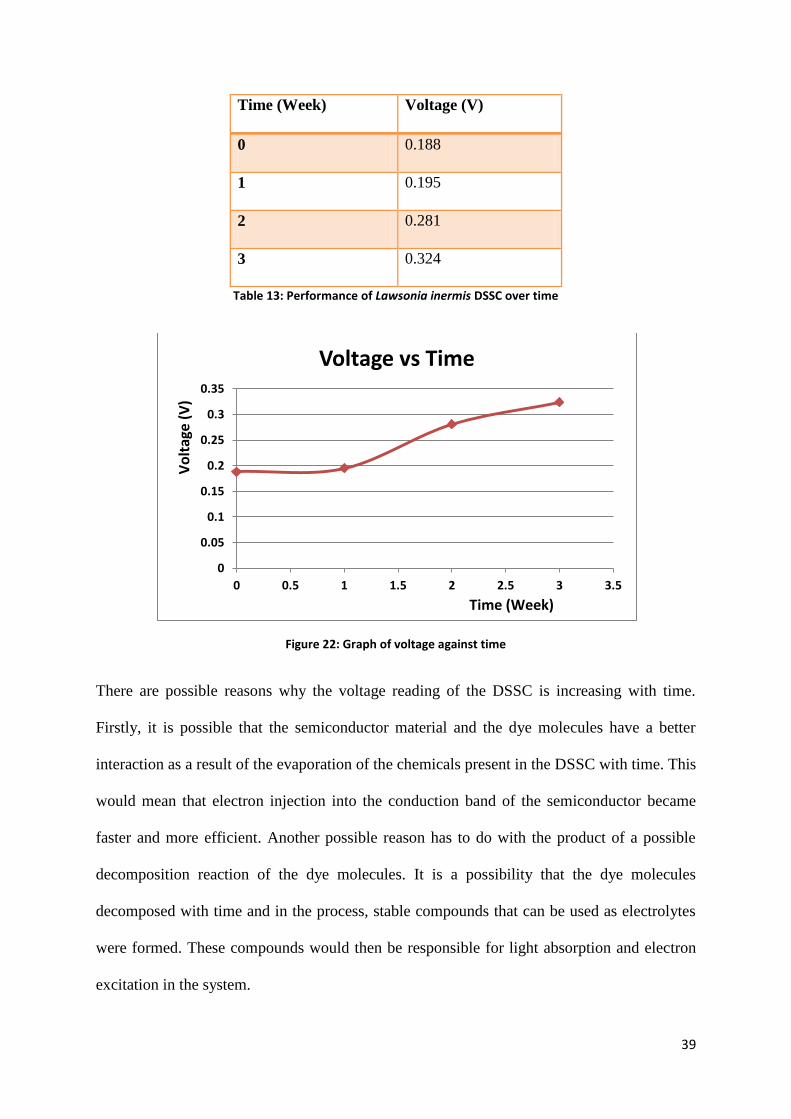
4.9 Study of Lawsonia inermis DSSC over Time
The performance of the DSSC constructed using Lawsonia inermis dye was studied over time
to determine how time affects its performance. The results are presented in table 13. It was
discovered that the voltage increased with time.
39
Time (Week) Voltage (V)
0 0.188
1 0.195
2 0.281
3 0.324
Table 13: Performance of Lawsonia inermis DSSC over time
Figure 22: Graph of voltage against time
There are possible reasons why the voltage reading of the DSSC is increasing with time.
Firstly, it is possible that the semiconductor material and the dye molecules have a better
interaction as a result of the evaporation of the chemicals present in the DSSC with time. This
would mean that electron injection into the conduction band of the semiconductor became
faster and more efficient. Another possible reason has to do with the product of a possible
decomposition reaction of the dye molecules. It is a possibility that the dye molecules
decomposed with time and in the process, stable compounds that can be used as electrolytes
were formed. These compounds would then be responsible for light absorption and electron
excitation in the system.
0
0.05
0.1
0.15
0.2
0.25
0.3
0.35
0 0.5 1 1.5 2 2.5 3 3.5
Voltage vs Time
Vo
ltag
e (V
)
Time (Week)

40
Chapter 5: Conclusion
The goal of this research was to synthesize dye sensitized solar cell using natural dyes
extracted from mangifera indica (mango), terminalia catappa (tropical almond), and
Lawsonia inermis (Henna) and compare the of each dye. Mango and tropical almond dyes
were extracted using ethanolic extraction while Henna dye was extracted using alkaline
extraction method. TiO2 nanoparticles were used as the semiconductor material at the
photoanode while polyaniline emeraldine salt coupled with graphite served as the counter
electrode.
The results gotten from this research showed that all plants are capable of being used in
making dye sensitized solar cells, however the results may differ. This is evident in the fact
that while DSSCs made with tropical almond and henna dyes produced electricity when
tested under projector light, that of mango dye did not generate electricity. Additionally,
under sunlight, the quantity of electricity generated by the mango dye DSSC was
significantly less than those of henna and tropical almond. Overall, henna DSSC produced
the highest amount of voltage and current under the same conditions as the other dyes. Its
voltage also increased with time. This may be as a result of better interaction between the dye
molecules and the TiO2 particles with time or the formation of stable electrolytes following
the decomposition of the dye molecules.
5.1 Suggestion for Future Research
For future research, it is suggested that the effect of time on the performance of DSSCs
should be studied using more DSSC samples of different dyes. This will help to confirm the

41
reproducibility of the results reported in this research. Additionally, it will open doors to
better ideas on how best to explain what is responsible for the change.
42
References
1. Godfrey, K.; Patrick, G. D.; Vincent, O. N. International Journal of Energy Research,
2014, 2014, 1-19
2. Helmut, H.; Oda, B.; Mycle, S.; Antony, F. Estudos Avancados 21, 2007, 59, 253-
257.
3. Liao, S. K.; Chang, Y. H.; Wu, C. T.; Lai, Y. R.; Chen, W. Y. Journal of CO2
Utilization. 2017, 21, 513-520
4. Haehnlein, S.; Bayer, P.; Blum, P. Renewable and Sustainable Energy Reviews, 2010,
14, 2611–2625.
5. Solangi, K. H.; Islam, M. R.; Saidur, R.; Rahim, N. A.; Fayaz, H. Renewable and
Sustainable Energy Reviews, 2011, 15, 2149–2163.
6. George, W. C.; Nathan, S. L. American Institute of Physics, 2007, 4,
7. Desalegn, J. G.; Sisay, T. A.; Teketel, Y. A. Journal of the Brazilian Chemical
Society, 2015, 26, 92-101
8. Smestad, G.; Carlo, B.; Roberto, A. Solar Energy Materials & Solar Cells, 1994, 32,
259-272
9. Adams, W. G.; Day, R. E. Proceedings of the Royal Society of London, 1877, 25, 113-
117.
10. Grondahl, L. O. Physical Review Materials, 1933, 5, 141-177.
11. Loferski, J. J. Progress in Photovoltaics: Research and Applications, 1993, 1, 67-78
12. Monishka, R. N. Review: Renewable and Sustainable Energy Reviews, 2012, 16, 208-
215.
13. Monzir, S. A.; Mahmoud, B. A.; Taher, M. E.; Sofyan, A. T. International Journal of
Renewable Energy Research, 2015, 5, 1-5

43
14. Qidong, T.; Bolei, C.; Feng, G.; Sheng, X.; Hao, H.; Bobby, S.; Xing-Zhong, Z.
Journal of the American Chemical Society, 2011, 5, 3795-3799
15. Khalil, E. J.; Shawqi, A.; Awatif, M. H. Journal of Nanotechnology, 2011, 2012, 1-7
16. Qinghua, L.; Jihuai, W.; Qunwei, T.; Zhang, L.; Pinjiang, L.; Jianming, L.; Leqing, F.
Electrochemistry Communications, 2008, 10, 1299-1302.
17. Jeng-Yu, L.; Wei-Yan, W.; Yi-Tang, L. Surface Coatings Technology, 2013, 231,
171-175
18. Abodunrin, T. J.; Obafemi, O.; Boyo, A. O.; Adebayo, T.; Jimoh, R. Advances in
Materials Physics and Chemistry, 2015, 5, 205-213
19. Nkem, A. U. International Journal of Chemical and Molecular Engineering,. 2015, 9,
1459-1466
20. Venkatalakshmi, P.; Vadivel, V.; Brindha, P. International Journal of Research in
Ayurveda and Pharmacy, 2016, 7, 130-137
21. Mohsen, L.; Nahideh, S.; Parisa, Z. Solar Energy Materials & Solar Cells, 2015, 137,
274-279
22. Vibha, S.; Ajay, S.; Debnath, A. K.; Muthe, K.P.; Gadkari, S. C.; Mahajan, A.; Tanvi;
Prakash, O. Solar Energy Materials & Solar Cells, 2017, 170, 127-136
23. Jayathilake, D. S. Y.; Nirmal, P. T. A. Journal of Material and Chemical
Engineering, 2018, 1, 1-7
24. Rina, P.; Chang, H. W.; Xie, L.; Lim, J. W.; Kim, K. K.; Hwang, D. K.; Won, K. C.
Solar Energy Materials & Solar Cells, 2015, 134, 5-14
25. Bahramian, A.; Vashaee, D. Solar Energy Materials & Solar Cells, 2015, 143, 284-
295
26. Udeani, N. A. International Journal of Chemical and Molecular Engineering. 2015,
9, 1459-1466

44
27. Sofyan, A. T.; Taher, M. E.; Hatem, S. E.; Monzir, S. A. International Journal of
Materials Science and Applications. 2013, 2, 37-42
28. Tiwari, P.; Kumar, B.; Kaur, M.; Kaur, G.; Kaur, H. Internationale Pharmaceutica
Sciencia. 2011, 1, 98-106.
29. Jonathan, E.; Onimisi, M. Y.; Eli, D.; Abdu, S. G.; Abdulsalam, M. S. Journal of
Scientific Research & Reports. 2016, 10, 1-5
30. Vadwala, Y.; Kola, N. International Journal of Research – Granthaalayah. 2017, 5,
125-137
31. Brahmia, O.; Claire, R. Photochemical & Photobiological Sciences. 2005, 4, 454-458
32. Tajudeen, H. K.; Onuigbo, I. O; Isaac, S. O. et al. International Journal of Scientific
& Engineering Research. 2017, 8, 631-635
33. Wagner, K-H.; Kamal-Eldin, A.; Elmadfa, I. Annals of Nutrition & Metabolism. 2004,
48, 169-188
34. Tennakone, K.; Kumara, G.; Kottegota, I.; Wijayantha, K. Semiconductor Science and
Technology, 1997, 12, 128
35. Noack, V.; Weller, H.; Eychmüller, A. Journal of Physical Chemistry B, 2002, 106,
8514–8523.
36. Matsumoto, M.; Wada, Y.; Kitamura T. et al. Bulletin of the Chemical Society of
Japan, 2001, 74, 387–393.