Fabric defect detection using Gabor filters and defect classification based on LBP and Tamura method
11
This article was downloaded by: [Umeå University Library] On: 26 September 2013, At: 00:21 Publisher: Taylor & Francis Informa Ltd Registered in England and Wales Registered Number: 1072954 Registered office: Mortimer House, 37-41 Mortimer Street, London W1T 3JH, UK Journal of The Textile Institute Publication details, including instructions for authors and subscription information: http://www.tandfonline.com/loi/tjti20 Fabric defect detection using Gabor filters and defect classification based on LBP and Tamura method Junfeng Jing a b , Huanhuan Zhang b , Jing Wang b , Pengfei Li b & Jianyuan Jia a a School of Mechano-Electronic Engineering, Xidian University, Xi’an, Shaanxi, 710071, China b School of Electronic and Information, Xi’an Polytechnic University, Xi’an, Shaanxi, 710048, China Published online: 27 Jun 2012. To cite this article: Junfeng Jing , Huanhuan Zhang , Jing Wang , Pengfei Li & Jianyuan Jia (2013) Fabric defect detection using Gabor filters and defect classification based on LBP and Tamura method, Journal of The Textile Institute, 104:1, 18-27, DOI: 10.1080/00405000.2012.692940 To link to this article: http://dx.doi.org/10.1080/00405000.2012.692940 PLEASE SCROLL DOWN FOR ARTICLE Taylor & Francis makes every effort to ensure the accuracy of all the information (the “Content”) contained in the publications on our platform. However, Taylor & Francis, our agents, and our licensors make no representations or warranties whatsoever as to the accuracy, completeness, or suitability for any purpose of the Content. Any opinions and views expressed in this publication are the opinions and views of the authors, and are not the views of or endorsed by Taylor & Francis. The accuracy of the Content should not be relied upon and should be independently verified with primary sources of information. Taylor and Francis shall not be liable for any losses, actions, claims, proceedings, demands, costs, expenses, damages, and other liabilities whatsoever or howsoever caused arising directly or indirectly in connection with, in relation to or arising out of the use of the Content. This article may be used for research, teaching, and private study purposes. Any substantial or systematic reproduction, redistribution, reselling, loan, sub-licensing, systematic supply, or distribution in any form to anyone is expressly forbidden. Terms & Conditions of access and use can be found at http:// www.tandfonline.com/page/terms-and-conditions
Transcript of Fabric defect detection using Gabor filters and defect classification based on LBP and Tamura method
This article was downloaded by: [Umeå University Library]On: 26 September 2013, At: 00:21Publisher: Taylor & FrancisInforma Ltd Registered in England and Wales Registered Number: 1072954 Registered office: Mortimer House,37-41 Mortimer Street, London W1T 3JH, UK
Journal of The Textile InstitutePublication details, including instructions for authors and subscription information:http://www.tandfonline.com/loi/tjti20
Fabric defect detection using Gabor filters and defectclassification based on LBP and Tamura methodJunfeng Jing a b , Huanhuan Zhang b , Jing Wang b , Pengfei Li b & Jianyuan Jia aa School of Mechano-Electronic Engineering, Xidian University, Xi’an, Shaanxi, 710071, Chinab School of Electronic and Information, Xi’an Polytechnic University, Xi’an, Shaanxi, 710048,ChinaPublished online: 27 Jun 2012.
To cite this article: Junfeng Jing , Huanhuan Zhang , Jing Wang , Pengfei Li & Jianyuan Jia (2013) Fabric defect detectionusing Gabor filters and defect classification based on LBP and Tamura method, Journal of The Textile Institute, 104:1, 18-27,DOI: 10.1080/00405000.2012.692940
To link to this article: http://dx.doi.org/10.1080/00405000.2012.692940
PLEASE SCROLL DOWN FOR ARTICLE
Taylor & Francis makes every effort to ensure the accuracy of all the information (the “Content”) containedin the publications on our platform. However, Taylor & Francis, our agents, and our licensors make norepresentations or warranties whatsoever as to the accuracy, completeness, or suitability for any purpose of theContent. Any opinions and views expressed in this publication are the opinions and views of the authors, andare not the views of or endorsed by Taylor & Francis. The accuracy of the Content should not be relied upon andshould be independently verified with primary sources of information. Taylor and Francis shall not be liable forany losses, actions, claims, proceedings, demands, costs, expenses, damages, and other liabilities whatsoeveror howsoever caused arising directly or indirectly in connection with, in relation to or arising out of the use ofthe Content.
This article may be used for research, teaching, and private study purposes. Any substantial or systematicreproduction, redistribution, reselling, loan, sub-licensing, systematic supply, or distribution in anyform to anyone is expressly forbidden. Terms & Conditions of access and use can be found at http://www.tandfonline.com/page/terms-and-conditions
Fabric defect detection using Gabor filters and defect classification based on LBP andTamura method
Junfeng Jinga,b, Huanhuan Zhangb*, Jing Wangb, Pengfei Lib and Jianyuan Jiaa
aSchool of Mechano-Electronic Engineering, Xidian University, Xi’an, Shaanxi 710071, China; bSchool of Electronic andInformation, Xi’an Polytechnic University, Xi’an, Shaanxi 710048, China
(Received 14 December 2011; final version received 7 May 2012)
This paper aims at investigating methods for solving the problem of automated fabric defect detection and classifi-cation, which are more essential and important in assuring the fabric quality. The work focuses on two aspects:fabric defect detection and classification. In the experiment, first, the detection texture features for texture defectare extracted using Gabor filters. The method would automatically segment defects from the regular texture. Sec-ond, texture features for classification use local binary patterns and Tamura method. Fabric samples are used inevaluation and the experimental results obtained further confirm the designed algorithm achieved a high detectionsuccess rate.
Keywords: defect detection; Gabor filters; local binary patterns; Tamura method
Introduction
In the modern industry, it is necessary to save timeand money which bring great profits for business.And the global economic pressures have gradually ledto business more competitive. Therefore, automaticvisual inspection systems are increasing in demand forinsuring high quality of products in production lines.For instance, automatic defect detection has been doneon paper (Roberts et al., 1993), wood (Romano,Bucaro, & Dey, 2008; Yang, Jackson, & Parkin,2006), and textile (Srinivasan, Dastoor, Radhakrishna-iah, & Jayaraman, 1992; Stojanovic et al., 2000).
Since flaws in textile fabrics may reduce the priceof a product by 45–65% (Srinivasan et al., 1992), thequality control of textile fabrics plays a crucial role inthe garment manufacturing industry. It is reported thatthe detection of defects in textile fabrics prior to anymanufacturing process is usually performed by humaninspectors with an accuracy of about 60–70% (Stoja-novic et al., 2000). However, human inspection alsohas some drawbacks. For example, it consumes lot ofmanpower and damages human eyesight. In addition,subjective aspiration, emotion, and long-term workwhich cause human fatigue and boredom influence theefficiency of the manufacturing process. In order toperform the task of human inspector and overcometheir weakness, it is necessary to propose a rapid,
efficient, reliable, and real-time automatic detectionsystem. In this application, two main tasks are defectdetection and defect classification. Defect detectionseparates products into two main classes, acceptable ifthere is no defect in product and not acceptable if thereis defect. Then, defect classification, detects what kindof defect has been occurred. It could help maintenanceto spot the type of repair needed for the product line.
Now, there are some commercial detection sys-tems, such as I-TEX inspection system available fromElbit Vision Systems, Barco Vision’s Cyclops, andZellweger Uster’s Fabriscan. It is worth noting that I-TEX inspection system available from Elbit VisionSystems can detect fabric at the speed of 100m/min.However, each inspection system has its own draw-backs, and is limited to detect a part of defects.
In recent years, the methods of automatic inspec-tion have increasingly attracted many researchers inthe world. The researchers have proposed differentalgorithms to reduce the cost. These attempts fordefect detection have been based on three methods:Model based – Gauss Markov random field (Cohen,Fan, & Attalt, 1991); statistical – co-occurrence matrix(Kuo & Su, 2003; Latif-Amet, Ertuzun, & Ercil, 1998,2000; Wen, Chiu, & Hsuw, 2001); spectral – Fourieranalysis (Chan & Pang, 2000; Tsai & Hsieh, 1999;Tsai & Huang, 2003), Wavelet packets (Sari-Sarrafh &
*Corresponding author. Email: [email protected]
The Journal of The Textile Institute, 2013Vol. 104, No. 1, 18–27, http://dx.doi.org/10.1080/00405000.2012.692940
Copyright � 2013 The Textile Institute
Dow
nloa
ded
by [
Um
eå U
nive
rsity
Lib
rary
] at
00:
22 2
6 Se
ptem
ber
2013

Goddard, 1999; Yang, Pang, & Yung, 2002), andGabor transform (Liu & Han, 2006; Liu, Wen, Su, &Choi, 2008; Zhang, Lu, & Li, 2010). In texture classi-fication, according to Randen (Randen, Husoy, Geco-Prakla, & Stavanger, 1999), Bayes classifiers, nearestneighbor, and neural networks are commonly used aseffective classifiers for texture classification. In (Ebra-heem, Yasser, Mohamed, Safinaz, and Christopher,2006) a new method for knitted fabric defect detectionand classification has applied image analysis and neu-ral networks. Timo Ojala (Timo Ojala, Matti Pietikaèi-nen, & Topi Maèenpaèa, 2002) proposed local binarypatterns (LBP) for texture classification.
Here, we present new approaches for automaticdetection and classification in the textile fabric. Defectdetection was based on four scales and six orientationsGabor scheme. This method is an effective way tosolve the filter parameter selection problem for fabricdefect detection. Then, defect classification not onlyuses LBP but also Tamura method. LBP describes thetexture feature changing from the local, while Tamuramethod describes the texture feature changing fromthe global. This paper combines the two methods.Excellent defect classification results on five kinds offabric samples using this approach are demonstrated.
This paper is organized as follows. First, wedescribe the fabric defect detection using Gabor filters.Second, we introduce the defect classification based onLBP and Tamura method. Third, we describe the conju-gate gradient BP. Fourth, we describe our experimentsand give our results. We then give our conclusions.
Detection using Gabor filters
The Gabor filters are similar to visual nerve and havegood performance. Gabor functions have formed acomplete set of nonorthogonal, which improved two-
dimensional Gabor filter’s impulse response on theplane with the following form (Huang, Shimizu, &Kobatake, 2005):
g(x; y) ¼ � (x02 þ y02)(r2
x þ r2y)
" #
� exp (2pjfx0)� exp � f 2
2r2uv
� �� ��2pr2
xy;
(1)where
x0 ¼ x cos hþ y sin hy0 ¼ �x sin hþ y cos h
ruv ¼ 1=2prxy
8<: ; (2)
The space constants rx and ry define the Gaussianenvelope along the x and y axes. Its values determinethe qualities of filter. It will generate pseudo wire, ifthe value is high. Otherwise, the frequency cannotpass through it. f is the frequency of the filters, h isthe scale of the filters, the parameters (u, v) define thespatial frequency of a sinusoidal plane wave, whichcan also be expressed in polar coordinates as radialfrequency f and orientation h:
f 2 ¼ u2 þ v2
tan h ¼ v
u
(: (3)
Applying the Gabor filters in image processing deter-mine the parameters of filter which are frequency,direction, and the Gaussian envelope constant. Thefrequency of filter is completely determined by someregion’s frequency whose direction is the same as thefrequency. These factors are very important. TheGabor filters serve as the band-pass filter, and is
Figure 1. The view of a typical Gabor filter in spatial domain, the real part is (a) and imaginary part is (b).
The Journal of The Textile Institute 19
Dow
nloa
ded
by [
Um
eå U
nive
rsity
Lib
rary
] at
00:
22 2
6 Se
ptem
ber
2013

similar to the visual channel of human eye, which iswidely used in texture analysis.
This paper investigated defect detection by using agroup of Gabor filters gn(x, y), n=1, 2, 3, …, P�Q, Pdenotes the total of scale, Q denotes the total of orienta-tion. Each of the traditional Gabor filters has the realand imaginary parts. Figure 1 shows the perspective plotof a typical Gabor filter in spatial domain. For a pictureof the input images Ii(x, y), the magnitude of filteredimage In(x, y) is gained by using gn(x, y) as follows:
In(x; y) ¼ f½gn(x; y)r � Ii(x; y)�2
þ ½gn(x; y)i � Ii(x; y)�2g0:5; (4)
where gn(x, y)r and gn(x, y)i are real and imaginarycomponents of gn(x, y), respectively. ‘⁄’ denotes 2Dconvolution.
Fabric flaws can have great response to some ori-entations and scales of Gabor filters. Therefore, thispaper uses an effective approach, which is proposedby Kumar (Kumar & Pang, 2002) to choose an opti-mal output and describe the flaws. First, we can gainsome images and divide them into N nonoverlappingsquare regions by inputting an image, applying P�QGabor filters. This step is different from Kumar’s. Sec-ond, to find the maximum value Ti
max and the mini-mum value Ti
min; the output amplitude mean for eachsquare region is calculated. A cost function K(i) (Jing,Li, & Li, 2012) weighs all output. Third, the Equation(5) determines the output which is an optimal one andis denoted as Ibest(x, y).
K(i) ¼ Timax � Ti
min
Timin þ Ti
max
: (5)
The image resulted in noise by applying Gabor filtersin experiment. Mak (Mak & Peng, 2006) used Guassfilters to reduce the speckle-like noise. In our study, amethod similar to K.L. Mak’s is used to reduce thespeckle-like noise.
Before binarization, it must be made sure that thethresholding limits gain from the normal samples. Ofcourse, to acquire the reference sample and denotes itas B(x, y), the normal samples must be disposed byusing the Gabor filters and Guass filters. The mask is3� 3 for the Gaussian smoothing filter. The referencesample is used to determine the thresholding limitscmax and cmin (Mak & Peng, 2008).
cmax ¼ maxx;y2W B(x; y)j jcmin ¼ minx;y2W B(x; y)j j
�; (6)
where W is a window centered in the image. The win-dow size should be chosen to avoid the distortioneffort caused by the edges of the image. The experi-
ment gains the binarization result from the Equation(7). cmax and cmin are the crucial role of the calibrationprocess before the actual inspection is conducted.
D(x; y) ¼ 1 B(x; y)[cmax or B(x; y)\cmin
0 cmin � B(x; y) � cmax
�: (7)
Defect classification based on Tamura method andLBP Tamura method
Textural features corresponding to human visual per-ception are very useful for optimum feature selection.Tamura approximated, in computational form, sixbasic textural features: coarseness, contrast, direction-ality, line-likeness, regularity, and roughness (TamuraHideyuki, Mori Shunji, & Yamawaki Takashi, 1978).
Coarseness calculation can be summarized in thefollowing steps. First, take averages at every pointover neighborhoods. The average over the neighbor-hood of size 2k � 2k at the point (x, y) is:
Ak(x; y) ¼Xxþ2k�1�1
i¼x�2k�1
Xyþ2k�1�1
j¼y�2k�1
g(i; j)=22k; (8)
where k = 0, 1, 2, 3, 4, 5. g(i, j) is the gray level at (x, y).Second, for each point, compute the value of hori-
zontal and vertical orientations.
Ek;h(x; y) ¼ Ak(xþ 2k�1; y)� Ak(x� 2k�1; y)j jEk;v(x; y) ¼ Ak(x; yþ 2k�1)� Ak(x; y� 2k�1)j j
�: (9)
Third, at each point, one picks the best size whichgives the highest output value: Sbest(i; j) ¼ 2k ; where kmaximizes E in either direction. Finally, take theaverage of Sbest over the picture to get a coarsenessmeasure Fcrs:
Fcrs ¼ 1
m� n
Xmi¼1
Xn
j¼1
Sbest(i; j): (10)
The quantification of contrast is based on the statisticaldistribution of pixel intensities.
a4 ¼ l4=r4; (11)
l4 is the fourth moment about the mean and r2 is thevariance. Contrast is measured by the following:
Fcon ¼ r
a1=44
: (12)
The Fcon values are given in the whole image orregional contrast global metric.
For image, directionality which contains a quantityof information about image is an important feature.
20 J. Jing et al.
Dow
nloa
ded
by [
Um
eå U
nive
rsity
Lib
rary
] at
00:
22 2
6 Se
ptem
ber
2013

Some textural images have obvious direction, whereasothers have no direction. Tamura and others define thedirectionality as measurement regardless of havingdirection or not.
The directionality calculation can be divided intothree steps. First, calculate the gradient vector. Thegradient is a vector, so it has both magnitude anddirection. The magnitude and the local edge directionare approximated as follows:
�Gj j ¼ ( �Hj j þ �Vj j)=2h ¼ tan�1(�V=�H )þ p=2
(13)
where �H and �V are the horizontal and vertical dif-ferences measured by following 3� 3 operators,respectively.
� 1 0 1�1 0 1�1 0 1
1 1 10 0 0�1 �1 �1
Second, the desired histogram HD can be obtained byquantizing h and counting the points with the magni-tude �Gj j over the threshold t.
HD(k) ¼ Nh(k)=Xn�1
i¼0
Nh(i); (14)
where Nh(k) is the number of points at which(2k� 1)π/2n6 h6(2k + 1)π/2n and �Gj j P t. �Gj jare aimed at preventing counting of unreliable direc-tions which cannot be regarded as edge points.
Finally, the approach measuring the directionalityquantitatively from HD is to compute the sharpness ofthe peaks. This measure can be defined as follows:
Fdir ¼Xnpp
X/2wp
/� /p
� 2HD(/); (15)
where np, number of peaks; /p, pth peak position ofHD; wp, range of pth peak between valleys; and /quantized direction code (cyclically in modulo 180°).
As a measure of line-likeness, Tamura defined thefollowing measure so that co-occurrences in the samedirection are weighed by +1 and those in theperpendicular direction are weighed by �1:
Flin ¼Pn
i
Pnj PDd(i; j) cos (i� j) 2pn
�Pn
i
Pnj PDd(i; j)
; (16)
where PDd is the n� n local direction co-occurrencematrix of points at distance.
Tamura described the regularity of repetitive pat-terns in mathematical form. They defined four indepen-
dent features. They took the sum of the variation foreach of these four features as a measure of regularity.
Freg ¼ 1� r(rcrs þ rcon þ rdir þ rlin); (17)
where r is a normalizing factor and each rxxx meansthe standard deviation of Fxxx.
Tamura defined the roughness, which emphasizeon the effects of coarseness and contrast as follows:
Frgh ¼ Fcrs þ Fcon: (18)
Local binary patterns
Timo Ojala (Timo Ojala, Matti Pietikaèinen, & TopiMaèenpaèa, 2002) proposed LBP, which is an effec-tive texture description operator. As an effectivedescribed algorithm of texture, it is widely applied forits distinguished activity to deal with local texture fea-ture of image. LBP has a strong activity to classifyand compute. Its main idea is to compare a point withrelative gray of its local pixels. It is this relative pat-tern that makes LBP has gray rotation invariance
During the process of extracting image texture, weused a 3� 3 window as a basic texture unit and thevalue of center pixel is taken as a threshold to com-pare with local eight pixel. This is the basic LBPalgorithm. When a local pixel value is bigger than thethreshold value, it is labeled as 1. On the contrary, itis labeled as 0. After that, the eight values wereobserved with clockwise direction and this binaryvalue is taken as a response. Basic LBP algorithm isshown in Figure 2.
Basic LBP algorithm can be further popularized indifferent sizes and shapes. We can obtain local pixelsvalues of arbitrary radiuses and numbers according toapplication of round filed and bilinear interpolation.This LBP algorithm is defined as LBPP;R:
The subscript P expresses local fields. R expressesthe radius of round filed. Figure 3 is a round modelwith two as a radius and eight as pixel value.
We can obtain local pixels values of arbitrary radi-uses and numbers according to applying round filedand bilinear interpolation. For an arbitrary pixelf (xc; yc) of a certain local area in an image, set it asthe center point gc. To p points such g0;g1; . . . ; gp, ina 3� 3 window, its texture T is defined as followings:
Figure 2. The basic LBP algorithm.
The Journal of The Textile Institute 21
Dow
nloa
ded
by [
Um
eå U
nive
rsity
Lib
rary
] at
00:
22 2
6 Se
ptem
ber
2013

T � (g0 � gc; . . . ; gp � gc): (19)
Set the gray value of the window point gc as a thresh-old value and deal with other pixels of the windowfor binarization processing.
T�t(s(g0 � gc); . . . ; s(gp � gc))
s(x) ¼ 1 x[0
0 x � 0
�(20)
For a p bit binary number, follow the formula and cal-culate the weighed sum of a pixel in different posi-tions. Then, we can obtain the window LBP value:
LBPP;R ¼Xp�1
p¼0
s(gp � gc)2p: (21)
Original LBP algorithm has an invariance property togray. But when the same texture element is rotated atcertain angles, it is regarded as a different kind of bin-ary pattern. That is to say, it has an invariance prop-erty to revolution. The measure of unified form ofLBP is achieved by the numbers of space transition of0 and 1. For a LBP, if a string of n binary is in a cir-culating situation and the change from 0 to 1, or from1 to 0 is no bigger than two times, this LBP isregarded as unified one. On the contrary, it is not aunified binary pattern.
LBPriu2P;R ¼
PP�1p¼0 s(gp � gc) U (LBPP;R) � 2
P þ 1 others
�; (22)
where
U (LBPP;R) ¼ s(gp�1 � gc)� s(g0 � gc)�� ��þXP�1
p¼1
s(gp � gc)� s(gp�1 � gc)�� ��: (23)
Conjugate gradient BP algorithm
Conjugate gradient BP algorithm which can improvethe shock of gradient and the convergence property isan improved BP gradient. The basic idea of this algo-rithm is to search the conjugate directions which arethe negative gradient direction and the last searchdirection, thus speeding up the training speed andimproving the training accuracy.
Considering the optimization problem:minw(z)(z 2 Rn). Calculate the minimum the z⁄ in Rn
and define w(z�) ¼ min. Through one-dimensionaliterative search, the core problem is to choose thesearch direction. Based on one-dimensional iterativealgorithm, it can be obtained as follows:
z(k þ 1) ¼ z(k)þ rkd(k)(rk[0; k ¼ 0; 1; 2; . . . );
(24)
d(k þ 1) ¼ �g(k)þ bkd(k � 1)(d(0) ¼ �g(0)): (25)
It is proposed by Fletcher and Reeves. Where d(k) isK times iteration search direction, rk and bk are Ktimes iteration search step length.
rk ¼ � gT (k)d(k)
dT (k)Ad(k)
bk ¼gT (k)g(k)
gT (k � 1)g(k � 1)
8>><>>: : (26)
Experiments and analysis
Defect detection
This work used the flaw samples which are doublepick, harness skip, broke pick, mispick, hole, felter,and shuttle mark. The sample images have a size of512� 512 pixels. All Gabor filters are implemented asan 11�11 convolution mask for their real and imagi-nary components. The group of Gabor filters are fourscales of f and six orientations of h, f = 2^L/16 L= 0,1, 2, 3 h ¼ p(nþ 1)=6 n= 0, 1, 2, 3, 4, 5, and themask size of the Guass filter is 3� 3.
Figure 4 shows the detection results obtained byapplying the proposed approach. Figure 4 images fromleft to right are regular samples, samples with defect,output from Gabor filter, and segmented defect afterthresholding. The results show that the defects are cor-rectly detected and localized in all samples. In experi-ment, it is important to choose the parameters,because it may influence the performance of segmen-tation.
Among the Gabor transform methods, Mak pro-posed a method (Mak & Peng, 2008) which achievedthe best detection result on a fair amount of testingsamples. The detection success rates were 96.2% (39
Figure 3. The circularly symmetric neighbor set of eightpixels in a 5� 5 neighborhood.
22 J. Jing et al.
Dow
nloa
ded
by [
Um
eå U
nive
rsity
Lib
rary
] at
00:
22 2
6 Se
ptem
ber
2013
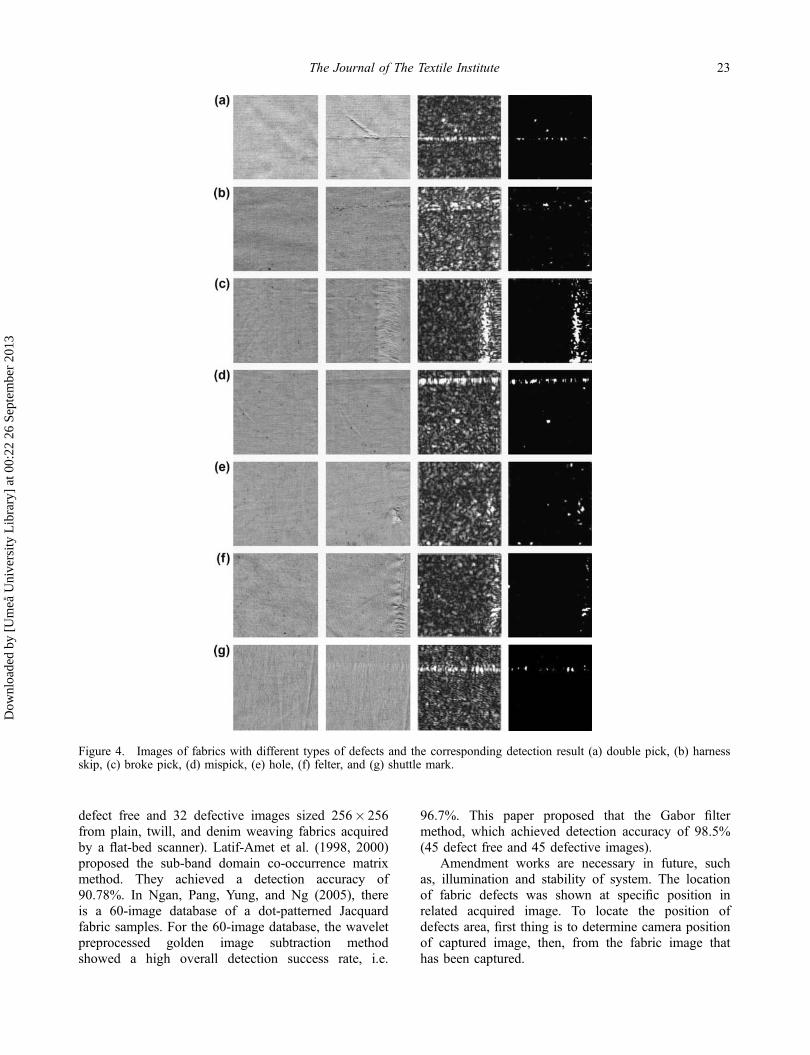
defect free and 32 defective images sized 256� 256from plain, twill, and denim weaving fabrics acquiredby a flat-bed scanner). Latif-Amet et al. (1998, 2000)proposed the sub-band domain co-occurrence matrixmethod. They achieved a detection accuracy of90.78%. In Ngan, Pang, Yung, and Ng (2005), thereis a 60-image database of a dot-patterned Jacquardfabric samples. For the 60-image database, the waveletpreprocessed golden image subtraction methodshowed a high overall detection success rate, i.e.
96.7%. This paper proposed that the Gabor filtermethod, which achieved detection accuracy of 98.5%(45 defect free and 45 defective images).
Amendment works are necessary in future, suchas, illumination and stability of system. The locationof fabric defects was shown at specific position inrelated acquired image. To locate the position ofdefects area, first thing is to determine camera positionof captured image, then, from the fabric image thathas been captured.
Figure 4. Images of fabrics with different types of defects and the corresponding detection result (a) double pick, (b) harnessskip, (c) broke pick, (d) mispick, (e) hole, (f) felter, and (g) shuttle mark.
The Journal of The Textile Institute 23
Dow
nloa
ded
by [
Um
eå U
nive
rsity
Lib
rary
] at
00:
22 2
6 Se
ptem
ber
2013
Defect classification
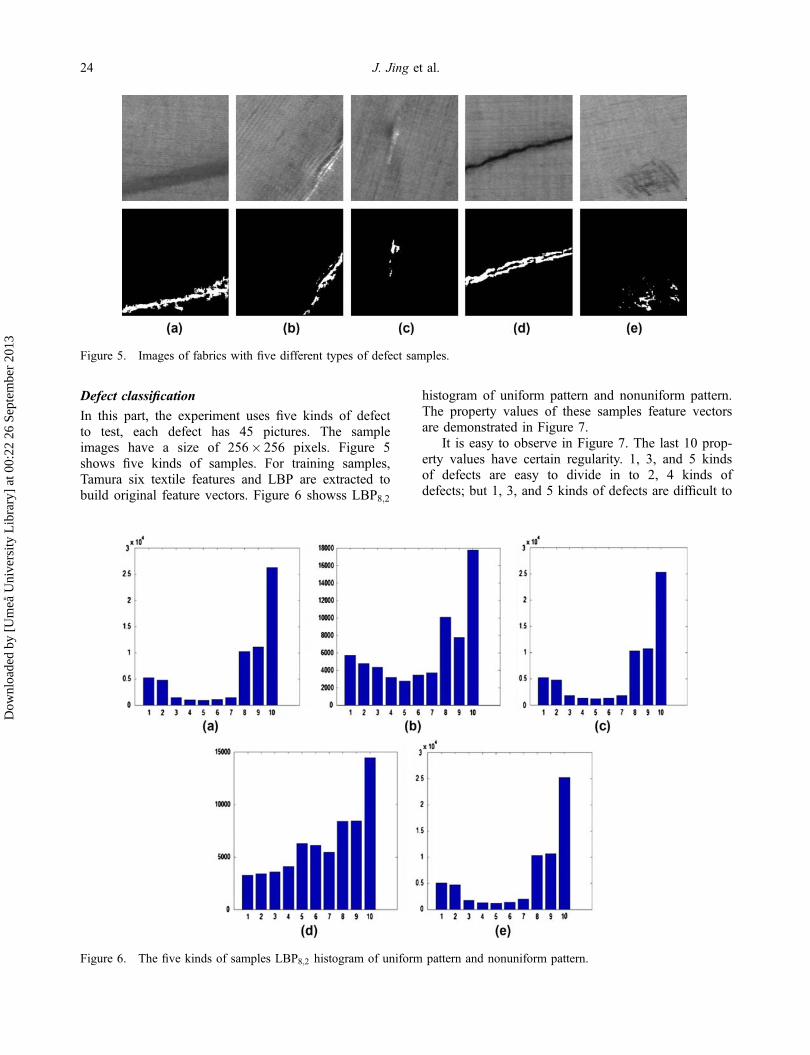
In this part, the experiment uses five kinds of defectto test, each defect has 45 pictures. The sampleimages have a size of 256� 256 pixels. Figure 5shows five kinds of samples. For training samples,Tamura six textile features and LBP are extracted tobuild original feature vectors. Figure 6 showss LBP8;2
histogram of uniform pattern and nonuniform pattern.The property values of these samples feature vectorsare demonstrated in Figure 7.
It is easy to observe in Figure 7. The last 10 prop-erty values have certain regularity. 1, 3, and 5 kindsof defects are easy to divide in to 2, 4 kinds ofdefects; but 1, 3, and 5 kinds of defects are difficult to
Figure 5. Images of fabrics with five different types of defect samples.
Figure 6. The five kinds of samples LBP8;2 histogram of uniform pattern and nonuniform pattern.
24 J. Jing et al.
Dow
nloa
ded
by [
Um
eå U
nive
rsity
Lib
rary
] at
00:
22 2
6 Se
ptem
ber
2013
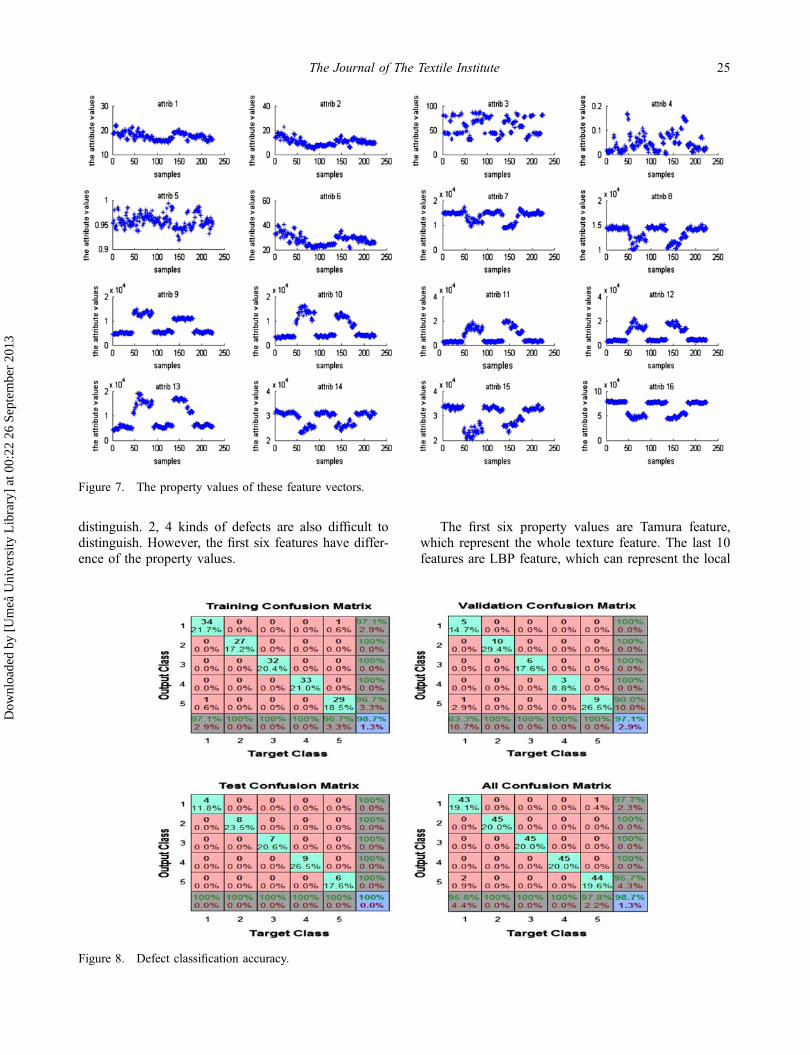
distinguish. 2, 4 kinds of defects are also difficult todistinguish. However, the first six features have differ-ence of the property values.
The first six property values are Tamura feature,which represent the whole texture feature. The last 10features are LBP feature, which can represent the local
Figure 7. The property values of these feature vectors.
Figure 8. Defect classification accuracy.
The Journal of The Textile Institute 25
Dow
nloa
ded
by [
Um
eå U
nive
rsity
Lib
rary
] at
00:
22 2
6 Se
ptem
ber
2013

texture feature. In experiment, 70% samples aretrained, 15% samples for evaluation, and 15% samplesare tested. The experiment result is shown in Figure 8.
The training curve was obtained in Figure 9.
Conclusions
In this paper, an algorithm of defect detection andclassification using improved Gabor filters, LBP, andTamura method has been presented. The experimentalresults obtained further confirm the success ofdesigned algorithm with a higher detection rate. Thedetection results have shown that the efficiency andeffectiveness of the proposed approach is a useful toolfor detecting fabric flaws. In defects classification,training textile features Tamura method and LBP-based classifier considering different feature combina-tions. We find that the accurate determination ofmodel number can improve the performance of classi-fication evidently. However, the proposed approachesare not suitable for all textile flaws. Our future workcan be conducted by applying the proposed approachto detect other kinds of flaws.
AcknowledgementsThe authors would like to thank the Scientific ResearchProgram Funded by Shaanxi Provincial EducationDepartment (Program No. 11JK0910) and the postgraduateinnovation foundation by the Xi’an Polytechnic University(chx121012).
ReferencesChan, C.H., & Pang, G.K.H. (2000). Fabric defect detection
by Fourier analysis. IEEE Transactions on IndustryApplications, 36(5), 1267–1276.
Cohen, F.S., Fan, Z., & Attalt, S. (1991). Automated inspec-tion of textile fabric using textural models. IEEE Trans-actions on Pat-tern Analyses and Machine Intelligence,13(8), 345–350.
Ebraheem, S., Yasser, G., Mohamed, A., Safinaz, Y., &Christopher, P. (2006). Detection and classification ofdefects in knitted fabric structures. Textile ResearchJournal, 76(4), 295–300.
Huang, L.-L., Shimizu, A., & Kobatake, H. (2005). Robustface detection using Gabor filter features. Pattern Rec-ognition Letters, 26, 1641–1649.
Jing, J.F., Li, H., & Li, P.F. (2012). Combined fabric defectsdetection approach and quadtree decomposition. Journalof Industrial Textiles, 41, 331–344.
Kumar, A., & Pang, G.K.H. (2002). Defect detectionin textured materials using Gabor filters. IEEETransactions on Industry Applications, 38, 425–440.
Kuo, C.F.J., & Su, T.L. (2003). Gray relational analysis forrecognizing fabric defects. Textile Research Journal, 73(5), 461–465.
Latif-Amet, A., Ertuzun, A., & Ercil, A. (1998a). Texturedefect detection using subband domain co-occurrencematrices. IEEE Southwest Symposium on Image Analysis& Interpretation, 5–7, 205–208.
Latif-Amet, A., Ertuzun, A., & Ercil, A. (2000). An effi-cient method for texture defect detection: Sub-banddomain co-occurrence matrices. Image and Vision Com-puting, 18, 543–553.
Liu, H., & Han, J. (2006). Defect detection in textiles usingoptimal Gabor wavelet filter. In IEEE Proceedings ofthe 6th World Congress on Intelligent Control & Auto-mation, (pp. 10005–10007). Dalian, China.
Liu, X.Z., Wen, Z., Su, Z., & Choi, K.F. (2008). Slubextraction in woven fabric images using Gabor filters.Textile Research Journal, 78(4), 320–325.
Mak, K.L., & Peng, P. (2006). Detecting defects in textilefabrics with optimal Gabor filters. Proceedings of WorldAcademy of Science, Engineering and Technology, 13,75–80.
Figure 9. Neural network error convergence curve.
26 J. Jing et al.
Dow
nloa
ded
by [
Um
eå U
nive
rsity
Lib
rary
] at
00:
22 2
6 Se
ptem
ber
2013

Mak, K.L., & Peng, P. (2008). An automated inspection sys-tem for textile fabrics based on Gabor filters. Roboticsand Computer-Integrated Manufacturing, 24(3), 359–369.
Ngan, H.Y.T., Pang, G.K.H., Yung, S.P., & Ng, M.K. (2005).Wavelet based methods on patterned fabric defect detec-tion. Pattern Recognition, 38(4), 559–576.
Ojala, T., Pietikaèinen, M., & Maèenpaèa, T. (2002). Multi-resolution gray-scale and rotation invariant texture clas-sification with local binary patterns. IEEE Transactionson Pattern Analysis and Machine Intelligence, 24(7),971–987.
Randen, T., Husoy, J.H., Geco-Prakla, Schlumberger, &Stavanger. (1999). Filtering for texture classification:a comparative study. IEEE Transactions on PatternAnalysis and Machine Intelligence, 21(4), 291–310.
Roberts, J.W., Rose, S.D., Jullian, G.A., Nichols, G.A., Jen-kins, L., Chamberlain, P., & Maroscher, S.G. (1993). APC based real-time defect imaging system for high speedweb inspection. Proceedings on SPIE, 1907, 164–176.
Romano, A.J., Bucaro, J.A., & Dey, S. (2008). Defectdetection and localization in orthotropic wood slabsby inversion of dynamic surface displacements. Jour-nal of the Acoustical Society of America, 124(2),918–925.
Sari-Sarrafh, & Goddard, J.S. (1999). Vision system for on-loom fabric inspection. IEEE Transactions on IndustryApplication, 35(6), 1252–1259.
Srinivasan, K., Dastoor, P.H., Radhakrishnaiah, P., & Jayar-aman, S. (1992). FDAS: aknowledge-based frameworkfor analysis of defects in woven textile structures., Part1. The Journal of the Textile Institute, 83(3), 431–448.
Stojanovic, R., Mitropulos, P., Koulamas, C., Karayiannis,Y., Koubias, S., & Papadopoulos, G. (2000). Anapproach for automated defect detection and neural clas-sification of web textile fabric. Mach Graph Vis, 9(3),587–607.
Tamura, H., Mori, S., & Yamawaki, T. (1978). Textural fea-tures corresponding to visual perception. IEEE Transac-tions on Systems, Man and Cybernetics, 8(6), 460–473.
Tsai, D.M., & Hsieh, C.Y. (1999). Automated surfaceinspection for directional textures. Image and VisionComputing, 18, 49–62.
Tsai, D., & Huang, T. (2003). Automated surface inspectionfor statistical textures. Image and Vision Computing, 21,307–323.
Wen, C.Y., Chiu, S.H., & Hsuw, S. (2001). Defect segmen-tation of texture images with wavelet transform and aco-occurrence matrix. Textile Research Journal, 71(8),743–749.
Yang, D., Jackson, M.R., & Parkin, R.M. (2006). Inspectionof wood surface waviness defects using the light sec-tioning method. Proceedings of the Institution ofMechanical Engineers – I, 220(7), 617–626.
Yang, X.Z., Pang, G.K.H., & Yung, N.H.C. (2002). Dis-criminative fabric defect detection using adaptive wave-let. Optical Engineer, 41(12), 3116–3126.
Zhang, Y., Lu, Z., & Li, J. (2010). Fabric defect detectionand classification using Gabor filters and Gaussian mix-ture model. Asian Conference on Computer Vision(ACCV2009), Part II, Lecture Notes in ComputerScience, 5995, 635–644.
The Journal of The Textile Institute 27
Dow
nloa
ded
by [
Um
eå U
nive
rsity
Lib
rary
] at
00:
22 2
6 Se
ptem
ber
2013