For a free demonstration or information about what Biodose can do for you call 025 40813
Upload
phungkhanhCategory
view
213download
0
Fabian Barthel and Eric Neumayer A trend analysis of normalized insured damage from natural disasters Article (Accepted version) (Refereed)
Original citation: Barthel, Fabian and Neumayer, Eric (2012) A trend analysis of normalized insured damage from natural disasters. Climatic change . ISSN 0165-0009 DOI: 10.1007/s10584-011-0331-2 © 2012 Springer Science+Business Media B.V. This version available at: http://eprints.lse.ac.uk/40813/ Available in LSE Research Online: August 2012 LSE has developed LSE Research Online so that users may access research output of the School. Copyright © and Moral Rights for the papers on this site are retained by the individual authors and/or other copyright owners. Users may download and/or print one copy of any article(s) in LSE Research Online to facilitate their private study or for non-commercial research. You may not engage in further distribution of the material or use it for any profit-making activities or any commercial gain. You may freely distribute the URL (http://eprints.lse.ac.uk) of the LSE Research Online website. This document is the author’s final manuscript accepted version of the journal article, incorporating any revisions agreed during the peer review process. Some differences between this version and the published version may remain. You are advised to consult the publisher’s version if you wish to cite from it.

Electronic copy available at: http://ssrn.com/abstract=1831633
A Trend Analysis of Normalized Insured Damage from Natural Disasters
Forthcoming in:
Climatic Change, 2012 Fabian Barthel∗∗∗∗ and Eric Neumayer Department of Geography and Environment and The Grantham Research Institute on Climate Change and the Environment, London School of Economics and Political Science, Houghton Street, London WC2A 2AE, U.K. Fax: +44 (0)20 7955 7412 Tel: +44 (0)20 7955 7598
∗ Corresponding author (email: [email protected]). The authors acknowledge support from the
Munich Re Programme “Evaluating the Economics of Climate Risks & Opportunities in the Insurance
Sector” at LSE. All views expressed are our own and do not represent the views of Munich Re. We
thank Eberhard Faust, Peter Höppe, Jan Eichner, Nicola Ranger, Lenny Smith and Bob Ward as well as
three referees for many helpful comments. All errors are ours.
Electronic copy available at: http://ssrn.com/abstract=1831633
1
A Trend Analysis of Normalized Insured Damage from Natural Disasters
Abstract
As the world becomes wealthier over time, inflation-adjusted insured damages from
natural disasters go up as well. This article analyzes whether there is still a significant
upward trend once insured natural disaster loss has been normalized. By scaling up
loss from past disasters, normalization adjusts for the fact that a hazard event of equal
strength will typically cause more damage nowadays than in past years because of
wealth accumulation over time. A trend analysis of normalized insured damage from
natural disasters is not only of interest to the insurance industry, but can potentially be
useful for attempts at detecting whether there has been an increase in the frequency
and/or intensity of natural hazards, whether caused by natural climate variability or
anthropogenic climate change. We analyze trends at the global level over the period
1990 to 2008, over the period 1980 to 2008 for West Germany and 1973 to 2008 for
the United States. We find no significant trends at the global level, but we detect
statistically significant upward trends in normalized insured losses from all non-
geophysical disasters as well as from certain specific disaster types in the United
States and West Germany.
2
1. Introduction
Analyzing trends in natural disaster loss represents an important tool for attempts at
detecting whether climate change has already started to have an effect on the
frequency and/or intensity of natural hazards. Most of existing studies have looked at
total economic loss (Pielke and Landsea 1998; Pielke et al. 1999, 2003, 2008; Brooks
and Doswell 2001; Raghavan and Rajseh 2003; Vranes and Pielke 2009; Schmidt,
Kemfert and Höppe 2009; Barredo 2009; Nordhaus 2010). Fewer studies have
analysed insured losses and all of them are confined to a specific hazard type in one
country (Changnon and Changnon 1992; Changnon 2001, 2009a, 2009b; Crompton
and McAeneney 2008).1 Yet, analyzing trends in insured losses is important for two
reasons. First, insurance companies naturally worry most about insured losses and are
interested in any trends in these losses quite independently of whether they are caused
by natural climate variability or anthropogenic greenhouse gas emissions or other
drivers (Bouwer 2011). Second, insured losses are estimated with greater precision
than total economic losses, estimates of which are often simply taken as multiples of
insured loss. All other things equal, the greater precision should be beneficial since
measurement error hampers statistical analysis and thus renders detecting statistically
significant trends more difficult.
Existing studies of total economic and insured loss have typically found no
increasing trend over time after loss has been subjected to what is known as
“normalization”. Normalization adjusts for the fact that a disaster of equal strength
will typically cause more damage in the current period than in the past because there
is typically a greater value of assets at risk in the present compared to the past.
1 Hazards are events triggered by natural forces. They will turn into natural disasters if people
are exposed to the hazard and are not resilient to fully absorbing the impact without damage to
life or property (Schwab, Eschelbach and Brower 2007).

3
Normalization thus adjusts nominal economic loss from past disasters upwards by
multiplying past damage with a factor for inflation, for population growth and for
growth in wealth per capita, thus in effect estimating the damage a past hazard event
would have caused had it hit the same, but nowadays wealthier, area today. Without
normalization, disaster loss is likely to trend upwards over time, not because hazards
have necessarily become more frequent and/or more intensive, but simply because the
value of assets at risk has increased over time. For normalizaton of insured disaster
losses, one additionally needs to adjust for changes in insurance penetration over time,
i.e. the value of insurance premia generated as a percentage of GDP which
approximates the share of wealth covered by insurance. The question, to be studied in
this article, is therefore whether the results of existing studies which have analyzed
trends in normalized total economic loss carry over to trend analysis in normalized
insured losses.
To our knowledge, this is the first article systematically analyzing trends in
insured natural disaster loss for more than one hazard type and for a larger country
sample. We do so at the global level, for developed countries, for specific types of
disasters as well as, in more detail, for West Germany and the US. Section 2 explains
the methodology of normalizing natural disaster loss. Section 3 describes our
empirical research design and reports results from the analysis. Section 4 concludes.
2. Normalizing natural disaster loss
The conventional approach to normalizing natural disaster loss was developed by
Roger Pielke Jr. and co-authors (see Pielke and Landsea 1998, Pielke et al. 1999,
2003, 2008; Vraines and Pielke 2009). Following their approach, normalized disaster
damage can be calculated as follows:

4
s s s st t
t t t
GDPdeflator Population Wealth per capitaNormalized Damage Damage
GDPdeflator Population Wealth per capita= ⋅ ⋅ ⋅ (1)
where s is the (chosen) year to which one wishes to normalize and t is the disaster
year. Inflation (i.e. the change in producer prices) is accounted for by using the Gross
Domestic Product (GDP) deflator, while the remaining two correction factors adjust
for changes in population and wealth per capita. Ideally, the population and wealth
changes should reflect changes in the exact areas affected by the natural disaster in
question. Yet, in practice it is often impossible to determine the exact affected areas
and time series information on GDP and population in these areas is not available, so
scholars typically resort to using data from the country or, if they can, from sub-
country administrative units known to be affected (e.g., counties or states). Existing
work differs with respect to how wealth per capita is measured: while some use data
on the value of capital stocks (e.g., Pielke and Landsea 1998; Brooks and Doswell
2001; Vranes and Pielke 2009; Schmidt, Kemfert and Höppe 2009) or the value of
dwellings (Crompton and McAneney 2008), others, often due to the lack of data,
simply use GDP per capita (e.g., Raghavan and Rajseh 2003; Pielke et al. 2003;
Miller et al. 2008; Barredo 2009; Nordhaus 2010). If there is more than one disaster in
a given country per year, the measure of disaster loss is the annual sum of normalized
damages from each disaster as per equation (1).
Neumayer and Barthel (2011) have criticized conventional normalization
methodology on the grounds that it adjusts for differences in wealth over time, but not
for differences in the level of wealth across space at any point of time. Conventional
normalization adjusts for the fact that a disaster like, say, the 1926 Great Miami
hurricane would have caused far more damage if it hit Miami nowadays since the
value of what can potentially become destroyed has tremendously increased over this

5
time period (Pielke et al. 1999). At the same time, however, a hurricane that hits
Miami in any year will cause a much larger damage than a hurricane that hits in the
same year rural parts of Florida with much lower population density and
concentration of wealth. Conventional normalization accounts for the former effect,
but not for the latter. It makes Miami in 1926 comparable to Miami in 2010, but fails
to make Miami in whatever year comparable to rural Florida or other areas affected
by a particular natural disaster in that same year. Neumayer and Barthel (2011) have
therefore developed an alternative normalization methodology that additionally
adjusts for differences in space. However, for this method to be applied in empirical
analysis, one would need information on the value of insured assets potentially at risk
in any given area. Since this information is typically not available, we follow the
conventional normalization methodology in this paper.
3. Research Design
Contrary to Neumayer and Barthel (2011), in which we could study trends of all
economic losses over the period 1980 to 2009, poor availability of data during the
1980s on insurance premia needed for normalization in terms of insurance penetration
means that our statistical tests are restricted to the period 1990 to 2008 for all analyses
but those for the United States and West Germany, for which we have data from 1973
and 1980, respectively, onwards. The disadvantage of being compelled to use a
relatively short time period is that, ceteris paribus, the shorter the time series of annual
loss data the less likely any trend will be detected as statistically significant (the
smaller N, the number of observations, the higher the standard error of the estimate).
Also, the IPCC (2007a: 942) defines climate in a narrow sense “as the average
weather, or more rigorously, as the statistical description in terms of the mean and
6
variability of relevant quantities” over a period of 20 to 30 years, so our study period
of 1973, 1980 or 1990 to 2008 may be too short to identify changes in climate.
Data on insured loss from natural disasters in nominal USD comes from
Munich Re’s NatCatSERVICE database. Munich Re also supplied us with data on
insurance premia in a country. The NatCatSERVICE database provides a very high
quality source for insured loss data worldwide since the re-insurance company is in a
privileged position to collect these data, has done so for many years and has invested
much time, money and effort in the data collection. But it is of course not perfect. For
example, smaller disasters may be somewhat under-reported in the early periods
relative to later periods. In order to maintain the database, several members of staff
browse daily international and regional sources to gather information about natural
disaster events. Data are collected from a variety of sources such as government
representatives, relief organisations and research facilities. Information on insured
losses is based on information of insurance associations and insurance services as well
as on claims made by Munich Re’s customers, which provide the best approximation
to the actual damage. Initial reports on insured losses, which are usually available in
the immediate aftermath of a disaster, are often highly unreliable. Therefore, data in
the NatCatSERVICE database is updated continuously as more accurate information
becomes available, which might be even years after the disaster event. Our analysis
ends in 2008, since these cases are closed to the largest extent (Munich Re, personal
communication). Table 1 shows the number and average insured losses for the period
1980 to 2008 for those disasters with a positive recorded insured loss for each disaster
sub-type and for the global sample as well as for Germany and the US separately. By
far the most costly hazard sub-type consists of tropical cyclones.2
2 One has to keep in mind that the NatCatSERVICE data base was set up as an insurance
industry-related loss data base that is organized according to the most significant hazardous

7
Since we study trends in insured rather than total economic losses, we need to
adjust the conventional normalization methodology represented by equation (1) by
adding an additional factor to control for changes in the insurance penetration as a
proxy for the share of wealth covered by insurance policies:
.. .
.s s s s s
ttt t t t
GDPdefl Pop Wealth pc Ins penetrationNorm Ins Loss Loss
GDPdefl Pop Wealth pc Ins penetration= ⋅ ⋅ ⋅ ⋅ (2)
For our global analysis, we use GDP per capita as a proxy for wealth as there is no
other measure of wealth available for all countries in the world. This is not
unproblematic. GDP has the advantage that it captures well potential economic loss
due to the interruption of economic operations as a result of a natural disaster, but it is
a relatively poor proxy for the physical wealth stock at risk from destruction by
impact involved with a disastrous event. Hence the disaster subtype is nothing else than a
significant type of hazard that has caused a significant proportion of the loss. But any subtype
given does not exclude another subtype to be additionally involved while the event occurred.
For instance, among the convective events associated with a positive loss there have been 185
events reported where tornados have caused significant insured loss. Definitely, this does not
exclude tornados occurring also with some of the 213 hailstorm events that have been reported
to have caused losses from hail. Nor does it exclude tornados occurring with the 765 reported
tempest storm events. Hence, the subtype tornado does not comprise all the tornado events
occurred, but those where tornado was the most significant type of hazard produced by the
thunderstorm cell. In order to include comprehensively all the tornado losses, one would have
to integrate over all the convective hazards (i.e. flash flood, hailstorm, lightning, tempest
storm, tornado), but will at the same time integrate all losses from convective events. Another
example of disaster subtypes that often are linked to each other is the ensemble of drought,
heat wave and subsidence

8
disasters.3 While GDP is a flow of economic activity, economic wealth is a stock.
Fortunately, despite GDP consisting in part of intangible components such as services
with scant correspondence to the value of the physical wealth stock, on the whole
GDP is highly correlated with it since the physical wealth stock is used to produce
GDP in conjunction with other forms of capital, such as human and natural capital.
But GDP can only function as a proxy for wealth and typically understates it.
Economists estimate the ratio of the value of the physical man-made or manufactured
capital stock to GDP to lie somewhere in between 2 and 4 for a typical macro-
economy (D’Adda and Scorcu 2003). Yet this ratio will vary across countries and,
more importantly, is a national macro-economic average, which can differ more
drastically across sub-country units.4 It also only captures the value of the physical
capital stock used for the production of consumption goods and services, but not the
value of other wealth held in the form of, for example, residential property. Moreover,
the increasing share of GDP consisting of intangible components such as services,
which is observed in many, but not all, countries implies that the growth rate of GDP
possibly over-estimates the growth rate of the physical wealth stock. This will bias the
results against finding a positive trend since disasters from past periods are scaled up
too strongly as a result of normalization.
3 GDP might also be positively affected by large disasters as repair and reconstruction increase
GDP.
4 It has also changed over time (see D’Adda and Scorcu 2003). Nevertheless Krugman (1992:
54f.) concludes that “there is a remarkable constancy of the capital-output ratio across
countries; there is also a fairly stable capital-output ratio in advanced nations. These
constancies have been well known for a long time and were in fact at the heart of the famous
Solow conclusion that technological change, not capital accumulation, is the source of most
growth.”
9
Keeping in mind that, for our global analysis, we use GDP per capita as a
proxy for wealth and that the product of population and GDP per capita equals total
GDP, equation (2) modifies to:
.. .
.s s s s
ttt t t
GDPdefl GDP Ins penetrationNorm Ins Loss Loss
GDPdefl GDP Ins penetration= ⋅ ⋅ ⋅ (3)
Regrettably, there is no data available on changes in insurance coverage as
such. As an approximation we use insurance penetration, which is defined as premia
divided by GDP (UNCTAD 2005: 7). For our global analysis, we use data on property
and, where available, also engineering insurance premia. For West Germany and the
US, however, we have data, including data for a longer time-series, on a subset of
property and engineering premia as well as premia on motor physical damage, which
relate more directly to insured values that can potentially be destroyed by natural
disasters and which we therefore take in lieu of all property and engineering insurance
premia. Only for the normalization of damage from temperature highs and
temperature lows do we exclude motor physical damage premia since vehicles can not
normally be damaged by these hazards. A full list of the detailed types of insurances,
for which premia are included in our analysis is shown in table 2.
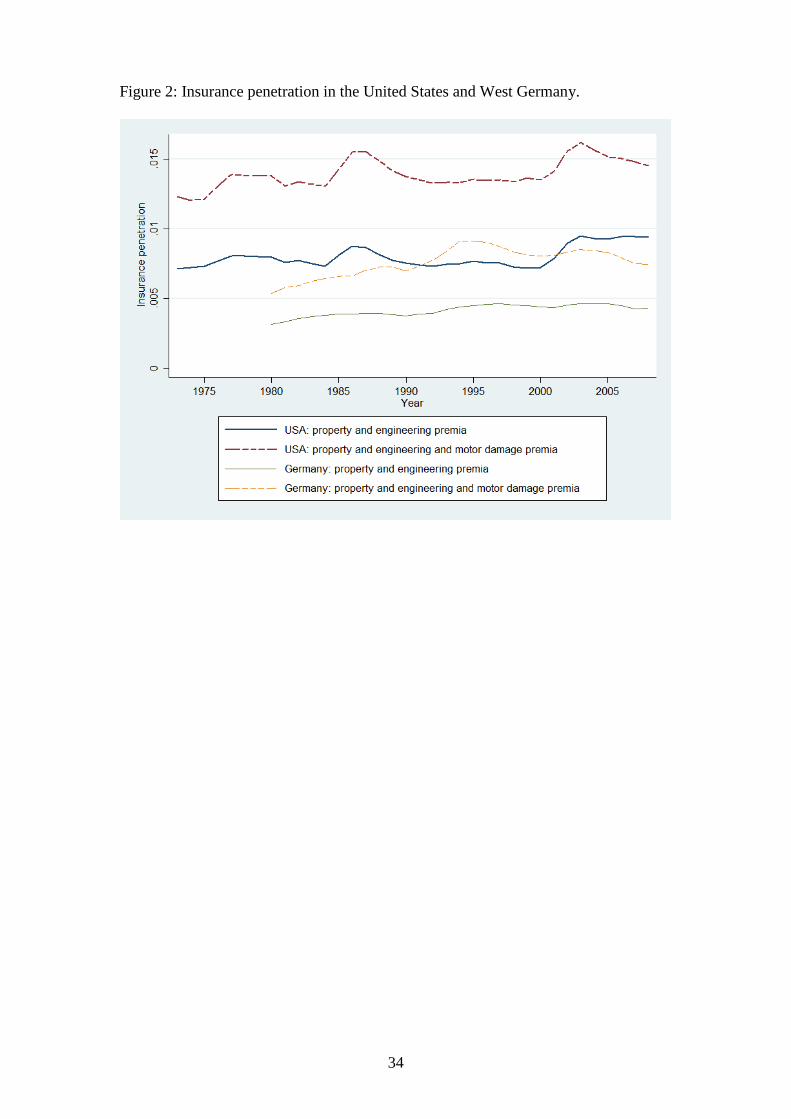
One problem with using insurance premia relative to GDP is that these can change
even if the share of insured wealth among all wealth remains the same and vice versa.
Insurance premia can, for example, change in response to changes in insurance pay-
outs resulting from changes in the frequency and/or intensity of insured loss events,
10
constituting the requirement of “risk adequate pricing” in the insurance industry.5 For
example, premia have increased following the 2004/05 hurricane seasons in parts of
the US. But on the whole, changes in property and engineering premia relative to
GDP should in the long run by and large represent an acceptable proxy for changes in
insurance penetration. For the German insurance market, Munich Re undertook an
analysis on the relationship between premia and total sum of insured values and found
the two to be very highly linearly correlated over time (figure 1).6 In general,
insurance penetration in West Germany and the US exhibit little volatility over time
(see figure 2).
Using insurance premia in a given year relative to total GDP in the same year
as a proxy for insurance penetration in equation (3), total GDP drops out and using
2008 as our chosen base year for normalization, we can write:
2008 2008 2008. . ttt t
GDPdefl Insurance premiaNorm Ins Loss Loss
GDPdefl Insurance premia= ⋅ ⋅ (4)
Normalization equation (4) is the one we use in our global analysis. The loss data in
the NatCatSERVICE database and the data on insurance premia are in USD. We
converted them into local currencies applying exchange rate data provided to us by
Munich Re to ensure we use the same exchange rates Munich Re uses to convert from
5 Furthermore, comparability of insured losses over time and space could be limited by
differences and changes in insurance conditions which affect the insured risk and the size of
losses, such as maximum coverage and deductibles (Changnon 2009a, Botzen et al. 2010).
6 For the US, due to lack of data no similar analysis could be undertaken on a market-wide
basis. Most likely, if data had been available such an analysis would have shown a lower
correlation because of market cycles and premia adjustments after large disasters (Munich Re,
personal communication).

11
local currency values into USD. With all data in local currency, we therefore also use
the GDP deflator of the country itself for our normalization purposes. Since for an
aggregate analysis of more than one country one needs to make normalized insured
loss comparable across countries, in the final step we then re-converted the
normalized insured losses from local currencies into USD.7
For West Germany and the US, not only do we have a longer time-series of
data on insured losses, but also GDP or income data are available for sub-national
administrative units, i.e. on a more fine-grained spatial resolution. The
NatCatSERVICE database provides a geo-reference of the disaster center which
allows us to match each disaster with the sub-national administrative unit in which its
centre occurred. For Germany, our spatial resolution is on the NUTS3 level (which
corresponds to ‘Landkreise’ and ‘Kreisfreie Städte’). Total GDP in constant Euros is
provided by Cambridge Econometrics (2010). We converted insured losses into Euro
using the exchange rate used by Munich Re. Since the analysis for West Germany is
thus in local currency units, we also used the GDP deflator for Germany and
normalized damage is expressed in Euros.8 Since loss data is less reliable for East
Germany before reunification, we restrict our analysis to West Germany. For this, the
share of insured loss of each event that occurred in the Western parts of Germany was
determined by Munich Re and only this loss is included in the analysis. Data on
insurance premia, however, is not separately available for West Germany. Since there
7 Alternatively, one can keep all values in USD and then apply the US GDP deflator for
normalization purposes. The two approaches lead to practically identical results.
8 Since we use GDP at different levels of spatial resolution for calculating insurance penetration
on the one hand and for wealth adjustment on the other for West Germany and the US, GDP
does not drop out of equation (3). As a consequence, equations (2) and (3) rather than equation
(4) are used for normalizing insured losses in Germany and the US.

12
was no private insurance market in the former German Democratic Republic, before
1990 only Western premia (and Western GDP) are used. Since 1990, both the GDP as
well as the insurance premia relate to the whole of the re-unified Germany.9
For the US, we have access to two alternative measures of wealth. Our first
measure is personal per capita income data taken from BEA (2010), at the county
level.10 Our second measure is a combination of information on the number and value
of housing units, with data at the state level. Data on housing units up to year 2000 are
taken from the National Historical Geographical Information System (NHGIS 2010),
estimates for later years are obtained from the US Census Bureau (2010a). Median
home value data is available until 2000 and taken from the US Census Bureau
(2010b). Both data on housing units and median house values are available on a
decadal basis for earlier years. Linear interpolation was used to fill the gaps. Values
on median home values for years after 2000 are obtained by linear extrapolation of all
previous values. To adjust losses both to the changes in the number and the median
value of housing units, the following equation is used:
9 This will inevitably create some (small) bias of unknown direction. To test the robustness of
our results, we assumed as a shortcut that the share of Western premia was equal to the share
of total disaster damage in the entire post-1990 period. Thus estimating, admittedly rather
crudely, Western premia and employing these in the normalization leads to qualitatively
similar results. In fact, the marginally insignificant upward trend in normalized damage from
all storms becomes significant at the 5 per cent level with this alternative premia measure.
10 Personal income is defined as the income received by all persons from all sources before the
deduction of personal taxes (BEA 2010) and reported in current USD and converted into
constant values with the US GDP deflator. Results are almost identical if we use GDP data at
the state level from the same source instead
13
.. .
.s s s s s
ttt t t t
GDPdefl Units MedVal Ins penetrationNorm Ins Loss Loss
GDPdefl Units MedVal Ins penetration= ⋅ ⋅ ⋅ ⋅ (5)
In line with existing normalization studies, to test for the existence of a trend,
the annual sum of normalized disaster losses from each year is regressed on a linear
year variable and an intercept:
2008tNormalized Insured Loss = α0 + β1yeart + tε (6)
A trend is statistically significant if the null hypothesis that β1 is equal to zero can be
rejected at the ten percent level or lower. Robust standard errors are employed in all
estimations.
4. Results from an Analysis of Trends in Normalized Insured Losses
In this section, we present the results from our analysis of trends in normalized
insured losses. We start with our global analysis, before analyzing in more detail
insured losses in the US and West Germany. Figure 3 displays the non-normalized,
i.e. merely deflated annual insured losses caused by all types of natural disasters from
1980 to 2008. The analysis covers 19,367 disasters, of which 2,553 resulted in a
known insured loss. Over the whole period, there is a positive and statistically
significant trend. The coefficient indicates an average annual increase of 1.4bn USD.
However, while the size of the coefficient is hardly affected if the sample is restricted
to start from 1990, the trend loses its significance. As mentioned already, shorter
time-series make the detection of a statistically significant trend less likely.
There is no statistically significant trend if we adjust insured losses for the
changes in the value of insured assets at risk, i.e. if we normalize insured disaster loss

14
(Figure 4). Losses before 1990 are not shown since we have data on insurance premia
only for few countries before 1990. The analysis still covers 13,055 disasters, with
1,785 of them resulting in a known damage claim to insurance companies.11
Some natural hazards will be practically unaffected by climate change and are
therefore irrelevant if one wants to detect whether climate change already has
potentially lead to increased insured damages. In Figure 5, we therefore excluded
geophysical disasters (earthquakes, rock falls, subsidence, volcanic eruptions, and
tsunamis) and only include the following disaster sub-types: landslides, blizzards, hail
storms, lightning, local windstorms, sandstorms, tropical cyclones, severe storms,
tornados, winter storms, avalanches, flash floods, general floods, storm surges, cold
and heat waves, droughts, winter damages, and wildfires.12 As before, no significant
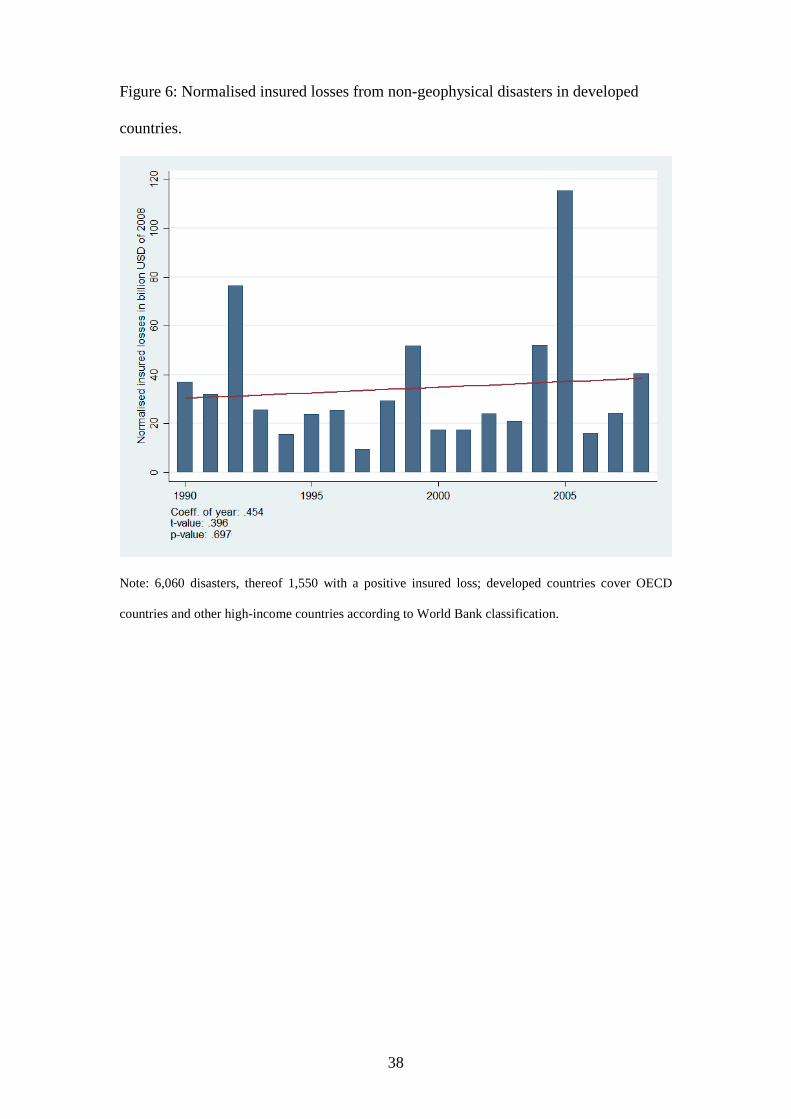
trend is discernible. Similarly, we do not find a significant trend if we constrain our
analysis to non-geophysical disasters in developed countries, which cover
11 To cover as many country-years as possible, we extrapolated data on insurance penetration for
some missing years such that the analysis is based on a balanced panel of countries. The
results are, however, fully robust if only countries with full time series in the original
insurance penetration data are included.
12 While landslides are generally geo-physical events, they are regularly triggered by sustained
wet conditions in a mountainous region. We dropped the landslides, which were classified as a
geo-physical event in the database, but kept those that were recorded as hydrological events.
However, none of the former and only five events of the latter resulted in a known insured
loss. Similarly, a subsidence might be driven by droughts as a consequence of which moist
and welled clay soils lose water and compact. The inclusion of 19 subsidence events with a
positive known insured loss in our global sample does not alter the results. For the US and
Germany, there are no such events with a positive insured loss.

15
Organisation of Economic Co-operation and Development (OECD) and other high-
income countries, according to World Bank classification (Figure 6).13
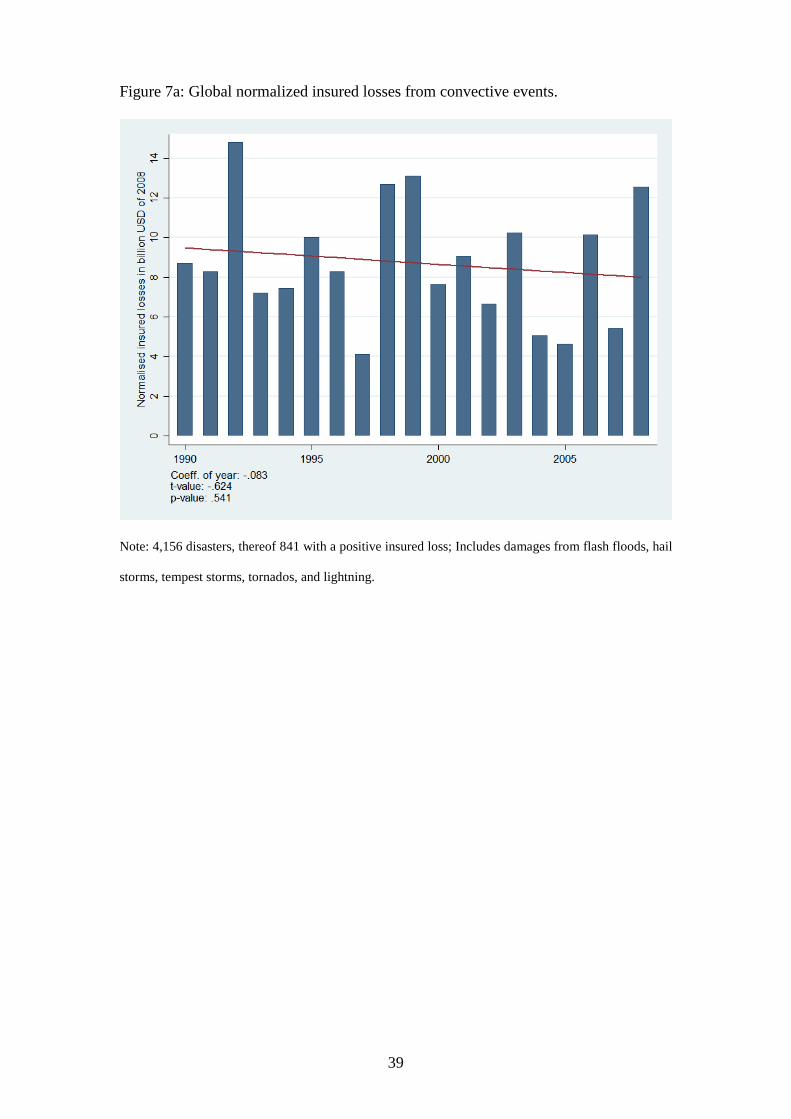
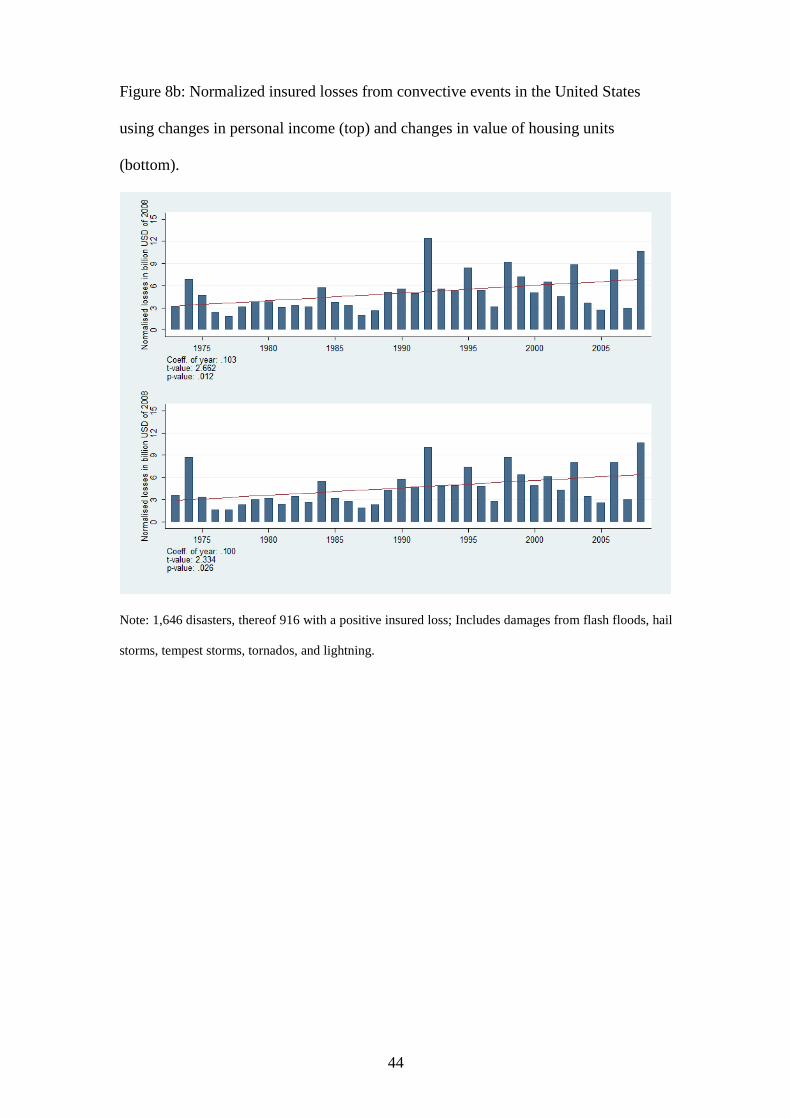
Convective events, i.e. flash floods, hail storms, tempest storms, tornados, and
lightning, deserve closer attention since these are likely to be particularly affected by
future global warming (Trapp et al. 2007, 2009; Botzen et al. 2009) and there is some
evidence that past climatic changes already affected severe thunderstorm activity in
some regions (Dessens 1995; Kunz et al. 2009). Figure 7a shows that there is no
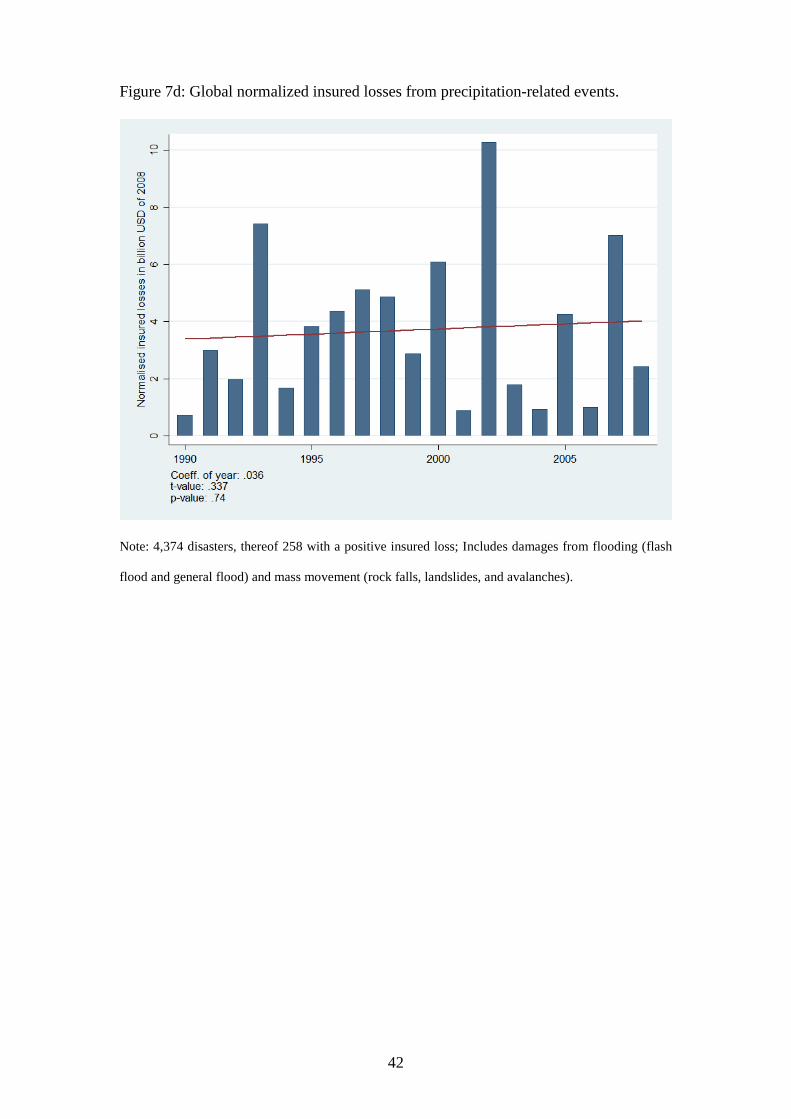
significant trend in global insured losses for these peril types. Similarly, there is no
significant trend in insured losses for storm events (Figure 7b), tropical cyclones
(Figure 7c) or precipitation-related events (Figure 7d).14
As mentioned already, a statistically significant trend is harder to establish for
a shorter time-series. Hence, we separately analyzed in some detail natural disasters
occurring in the two countries for which data on insured losses and insurance premia
are available for the longest time period, namely the United States and Germany,
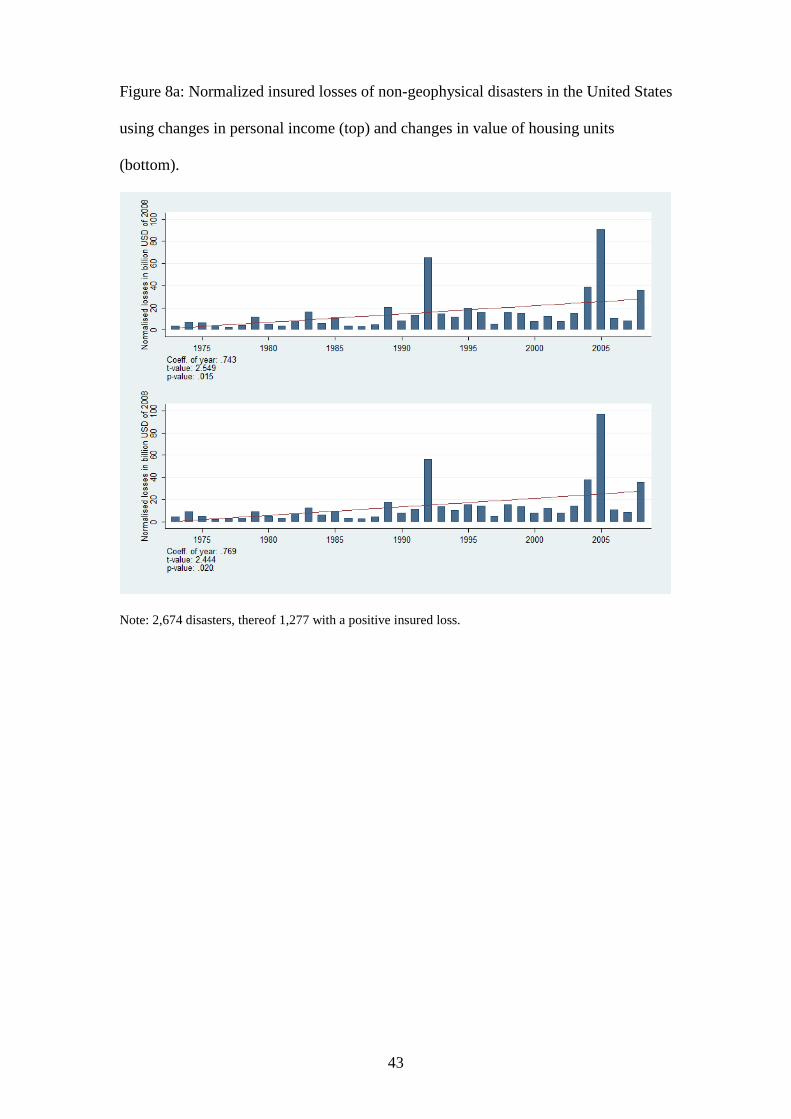
which are also major insurance markets of course. Figure 8a illustrates normalized
insured losses from non-geophysical disasters that occurred in the United Stated over
the period 1973 to 2008. Losses normalized using changes in personal income as a
proxy for changes in wealth are shown in the upper panel, while we used the
alternative proxy of changes in the number and value of housing units to adjust losses
in the lower panel. The results for both approaches are virtually identical. Moreover,
in non-reported analysis we found that results are very similar if we use GDP changes
at the country rather than at the state level. We take this as evidence for the robustness
of the results in our global analysis for which we had to resort to changes in GDP at 13 We show no graphs for developing countries separately as insurance penetration is very low
and insurance coverage is typically restricted to major cities in middle- and upper middle-
income developing countries.
14 Precipitation-related events encompass both floods and wet mass movements.

16
the country level as a proxy for changes in wealth. We find a positive trend in
normalized insured losses from non-geophysical disasters in the US, which is
statistically significant at the 5 percent level. This remains true if the large outlier due
to hurricane Katrina in 2005 is excluded.
In the remaining analysis of insured losses in the US, we examine specific
subsets of the non-geophysical disasters. Figure 8b shows that there is also a
statistically significant upward trend if the analysis is restricted to convective events,
i.e. flash floods, hail storms, tempest storms, tornados, and lightning. There is also a
positive trend in insured damage from US flooding events, which includes both flash
floods and general floods (Figure 8c). The same is true for events caused by
temperature highs (Figure 8d). There is however, no significant trend for events
caused by temperature lows (Figure 8e). If we look at winter storms (Figure 8f),
which also include snow storms and blizzards, we find a significant upward trend. The
same is true for the category all storms except tropical cyclones, which besides winter
storms include convective storms (hail storm, tempest storms, tornado, and lightning),
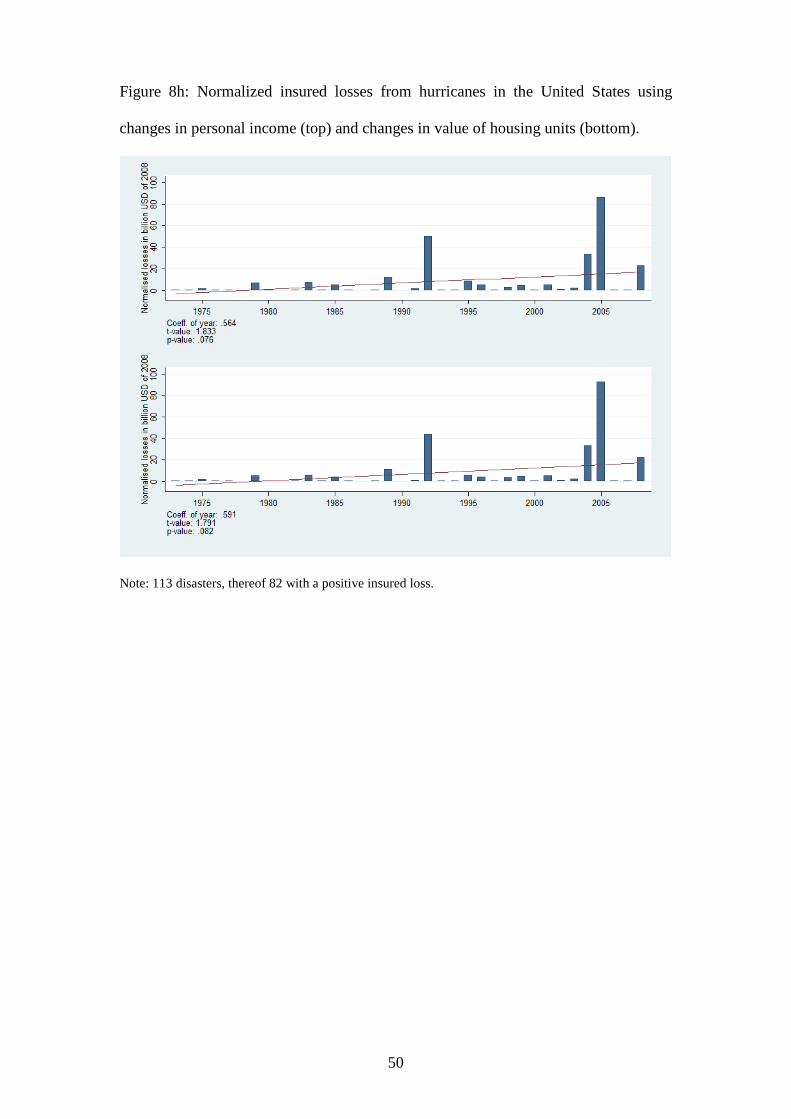
sand storms and storm surges (figure 8g). Focusing on hurricanes, an upward trend in
insured losses is found, which is statistically significant at the 10 percent level (Figure
8h).
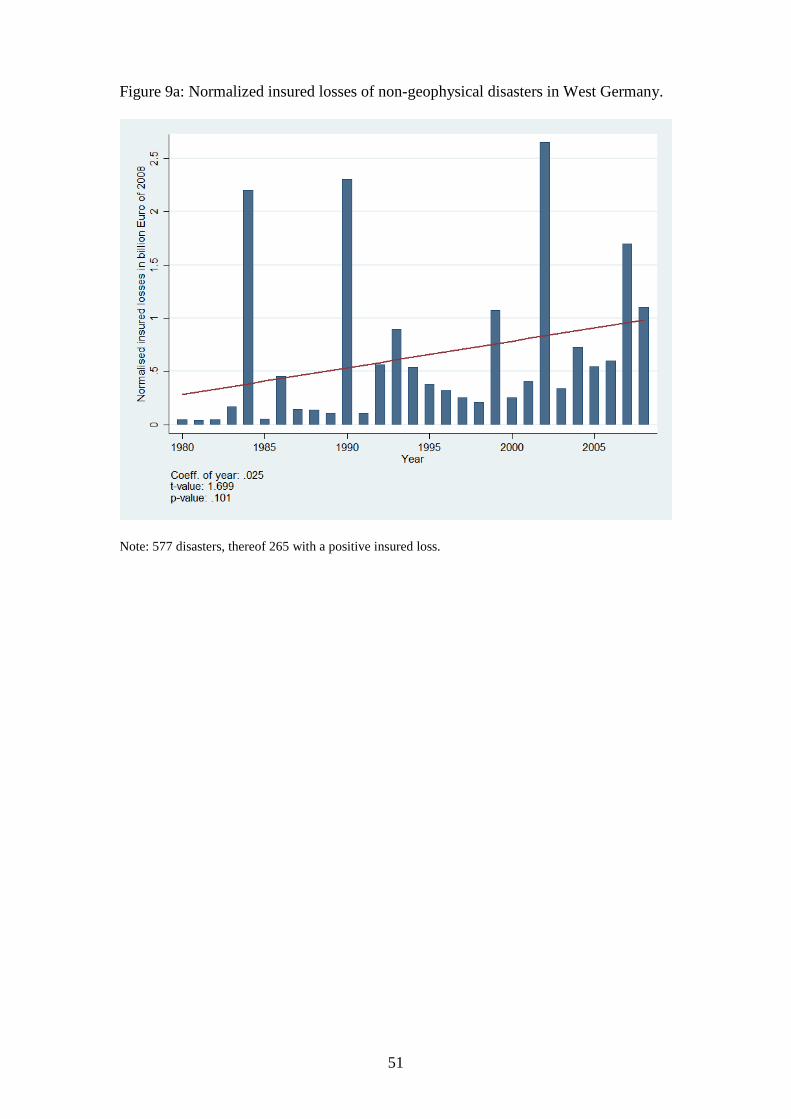
Turning to West Germany, the trend in insured loss from non-geophysical
disasters is marginally significant at the 10 percent level (figure 9a), despite the
volatility introduced by the four strong loss spikes in 1984 (predominantly caused by
Munich hail storm), 1990 (predominantly winter storm series), 2002 (predominantly
river flooding along the Elbe, Danube and contributory rivers and a winter storm in
late October, even though the flood disaster mainly affected East Germany) and 2007
(predominantly winter storm Kyrill). If these events are excluded, the trend becomes
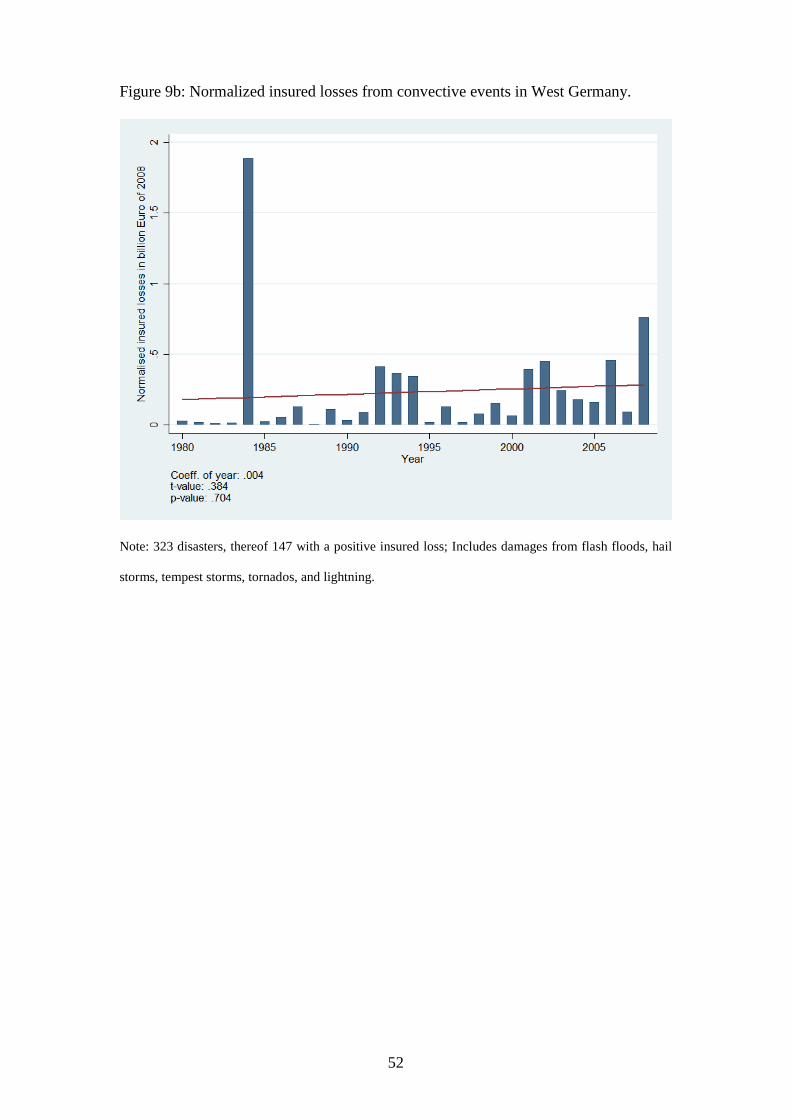
significant at the five percent level. For convective events (figure 9b), however, no

17
such significant trend can be established unless the large outlier from 1984 (Munich
hail storm) is dropped from the analysis. Figure 9c, which shows normalized loss
from flooding similarly demonstrates by just how much single outliers, like the
massive damage caused by the floods in 2002, can dominate the entire picture.
However, with or without this outlier, there is no significant trend. Contrarily, there is
a trend, which is significant at the 10 percent level, in normalized insured loss from
winter storms (figure 9d). The upward trend for the category of all storms (figure 9e)
only marginally fails to reach conventional significance thresholds. Note that for
Germany hurricanes are irrelevant and there are very few events related to
temperature highs and temperature lows. These disaster types are therefore not
included in our analysis for Germany.
Table 3 compares and contrasts our findings with those of previous studies.
For most of our analyses, however, there is no truly comparable previous work, either
because no previous study exists or because existing studies analyze different time
periods as well as, for the most part, economic rather than insured loss. With these
caveats in mind our finding of a positive trend for non-geophysical disasters is not in
line with Changnon et al. (2000). However, the study periods of these two analyses
differ considerably (1949 to 1996 as opposed to 1973 to 2008). On the one hand,
longer study periods are in principle preferable, but by missing out more recent data,
this older study may fail to capture the very period in which increases in trends could
be most likely. While our results for storms in the United States corroborate earlier
findings by Changnon (2001, 2009a), contrary to Changnon (2007) we do not detect a
positive trend for winter storms in the US. While we find a positive trend for floods in
the United States, no such trend has been found by Downton et al (2005) in their study
covering a much longer time period (1926 to 2000). The same is true for our
hurricanes results in the US, where our positive trend since 1973 does not match the

18
findings by Pielke and Landsea (1998) and Pielke et al (2008) in their study from
1925 and 1900, respectively, onwards. Our results are, however, in line with studies
by Schmidt et al. (2009) who find a positive trend for a similar study period as ours.
Where this paper’s analysis of insured loss overlaps with our previous study of total
economic loss (Neumayer and Barthel 2011), the findings are largely consistent.
How do our findings of positive trends in non-geophysical disasters and
specific sub-types in the US and Germany compare to the evidence on trends in
extreme weather events? There are many difficulties, which hamper such a
comparison. To start with, our study periods of 1973-2008 and 1980-2008 do not
necessarily overlap with the periods analyzed in the studies examining trends in
extreme weather events. Second, such studies often are not undertaken at the country
level or, if they are, not necessarily for Germany and the US. Third, lack of data and
particularly of reliable time-series often prevent scientists from analyzing trends in
extreme weather events. For example, the IPCC (2007: 308) concludes that
‘observational evidence for changes in small-scale severe weather phenomena (such
as tornadoes, hail and thunderstorms) is mostly local and too scattered to draw general
conclusions’.15 With these caveats in mind, there is evidence for increases in heavy
and very heavy precipitation events (IPCC 2007: 315; Peterson et al. 2008) and in
tropical storm and hurricane intensities and durations (IPCC 2007: 315; Elsner,
Kossin and Jagger 2008) as well as, possibly, in hurricane frequency (US Climate
15 See, however, Schiesser (2003) who reports evidence on increased frequency of strong
hailstorm events in Switzerland after 1980 and, similarly, Kunz, Sander and Kottmeier (2009)
for the South-West of Germany. Also, Botzen, Bouwer and van den Bergh (2010) find a
strong correlation between minimum temperatures (see, similarly, Dessens 1995) as well as
precipitation and total agricultural hailstorm damage in the Netherlands. Since there has been
higher precipitation and higher minimum temperatures in Northern latitudes, an increase in the
frequency and/or intensity of extreme hailstorm events is likely.

19
Change Science Program 2008: 35) in North America, consistent with our finding of
positive trends in normalized flooding and hurricane losses in the US.
Another question is to what extent it is likely that anthropogenic emissions
have contributed to this observed increase in some extreme weather events. Using an
‘optimal fingerprinting technique’ and comparing observed to multi-model simulated
changes in extreme precipitation over the second half of the 20th century, Min et al.
(2011: 378) come to the conclusion ‘that human-induced increases in greenhouse
gases have contributed to the observed intensification of heavy precipitation events
found over approximately two-thirds of data-covered parts of Northern Hemisphere
land areas.’ Based on a ‘probabilistic event attribution’ framework, Pall et al. (2011)
conclude ‘that it is very likely that global anthropogenic greenhouse gas emissions
substantially increased the risk of flood occurrence in England and Wales in autumn
2000’. For tropical storms and hurricanes, however, there is considerable natural
variability, which may well explain the increase in normalized hurricane damage
since 1973. After acknowledging the many problems posed by ‘substantial limitations
in the availability and quality of global historical records of tropical cyclones’ for
attributing any trends to anthropogenic greenhouse gas emissions, Knutson et al.
(2010: 157) come to the conclusion that ‘it remains uncertain whether past changes in
any tropical cyclone activity (frequency, intensity, rainfall, and so on) exceed the
variability expected through natural causes, after accounting for changes over time in
observing capabilities’.
5. Conclusion
Climate change neither is nor should be the main concern for the insurance industry.
The accumulation of wealth in disaster-prone areas is and will always remain by far
the most important driver of future economic disaster damage. Nevertheless,
20
insurance companies are concerned about climate change as the predicted increase in
the frequency and/or intensity of natural hazards is likely to lead to higher economic
and, ceteris paribus, higher insured damage in the future, unless defensive mitigating
measures make exposed wealth less vulnerable to the impact of hazards.
In this article, we have analyzed whether one can detect a trend in data on
insured damage from natural disasters. Whilst we have not found any evidence that
normalized insured damage has trended upward at the global level, for developed
countries and independently of the type of disaster looked at, our detection of an
upward trend in insured losses from non-geophysical disasters and certain specific
disaster sub-types in the US, the biggest insurance market in the world, and in West
Germany represents a finding to be taken seriously in the risk analysis undertaken by
insurance and re-insurance companies.
As in the interpretation of trends in all economic losses (Neumayer and
Barthel 2011), much caution is required in correctly interpreting our findings. In
particular, we cannot normalize for changes in mitigating measures, which, if
increasingly undertaken over time, would reduce countries’ vulnerability to the impact
of natural disasters and thus bias the analysis against finding significant upward
trends. What the results tell us is that, based on the very limited time-series data we
have for most countries, there is no evidence so far for a statistically significant
upward trend in normalized insured loss from extreme events outside the US and
West Germany. There could have been more frequent and/or more intensive weather-
related natural disasters even in these other places, but our study could have simply
been incapable of detecting them. In addition to our inability to take into account
defensive mitigating measures undertaken by rational individuals and governments,
which could translate into lower insured damage compared to the damage in the
absence of defensive mitigation, the time period 1990 to 2008 may simply be too

21
short to find significant trends in our global analysis. It is noteworthy that for the US
and West Germany, for which we can analyze normalized loss from, respectively,
1973 and 1980 onwards, we do find a significant increase in normalized insured
losses for all non-geophysical disasters and some disaster sub-types over time.
By the same token, we warn against taking the findings for the US and
Germany as conclusive evidence that climate change has already caused more
frequent and/or more intensive natural disasters affecting this country. To start with,
one needs to be careful in attributing such a trend to anthropogenic climate change,
i.e. climate change caused by man-made greenhouse gas emissions. Our findings
reported in this article could be down to natural climate variability that has nothing to
do with anthropogenic climate change. Such natural climate variability may well
explain our finding of a significant upward trend in insured loss from hurricanes in the
US, for example.
Alternatively, our findings of upward trends could be driven by insurance
penetration representing a poor proxy for the share of insured assets at risk. As
another potential contributing factor, there are some drivers of change on the
insurance side that might have contributed to more expensive disasters and are hard to
quantify. For instance, insured losses can also be influenced by changes in insurance
coverage and claims handling procedures and the costs of these. Such changes could
have had an effect on insured losses over the past decades, but are very difficult to
quantify. Claiming on insurance policies for damage caused by weather-related
disasters could have gone up over time. There is also the moral hazard problem. It is
well known that with the knowledge of being insured, individuals take less care to
avoid and mitigate damage than in the absence of insurance. If such moral hazard
problems became more prevalent over time (for which we have no evidence, but
22
cannot exclude as a possibility either), then this would lead to an increasing trend in
normalized insured damages over time, all other things equal.
Lastly, our findings could be driven by reporting bias if insured loss from
early periods is systematically under-reported and thus under-represented in our
analysis. However, for the US and West Germany a significant reporting bias
regarding the more substantial losses is much less likely than for other countries,
given these are two of the biggest insurance markets in the world. In sum, therefore,
before any firm conclusions can be drawn from our results, more research is needed to
analyze which of these potential explanatory factors, of which anthropogenic climate
change is but one possibility, or which combination of factors drive the observed
upward trends in normalized insured disaster damage in the US and West Germany.

23
References
Barredo, J.I., 2009, Normalised flood losses in Europe: 1970–2006, Natural Hazards
and Earth Systems Sciences, 9, pp. 97-104.
BEA, 2010, Regional Economic Accounts, available at: http://www.bea.gov/regional/
index.htm.
Botzen, W.J.W., Laurens M. Bouwer, and Jeroen J.C.J.M. van den Bergh, 2010,
Climate change and hailstorm damage: empirical evidence and implications for
agriculture and insurance, Resource and Energy Economics 32, pp. 341-362.
Bouwer, Laurens M., 2011, Have past disaster losses increased due to anthropogenic
climate change?, Bulletin of the American Meteorological Society (forthcoming).
doi: 10.1175/2010BAMS3092.1.
Brooks, Harold E. and Charles A. Doswell, 2001, Normalized Damage from Major
Tornados in the United States: 1890-1999, Weather and Forecasting, 16, pp.
168-176.
Cambridge Econometrics, 2010, European Regional Data, Cambridge, UK.
Changnon, Stanley A. and Joyce M. Changnon, 1992, Storm Catastrophes in the
United States, Natural Hazards, 6, pp. 93-107.
Changnon, Stanley A., Roger A. Pielke, David Changnon, Richard T. Sylves and
Roger Pulwarty, 2000, Human Factors Explain the Increased Losses from
Weather and Climate Extremes, Bulletin of the American Meteorological
Society, 81(3), pp. 437-442.
Changnon, Stanley A., 2001, Damaging Thunderstorm Activity in the United States,
Bulletin of the American Meteorological Society, 82(4), pp. 597-608.
Changnon, Stanley A., 2003, Shifting Economic Impacts from Weather Extremes in
the United States: A Result of Societal Changes, Not Global Warming, Natural
Hazards, 29, pp. 273-290.

24
Changnon, Stanley A., 2007, Catastrophic winter storms: An escalating problem,
Climatic Change, 84, pp. 131-139.
Changnon, Stanley A., 2009a, Temporal and spatial distributions of wind storm
damages in the United States, Climatic Change, 94, pp. 473-482.
Changnon, Stanley A., 2009b, Increasing major hail losses in the U.S., Climatic
Change, 96, pp. 161-166.
Crompton, Ryan P. and K. John McAneney, 2008, Normalised Australian insured
losses from meteorological hazards: 1967-2006, Environmental Science &
Policy, pp. 371-378.
D’Adda, Carlo and Antonello E. Scorcu, 2003, On the Time Stability of the Output-
capital Ratio, Economic Modelling, 20, pp. 1175-1189.
De Ronde, J.G., J.P.M. Mulder, and R. Spanhoff, 2003, Morphological Developments
and Coastal Zone Management in the Netherlands, International Conference on
Estuaries and Coasts November 9-11, 2003, Hangzhou, China.
Dessens, J., 1995, Severe convective weather in the context of a nighttime global
warming. Geophysical Research Letters, 22 (10), pp. 1241–1244.
Downton, M., J. Z. B. Miller, and R. A. Pielke Jr., 2005, Reanalysis of U.S. National
Weather Service flood loss database, Natural Hazards Review, 6, pp. 13-22.
Elsner, J. P., J.P. Kossin, and T. H. Jagger, 2008, The increasing intensity of the
strongest tropical cyclones, Nature 455, pp. 92-95.
Institute for Business and Home Safety, 2008, The Benefits of Modern Wind
Resistant Building Codes on Hurricane Claim Frequency and Severity – A
Summary Report; available at: http://www.ibhs.org/newsroom/downloads
/20070810_102941_10167.pdf.
IPCC, 2001, Climate Change 2001: Impacts, Adaptation, and Vulnerability, New
York: Cambridge University Press.

25
IPCC, 2007a, Climate Change 2007: The Physical Science Basis, New York:
Cambridge University Press.
IPCC, 2007b, Climate Change 2007: Impacts, Adaptation, and Vulnerability, New
York: Cambridge University Press.
Karl, Thomas R., Gerald A. Meehl, Christopher D. Miller, Susan J. Hassol, Anne M.
Waple, and William L. Murray (eds.), 2008, Weather and Climate Extremes in a
Changing Climate. Regions of Focus: North America, Hawaii, Caribbean, and
U.S. Pacific Islands, Report by the US Climate Change Science Program and the
Subcommittee on Global Change Research, Synthesis and Assessment Product
3.3. http://downloads.climatescience.gov/sap/sap3-3/sap3-3-final-all.pdf.
Katz, R. W., 2002, Stochastic modeling of hurricane damage, Journal of Applied
Meteorology, 41(7), pp. 754-762.
Knutson, Thomas R., John L. McBride, Johnny Chan, Kerry Emanuel, Greg Holland,
Chris Landsea, Isaac Held, James P. Kossin, A. K. Srivastava and Masato Sugi,
2010, Tropical cyclones and climate change. Nature Geoscience, 3, 157-163.
Krugman, Paul, 1992, Comment. NBER Macroeconomics Annual, 7, pp. 54-56.
Kunz, M., J. Sander and Ch. Kottmeier, 2009, Recent trends of thunderstorm and
hailstorm frequency and their relation to atmospheric characteristics in
southwest Germany, International Journal of Climatology, 29, pp. 2283-2297.
Lavery, Sarah and Bill Donovan, 2005, Flood risk management in the Thames Estuary
looking ahead 100 years, Philosophical Transactions of the Royal Society A,
363, pp. 1455-1474.
Miller, Stuart, Robert Muir-Wood and Auguste Boissonade, 2008, An exploration of
trends in normalized weather-related catastrophe losses, in: Diaz, Henry F. and
Richard J. Murnane (eds), Climate Extremes and Society, pp. 225-247. New
York: Cambridge University Press.

26
Min, Seung-Ki, Xuebin Zhang, Francis W. Zwiers, and Gabriele C. Hegerl, 2011,
Human contribution to more-intense precipitation extremes, Nature 470, pp.
378-381.
Neumayer, Eric and Fabian Barthel, 20102011, Normalizing Economic Loss from
Natural Disasters: A Global Analysis. Global Environmental Change, 21(1), pp.
13-24. doi:10.1016/j.gloenvcha.2010.10.004.
NHGIS, 2010, Census of Population and Housing 1970-2010, available at:
http://data.nhgis.org/nhgis/.
Nordhaus, William D., 2010, The economics of hurricanes and implications of global
warming, Climate Change Economics, 1, pp. 1-20.
Pall, Pardeep, Tolu Aina, Dáithi A. Stone, Peter A. Stott, Toru Nozawa, Arno G.J.
Hilberts, Dag Lohmann, and Myles R. Allen, 2011, Anthropogenic greenhouse
gas contribution to flood risk in England and Wales in autumn 2000, Nature 470,
pp. 382-385.
Peterson, Thomas C., Xuebin Zhang, Manola Brunet-India, and Jorge Luis Vázquez-
Aguirre, 2008, Changes in North American extremes derived from daily weather
data, Journal of Geophysical Research, 113, D07113.
Pielke, R. A., Jr., Gratz, J., Landsea, C. W., Collins, D., Saunders, M. A., and
Musulin, R., 2008, Normalized hurricane damages in the United States: 1900–
2005, Natural Hazards Review, 9(1), pp. 29-42.
Pielke, Roger A. Jr. and Christopher W. Landsea, 1998, Normalized Hurricane
Damages in the United States: 1925-1995, Weather and Forecasting, Sept. 1998,
pp. 621-631.
Pielke, Roger A. Jr., Christopher W. Landsea, Rade T. Musulin and Mary Downton,
1999, Evaluation of Catastrophe Models using a Normalized Historical Record,
Journal of Insurance Regulation, 18(2), pp. 177-194.

27
Pielke, Roger A. Jr., Jose Rubiera, Christopher Landsea, Mario L. Fernández, and
Roberta Klein, 2003, Hurricane Vulnerability in Latin America and The
Caribbean: Normalized Damages and Loss Potentials, Natural Hazards Review,
4(3), pp. 101-114.
Raghavan, S. and S. Rajseh, 2003, Trends in Tropical Cyclone Impact: A Study in
Andhra Pradesh, India, American Meteorological Society, 84, pp. 635-644.
Schiesser, Hans-Heinrich, 2003, Hagel. In: Extremereignisse und Klimaänderung.
Bern: Organe consultatif sur les changements climatiques (OcCC). pp. 65–68.
Bern. http://www.proclim.ch/4dcgi/occc/fr/Report?859.
Schmidt, Silvio, Claudia Kemfert and Peter Höppe, 2009, Tropical cyclone losses in
the USA and the impact of climate change — A trend analysis based on data
from a new approach to adjusting storm losses, Environmental Impact
Assessment Review, 29, pp. 359-369.
Schwab, Anna K., Katherine Eschelbach and David J. Brower, 2007, Hazard
Mitigation and Preparedness. Hoboken: Wiley & Sons.
Trapp, Robert J., Noah S. Diffenbaugh, and Alexander Gluhovsky, 2009, Transient
response of severe thunderstorm forcing to elevated greenhouse gas
concentrations, Geophysical Research Letters, 36, L01703.
Trapp, Robert J., Noah S. Diffenbaugh, Harold E. Brooks, Michael E. Baldwin, Eric
D. Robinson, and Jeremy S. Pal, 2007, Changes in severe thunderstorm
environment frequency during the 21st century caused by anthropogenically
enhanced global radiative forcing, Proceedings of the National Academy of
Sciences of the United States of America, 104, pp. 19719-19723.
UNCTAD (2005), Trade and Development Aspects of Insurance Services and
Regulatory Frameworks, Geneva: UNCTAD; available at
http://www.unctad.org/en/docs/ditctncd200515_en.pdf.

28
US Census Bureau, 2010a, Population Estimates: Housing Units, available at:
http://www.census.gov/popest/housing/.
US Census Bureau, 2010b, Historical Census of Housing Tables: Home Values,
available at: http://www.census.gov/hhes/www/housing/census/historic /values.
html.
Vranes, Kevin and Roger Pielke Jr., 2009, Normalized Earthquake Damage and
Fatalities in the United States: 1900-2005, Natural Hazards Review, 10(3), pp.
84-101.
Weather Service flood loss database, Natural Hazards Review, 6, pp. 13-22.
World Bank, 2010, World Development Indicators Online Database. Washington,
DC: World Bank.

29
Table 1: Average insured losses and disaster counts per sub-type.
Average positive loss per event Disaster subtype Global Germany United States All disasters 245.5 103.7 385.2 2,553 274 1,047
Avalanches 250.1 - - 1
Blizzard/ snow storm 245.3 195.6 315.6 32 1 18
Cold wave 242.9 210.6 - 10 3
Drought 299.4 - 409.9 14 9
Flash flood 64.3 20.7 61.5 63 4 9
General flood 176.7 166.5 194.2 268 18 46
Earthquake 344.5 8.9 1537.5 107 1 15
Hailstorm 92.4 116.5 143.4 213 25 67
Heat wave 16.2 11.5 - 3 1
Lightning - - -
Landslide 60.9 - - 5
Local windstorm 21.1 67.4 33.6 76 12 6
Rock fall - - -
Sandstorm 16.3 - - 1
Storm surge 2.1 2.1 - 1 1
Subsidence 591.6 - - 23
Tropical cyclone 921.8 - 2,855.0 292 74
Tempest storm 112.5 48.6 155.0 765 100 479
Tornado 145.6 6.9 185.2 185 17 139
Tsunami 8.3 - - 2 Volcanic eruption 86.5 - 61.2 9 1
Winter damage 271.7 100.5 279.2 55 5 31
Wildfire 165.5 - 211.1 79 54
Winter storm 222.3 177.7 204.3 349 86 99
Note: All values in non-normalized million USD of 2008; Number of events in italics.
30
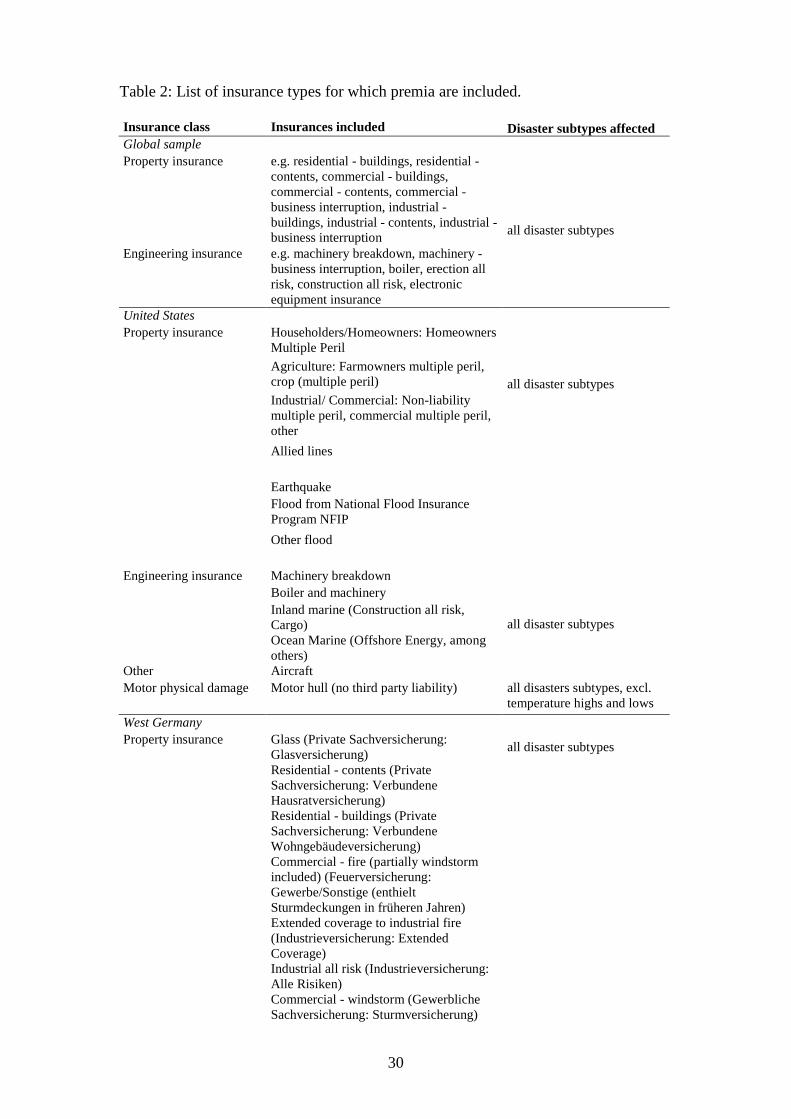
Table 2: List of insurance types for which premia are included.
Insurance class Insurances included Disaster subtypes affected Global sample Property insurance e.g. residential - buildings, residential -
contents, commercial - buildings, commercial - contents, commercial - business interruption, industrial - buildings, industrial - contents, industrial - business interruption
Engineering insurance e.g. machinery breakdown, machinery - business interruption, boiler, erection all risk, construction all risk, electronic equipment insurance
all disaster subtypes
United States Property insurance Householders/Homeowners: Homeowners
Multiple Peril
Agriculture: Farmowners multiple peril, crop (multiple peril)
Industrial/ Commercial: Non-liability multiple peril, commercial multiple peril, other
all disaster subtypes
Allied lines
Earthquake Flood from National Flood Insurance
Program NFIP
Other flood
Engineering insurance Machinery breakdown Boiler and machinery Inland marine (Construction all risk,
Cargo) Ocean Marine (Offshore Energy, among
others) Other Aircraft
all disaster subtypes
Motor physical damage Motor hull (no third party liability) all disasters subtypes, excl. temperature highs and lows
West Germany Property insurance Glass (Private Sachversicherung:
Glasversicherung) Residential - contents (Private
Sachversicherung: Verbundene Hausratversicherung)
Residential - buildings (Private Sachversicherung: Verbundene Wohngebäudeversicherung)
Commercial - fire (partially windstorm included) (Feuerversicherung: Gewerbe/Sonstige (enthielt Sturmdeckungen in früheren Jahren)
Extended coverage to industrial fire (Industrieversicherung: Extended Coverage)
Industrial all risk (Industrieversicherung: Alle Risiken)
Commercial - windstorm (Gewerbliche Sachversicherung: Sturmversicherung)
all disaster subtypes
31
Agriculture - animal (Landwirtschaftliche Sachversicherung: Tier)
Agriculture - hail (Landwirtschaftliche Sachversicherung: Hagel)
Engineering insurance Machinery breakdown (Technische Versicherung: Maschinenversicherung)
Errection/construction (Technische Versicherung: Montageversicherung)
Electronics/electric devices (Technische Versicherung: Elektronik/Schwachstrom)
Construction work (Technische Versicherung: Bauleistung)
Machinery - business interruption (Technische Versicherung: Maschinen-Betriebsunterbrechungsversicherung)
all disaster subtypes
Motor physical damage Motor hull (no third party liability) (Kraftfahrzeugkaskoversicherung)
all disasters subtypes, excl. temperature highs and lows
Notes: For the global sample, only examples given as insurance markets differ and not all products are
available on all insurance markets; Engineering insurance data not available for all countries; for those,
only property insurance premia used.

32
Table 3: Comparison of our results with previous studies
This paper’s analysis Comparable analyses
Disaster type Region Study period Results Study
Study period Results Remarks
All disasters Global 1990-2008 no trend Neumayer and Barthel 2011 1980-2009 no trend economic loss Non-geophysical Global 1990-2008 no trend Miller et al. 2008
Neumayer and Barthel 2011
1950-2005 1980-2009
no trend since 1950/ positive trend since 1970 no trend
economic loss economic loss
Non-geophysical Developed countries 1990-2008 no trend Neumayer and Barthel 2011 1980-2009 no trend economic loss Convective events Global 1990-2008 no trend Neumayer and Barthel 2011 1980-2009 no trend economic loss Storm events (excl. tropical cylcones)
Global 1990-2008 no trend Neumayer and Barthel 2011 1980-2009 no trend economic loss
Tropical cyclones Global 1990-2008 no trend Neumayer and Barthel 2011 1980-2009 no trend economic loss Precipitation-related events
Global 1990-2008 no trend Neumayer and Barthel 2011 1980-2009 no trend economic loss
Non-geophysical United States 1973-2008 positive trend Changnon et al. 2000 1950-1996 no trend Convective events United States 1973-2008 positive trend Neumayer and Barthel 2011 1970-2009 positive trend economic loss Flooding United States 1973-2008 positive trend Downton et al. 2005 1926-2000 no trend economic loss Temperature highs United States 1973-2008 no trend no previous study Temperature lows United States 1973-2008 no trend no previous study Winter storms United States 1973-2008 no trend Changnon 2007 1949-2003 positive trend All storms United States 1973-2008 positive trend Changnon 2001
Changnon 2003 Changnon 2009a
1949-1998 1950-1997 1952-2006
increase since 1974 no trend increase since 1992
only thunderstorms storms and floods only windstorms
Hurricanes United States 1973-2008 positive trend Pielke and Landsea 1998 Pielke et al. 2008 Neumayer and Barthel 2011
1925-1995 1900-2005 1970-2009
no trend no trend no trend
economic loss economic loss economic loss
Schmidt et al. 2009 1950-2005 no trend since 1950/ positive trend since 1970
economic loss
Nordhaus 2010 1900-2008 positive trend since 1900 economic loss Non-geophysical West Germany 1980-2008 positive trend no previous study Convective events West Germany 1980-2008 no trend no previous study Flooding West Germany 1980-2008 no trend no previous study Winter storms West Germany 1980-2008 positive trend no previous study All storms West Germany 1980-2008 no trend (marginal) no previous study

33
Figure 1: Correlation of total sum insured and total premia in Germany.
Notes: R-squared of regression 0.983. Analysis covers period from 1993 to 2009; Due to data
availability, only values for insurance types residential – buildings (Verbundene
Wohngebäudeversicherung), residential – contents (Verbundene Hausratsversicherung), commercial
wind storm – buildings & contents (Gewerbliche Sturmversicherung), and crop hail insurance
(Landwirtschaftliche Hagelversicherung) are included. In 2009, premia for these insurance types
constituted 67 percent of all premia for property and engineering insurance affected by natural
disasters.
34
Figure 2: Insurance penetration in the United States and West Germany.

35
Figure 3: Global deflated insured losses from natural disasters.
Note: 19,367 disasters, thereof 2,553 with a positive insured loss for whole period, 14,876 (1,855) for
the period from 1990.

36
Figure 4: Global normalised insured losses from all disasters.
Note: 13,055 disasters, thereof 1,785 with a positive insured loss.

37
Figure 5: Global normalised insured losses from non-geophysical disasters.
Note: 11,423 disasters, thereof 1,678 with a positive insured loss.
38
Figure 6: Normalised insured losses from non-geophysical disasters in developed
countries.
Note: 6,060 disasters, thereof 1,550 with a positive insured loss; developed countries cover OECD
countries and other high-income countries according to World Bank classification.
39
Figure 7a: Global normalized insured losses from convective events.
Note: 4,156 disasters, thereof 841 with a positive insured loss; Includes damages from flash floods, hail
storms, tempest storms, tornados, and lightning.

40
Figure 7b: Global normalized insured losses from all storm events except tropical
cyclones.
Note: 4,369 disasters, thereof 1,128 with a positive insured loss; Includes damages from winter storms
(winter storm and blizzard/ snow storm), convective storms (hail storm, tempest storm, tornado, and
lightning), sand storms, local windstorms, and storm surges.

41
Figure 7c: Global normalized insured losses from tropical cyclones.
Note: 874 disasters, thereof 176 with a positive insured loss.
42
Figure 7d: Global normalized insured losses from precipitation-related events.
Note: 4,374 disasters, thereof 258 with a positive insured loss; Includes damages from flooding (flash
flood and general flood) and mass movement (rock falls, landslides, and avalanches).
43
Figure 8a: Normalized insured losses of non-geophysical disasters in the United States
using changes in personal income (top) and changes in value of housing units
(bottom).
Note: 2,674 disasters, thereof 1,277 with a positive insured loss.
44
Figure 8b: Normalized insured losses from convective events in the United States
using changes in personal income (top) and changes in value of housing units
(bottom).
Note: 1,646 disasters, thereof 916 with a positive insured loss; Includes damages from flash floods, hail
storms, tempest storms, tornados, and lightning.

45
Figure 8c: Normalized insured losses from flooding in the United States using
changes in personal income (top) and changes in value of housing units (bottom).
Note: 337 disasters, thereof 63 with a positive insured loss; Includes damages from flash floods and
general floods.

46
Figure 8d: Normalized insured losses from temperature highs in the United States
using changes in personal income (top) and changes in value of housing units
(bottom).
Note: 340 disasters, thereof 65 with a positive insured loss; Includes damages from heat waves,
droughts and wild fires.

47
Figure 8e: Normalized insured losses from temperature lows in the United States
using changes in personal income (top) and changes in value of housing units
(bottom).
Note: 60 disasters, thereof 33 with a positive insured loss; Includes damages from winter damages and
cold waves.

48
Figure 8f: Normalized insured losses from winter storms in the United States using
changes in personal income (top) and changes in value of housing units (bottom).
Note: 214 disasters, thereof 122 with a positive insured loss; Includes damages from winter storms,
blizzards and snow storms.

49
Figure 8g: Normalized insured losses from all storms in the United States using
changes in personal income (top) and changes in value of housing units (bottom).
Note: 1,756 disasters, thereof 1,034 with a positive insured loss; Includes damages from winter storms,
blizzards, snow storms, hail storms, tempest storms, tornado, lightning, sand storms and storm surges.
50
Figure 8h: Normalized insured losses from hurricanes in the United States using
changes in personal income (top) and changes in value of housing units (bottom).
Note: 113 disasters, thereof 82 with a positive insured loss.
51
Figure 9a: Normalized insured losses of non-geophysical disasters in West Germany.
Note: 577 disasters, thereof 265 with a positive insured loss.
52
Figure 9b: Normalized insured losses from convective events in West Germany.
Note: 323 disasters, thereof 147 with a positive insured loss; Includes damages from flash floods, hail
storms, tempest storms, tornados, and lightning.

53
Figure 9c: Normalized insured losses from flooding in West Germany.
Note: 94 disasters, thereof 20 with a positive insured loss; Includes damages from flash floods and
general floods.

54
Figure 9d: Normalized insured losses from winter storms in West Germany.
Note: 112 disasters, thereof 84 with a positive insured loss; Includes damages from winter storms,
blizzards and snow storms.

55
Figure 9e: Normalized insured losses from all storms in West Germany.
Note: 416 disasters, thereof 238 with a positive insured loss; Includes damages from winter storms,
blizzards, snow storms, hail storms, tempest storms, tornado, lightning, sand storms and storm surges.