Fab Investment Outlook – Foundry, Memory and LED Market - Clark Tseng.pdf · Fab Investment...
33
Fab Investment Outlook – Foundry, Memory and LED Clark Tseng, Sr. Research Manager, SEMI Vietnam Semiconductor Strategy Summit September 16-17, 20214
Transcript of Fab Investment Outlook – Foundry, Memory and LED Market - Clark Tseng.pdf · Fab Investment...
Fab Investment Outlook – Foundry, Memory and LED
Clark Tseng, Sr. Research Manager, SEMI
Vietnam Semiconductor Strategy Summit September 16-17, 20214

Outline
Fab Investment & Capacity Trend Memory and Foundry Investment Outlook LED Investment Outlook Summary
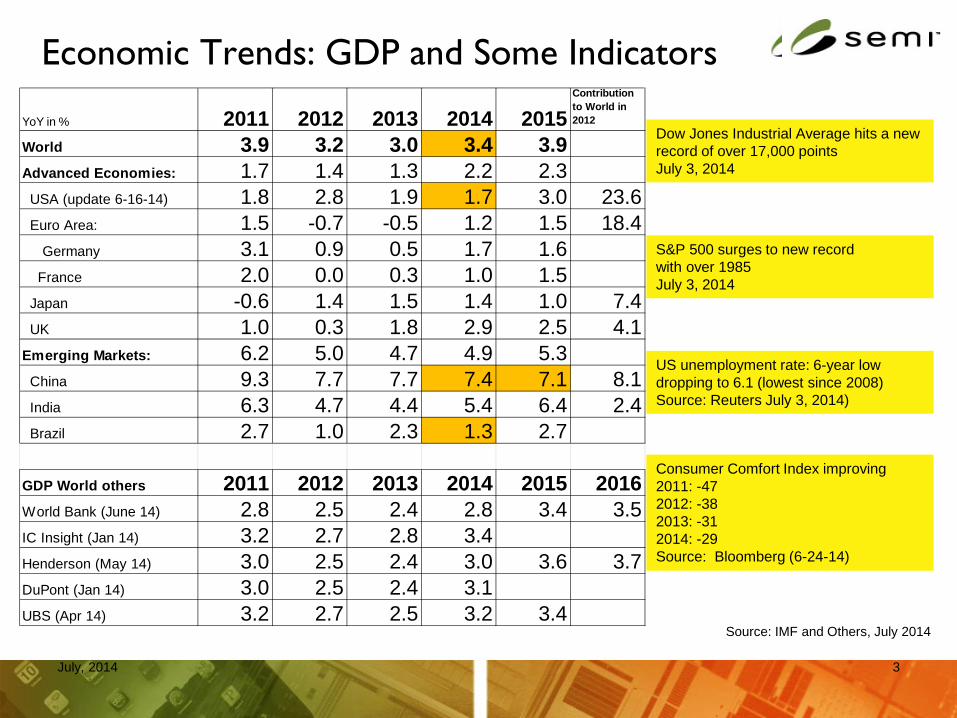
Economic Trends: GDP and Some Indicators
3 July, 2014
Source: IMF and Others, July 2014
Dow Jones Industrial Average hits a new record of over 17,000 points July 3, 2014
US unemployment rate: 6-year low dropping to 6.1 (lowest since 2008) Source: Reuters July 3, 2014)
Consumer Comfort Index improving 2011: -47 2012: -38 2013: -31 2014: -29 Source: Bloomberg (6-24-14)
S&P 500 surges to new record with over 1985 July 3, 2014
YoY in % 2011 2012 2013 2014 2015Contribution to World in 2012
World 3.9 3.2 3.0 3.4 3.9Advanced Economies: 1.7 1.4 1.3 2.2 2.3USA (update 6-16-14) 1.8 2.8 1.9 1.7 3.0 23.6Euro Area: 1.5 -0.7 -0.5 1.2 1.5 18.4 Germany 3.1 0.9 0.5 1.7 1.6France 2.0 0.0 0.3 1.0 1.5
Japan -0.6 1.4 1.5 1.4 1.0 7.4UK 1.0 0.3 1.8 2.9 2.5 4.1
Emerging Markets: 6.2 5.0 4.7 4.9 5.3China 9.3 7.7 7.7 7.4 7.1 8.1India 6.3 4.7 4.4 5.4 6.4 2.4Brazil 2.7 1.0 2.3 1.3 2.7
GDP World others 2011 2012 2013 2014 2015 2016World Bank (June 14) 2.8 2.5 2.4 2.8 3.4 3.5IC Insight (Jan 14) 3.2 2.7 2.8 3.4Henderson (May 14) 3.0 2.5 2.4 3.0 3.6 3.7DuPont (Jan 14) 3.0 2.5 2.4 3.1UBS (Apr 14) 3.2 2.7 2.5 3.2 3.4

Economic Trends 2014 Semiconductor Revenue Forecasts
August, 2014

Economic Trends 2015 Semiconductor Revenue Forecasts
August, 2014
Fab Investments & Capacity
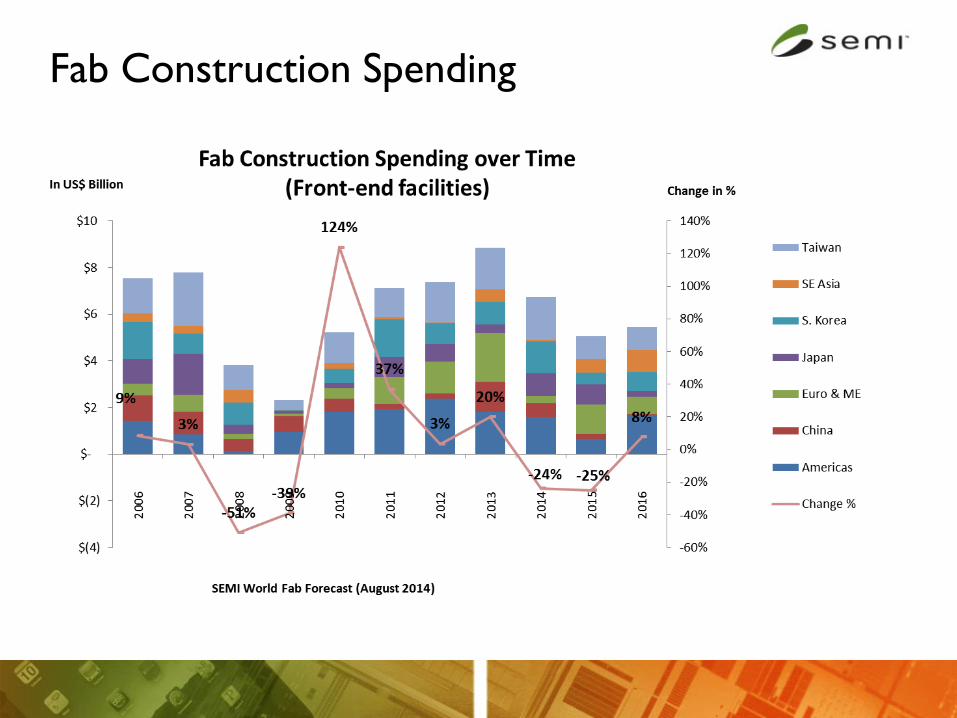
Fab Construction Spending
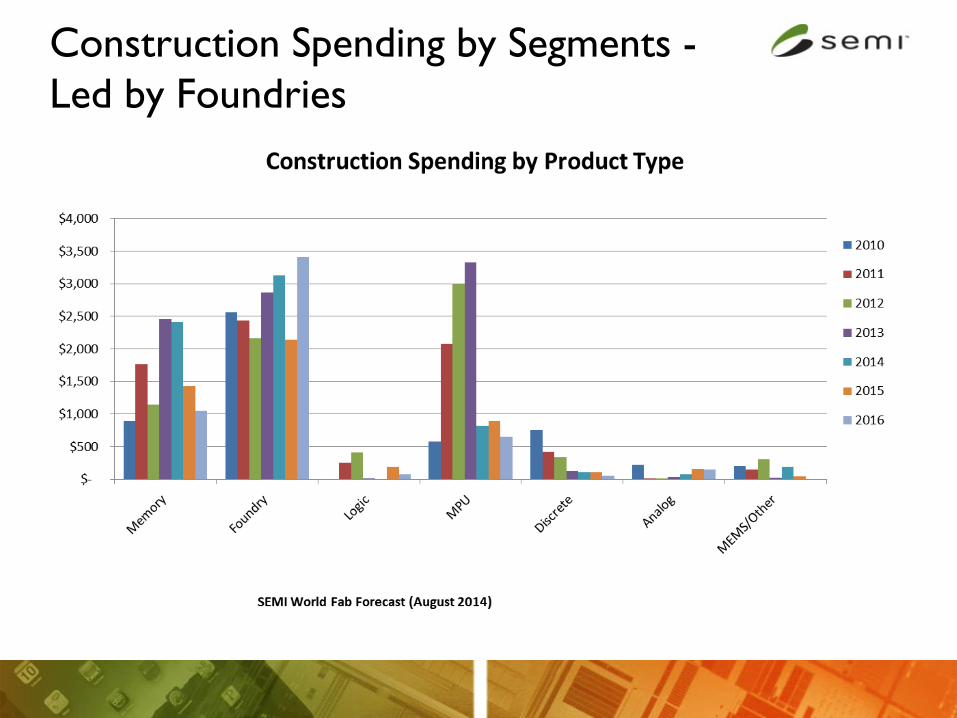
Construction Spending by Segments - Led by Foundries
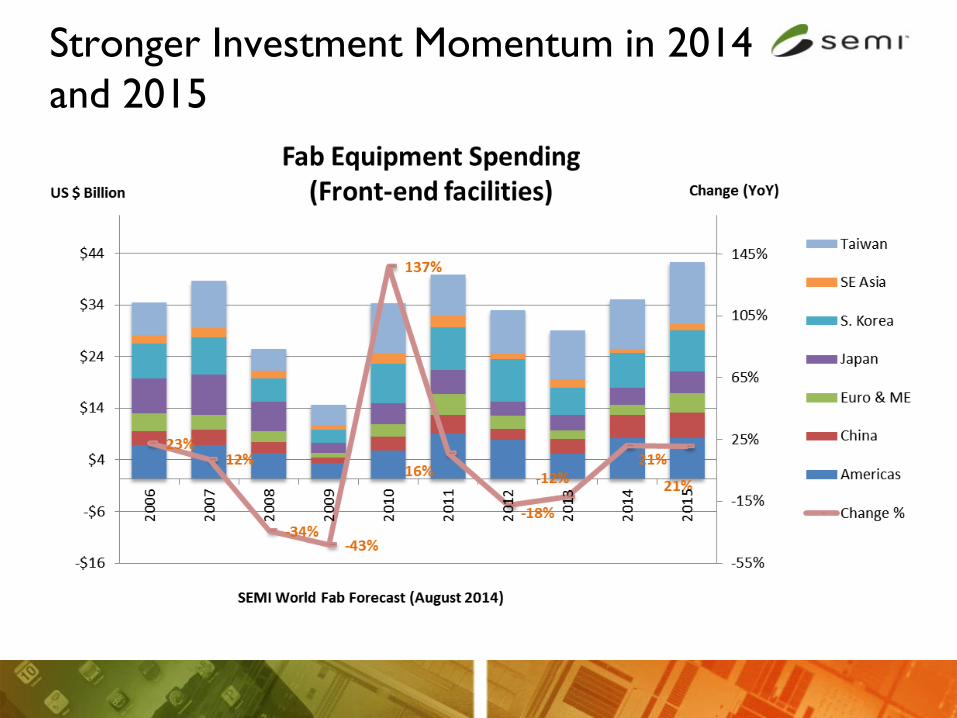
Stronger Investment Momentum in 2014 and 2015

Fab Equipment Spending: Industry Cycles
10
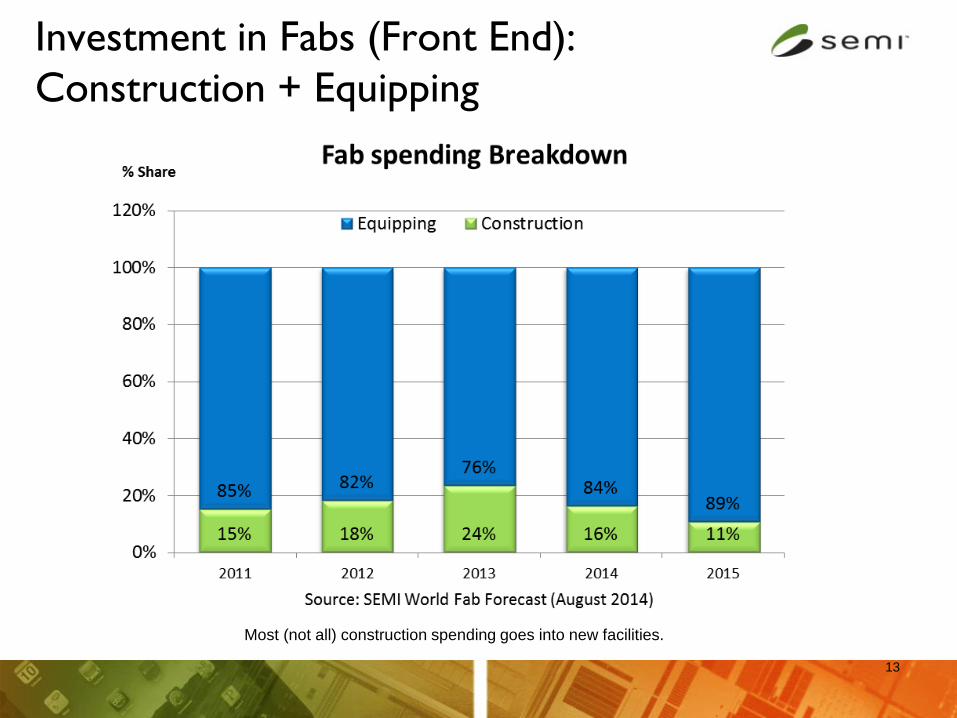
Investment in Fabs (Front End): Construction + Equipping
13
Most (not all) construction spending goes into new facilities.
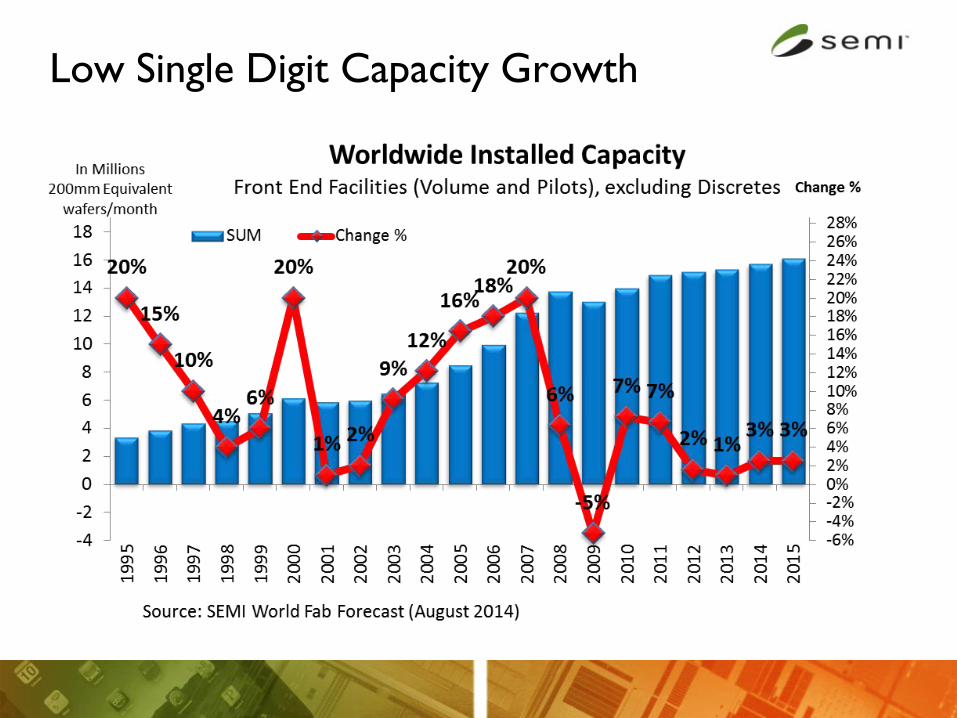
Low Single Digit Capacity Growth

~10.7 M 200mm equiv./month
Shift of Capacity Share (including discrete)
~19.4 M 200mm equiv./month
Source: SEMI World Fab Forecast
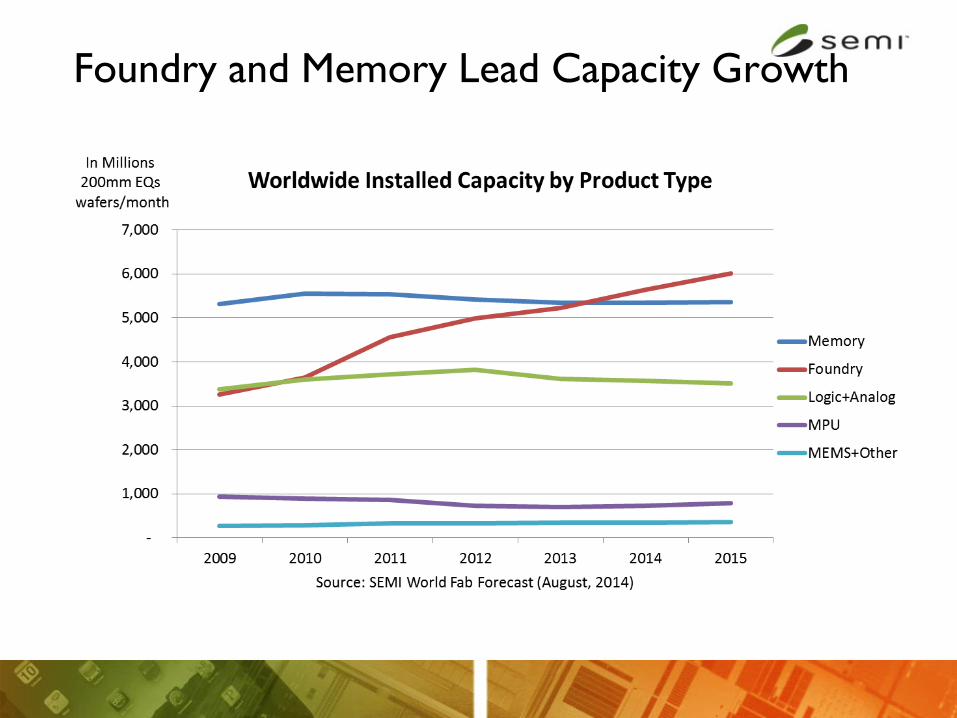
Foundry and Memory Lead Capacity Growth

Capacity: Fab Equipment Spending vs Capacity
17
SEMI World Fab Forecast: Since downturn the industry
spends more money on upgrading existing facilities
Average change rates 2003 – 2007 2010 - 2014 2011-2015*
Fab Equipment 18% 29% 5%
Fab Capacity 17% 4% 3%
* 2011-2015: excluding 2010 because fab equipment growth was unusual high
Micron Feb 2014: Industry bit supply growth slowing:
DRAM: 49% in 2010 to 24% in 2015
NAND: 74% in 2010 to 45% in 2015

Capacity: Begin Volume Production Per Node
18
Forecast 3Q14
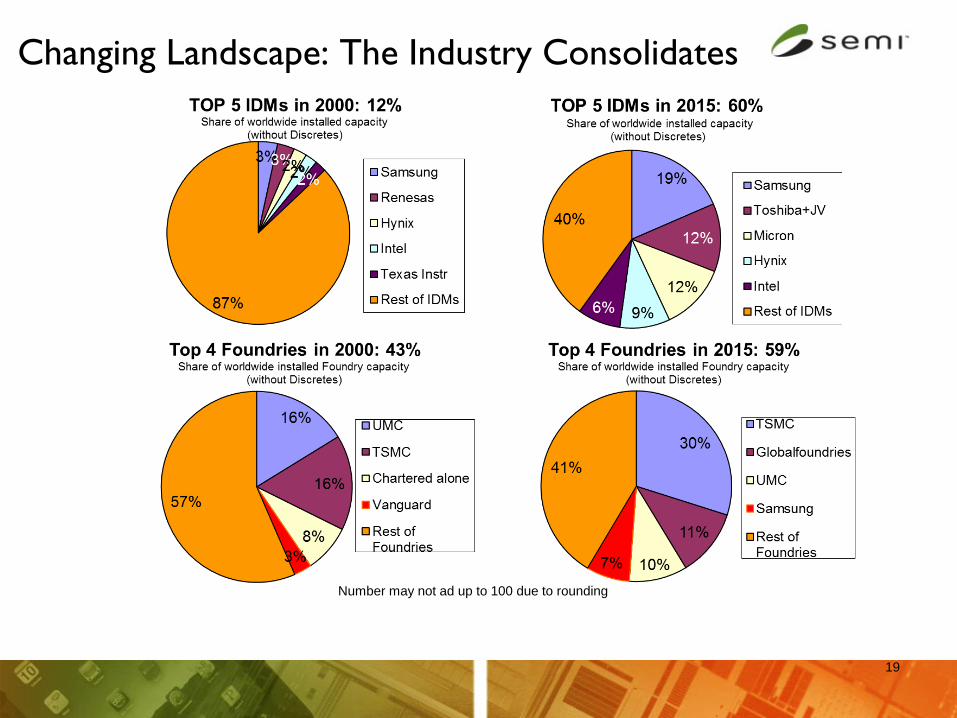
Changing Landscape: The Industry Consolidates
19
Number may not ad up to 100 due to rounding

20
Memory and Foundry Investment Outlook

Fab Equipment Spending- Driven by Foundry and Memory
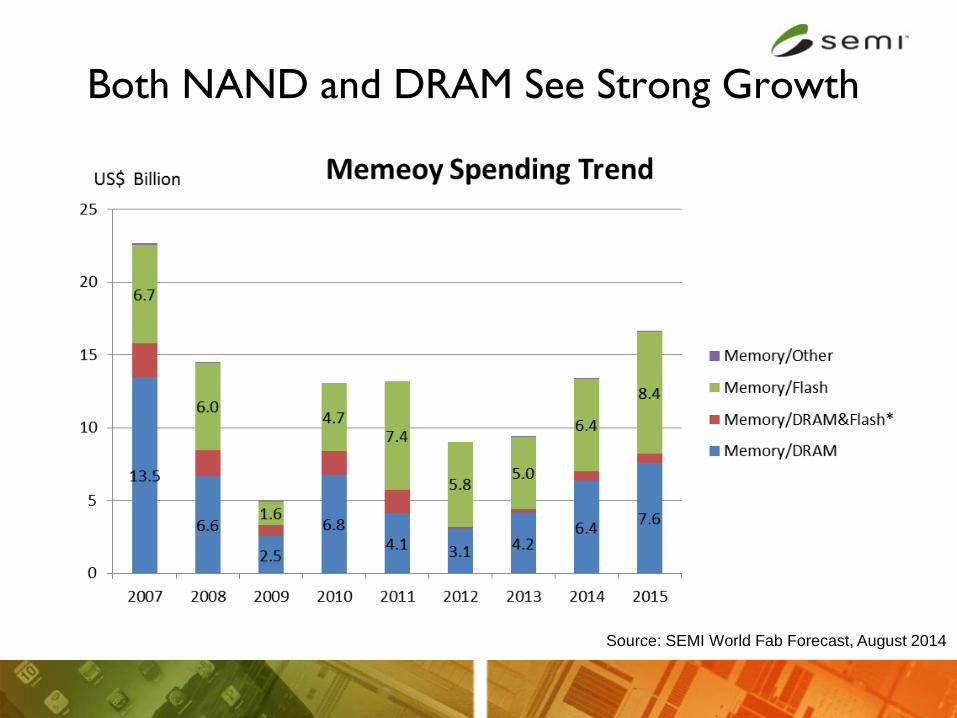
Both NAND and DRAM See Strong Growth
Source: SEMI World Fab Forecast, August 2014
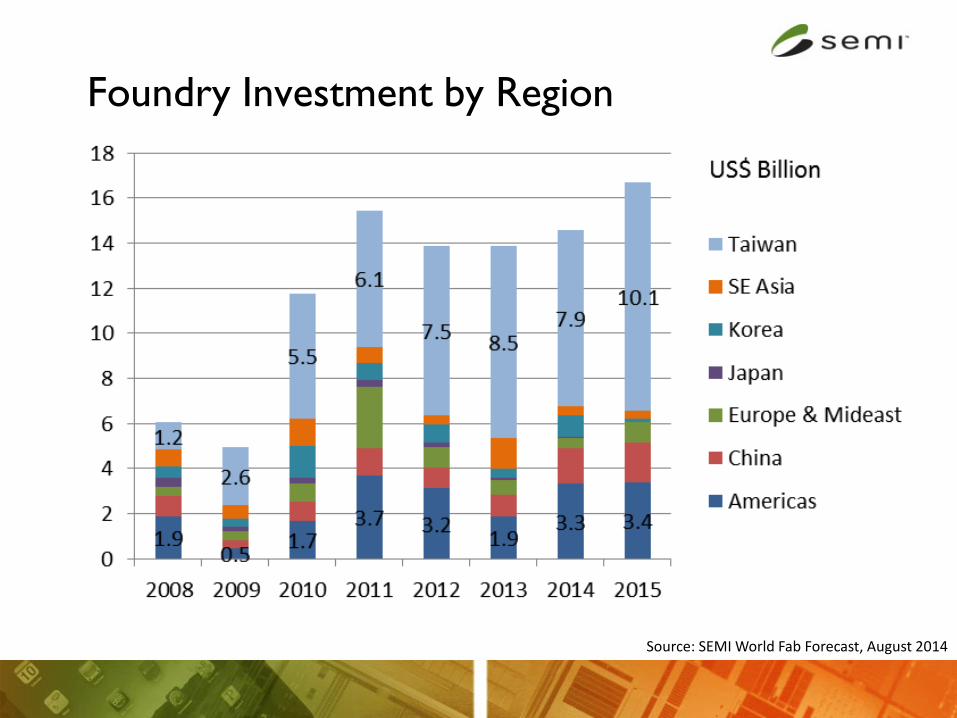
Foundry Investment by Region
Source: SEMI World Fab Forecast, August 2014
LED Fab Investments
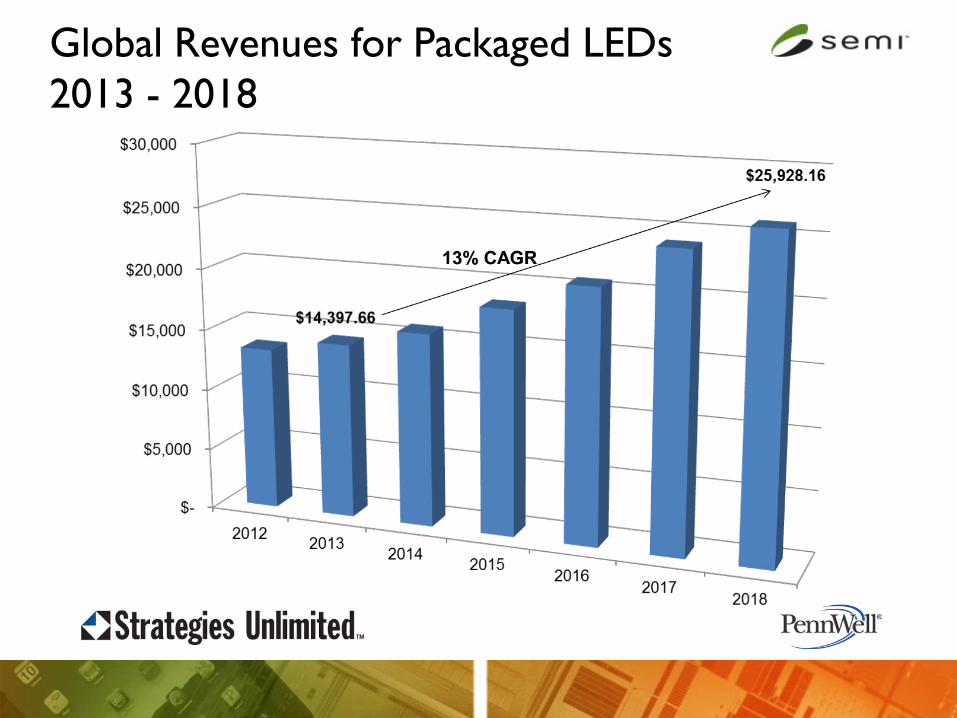
Global Revenues for Packaged LEDs 2013 - 2018
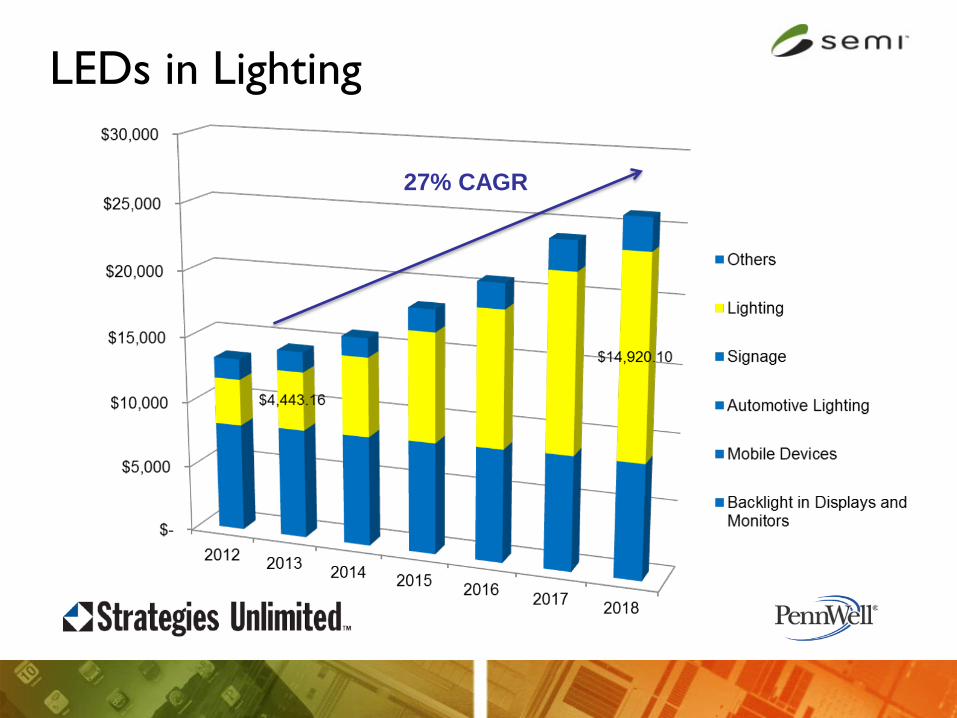
LEDs in Lighting
27% CAGR

Source: SEMI Opto/LED Fab Forecast, August 2014
LED Dedicated Fabs Changing LED Landscape
4 5 9
7 16 74
1 2 10
7 9 21 China
Japan
S. Korea 3 8 16
SEAsia 0 0 4
Taiwan 14 24 44
2001
36
127,124
Year (begin operation)
Total count of LED fabs*
Capacity in 4-inch EQs w/m
2006
64
376,400
2015
178 (152 EPI)
~3,100,000
Americas Europe/Mideast
*Fab number includes both LED epitaxy and chip facilities.
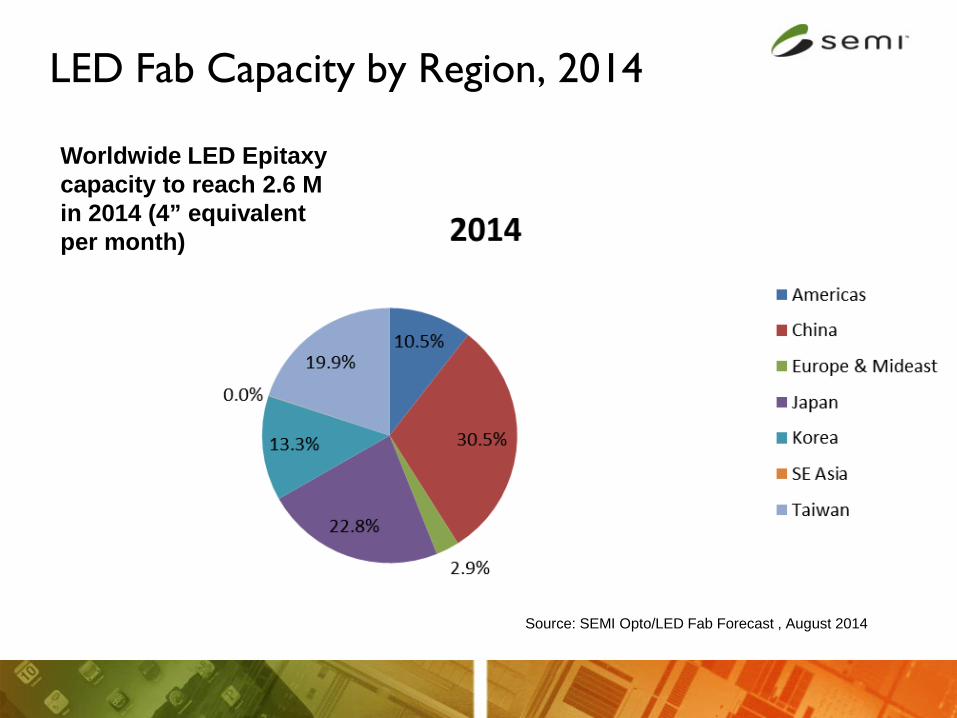
LED Fab Capacity by Region, 2014
Worldwide LED Epitaxy capacity to reach 2.6 M in 2014 (4” equivalent per month)
Source: SEMI Opto/LED Fab Forecast , August 2014

World LED Capacity Trend LED Epitaxy capacity (4” equivalent per month)
Source: SEMI Opto/LED Fab Forecast , August 2014
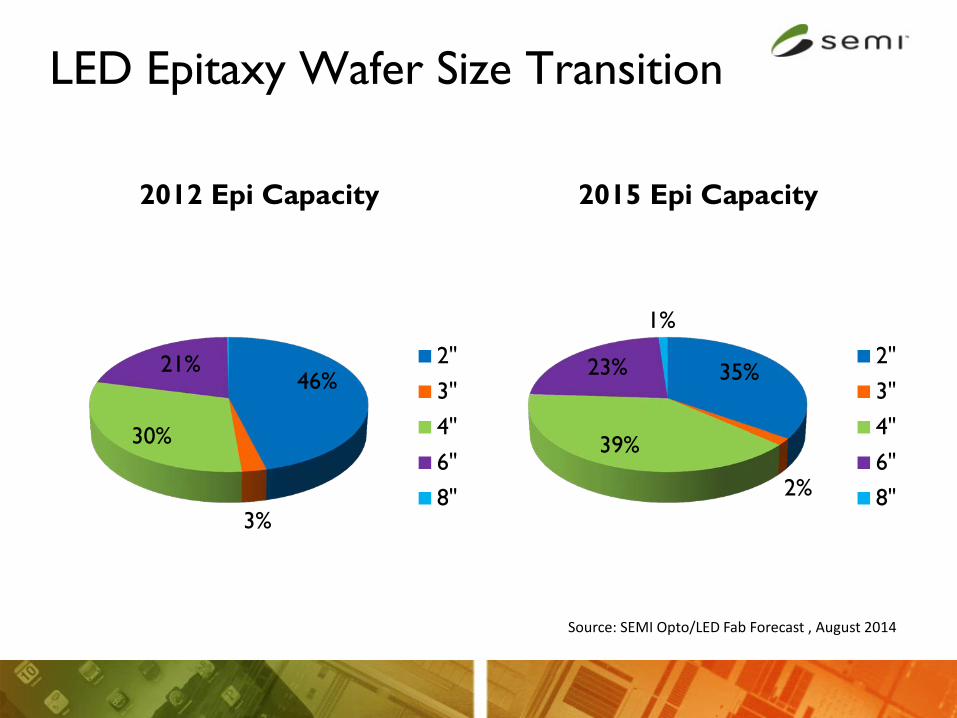
LED Epitaxy Wafer Size Transition
46%
3%
30%
21%
2012 Epi Capacity
2"
3"
4"
6"
8"
35%
2%
39%
23%
1%
2015 Epi Capacity
2"
3"
4"
6"
8"
Source: SEMI Opto/LED Fab Forecast , August 2014

LED Wafer Fab Equipment Spending
$1,931
$2,647
$1,530
$1,102 $1,189$1,401
$0
$500
$1,000
$1,500
$2,000
$2,500
$3,000
2010 2011 2012 2013 2014 2015
LED Equipment Spending(US$ millions)
Source: SEMI Opto/LED Fab Forecast, August 2014
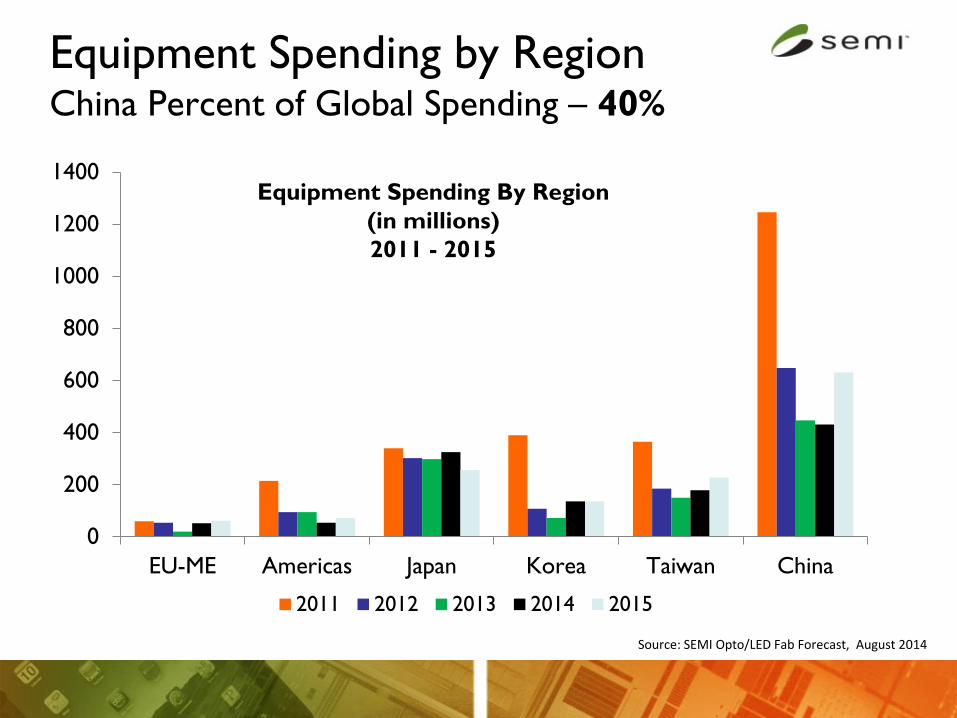
Equipment Spending by Region China Percent of Global Spending – 40%
0
200
400
600
800
1000
1200
1400
EU-ME Americas Japan Korea Taiwan China
2011 2012 2013 2014 2015
Equipment Spending By Region (in millions) 2011 - 2015
Source: SEMI Opto/LED Fab Forecast, August 2014

Southeast Asia Market – Key Facts
2014 Status
Installed Fab Capacity ~1.3 million 200mm wafers/month
Packaging & Test Strong presence of subcon and IDM facilities in the region
(including 20 assembly & test operations in Singapore)
Semiconductor Materials ~$6.7 billion
Semiconductor Equipment ~$2.0 billion range
Source: SEMI World Fab Forecast, WWSEMS, & MMDS
Summary
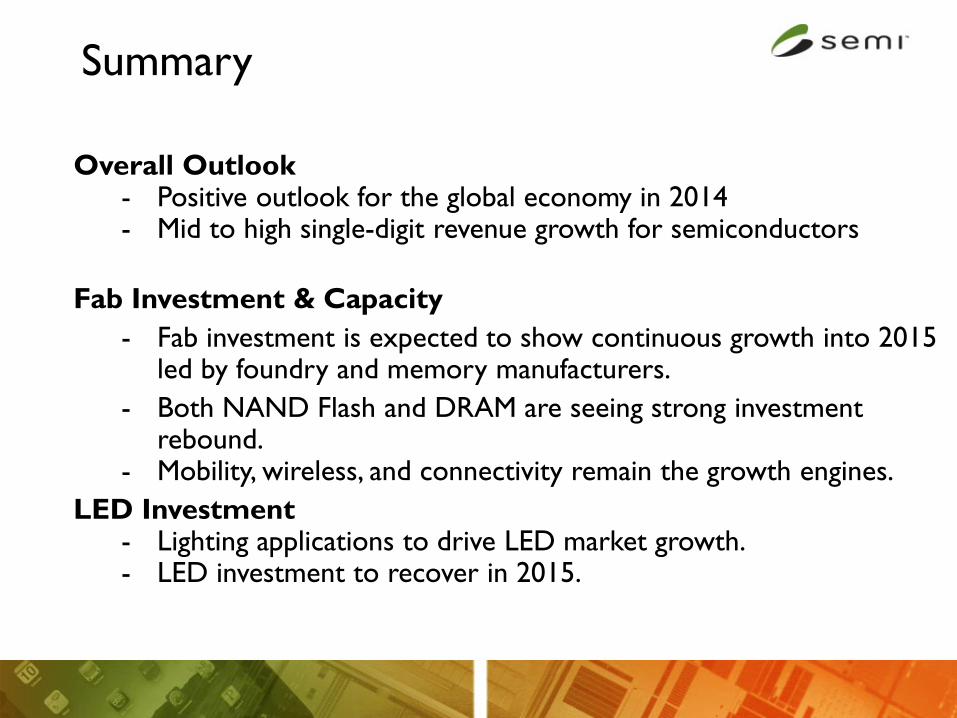
Summary
Overall Outlook - Positive outlook for the global economy in 2014 - Mid to high single-digit revenue growth for semiconductors
Fab Investment & Capacity - Fab investment is expected to show continuous growth into 2015
led by foundry and memory manufacturers. - Both NAND Flash and DRAM are seeing strong investment
rebound. - Mobility, wireless, and connectivity remain the growth engines.
LED Investment - Lighting applications to drive LED market growth. - LED investment to recover in 2015.