FA III – High Latitude Energy Partitioning and Density Implications Jeff Thayer University of...
22
FA III – High Latitude Energy Partitioning and Density Implications Jeff Thayer University of Colorado Team: Mihail Codrescu, Geoff Crowley, Jeff Forbes, Tim Fuller-Rowell, Delores Knipp, Jiuhou Lei, Art Richmond, Jeff Thayer Objective: High Latitude Energy Partitioning associated with Solar Wind High Speed Streams and the implications on Thermosphere Density
-
date post
21-Dec-2015 -
Category
Documents
-
view
214 -
download
0
Transcript of FA III – High Latitude Energy Partitioning and Density Implications Jeff Thayer University of...
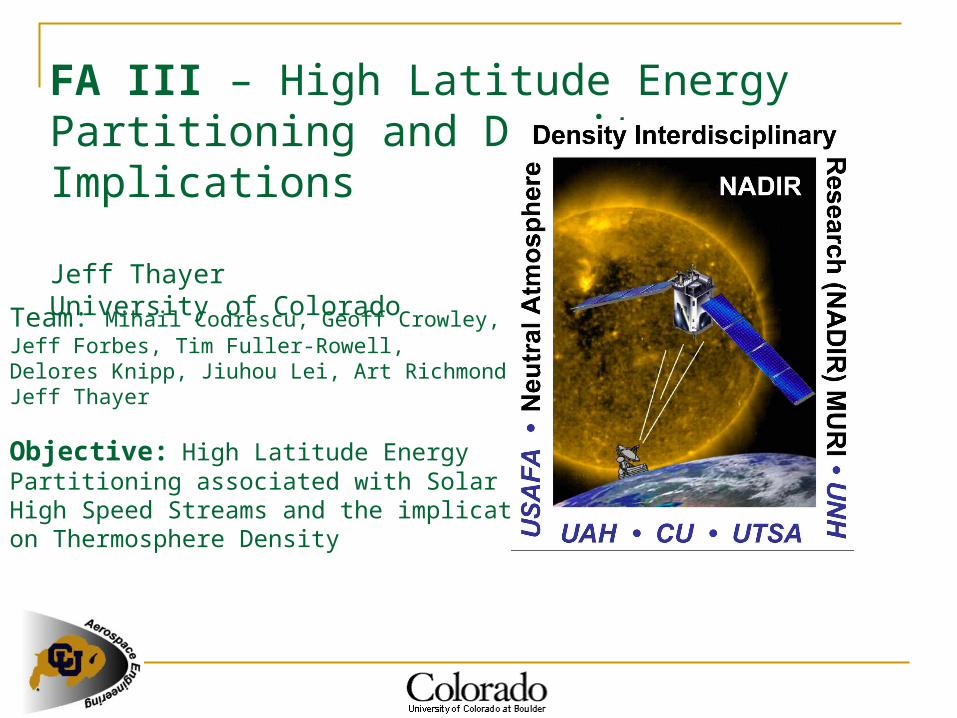
FA III – High Latitude Energy Partitioning and Density Implications
Jeff ThayerUniversity of Colorado
Team: Mihail Codrescu, Geoff Crowley,Jeff Forbes, Tim Fuller-Rowell,Delores Knipp, Jiuhou Lei, Art Richmond,Jeff Thayer
Objective: High Latitude Energy Partitioning associated with Solar Wind High Speed Streams and the implications on Thermosphere Density
Oct 17 2008 AES Seminar Thayer 2
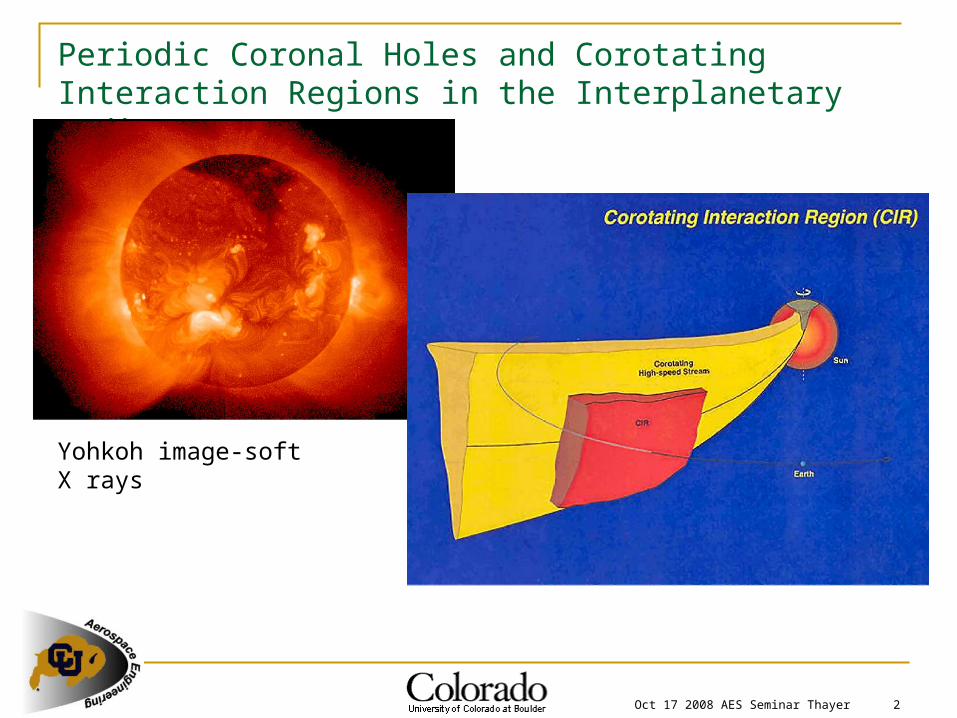
Periodic Coronal Holes and Corotating Interaction Regions in the Interplanetary Medium
Yohkoh image-soft X rays
Oct 17 2008 AES Seminar Thayer 3
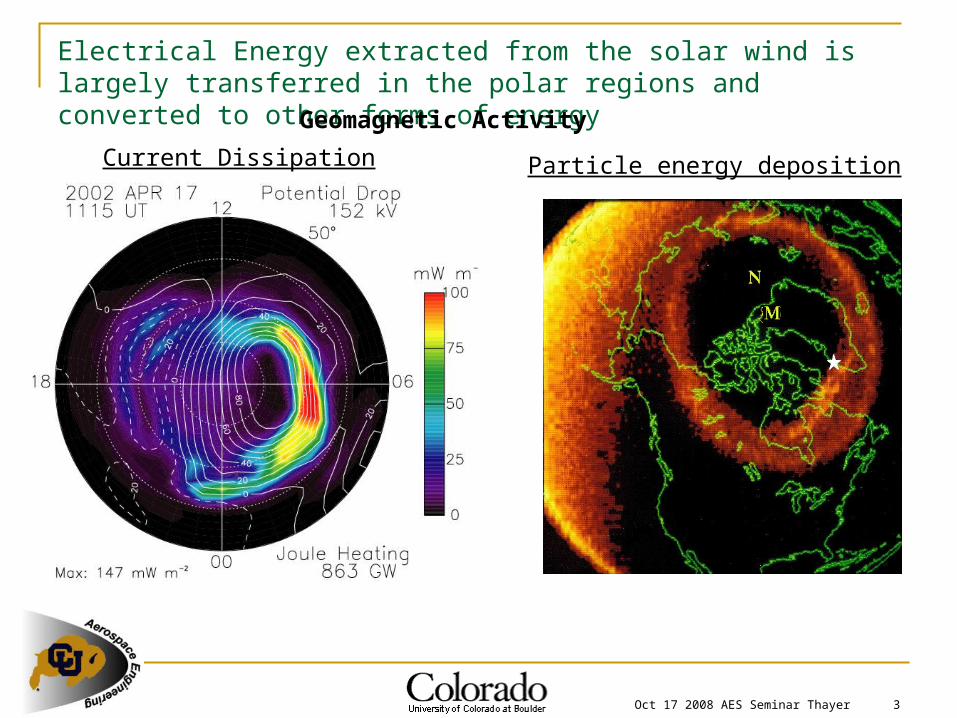
Electrical Energy extracted from the solar wind is largely transferred in the polar regions and converted to other forms of energy
Current Dissipation Particle energy deposition
Geomagnetic Activity
Oct 17 2008 AES Seminar Thayer 4
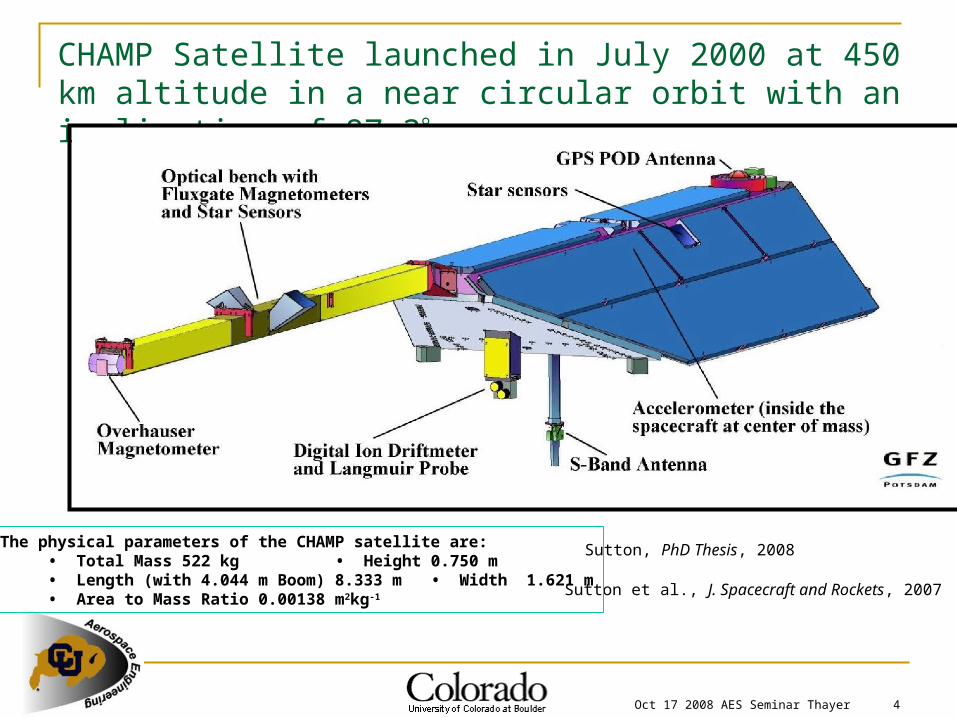
CHAMP Satellite launched in July 2000 at 450 km altitude in a near circular orbit with an inclination of 87.3
Sutton et al., J. Spacecraft and Rockets, 2007
The physical parameters of the CHAMP satellite are:• Total Mass 522 kg • Height 0.750 m• Length (with 4.044 m Boom) 8.333 m • Width 1.621 m• Area to Mass Ratio 0.00138 m2kg-1
Sutton, PhD Thesis, 2008
Oct 17 2008 AES Seminar Thayer 5
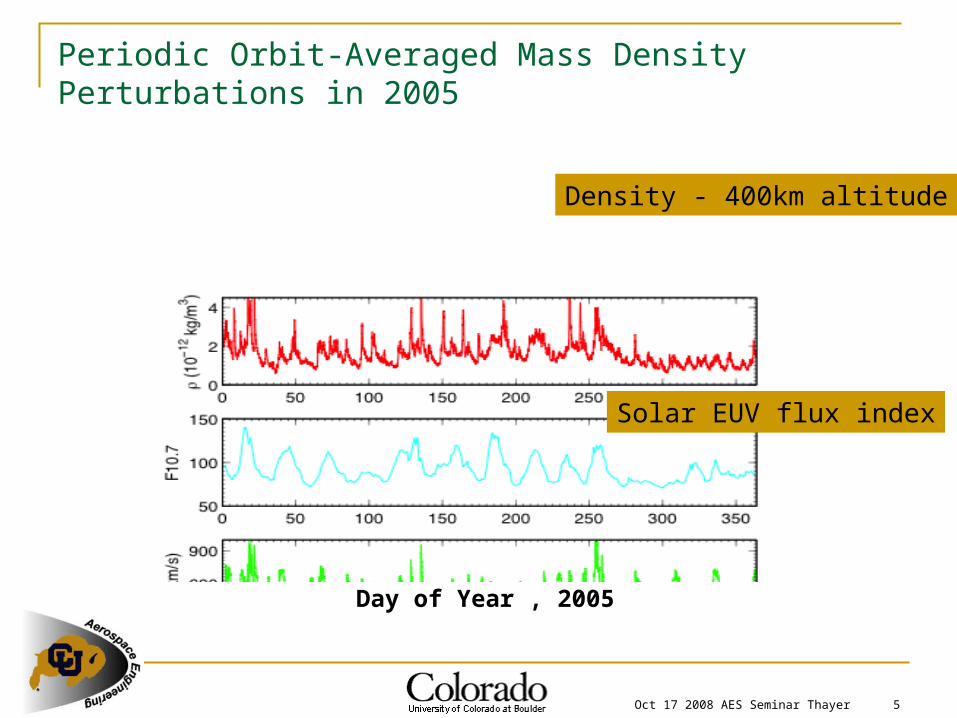
Periodic Orbit-Averaged Mass Density Perturbations in 2005
Density - 400km altitude
Solar EUV flux index
Day of Year , 2005
Oct 17 2008 AES Seminar Thayer 6
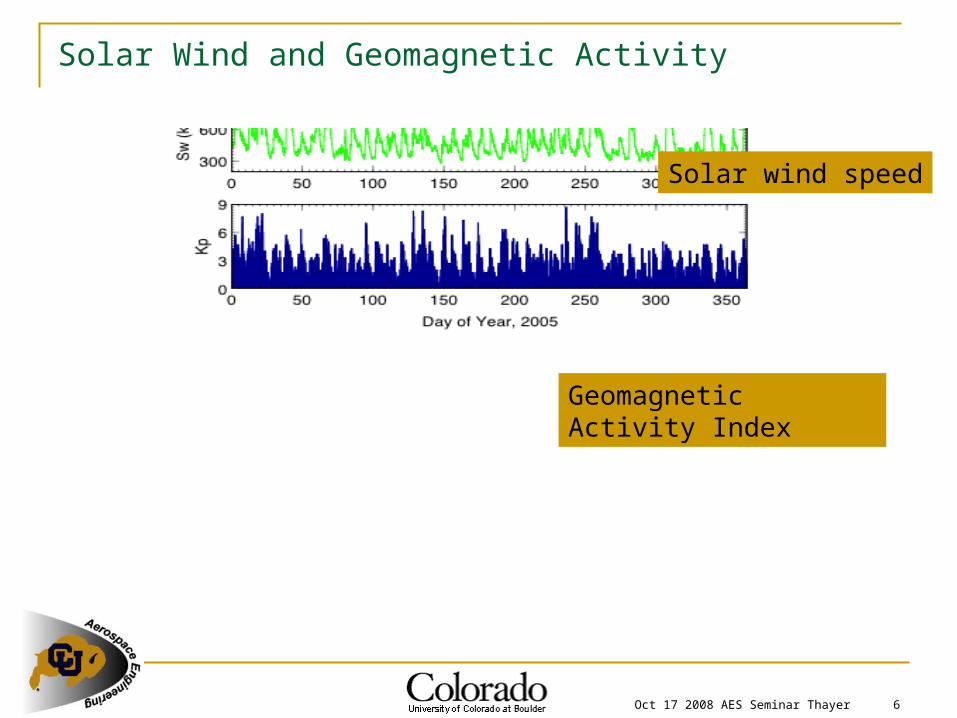
Solar Wind and Geomagnetic Activity
Solar wind speed
Geomagnetic Activity Index
Oct 17 2008 AES Seminar Thayer 7
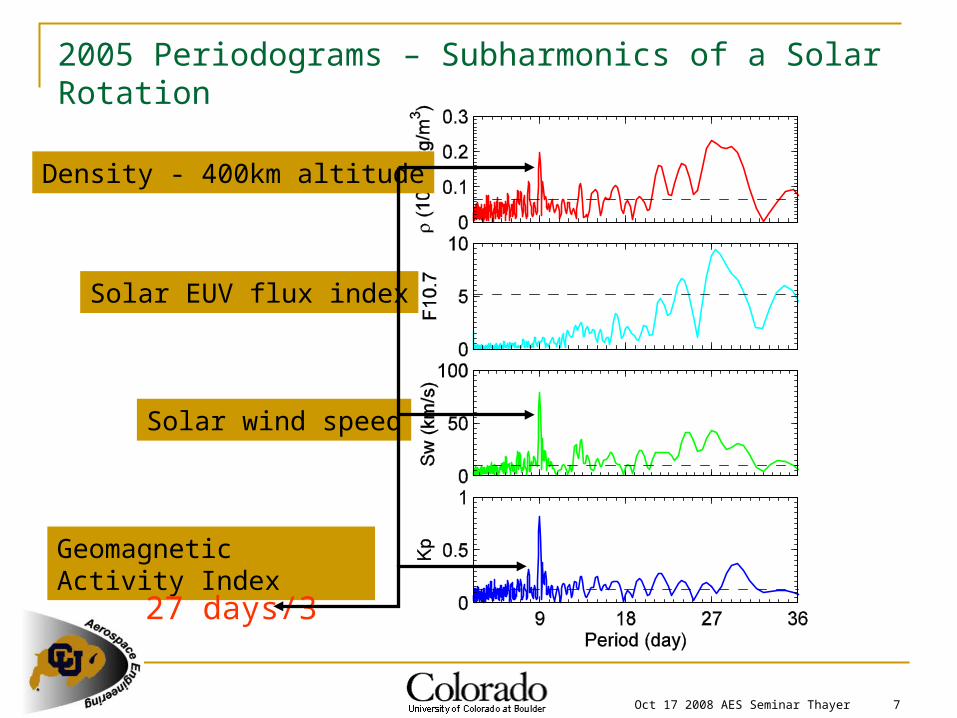
2005 Periodograms – Subharmonics of a Solar Rotation
Density - 400km altitude
Solar EUV flux index
Solar wind speed
Geomagnetic Activity Index
27 days/3
Oct 17 2008 AES Seminar Thayer 8
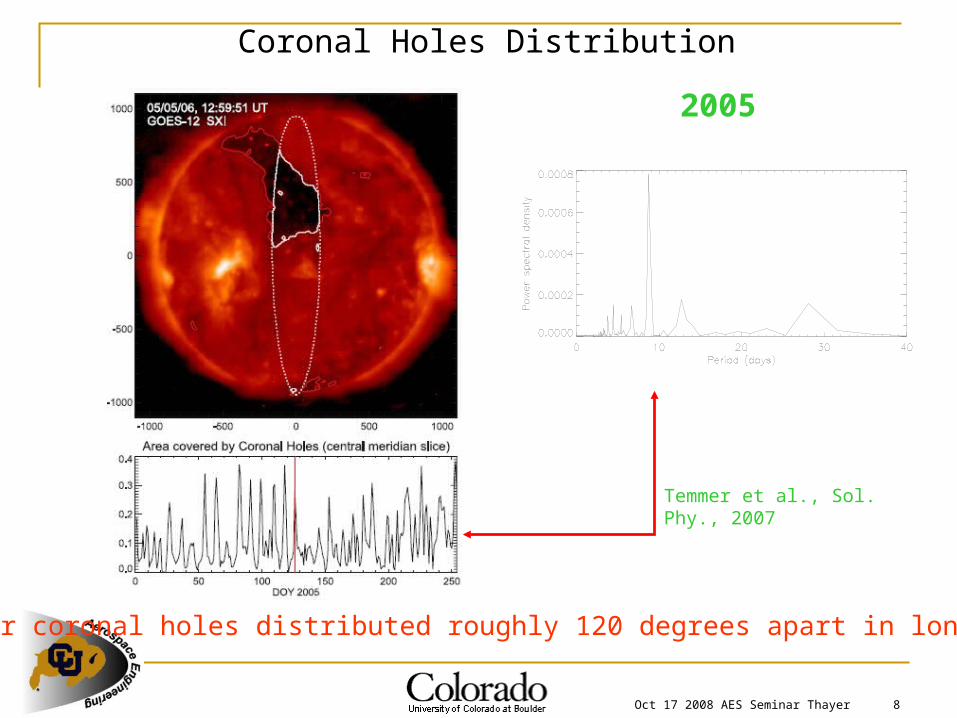
Coronal Holes Distribution
Temmer et al., Sol. Phy., 2007
2005
Solar coronal holes distributed roughly 120 degrees apart in longitude
Oct 17 2008 AES Seminar Thayer 9
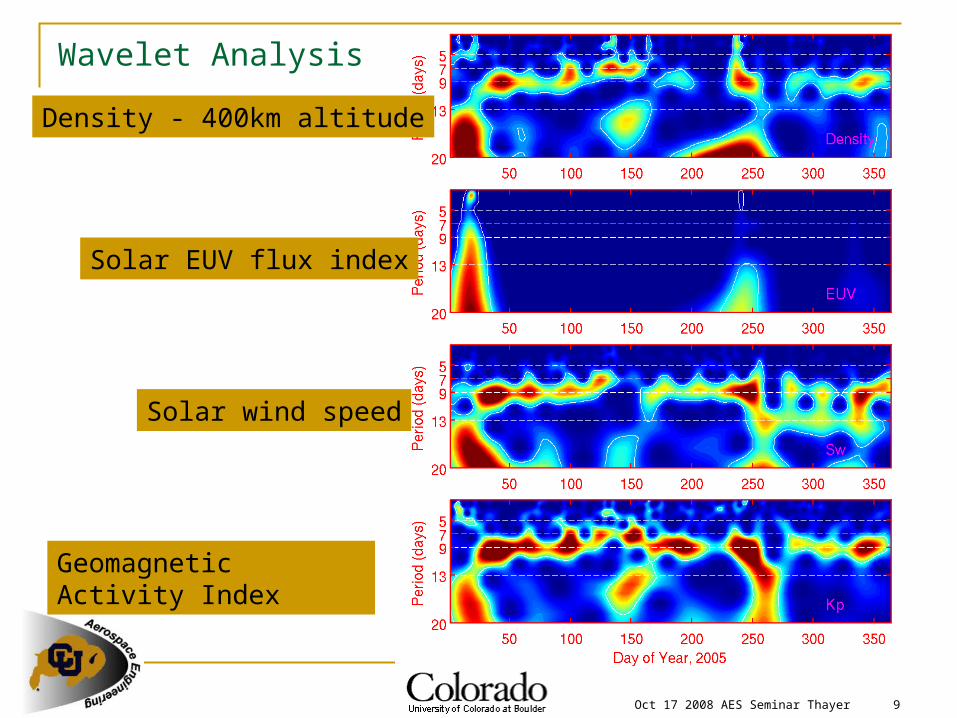
Wavelet Analysis
Density - 400km altitude
Solar EUV flux index
Solar wind speed
Geomagnetic Activity Index
Oct 17 2008 AES Seminar Thayer 10
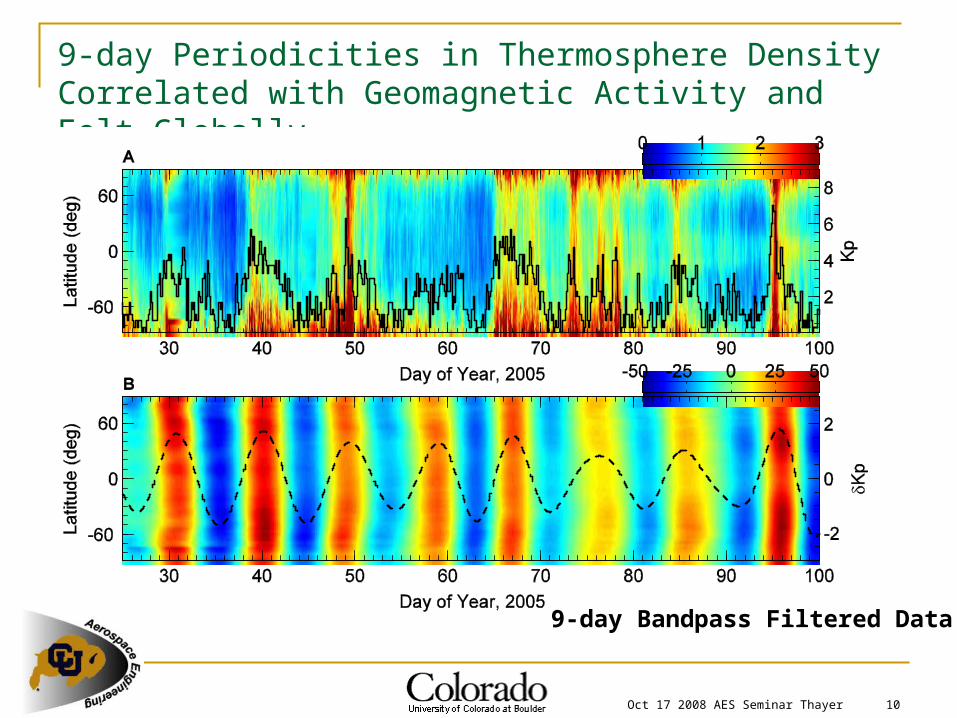
9-day Periodicities in Thermosphere Density Correlated with Geomagnetic Activity and Felt Globally
9-day Bandpass Filtered Data
Oct 17 2008 AES Seminar Thayer 11
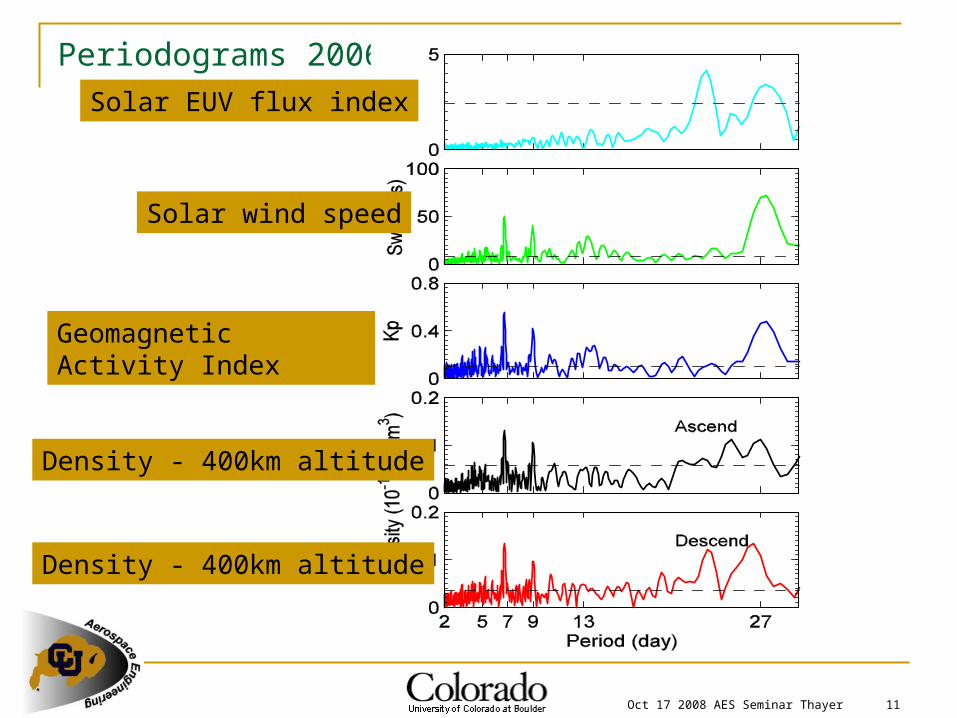
Periodograms 2006
Density - 400km altitude
Solar EUV flux index
Solar wind speed
Geomagnetic Activity Index
Density - 400km altitude
Oct 17 2008 AES Seminar Thayer 12
Study Implications
A solar-terrestrial connection between rotating solar coronal holes, periodic solar wind variation, and oscillations of thermospheric density has been discovered on multi-day periodicities.
The lack of EUV flux variability at 5, 7 and 9 days allows for geomagnetic activity effects to be isolated from EUV flux variations
The periodic connection suggests an element of predictability for satellite drag analysis
30-50% perturbations in density are modest compared to major magnetic storms but their much higher occurrence frequency and characteristic long recovery time may lead to a cumulative effect on the state of the thermosphere and satellite drag
The density variations should also be observed in other properties of the thermosphere and ionosphere and on other planetary bodies.
Lei, J., J. P. Thayer, J. M. Forbes, E. K. Sutton, and R. S. Nerem (2008), Rotating solar coronal holes and periodic modulation of the upper atmosphere, Geophys. Res. Lett., 35, L10109, doi:10.1029/2008GL033875.
Thayer, J. P., J. Lei, J. M. Forbes, E. K. Sutton, and R. S. Nerem (2008), Thermospheric density oscillations due to periodic solar wind high-speed streams, J. Geophys. Res., 113, A06307, doi:10.1029/2008JA013190.
Oct 17 2008 AES Seminar Thayer 13
Follow-on Studies, so far… Lei, J., J. P. Thayer, J. M. Forbes, E. K. Sutton, and R. S. Nerem, M.
Temmer, A. M. Veronig, Thermospheric density response to high-speed
solar wind streams during the declining phase of solar cycle 23, in press, J.
Geophys. Res., 2008.
Lei, J., J. P. Thayer, J. M. Forbes, Q. Wu, C. She, W. Wan, W. Wang,
Ionosphere response to solar wind high speed streams, accepted, GRL,
June 2008.
Crowley, G., A. Reynolds, J. P. Thayer, J. Lei, L.J. Paxton, A.B.
Christensen, Y. Zhang, R.R. Meier, D.J. Strickland, Periodic Modulations in
Thermospheric Composition by Solar Wind High Speed Streams, accepted,
GRL October 2008.
Palo, S. A., J. P. Thayer, J. Lei, L. Chang, Lower thermosphere
temperature response to solar wind high speed streams, in preparation.
Oct 17 2008 AES Seminar Thayer 14
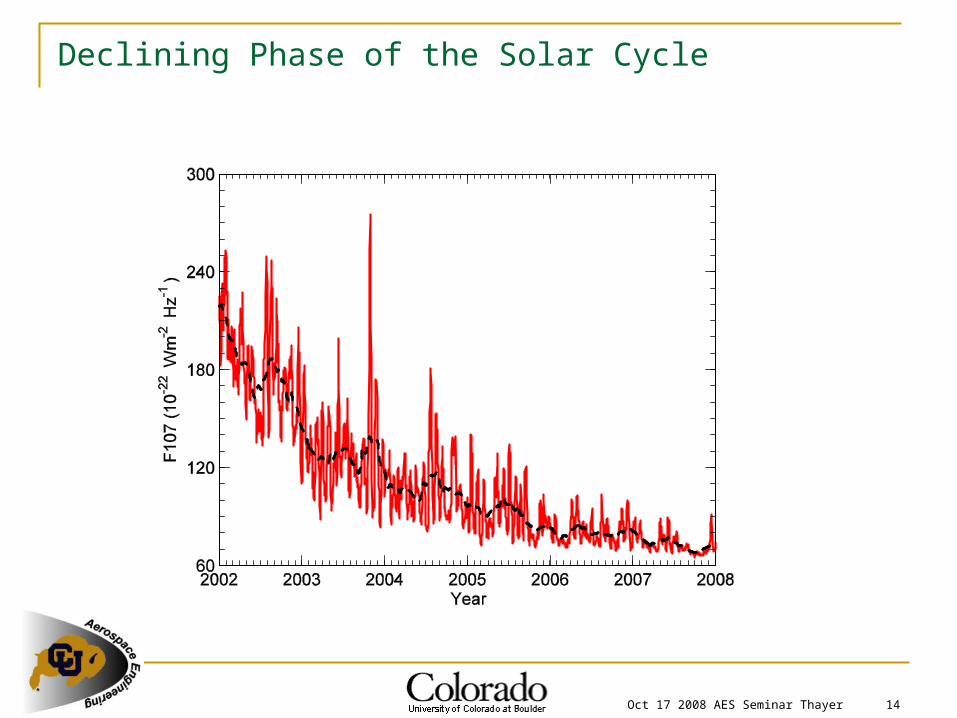
Declining Phase of the Solar Cycle
Oct 17 2008 AES Seminar Thayer 15
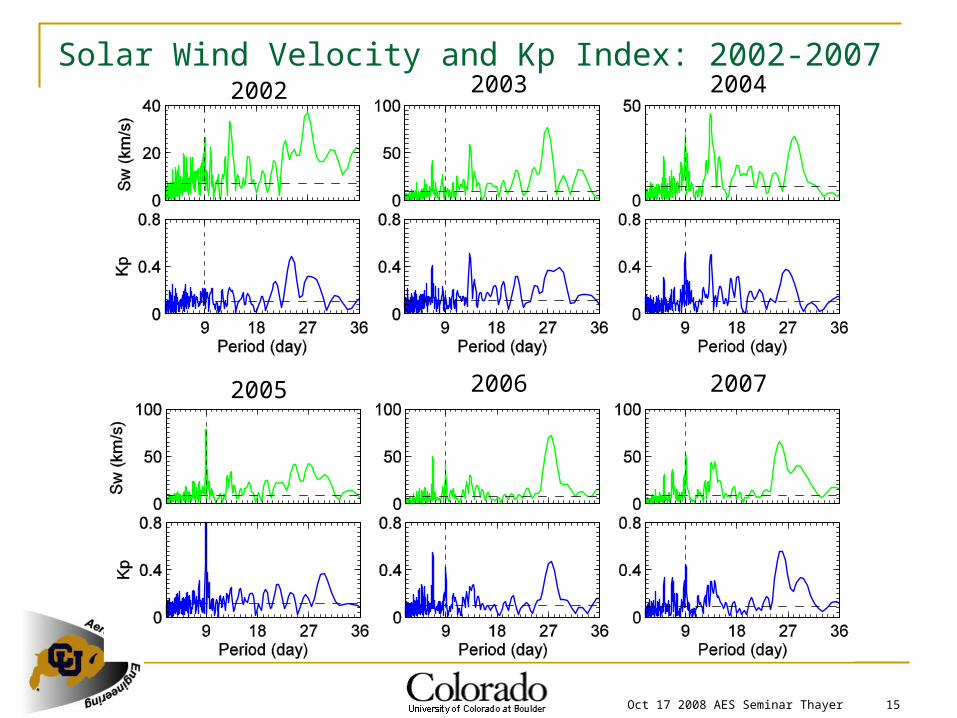
Solar Wind Velocity and Kp Index: 2002-2007
2005 2006 2007
2002 2003 2004
Oct 17 2008 AES Seminar Thayer 16
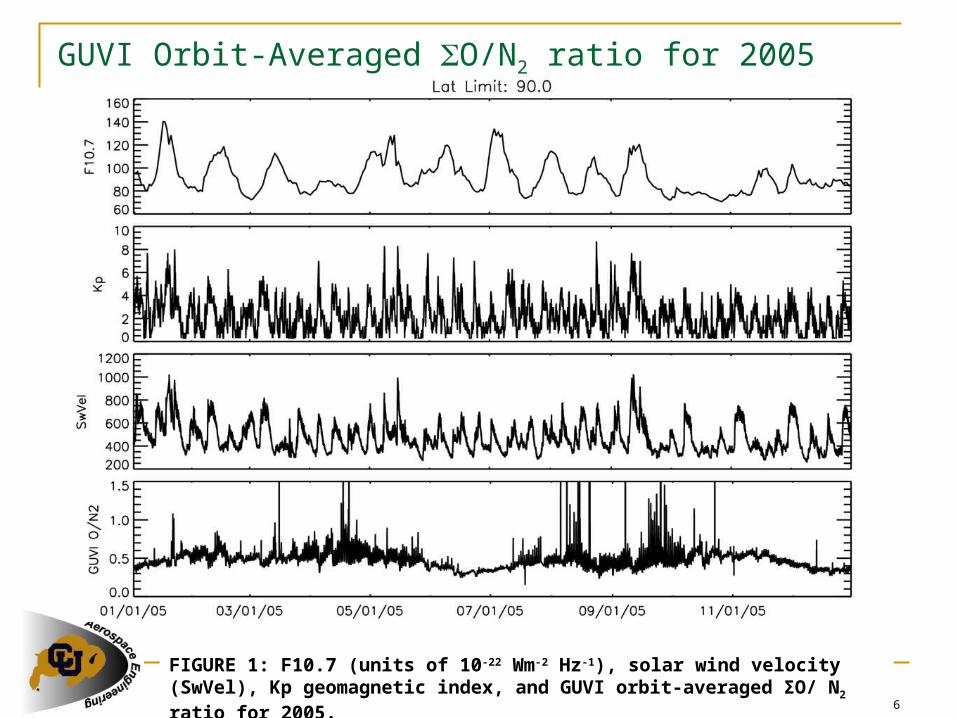
GUVI Orbit-Averaged O/N2 ratio for 2005
FIGURE 1: F10.7 (units of 10-22 Wm-2 Hz-1), solar wind velocity (SwVel), Kp geomagnetic index, and GUVI orbit-averaged ΣO/ N2 ratio for 2005.
Oct 17 2008 AES Seminar Thayer 17
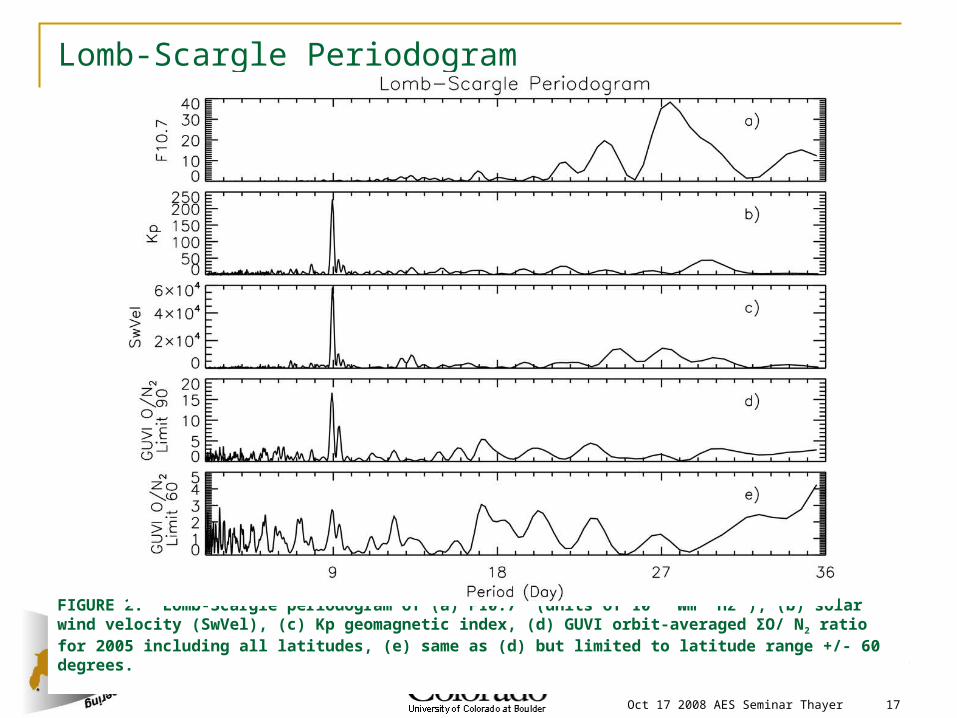
Lomb-Scargle Periodogram
FIGURE 2: Lomb-Scargle periodogram of (a) F10.7 (units of 10 -22 Wm-2 Hz-1), (b) solar wind velocity (SwVel), (c) Kp geomagnetic index, (d) GUVI orbit-averaged ΣO/ N2 ratio for 2005 including all latitudes, (e) same as (d) but limited to latitude range +/- 60 degrees.

Oct 17 2008 AES Seminar Thayer 18
GUVI O/N2 as a Function of Latitude and Day
FIGURE 3: (a) raw GUVI ΣO/ N2 ratio as a function of latitude and time for the first 100 days of 2005, with Kp superposed (black line); (b) Residuals 10° latitude bands after bandpass filtering and removal of the of 11-day running mean, expressed as a percentage of the running mean values. Broken line shows Kp after similar bandpass filtering.
a)
b)
Oct 17 2008 AES Seminar Thayer 19
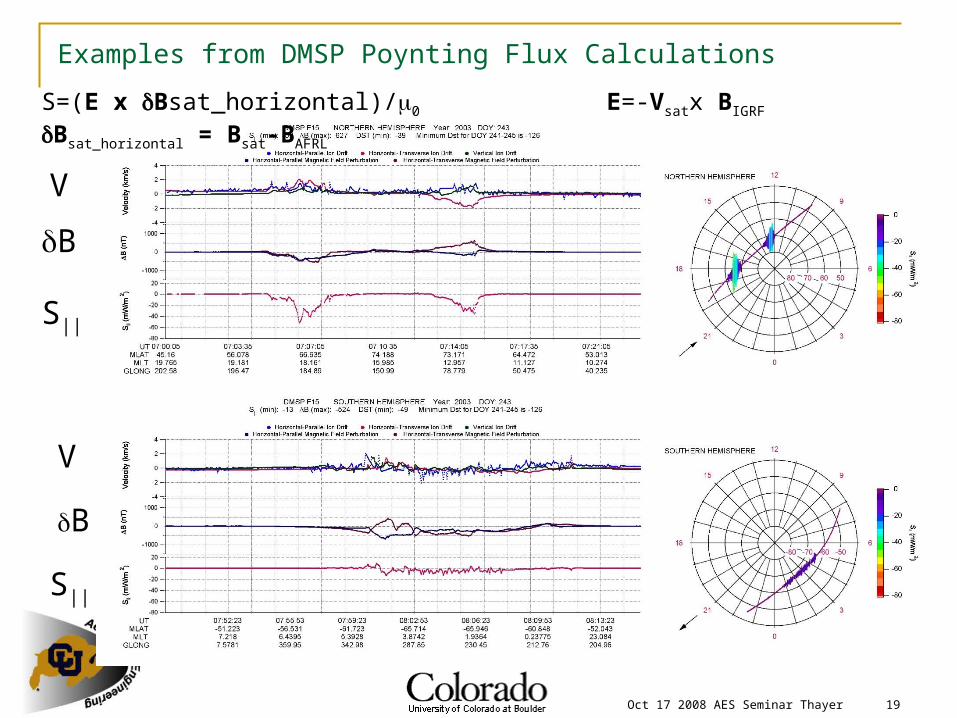
V
B
S||
V
B
S||
Examples from DMSP Poynting Flux Calculations
S=(E x Bsat_horizontal)/0 E=-Vsatx BIGRF Bsat_horizontal = Bsat-BAFRL
Oct 17 2008 AES Seminar Thayer 20
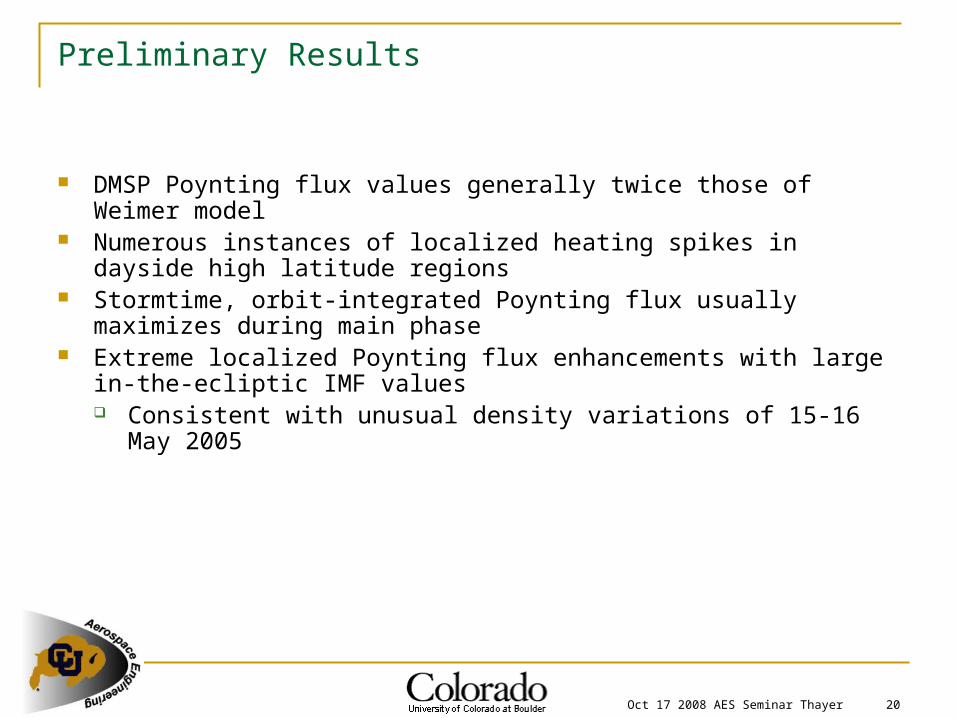
Preliminary Results
DMSP Poynting flux values generally twice those of Weimer model Numerous instances of localized heating spikes in dayside high latitude
regions Stormtime, orbit-integrated Poynting flux usually maximizes during main
phase Extreme localized Poynting flux enhancements with large in-the-ecliptic IMF
values Consistent with unusual density variations of 15-16 May 2005
Oct 17 2008 AES Seminar Thayer 21
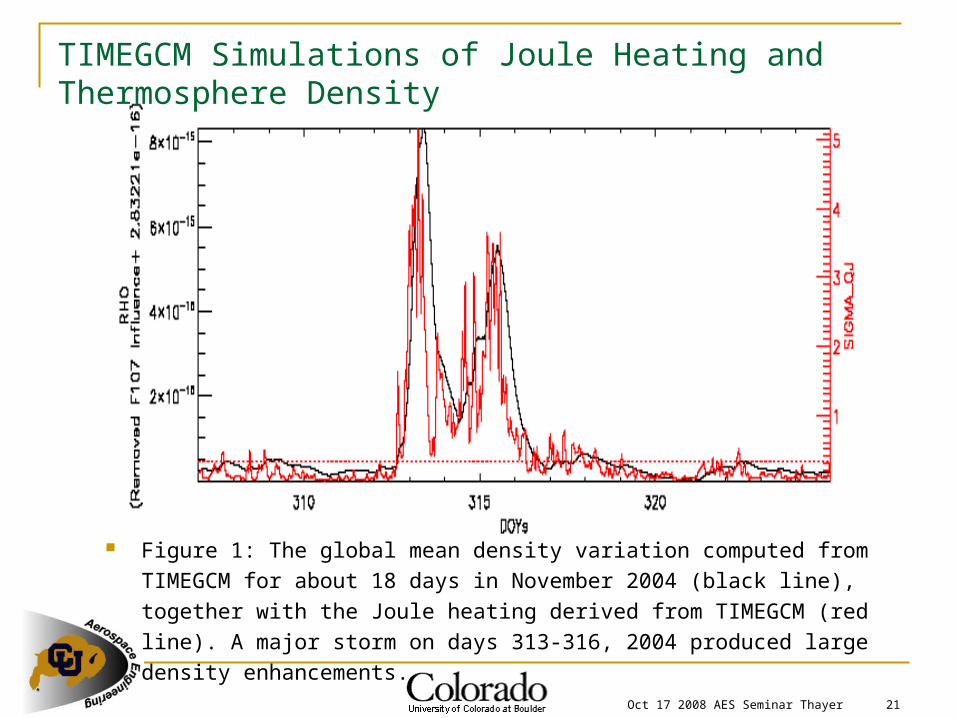
TIMEGCM Simulations of Joule Heating and Thermosphere Density
Figure 1: The global mean density variation computed from TIMEGCM for about 18
days in November 2004 (black line), together with the Joule heating derived from
TIMEGCM (red line). A major storm on days 313-316, 2004 produced large density
enhancements.

Oct 17 2008 AES Seminar Thayer 22