F6 - The Regents of the University of California
23
F6 Office of the President TO MEMBERS OF THE COMMITTEE ON FINANCE: DISCUSSION ITEM For Meeting of September 18, 2013 CHIEF FINANCIAL OFFICER DIVISION CAMPUS BENCHMARKING REPORT The CFO Division Campus Benchmarking Report (formerly presented as the CFO Division Key Performance Indicators Report and the AIM: Actionable Information for Managers Report) is the evolution of the original report shared with this committee on April 1, 2011. The purpose of the report is to benchmark administrative performance in a way that enables financial managers at campuses and medical centers to more readily understand where to focus their efforts. The report also allows UCOP to more finely target its resources in order to help campuses and medical centers reach administrative goals. Executive Vice President – Chief Financial Officer Taylor is committed to continue improving the indicators within this report each quarter based on feedback received. (Attachment - below)
Transcript of F6 - The Regents of the University of California
F6
Office of the President
TO MEMBERS OF THE COMMITTEE ON FINANCE:
DISCUSSION ITEM
For Meeting of September 18, 2013
CHIEF FINANCIAL OFFICER DIVISION CAMPUS BENCHMARKING REPORT
The CFO Division Campus Benchmarking Report (formerly presented as the CFO Division Key Performance Indicators Report and the AIM: Actionable Information for Managers Report) is the evolution of the original report shared with this committee on April 1, 2011. The purpose of the report is to benchmark administrative performance in a way that enables financial managers at campuses and medical centers to more readily understand where to focus their efforts. The report also allows UCOP to more finely target its resources in order to help campuses and medical centers reach administrative goals. Executive Vice President – Chief Financial Officer Taylor is committed to continue improving the indicators within this report each quarter based on feedback received.
(Attachment - below)
Campus Benchmarking Report(Formerly AIM: Actionable Information for Managers)
For the period ending June 30, 2013

Table of Contents
1. Financial Accounting 1.1 - # Manual Entries (Handpostings) During Year-End Financial Statement Closing Process 3 1.2 - % Uncleared Financial Control Transactions 4 1.3 - % of Employees on Direct Deposit and Receiving Electronic W-2 Forms 5 1.4 - % of Invoices by Payment Method 6
2. Financial Services & Controls 2.1 - P-Card Efficiency Gains as a % of Operational Expenses 7 2.2 - Number of Days Bank Paid Early to Maximize Purchase Card Incentive 8 2.3 - % of Air Spend Booked Through Connexxus 9 2.4 - % of Online Bookings 10 2.5 - MOP Utilization % 11 2.6 - Mortgage Origination Program (MOP) - Avg Loans Offered and Used 12
3. Risk Services 3.1 - Medical Center Cost of Claims per 10,000 Adjusted Patient Days 13 3.2 - % of FTE Eligible for Retirement 14 3.3 - % Continuity Plan Completion 15 3.4 - Systemwide Safety Index 16
4. Procurement Services 4.1 - Systemwide Savings 17 4.2 - Systemwide Procurement ROI 18
5. Capital Markets Finance 5.1 - Debt Service-to-Operations (%) 19 5.2 - Debt Burden-to-Student FTE ($) 20 5.3 - Expendable Resources-to-Debt 21 5.4 - Total Resources-to-Debt 22
2

CFO Division Campus Benchmarking Report# Manual Entries (Handpostings) During Year-End Financial Statement Closing Process
Number of Handpostings 2010-2012
0
5
10
15
20
25
30
35
40
Berkeley Davis Irvine Los Angeles Merced Riverside San Diego San Francisco Santa Barbara Santa Cruz
FY 2009-2010 FY 2010-2011 FY 2011-2012
---- Average
FY Berkeley Davis Irvine Los Angeles
Merced Riverside San Diego San Francisco
Santa Barbara
Santa Cruz
FY 2009-2010 10 26 24 15 10 14 33 14 18 6
FY 2010-2011 11 13 10 36 11 9 26 12 8 4
FY 2011-2012 7 9 11 39 16 4 10 19 19 5
Lines of Handpostings 2010-2012
0
100
200
300
400
500
600
700
800
Berkeley Davis Irvine Los Angeles Merced Riverside San Diego San Francisco Santa Barbara Santa Cruz
FY 2009-2010 FY 2010-2011 FY 2011-2012
---- Average
FY Berkeley Davis Irvine Los Angeles
Merced Riverside San Diego San Francisco
Santa Barbara
Santa Cruz
FY 2009-2010 204 139 436 101 47 49 728 234 72 57
FY 2010-2011 99 82 114 190 83 50 271 119 50 36
FY 2011-2012 23 51 172 250 168 20 87 114 156 26
Figure 1.1The campuses are required to submit electronic files containing financial data to the Office of the President on a monthly basis and during the year-end closing process. These files sometimes contain data errors that campuses are required to correct. Manual entries or handpostings are adjustments made after the campus general ledgers have been closed. These adjustments are posted to the UCOP systems and to the local campus systems, creating duplicate work. Additionally, the two sets of records must be reconciled to ensure entries were posted correctly in both systems. While handpostings may be made for other reasons besides correcting data errors, there is a high correlation between the number of handpostings as compared to the number of data errors. Thus, these charts are meant to serve as a proxy to campus data quality. Maintaining a low number or downward trend is preferred behavior. The average line is based upon 2012 data.
3 For the period ending June 30, 2013
CFO Division Campus Benchmarking Report% Uncleared Financial Control Transactions
0%
10%
20%
30%
40%
50%
60%
70%
80%
Berkeley Davis Irvine Los Angeles Merced Riverside San Diego San Francisco Santa Barbara Santa Cruz
AUG 2012 SEP 2012 OCT 2012 NOV 2012 DEC 2012 JAN 2013 FEB 2013 MAR 2013 APR 2013 MAY 2013
----Goal (20%)
Location AUG 2012 SEP 2012 OCT 2012 NOV 2012 DEC 2012 JAN 2013 FEB 2013 MAR 2013 APR 2013 MAY 2013
Berkeley 1.82% 12.03% 13.83% 20.09% 39.73% 23.52% 24.79% 16.22% 21.48% 23.99%
Davis 1.14% 6.55% 16.24% 11.68% 18.57% 4.71% 4.66% 4.34% 9.37% 5.45%
Irvine 2.67% 7.00% 9.89% 8.84% 15.70% 18.38% 10.50% 10.73% 10.89% 7.71%
Los Angeles 4.80% 18.04% 18.53% 22.04% 20.90% 26.60% 21.48% 20.75% 15.05% 17.25%
Merced 71.98% 63.78% 14.01% 13.50% 24.43% 14.91% 23.45% 17.95% 28.07% 27.84%
Riverside 6.75% 7.80% 12.17% 14.65% 19.05% 9.65% 16.02% 14.94% 19.06% 17.06%
San Diego 4.20% 13.36% 28.92% 17.92% 28.49% 26.21% 28.80% 24.31% 17.43% 16.55%
San Francisco 4.89% 14.11% 15.88% 15.93% 21.68% 18.38% 17.24% 15.71% 16.14% 13.93%
Santa Barbara 5.34% 12.46% 16.26% 24.11% 31.38% 23.82% 19.29% 23.68% 16.24% 23.61%
Santa Cruz 4.54% 14.46% 10.00% 12.97% 13.00% 11.11% 14.09% 18.33% 20.00% 10.39%
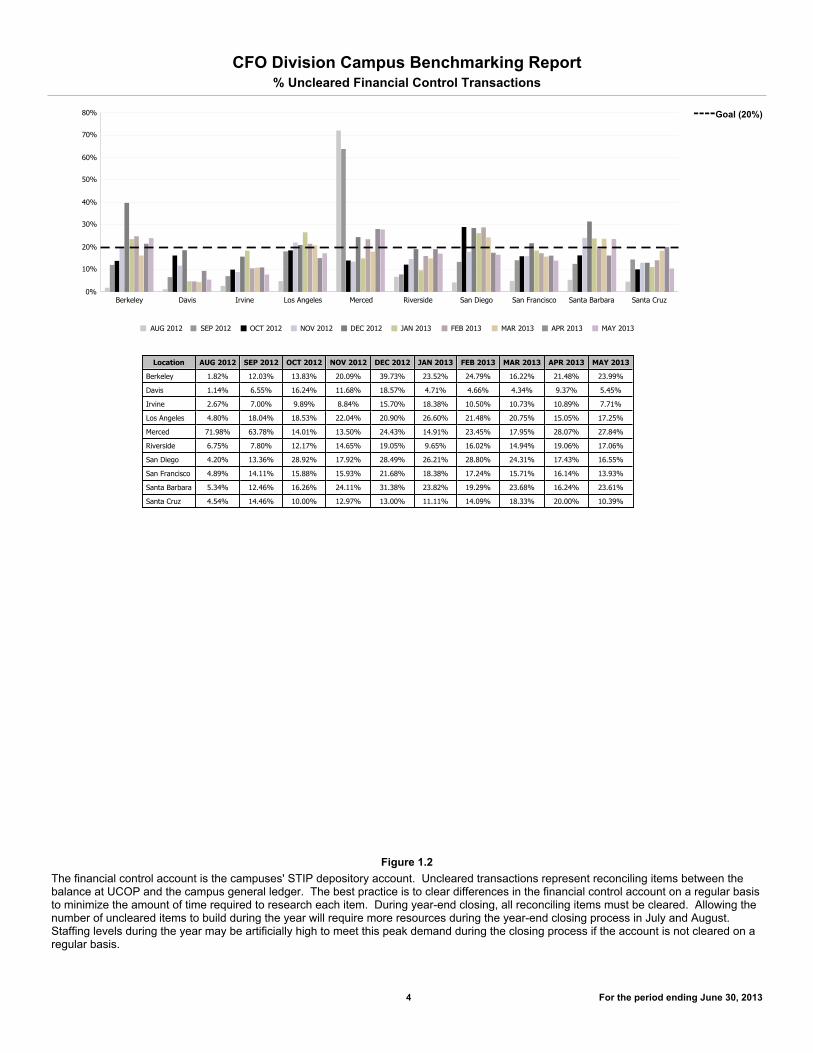
Figure 1.2The financial control account is the campuses' STIP depository account. Uncleared transactions represent reconciling items between the balance at UCOP and the campus general ledger. The best practice is to clear differences in the financial control account on a regular basis to minimize the amount of time required to research each item. During year-end closing, all reconciling items must be cleared. Allowing the number of uncleared items to build during the year will require more resources during the year-end closing process in July and August. Staffing levels during the year may be artificially high to meet this peak demand during the closing process if the account is not cleared on a regular basis.
4 For the period ending June 30, 2013

CFO Division Campus Benchmarking Report% of Employees on Direct Deposit and Receiving Electronic W-2 Forms
Percentage of Employees on Direct Deposit2010-2012
0%
20%
40%
60%
80%
100%
Berkeley Davis Irvine Los Angeles Merced Riverside San Diego San Francisco Santa Barbara Santa Cruz
2010 2011 2012
---- Goal (90%)
CY Berkeley Davis Irvine Los Angeles Merced Riverside San Diego San Francisco
Santa Barbara
Santa Cruz
2010 87.85% 96.46% 86.48% 90.20% 93.13% 74.33% 88.18% 94.52% 78.62% 66.21%
2011 91.83% 98.80% 87.98% 81.71% 86.32% 77.13% 88.24% 95.06% 78.27% 69.17%
2012 85.97% 92.66% 88.80% 90.29% 90.51% 77.83% 89.10% 95.22% 85.11% 74.32%
Percentage of Employees Receiving Electronic W-2 Forms2010-2012
0%
20%
40%
60%
80%
100%
Berkeley Davis Irvine Los Angeles Merced Riverside San Diego San Francisco Santa Barbara Santa Cruz
2010 2011 2012
---- Goal (60%)
CY Berkeley Davis Irvine Los Angeles Merced Riverside San Diego San Francisco
Santa Barbara
Santa Cruz
2010 22.17% 22.80% 27.28% 41.10% 46.72% 25.82% 23.38% 23.82% 10.56% 16.04%
2011 33.90% 40.50% 39.48% 57.45% 78.75% 32.70% 36.98% 41.81% 21.09% 27.83%
2012 56.40% 58.28% 51.49% 66.13% 88.42% 43.32% 54.93% 65.81% 34.30% 46.07%
Figure 1.3% employees on direct deposit for payroll measures the portion of employees who receive their pay via direct deposits rather than paper checks. For employees who use direct deposit, the University saves not only the costs of printing a paper form, but also mailing/postage costs for some of the forms as well. The University saves on the high cost of special paper stock as well as the high cost of the security necessary for a check-printing facility. % employees receiving electronic W-2 forms measures the portion of the employee population downloading W-2 forms rather than receiving paper copies in the mail. For employees who use electronic W-2 forms, the University saves not only the costs of printing a paper form, but mailing/postage costs as well. In Fall 2011, the AYS team developed a strategy whereby employees were presented with the opportunity to automatically enroll in electronic W-2 delivery. This strategy employed the use of “pop-up” screens that appeared whenever employees accessed their online earnings statement in AYSO, made changes to their tax withholdings, or made an election to receive their pay by direct deposit. This strategy helped drive the increase in online W-2 delivery for Calendar Year 2012.
5 For the period ending June 30, 2013
CFO Division Campus Benchmarking Report % of Invoices by Payment Method
0.00%
20.00%
40.00%
60.00%
80.00%
100.00%
Berkeley Davis Irvine Los Angeles Merced Riverside San Diego San Francisco Santa Barbara Santa Cruz
FY 2010-2011 FY 2011-2012
----Goal (85%)
FY 2011-2012 % of Invoices by Payment Method
Payment Methods Berkeley Davis Irvine Los Angeles Merced Riverside San Diego San Francisco
Santa Barbara
Santa Cruz
Other 0.27% 0.47% 0.30% 0.15% 0.00% 0.41% 0.08% 0.48% 6.65% 0.06%
ACH 39.90% 20.45% 35.92% 46.37% 45.79% 10.48% 14.44% 38.09% 31.27% 47.08%
PCard 34.25% 30.60% 32.37% 12.09% 8.08% 0.00% 48.16% 3.67% 8.69% 25.29%
Checks 25.58% 48.48% 31.41% 41.39% 46.14% 89.11% 37.33% 57.75% 53.38% 27.57%
FY 2010-2011 % of Invoices by Payment Method
Payment Methods Berkeley Davis Irvine Los Angeles Merced Riverside San Diego San Francisco
Santa Barbara
Santa Cruz
Other 0.38% 0.29% 0.61% 0.16% 0.00% 0.41% 0.00% 0.44% 5.58% 0.07%
ACH 35.88% 21.24% 36.91% 41.81% 37.91% 7.23% 15.08% 32.56% 31.50% 36.07%
PCard 36.92% 27.85% 31.69% 6.32% 8.12% 0.00% 41.95% 2.24% 7.30% 25.43%
Checks 26.82% 50.62% 30.80% 51.70% 53.98% 92.36% 42.98% 64.76% 55.62% 38.43%
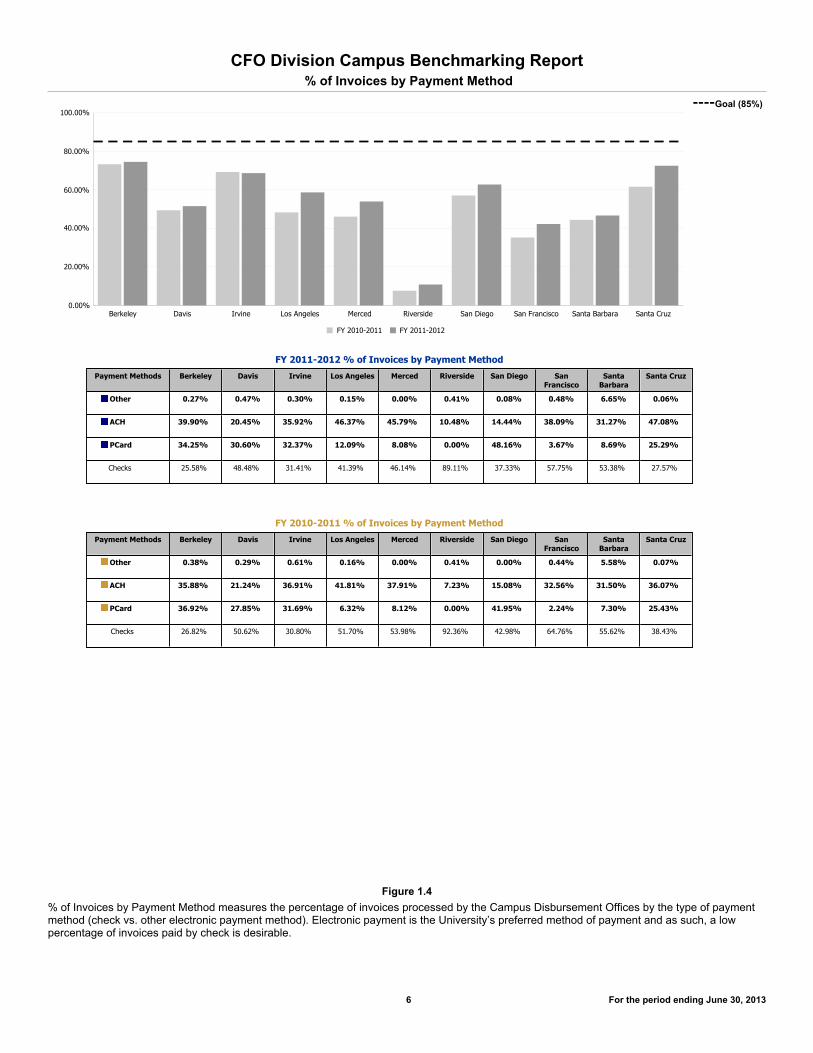
Figure 1.4% of Invoices by Payment Method measures the percentage of invoices processed by the Campus Disbursement Offices by the type of payment method (check vs. other electronic payment method). Electronic payment is the University’s preferred method of payment and as such, a low percentage of invoices paid by check is desirable.
6 For the period ending June 30, 2013

CFO Division Campus Benchmarking ReportP-Card Efficiency Gains as a % of Total Operational Expenses
0.00%
0.05%
0.10%
0.15%
0.20%
0.25%
0.30%
0.35%
0.40%
0.45%
Berkeley Davis Irvine Los Angeles Merced Riverside San Diego San Francisco Santa Barbara Santa Cruz
2010 2011 2012
---- Average
Location CY Administrative Efficiency Operational Expenses Ratio
Berkeley 2010 $7,706,595 $1,896,274,000 0.41%
2011 $8,668,855 $2,026,339,000 0.43%
2012 $6,582,585 $2,168,407,000 0.30%
Davis 2010 $8,024,185 $2,775,619,000 0.29%
2011 $8,695,715 $3,023,211,000 0.29%
2012 $9,887,155 $3,276,866,000 0.30%
Irvine 2010 $5,422,105 $1,770,719,000 0.31%
2011 $5,670,470 $1,920,315,000 0.30%
2012 $6,329,455 $2,066,866,000 0.31%
Los Angeles 2010 $924,755 $4,307,078,000 0.02%
2011 $1,558,550 $4,563,335,000 0.03%
2012 $2,219,010 $5,080,250,000 0.04%
Merced 2010 $171,470 $131,189,000 0.13%
2011 $213,720 $152,639,000 0.14%
2012 $103,785 $180,318,000 0.06%
Riverside 2010 $1,077,895 $554,839,000 0.19%
2011 $1,205,295 $603,598,000 0.20%
2012 $1,292,885 $639,131,000 0.20%
San Diego 2010 $8,534,820 $2,750,545,000 0.31%
2011 $9,228,800 $2,929,609,000 0.32%
2012 $9,839,185 $3,220,510,000 0.31%
San Francisco 2010 $908,505 $3,248,402,000 0.03%
2011 $1,219,375 $3,404,590,000 0.04%
2012 $1,798,140 $3,745,253,000 0.05%
Santa Barbara 2010 $913,055 $745,166,000 0.12%
2011 $1,117,025 $772,591,000 0.14%
2012 $1,449,970 $852,850,000 0.17%
Santa Cruz 2010 $1,972,555 $508,730,000 0.39%
2011 $1,891,890 $559,608,000 0.34%
2012 $1,860,270 $579,100,000 0.32%
Figure 2.1Purchase card administrative efficiency gains measure the number of transactions placed on the purchase card by location multiplied by the industry average savings associated with use of a purchase card. Industry data indicates that organizations save approximately $65 per transaction by making payments on a purchase card as opposed to paper checks. Savings indicate avoided costs associated with processing orders, invoices, and individual manual checks. For transactions that utilize the P-card as a payment tool, we’ve used $15 per transaction. This represents incentive plus avoidance cost of using check or ACH payment. The desired trend is higher. Calculation methodology was changed with the 2012 results, which allocates a smaller savings calculation ($15 versus the previously utilized $65) for the transactions where a physical card was not used. That will result in a one-time reduction in Campus efficiency. The operational expenses are per the financial statements.
7 For the period ending June 30, 2013

CFO Division Campus Benchmarking ReportNumber of Days Bank Paid Early to Maximize Purchase Card Incentive
0
5
10
15
20
25
30
35
40
45
Berkeley Davis Irvine Los Angeles Merced Riverside San Diego SanFrancisco
SantaBarbara
Santa Cruz
2012
---- Goal (40 days)
Location Total Incentives Generated
Volume No. of Days Annual Yield - Incremental % for
paying early
Berkeley $867,479 $49,962,027 40 3.67
Davis 965,400 48,781,407 39 3.59
Irvine 538,042 28,942,873 44 * 3.99
Los Angeles 962,348 52,274,271 39 3.59
Merced 4,801 326,753 13 1.32
Riverside 124,683 6,555,537 42 3.83
San Diego 1,601,798 83,798,492 44 * 3.99
San Francisco 358,069 18,474,071 17 1.72
Santa Barbara 225,312 12,261,279 44 * 3.99
Santa Cruz 95,774 5,553,063 35 3.22
AVERAGE 36 3.29
TOTAL 5,743,707 306,929,773
* Best Practice allows Autopay, as it minimizes effort and maximizes the overall income/return
Figure 2.2Incentives generated via purchase card measures the total incentive amounts generated by the campus for utilizing the purchase card program. Incentives are generated by means of the University's revenue sharing arrangement with its bank provider. Two main elements factor into the incentive payments: (1) volume of purchases placed on the card, and (2) speed of making payment to the bank. The graph above reflects the number of days early that the campus paid the bank.The desired trend is higher. The Annual Yield represents the incremental percent campuses receive for paying early. The earned incentive increases for every day before the 45 day deadline that campuses pay the bank for card usage. Based on STIP earnings in 2012, paying early generates a 74% higher return on Campus funds than does STIP (based on an annualized STIP Calculation of 2.44% for 2012. For more information on STIP rates, please see: http://www.ucop.edu/treasurer/_files/STIP_brochure.pdf)
8 For the period ending June 30, 2013
CFO Division Campus Benchmarking Report% of Air Spend Booked Through Connexxus
0%
20%
40%
60%
80%
100%
Berkeley Davis Irvine Los Angeles Merced Riverside San Diego San Francisco Santa Barbara Santa Cruz
CY 2011 CY 2012
---- Utilization Goal
Location Air Spend Booked Through Connexxus for Calendar 2011
Air Spend Booked Through Connexxus for Calendar 2012
Estimated Total Campus Air Spend Calendar Year 2012
Percentage of Estimate Calendar Year 2012
Berkeley $1,806,377 $6,547,111 $22,000,000 29.76%
Davis $3,784,452 4,612,624 8,600,000 53.64%
Irvine $302,051 829,814 5,200,000 15.96%
Los Angeles $8,970,211 9,680,529 18,000,000 53.78%
Merced $514,808 672,366 800,000 84.05%
Riverside $632,466 696,217 2,600,000 26.78%
San Diego $3,917,870 4,968,661 9,800,000 50.70%
San Francisco $2,834,880 2,702,365 9,300,000 29.06%
Santa Barbara $840,444 1,226,870 4,000,000 30.67%
Santa Cruz $439,574 442,355 3,880,000 11.40%
Totals $24,043,133 $32,378,912 $84,180,000
Weighted Average Utilization 38.46%
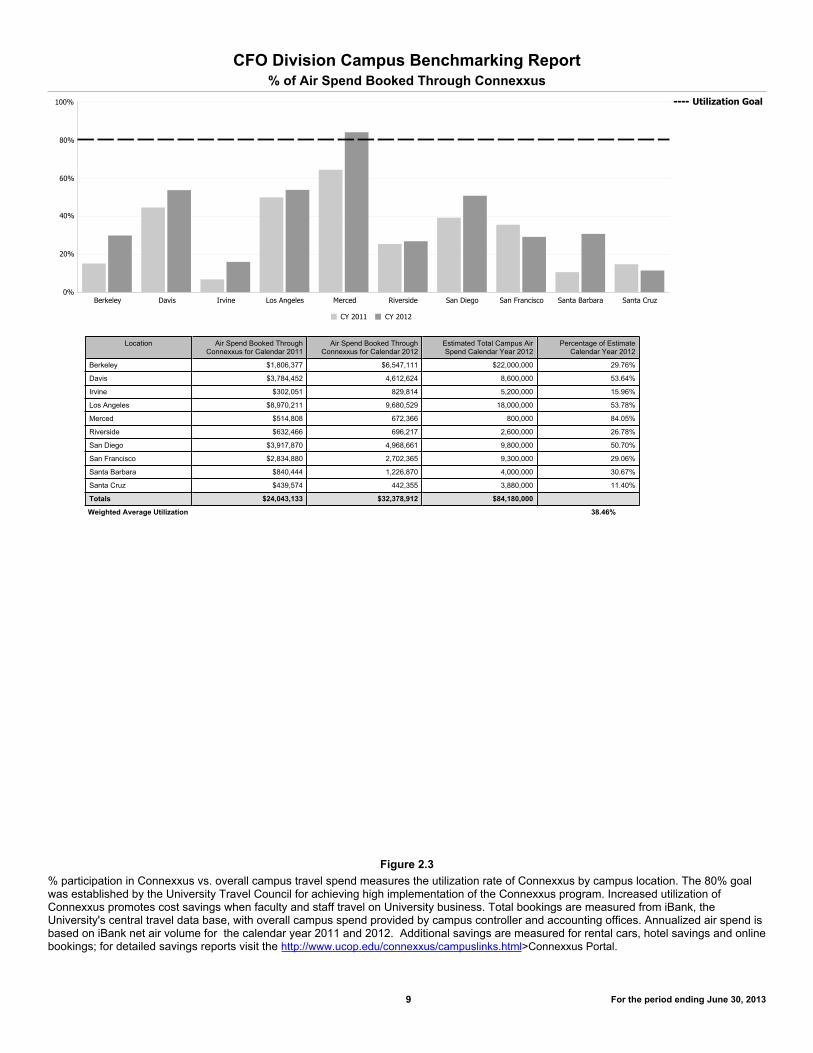
Figure 2.3% participation in Connexxus vs. overall campus travel spend measures the utilization rate of Connexxus by campus location. The 80% goal was established by the University Travel Council for achieving high implementation of the Connexxus program. Increased utilization of Connexxus promotes cost savings when faculty and staff travel on University business. Total bookings are measured from iBank, the University's central travel data base, with overall campus spend provided by campus controller and accounting offices. Annualized air spend is based on iBank net air volume for the calendar year 2011 and 2012. Additional savings are measured for rental cars, hotel savings and online bookings; for detailed savings reports visit the http://www.ucop.edu/connexxus/campuslinks.html>Connexxus Portal.
9 For the period ending June 30, 2013

CFO Division Campus Benchmarking Report% of Online Bookings
0%
20%
40%
60%
80%
100%
UCB UCD UCI UCLA UCM UCR UCSD UCSF UCSB UCSC
Q2-2012 Q3-2012 Q4-2012 Q1-2013
---- Goal
Location Q2-2012 Q3-2012 Q4-2012 Q1-2013 Average Actual Savings CY YTD
UCB 67% 77% 73% 63% 70% $58,152
UCD 68% 76% 73% 63% 70% $42,936
UCI 63% 74% 82% 72% 73% $10,224
UCLA 18% 17% 17% 23% 19% $28,056
UCM 63% 58% 63% 61% 61% $6,072
UCR 93% 95% 94% 91% 93% $11,760
UCSD 38% 40% 37% 38% 38% $23,856
UCSF 73% 64% 61% 58% 64% $23,856
UCSB 35% 44% 39% 42% 40% $7,080
UCSC 38% 35% 32% 31% 34% $2,040
Total Savings 5.5733131 5.79510432 5.71338126 5.41555252 22.4973512 $214,032
Figure 2.4Online % measures the level of booking online through Connexxus as a percentage of total bookings. The goal of 60% online bookings promotes cost savings for the Connexxus program. Fees for booking transactions online are considerably less expensive than agency fees via a travel agent. Total air bookings are measured from iBank, the University’s central travel database.
10 For the period ending June 30, 2013

CFO Division Campus Benchmarking ReportMortgage Origination Program (MOP) Take Rate Percentage
MOP Utilization % July 1, 2009 through June 30, 2013
0%
10%
20%
30%
40%
50%
60%
70%
80%
90%
100%
Berkeley Davis Irvine Los Angeles Merced Riverside San Diego San Francisco Santa Barbara Santa Cruz SystemWideTotal
Take Rate % of # Offered % of $ Offered
---- Average (% Offered)---- Average (% Take Rate)
Campus7/1/2009 - 6/30/2013
Funds Available# of Loans
Offered $ Amount# of Loans
Funded $ Amount
# of Outstanding
Offers$ Amount
OutstandingTake Rate % of
# Offered% of $
Offered
Berkeley 125,320,672 169 146,705,250 92 60,327,600 39 35,595,000 54% 41%
Davis 88,069,016 128 79,409,000 63 27,027,050 18 13,029,000 49% 34%
Irvine 99,130,220 169 77,626,915 127 52,627,900 21 10,240,152 75% 68%
Los Angeles 240,407,850 181 167,553,450 90 76,674,300 25 24,730,000 50% 46%
Merced 26,611,850 67 23,530,000 12 2,614,800 34 12,100,000 18% 11%
Riverside 30,257,129 39 12,338,100 21 6,326,350 16 4,952,700 54% 51%
San Diego 123,472,150 188 140,577,100 57 37,858,200 90 66,555,000 30% 27%
San Francisco 81,950,075 64 62,050,000 9 5,937,000 45 43,650,000 14% 10%
Santa Barbara 73,057,925 113 149,450,000 30 16,570,950 59 78,440,000 27% 11%
Santa Cruz 45,408,025 54 33,821,100 30 13,842,700 15 11,390,000 56% 41%
SystemWide Total 933,684,912 1172 893,060,915 531 299,806,850 362 300,681,852 45% 34%
Figure 2.5
Of the loans offered during the 4-year time period referenced, Figure 2.5 displays the # and $ amount of those offered loans that were actually funded during the same 4-year time period.
The total allocation available shown in the table is equal to the sum of the remaining allocation as of June 30, 2009, plus the additional funds that were allocated in April 2010 and January 2013.
Notes:1. Market conditions and campus considerations that influence the utilization rates of the MOP program include: - The state of the housing market – given the downturn in the market, many potential borrowers want to wait and see whether values will continue to decrease. - Interest rate trends – many potential borrowers will use a conventional lender when fixed rates are low. - Annual recruitment numbers at each campus. - Campus prioritization of the allocation – some campuses reserve their allocation for “stars” that they want to recruit, and some are very conservative with
their allocation to ensure that they will have funds available in the future. There is always an unknown on how much will be allocated in the next cycle.
2. The take rate percentage is also influenced by differences in campus procedures:
- Berkeley, Davis, Irvine, Riverside, San Francisco and Santa Cruz do not track loan offers until the applicant expresses interest in the program. This results in a higher utilization rate as candidates who received loan offers but never contacted the campus housing office are not included in the percentages displayed in the chart.
- UCLA, Santa Barbara, San Diego and Merced track loan offers from the time the department issues a letter to a candidate, regardless of whether the candidate has indicated immediate interest in purchasing a home. Often, candidates are waiting to save money for a downpayment or rent for a period of time in order to get to know the area.
- At Santa Barbara and San Diego, all eligible recruits are offered a loan.
3. Figures provided for the San Francisco campus represent a small sample, as complete data is not available.
11 For the period ending June 30, 2013

CFO Division Campus Benchmarking ReportMortgage Origination Program (MOP) Loan Amounts
Comparison of Average Loan Amount Offered vs. Average Loan Amount Utilized July 1, 2009 through June 30, 2013
$0
$200,000
$400,000
$600,000
$800,000
$1,000,000
$1,200,000
$1,400,000
Berkeley Davis Irvine Los Angeles Merced Riverside San Diego San Francisco Santa Barbara Santa Cruz SystemWideTotal
Average Loan Amt Offered Average Loan Amount Used
---- Average (Loan Offered)---- Average (Loan Used)
Campus# of Loans
Offered $ Amount# of Loans
Funded $ AmountAverage Loan Amt
OfferedAverage Loan Amount
Used% of $
Offered
Berkeley 169 146,705,250 92 60,327,600 868,078 655,735 76%
Davis 128 79,409,000 63 27,027,050 620,383 429,001 69%
Irvine 169 77,626,915 127 52,627,900 459,331 414,393 90%
Los Angeles 181 167,553,450 90 76,674,300 925,710 851,937 92%
Merced 67 23,530,000 12 2,614,800 351,194 217,900 62%
Riverside 39 12,338,100 21 6,326,350 316,362 301,255 95%
San Diego 188 140,577,100 57 37,858,200 747,751 664,179 89%
San Francisco 64 62,050,000 9 5,937,000 969,531 659,667 68%
Santa Barbara 113 149,450,000 30 16,570,950 1,322,566 552,365 42%
Santa Cruz 54 33,821,100 30 13,842,700 626,317 461,423 74%
SystemWide Total 1172 893,060,915 531 299,806,850 761,997 564,608 74%
Notes:Market conditions and campus considerations that influence the utilization rates of the MOP program include:1. The state of the housing market – given the downturn in the market, many potential borrowers want to wait and see whether values will continue to decrease.2. Interest rate trends – many potential borrowers will use a conventional lender when fixed rates are low.3. Annual recruitment numbers at each campus.4. Campus prioritization of the allocation – some campuses reserve their allocation for “stars” that they want to recruit, and some are very conservative with their allocation to ensure that they will have funds available in the future. There is always an unknown on how much will be allocated in the next cycle.
Figure 2.6For 4 of the campuses, the loan amount used is within 11% of the amount that was offered. For the remaining campuses, the average loan amount used is more that 20% less than what was offered, with the Merced and Santa Barbara campuses having the lowest correlation. To more efficiently manage the allocation, these campuses could offer lower loan amounts, and adjust them upward as needed on a case-by-case basis.
12 For the period ending June 30, 2013

CFO Division Campus Benchmarking ReportMedical Center Cost of Claims per 10,000 Adjusted Patient Days
$0
$20,000
$40,000
$60,000
$80,000
$100,000
$120,000
Davis MC Irvine MC Los Angeles MC San Diego MC San Francisco MC
FY 2012-2013
Medical Center Location
Total Incurred Adjusted Patient Days Total Cost of Incurred Claims by Occurrence
Date per 10,000 Adjusted Patient Days
Davis MC $420,500 242,026 $17,374
Irvine MC 1,375,000 134,528 102,209
Los Angeles MC 2,222,310 358,182 62,044
San Diego MC 455,377 244,274 18,642
San Francisco MC 740,052 266,818 27,736
Medical Center Average
$1,042,648 249,166 $41,846
6 month rolling average
$270,386 175,707 $15,388
Note: The following Medical Center locations include Adjusted Patient Days for affiliates as defined below: UCLA Medical Center = UCLA Medical Center, Ronald Reagan, Santa Monica and Resnick Neuropsychiatric UCSD Medical Center = UCSD Medical Center, Hillcrest and Thorton UCSF Medical Center = UCSF Medical Center, Parnassus and Mt. Zion
---- Average
Figure 3.1The medical center cost of claims per 10,000 adjusted patient days index provides an enterprise-wide view of how each medical center is trending relative to other UC medical centers on liability for medical malpractice relative to exposures (adjusted patient days). This comparison and trending allows UC to identify areas of concern and best practices. The desired trend is keeping the total incurred low. Data shown is from July, 2012 through May, 2013.
13 For the period ending June 30, 2013

CFO Division Campus Benchmarking Report% of FTE Eligible for Retirement
Month Year: Apr 2013
0%
5%
10%
15%
20%
25%
30%
35%
Berkeley Davis Davis MC Irvine Irvine MC LosAngeles
LosAngeles
MC
Merced Riverside San Diego San DiegoMC
SanFrancisco
SanFrancisco
MC
SantaBarbara
SantaCruz
---- Campus Average---- Medical Center Average
Location Count of FTEs Eligible for Retirement
Count of FTEs Ratio
Berkeley 3,844.51 13,783.43 27.89%Davis 3,860.93 14,447.89 26.72%Davis MC 2,257.93 6,985.72 32.32%Irvine 2,166.49 8,993.55 24.09%Irvine MC 1,205.99 4,234.98 28.48%Los Angeles 5,267.15 20,647.79 25.51%Los Angeles MC 2,757.30 10,906.98 25.28%Merced 202.68 1,485.96 13.64%Riverside 1,265.07 4,748.56 26.64%San Diego 3,984.58 15,642.80 25.47%San Diego MC 1,555.13 5,476.49 28.40%San Francisco 2,983.59 11,829.31 25.22%San Francisco MC 2,349.13 7,576.09 31.01%Santa Barbara 1,664.09 6,016.11 27.66%Santa Cruz 1,308.08 4,283.47 30.54%
UC Campus Average 2,654.72 10,187.89 26.06%UC Medical Center Average 2,025.10 7,036.05 28.78%
Figure 3.2% FTE eligible for retirement is a snapshot that measures the risk of losing significant institutional knowledge suddenly. Departments with a high percentage of employees ready to retire are at greater risk of losing institutional knowledge and have a greater need for succession planning. It is critical that administration identify departments that are in need of assistance. Retirement Eligibility criteria depends on age and tenure with the University. The desired trend is lower. For this report, retirement eligibility is considered a minimum of 50 years of age and 5 years of service as of April 30, 2013. The Enterprise Risk Management Information System (ERMIS) collects more detailed information about retirement eligibility including breakdowns of ages and departments. To get more information please contact the ERM Service Desk at [email protected].
14 For the period ending June 30, 2013

CFO Division Campus Benchmarking Report% Continuity Plan Completion
0%
20%
40%
60%
80%
100%
Berkeley Davis Davis MC Irvine Los Angeles Los AngelesMC
Merced Riverside San Diego San Francisco Santa Barbara Santa Cruz
---- Goal (75%)
Location Total Expected Plans
Plans Completed Plans In Progress
Total Plans Percent Completed*
Berkeley 400 225 86 311 56.25%
Davis 165 96 56 152 58.18%
Davis MC 116 99 13 112 85.34%
Irvine 242 168 42 210 69.42%
Los Angeles 283 213 27 240 75.27%
Los Angeles MC 465 51 91 142 10.97%
Merced 43 38 9 47 88.37%
Riverside 145 95 44 139 65.52%
San Diego 300 95 104 199 31.67%
San Francisco 460 426 24 450 92.61%
Santa Barbara 130 59 27 86 45.38%
Santa Cruz 200 39 89 128 19.50%
Enterprise Total 2,949 1,604 612 2,216
Enterprise Average 54.39%
* Percent completed = Number of Plans Complete / Total Expected Number of Plans
Figure 3.3% continuity plan completion measures the extent to which a campus is "event ready" so that it can continue the UC mission with minimal interruption. The UC Ready continuity tool is an online program that allows all departments to easily produce a continuity plan to prepare for and cope with events. Currently, only two medical centers participate in the UC Ready continuity planning: Davis and Los Angeles. Data shown is as of May 31, 2013.
15 For the period ending June 30, 2013

CFO Division Campus Benchmarking ReportSystemwide Safety Index
0
0.4
0.8
1.2
1.6
2
2.4
2.8
UCB UCD UCD MC UCI UCI MC UCLA UCLA MC UCM UCR UCSD UCSD MC UCSF UCSF MC UCSB UCSC
---- Goal (2.5)
Key Performance Indicators UCB UCD UCD MC
UCI UCI MC
UCLA UCLA MC
UCM UCR UCSD UCSD MC
UCSF UCSF MC
UCSB UCSC
KPI #01 WC Incidents Relative to FTE, Hours Worked and Headcount3 3 3 1 1 1 2 3 1 3 1 3 3 1 1
KPI #02 Vehicle Events Relative to Fleet Size1 2 1 3 3 1 3 1 1 3 3 1 3 1 1
KPI #03 General Liability Events Relative to Outer Gross Acres3 1 1 3 3 3 3 3 1 3 3 1 1 3 3
KPI #04 General Liability Events Relative to Student Population3 3 3 3 3 3 3 3 3 3 3 3 3 3 3
KPI #05 General Liability Events Relative to Expenditure3 1 3 3 3 3 3 3 3 1 3 3 1 1 3
KPI #06 Property Loss Relative to Annual Expenditure3 3 3 1 3 1 2 3 3 3 1 1 3 1 1
KPI #07 Property Losses Relative to Outer Gross Acres3 3 3 1 3 3 1 1 3 3 1 1 3 1 1
KPI #08 NFPA Emergency Management Compliance1 3 3 2 3 1 3 1 2 3 3 2 3 3 3
KPI #09 OSHA Recordable Rate3 3 3 1 1 1 2 3 1 3 1 3 3 1 1
KPI #10 OSHA Lost Time Rate3 3 3 3 3 1 1 1 3 3 1 3 1 1 3
KPI #11 OSHA Lost Time Days Rate3 3 3 3 3 1 1 1 3 3 3 1 1 3 3
Monthly Average Score 2.64 2.55 2.64 2.18 2.64 1.73 2.18 2.09 2.18 2.82 2.09 2.00 2.27 1.73 2.096 Month Rolling Avg Campus 1.90 2.50 N/A 2.20 N/A 1.70 N/A 2.20 2.20 2.70 N/A 1.70 N/A 2.00 2.006 Month Rolling Avg Medical Center N/A N/A 2.30 N/A 2.40 N/A 2.10 N/A N/A N/A 2.30 N/A 2.50 N/A N/A
Figure 3.4The systemwide safety index is a monthly snapshot. Because the snapshot can vary widely from month to month as a result of safety-event occurrences, the performance categories are based on a six-month rolling average. A six-month rolling average of 0.0 to 1.9 is under-performance; 2.0 to 2.4 is average performance; and 2.5 to 3.0 is high performance. The systemwide safety index measures relative campus performance based on several unique key performance indicators, which are detailed in the table above. Trends can be identified by cause of loss by department, which aids in strategically deploying resources and identifying appropriate loss-control and loss-prevention techniques. Data shown is as of April 30, 2013.
16 For the period ending June 30, 2013

CFO Division Campus Benchmarking ReportSystemwide Savings
UC Procurement Savings by Quarter
$0
$2
$4
$6
$8
$10
$12
Q1 FY 2012-2013 Q2 FY 2012-2013 Q3 FY 2012-2013
$9$10 $10
$8
$10
$6
$2 $1 $1
Systemwide Savings Local Savings Systemwide Incentives
Mill
ion
s
UC Procurement Q1 FY 2012-2013 Q2 FY 2012-2013 Q3 FY 2012-2013
Systemwide Savings $9,208,458 $10,325,777 $10,466,368
Local Savings $8,221,063 $9,574,228 $5,779,167
Systemwide Incentives $1,928,229 $1,478,049 $1,487,605
UC Procurement Cumulative Savings
$0
$10
$20
$30
$40
$50
$60
Q1 FY 2012-2013 Q2 FY 2012-2013 Q3 FY 2012-2013$2 $3 $5$8
$18$24$9
$20
$30
Systemwide Incentives Local Savings Systemwide Savings
Mill
ion
s
Cumulative
UC Procurement Q1 FY 2012-2013 Q2 FY 2012-2013 Q3 FY 2012-2013
Systemwide Savings $9,208,458 $19,534,235 $30,000,603
Local Savings $8,221,063 $17,795,291 $23,574,458
Systemwide Incentives $1,928,229 $3,406,278 $4,893,883
Figure 4.1As part of the P200 Program, Procurement is implementing new tools which will be used to validate and confirm this information. Through this work, these updated metrics will again be revised for FQ1 2014 reporting. Currently, this data is reported by our supplier partners, UCOP and by the campuses and definitions for each metric may not be comparable. Systemwide savings are estimated by UCOP. Savings generated by local agreements are measures of cost savings achieved through professional actions of the campus local Procurement departments. Data is shown from July 1, 2012 through March 30, 2013.
17 For the period ending June 30, 2013

CFO Division Campus Benchmarking ReportSystemwide Procurement ROI
UC Procurement ROI
$0
$4
$8
$12
$16
$20
$24
0%
40%
80%
120%
160%
200%
240%
280%
Q1 FY 2012-2013 Q2 FY 2012-2013 Q3 FY 2012-2013
$19
$21
$18
$7$6 $6
176%
258%
182%
Mill
ion
s
Total Savings Procurement Operating Budget ROI
Q1 FY 2012-2013 Q2 FY 2012-2013 Q3 FY 2012-2013
Total Savings $19,357,750 $21,378,054 $17,733,140
Procurement Operating Budget $7,020,771 $5,978,715 $6,295,317
ROI 176% 258% 182%
Figure 4.2As part of the P200 Program, Procurement is implementing new tools which will be used to validate and confirm this information. Through this work, these updated metrics will again be revised for FQ1 2014 reporting. Currently, this data is reported by our supplier partners, UCOP and by the campuses and definitions for each metric may not be comparable. Total Savings is the sum of Systemwide Savings, Local Savings, and Incentives. Procurement Operating Budget is the quarterly cost to run the central Procurement organization. Data is shown from July 1, 2012 through March 30, 2013.
18 For the period ending June 30, 2013

CFO Division Campus Benchmarking ReportDebt Service-to-Operations (%)
0%
1%
2%
3%
4%
5%
6%
Berkeley Davis Irvine Los Angeles Merced Riverside San Diego San Francisco Santa Barbara Santa Cruz
FY 2009-2010 FY 2010-2011 FY 2011-2012
----Goal (3%)---- Average
FY Berkeley Davis Irvine Los Angeles Merced Riverside San Diego San Francisco Santa Barbara
Santa Cruz
2009-2010 2.89% 2.25% 3.94% 3.46% 3.02% 3.02% 3.21% 2.09% 4.90% 4.15%
2010-2011 2.71% 2.47% 3.81% 3.41% 3.84% 2.98% 3.44% 2.47% 4.75% 4.60%
2011-2012 2.96% 2.43% 3.81% 3.06% 4.44% 3.26% 3.54% 2.49% 4.30% 4.77%
Figure 5.1Debt service-to-operations measures the burden of debt payment services relative to the campus's operating budget, thus, the desired trend is lower. A higher percentage of debt service to budget can negatively affect the campus's future financial flexibility. Data is calculated from General Revenue Bonds, Limited Project Revenue Bonds and certain third-party transactions. Please note that medical centers are excluded as are GRB Series Y, Z, and AA-2. Financial data as of June 30, 2012. Debt data as of October 16, 2012 (excludes State Public Works Board debt). Debt service is net of Build America Bonds subsidies and capitalized interest.
19 For the period ending June 30, 2013

CFO Division Campus Benchmarking ReportDebt Burden-to-Student FTE ($)
$0
$20,000
$40,000
$60,000
$80,000
$100,000
$120,000
$140,000
$160,000
$180,000
Berkeley Davis Irvine Los Angeles Merced Riverside San Diego San Francisco Santa Barbara Santa Cruz
FY 2009-2010 FY 2010-2011 FY 2011-2012
---- Average
FY Berkeley Davis Irvine Los Angeles Merced Riverside San Diego San Francisco* Santa Barbara Santa Cruz
2009-2010 $40,826 $23,928 $26,500 $53,397 $36,400 $17,482 $42,107 $154,199 $27,663 $23,726
2010-2011 $39,771 $23,855 $26,335 $52,319 $39,310 $18,202 $41,598 $172,024 $27,006 $22,908
2011-2012 $44,413 $21,602 $25,267 $54,738 $32,746 $17,881 $44,474 $167,230 $26,743 $21,669
Figure 5.2Debt burden-to-student measures the institution’s debt obligations against its student population, thus, the desired trend is lower. It is a relative measure of debt burden broken down by campus student population size. Data is calculated from General Revenue Bonds, Limited Project Revenue Bonds and certain third-party transactions. Please note that medical centers are excluded as are GRB Series Y, Z, and AA-2. The average line represents the 2012 average. Financial data as of June 30, 2011. Debt data as of October 16, 2012 (excludes State Public Works Board debt). * San Francisco enrolls health sciences students only.
20 For the period ending June 30, 2013

CFO Division Campus Benchmarking ReportExpendable Resources-to-Debt
0.0x
0.5x
1.0x
1.5x
2.0x
2.5x
3.0x
3.5x
4.0x
Berkeley Davis Irvine Los Angeles Merced Riverside San Diego San Francisco Santa Barbara Santa Cruz
FY 2011-2012
---- Goal (1.25x)---- Average
FY Berkeley Davis Irvine Los Angeles Merced Riverside San Diego San Francisco Santa Barbara Santa Cruz
2011-2012 2.19x 1.93x 1.22x 1.82x 0.54x 1.21x 1.11x 3.52x 0.84x 1.16x
Figure 5.3Expendable resources-to-debt is a balance sheet ratio that measures how well a campus’s total debt burden is covered by financial resources that are ultimately expendable (not permanently restricted), the desired trend is higher. This ratio measures the strength of the campus’s available financial resources against its debt obligations. The ratio does not include campus net investment in plant. Data is calculated from General Revenue Bonds, Limited Project Revenue Bonds and certain third-party transactions. Please note that medical centers are excluded as are GRB Series Y, Z, and AA-2. Financial data as of June 30, 2012. Debt data as of October 16, 2012 (excludes State Public Works Board debt).
21 For the period ending June 30, 2013

CFO Division Campus Benchmarking ReportTotal Resources-to-Debt
0%
0.5x
1.0x
1.5x
2.0x
2.5x
3.0x
3.5x
4.0x
4.5x
Berkeley Davis Irvine Los Angeles Merced Riverside San Diego San Francisco Santa Barbara Santa Cruz
FY 2011-2012
---- Goal (1.75x)---- Average
FY Berkeley Davis Irvine Los Angeles Merced Riverside San Diego San Francisco Santa Barbara Santa Cruz
2011-2012 2.91x 2.34x 1.48x 2.29x 0.67x 1.45x 1.38x 4.21x 1.03x 1.25x
Figure 5.4Total resources-to-debt is a balance sheet ratio that measures the coverage of a campus’s total debt burden by total financial resources including permanently-restricted assets, the desired trend is higher. This ratio measures the strength of the campus’s total financial resources against its debt obligations. The ratio does not include campus net investment in plant. Data is calculated from General Revenue Bonds, Limited Project Revenue Bonds and certain third-party transactions. Please note that medical centers are excluded as are GRB Series Y, Z, and AA-2. Financial data as of June 30, 2012. Debt data as of October 16, 2012 (excludes State Public Works Board debt).
22 For the period ending June 30, 2013