F2014 workshop 3 presentation
71
DIGITAL DEPLOYMENT Welcome to Brought to you by
-
Upload
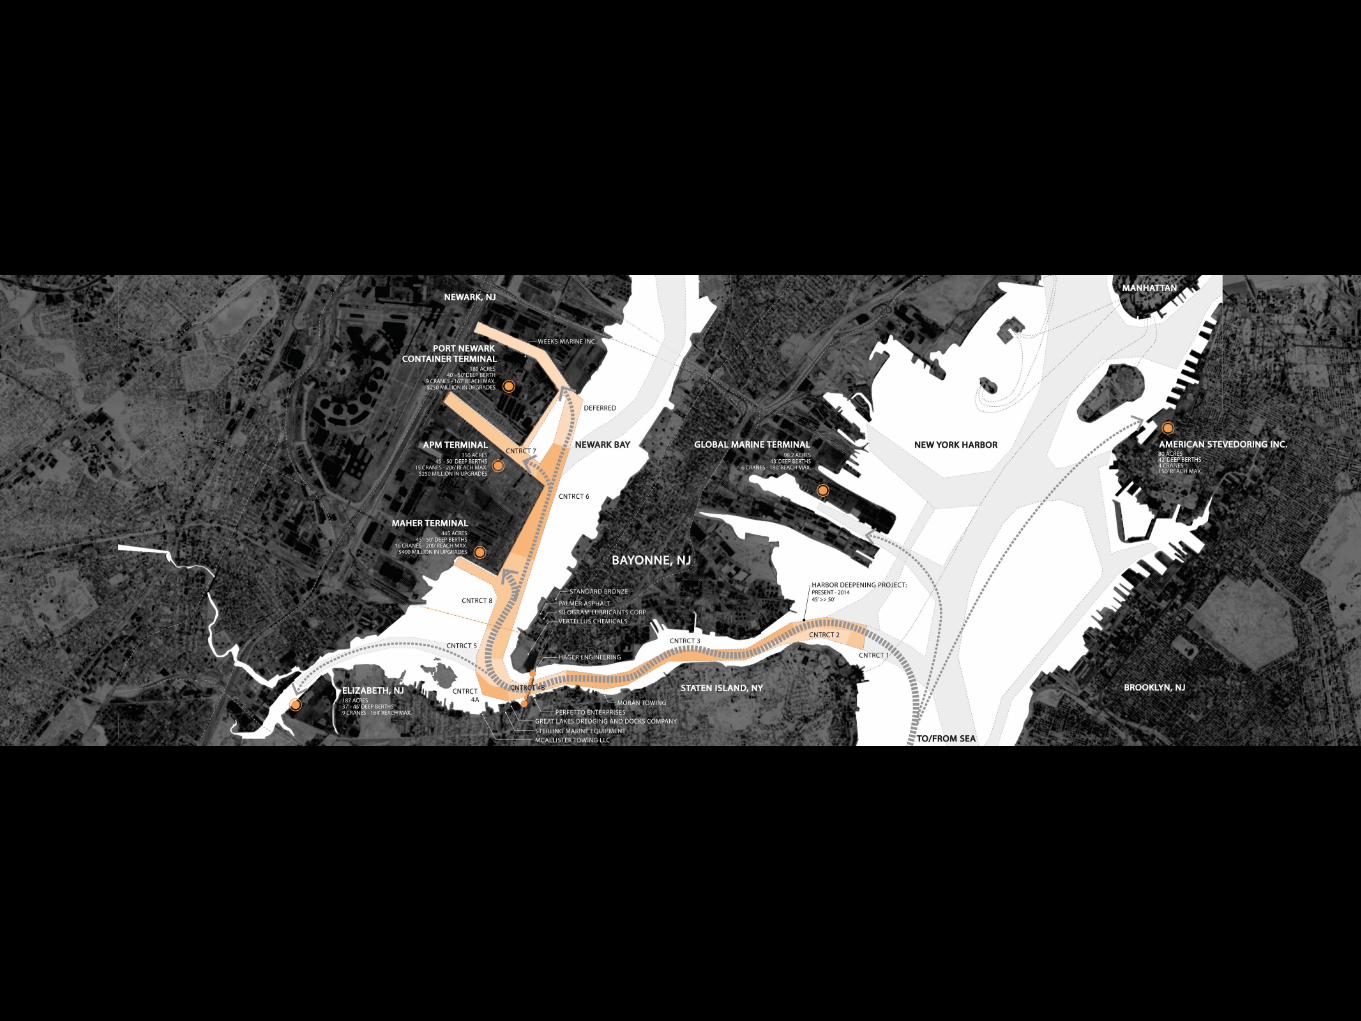
section-cut -
Category
Documents
-
view
225 -
download
0
description
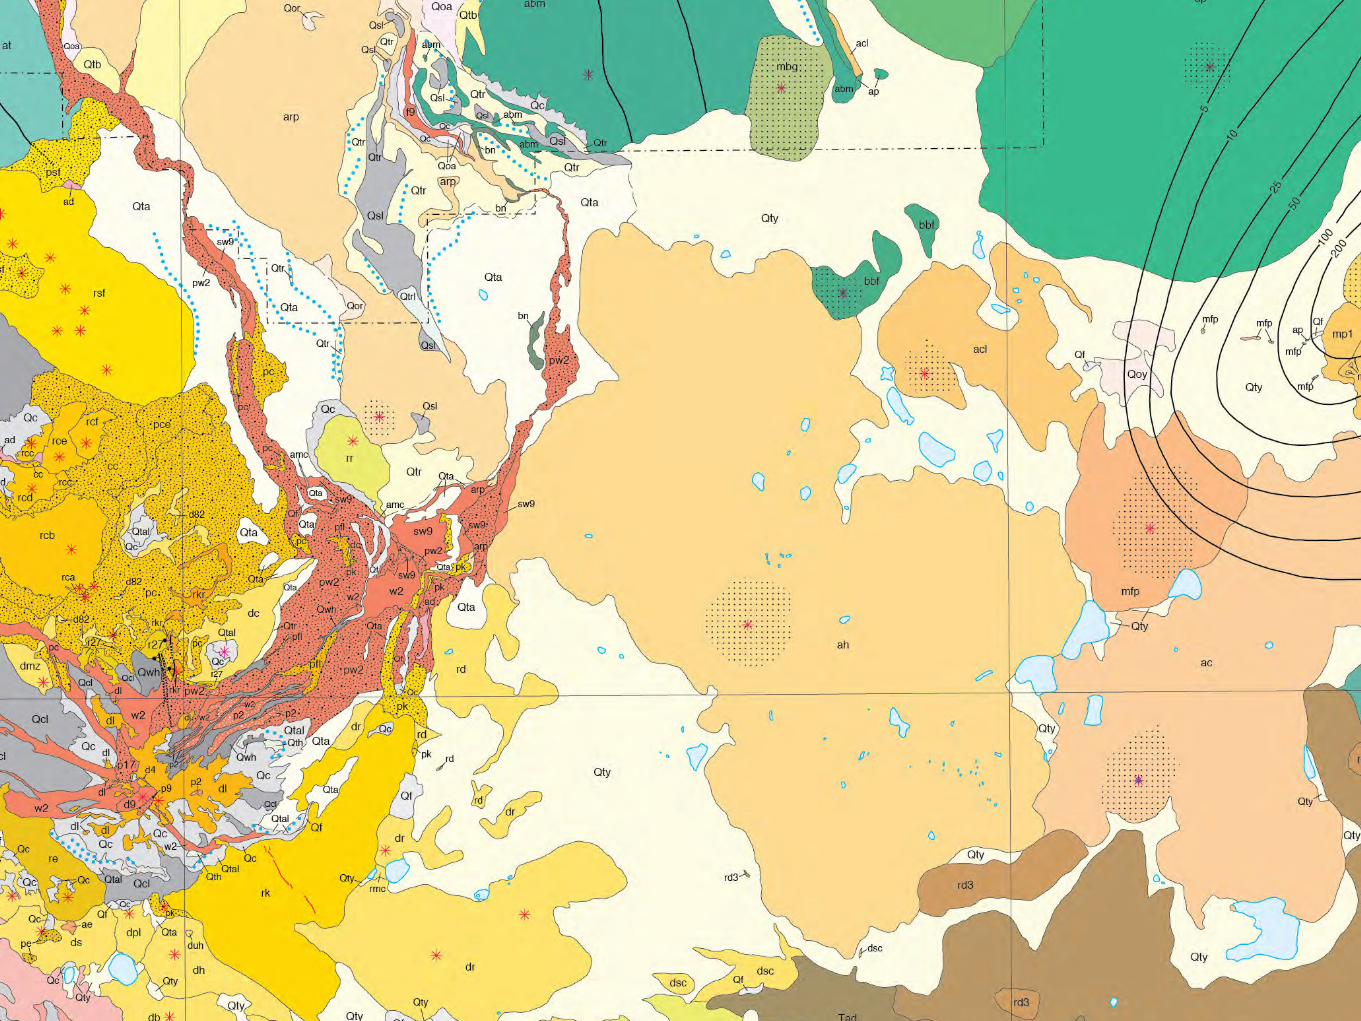
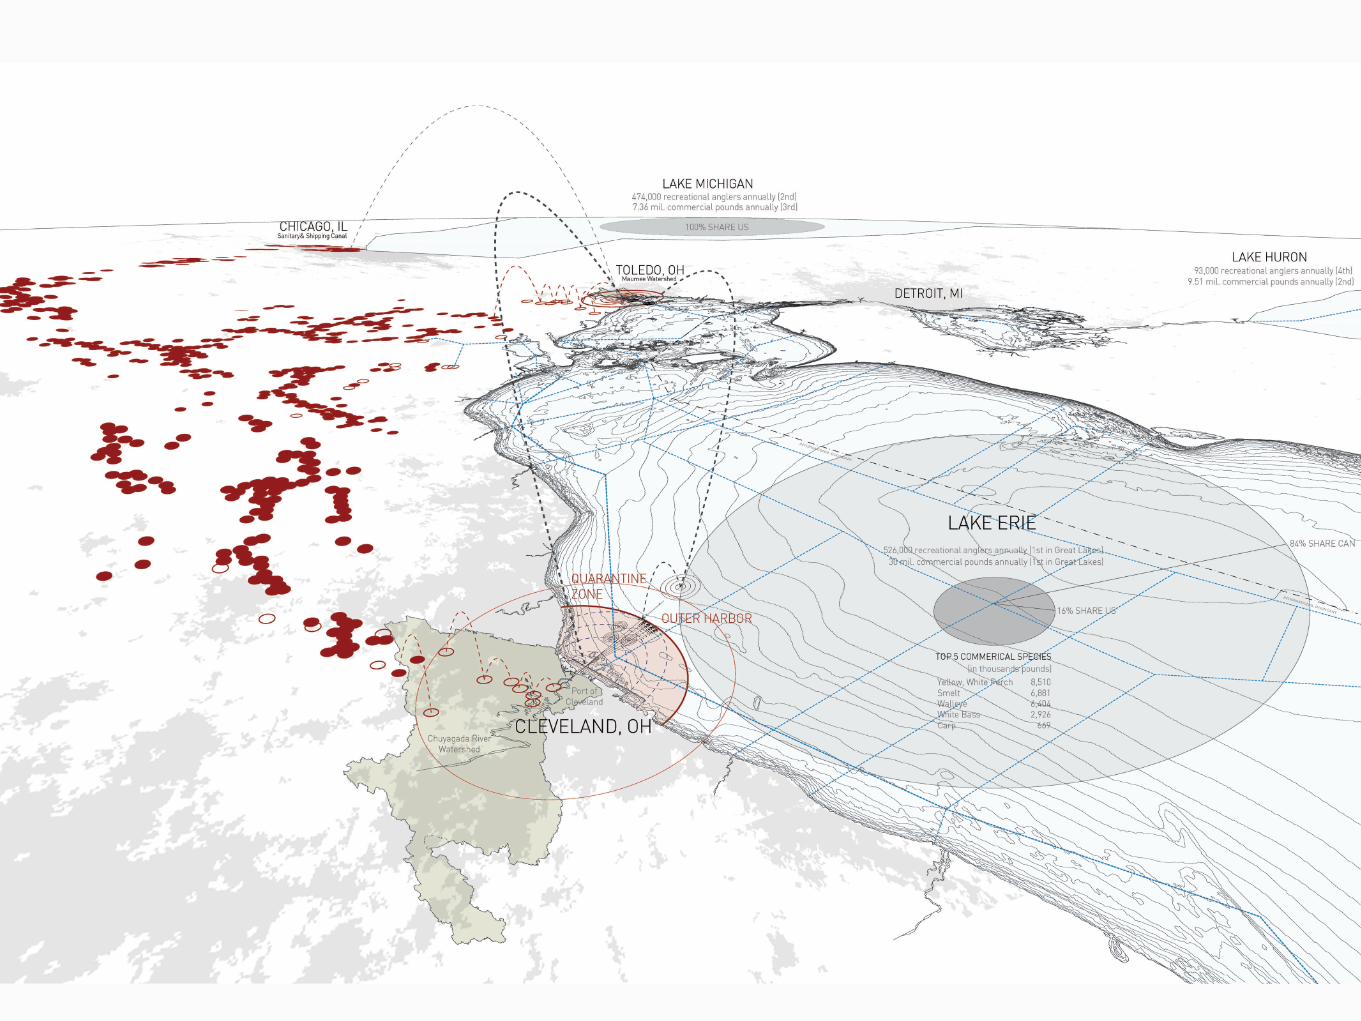
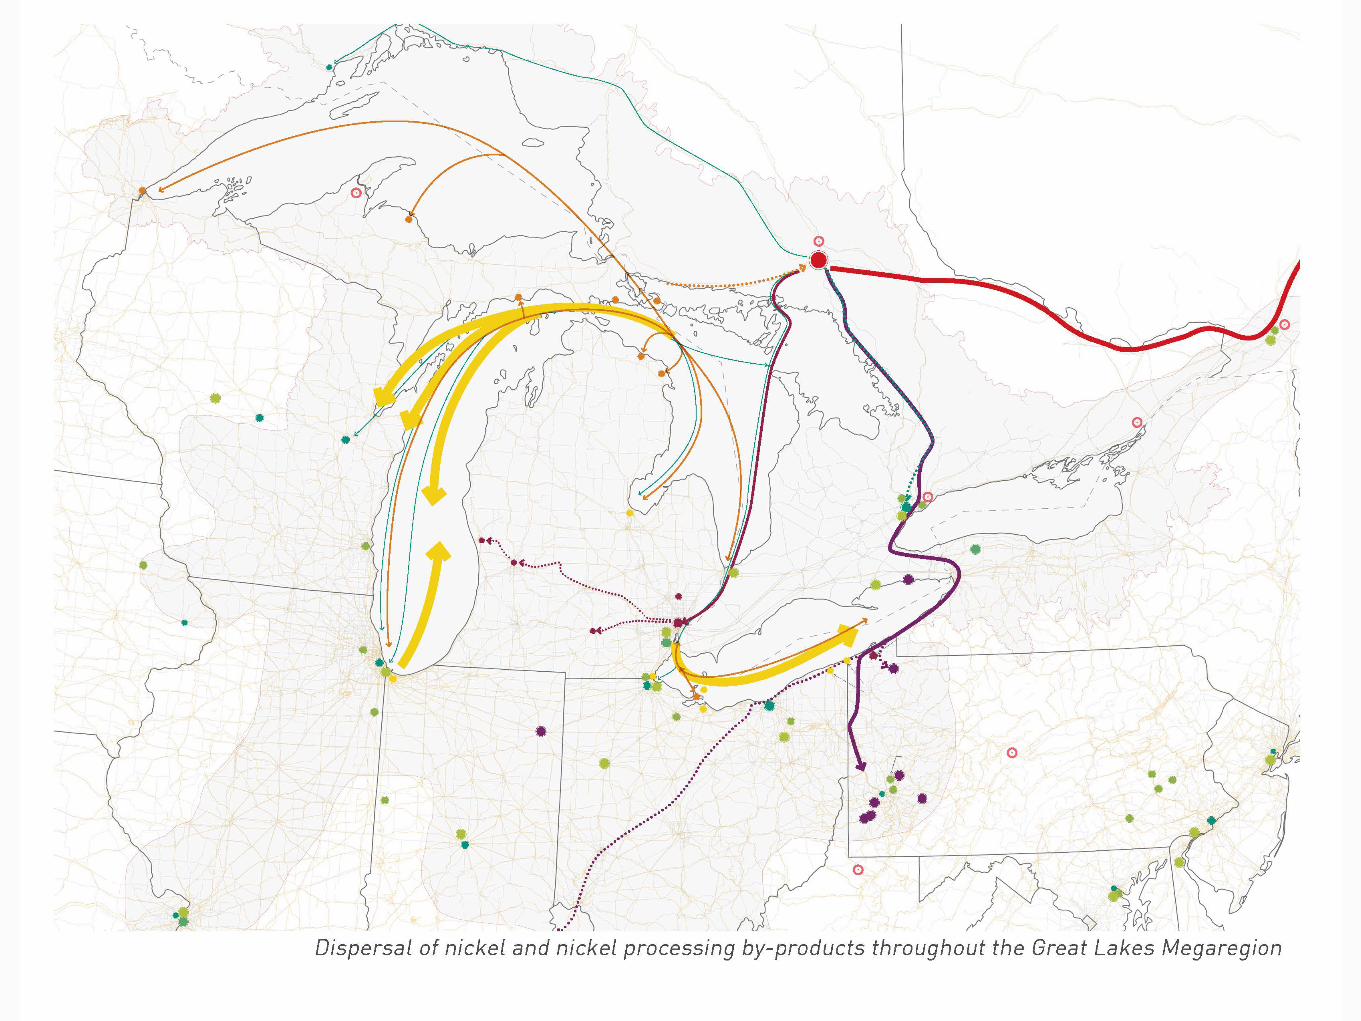
“Maps are graphic representations that facilitate a spatial understanding of things, concepts, conditions, processes, or events in the human world.” - JB Harley + David Woodward, History of Cartography (1987) Through this workshop, we’ll speculate on the agency of spatial data. Each student will choose a unique combination of site conditions, representational conventions, and scales to explore. Students will be given a crash course in the basics of Rhino and Grasshopper, then supplied with an Elk definition and several Open Street Maps data sets to manipulate. Together, we’ll curate, abstract, and re-interpret geospatial information as polemical 3d representations and novel inhabitable spaces.
Transcript of F2014 workshop 3 presentation

D I G I T A L D E P L O Y M E N T
W e l c o m e t o
B r o u g h t t o y o u b y


T H E C O L L E C T I O N


B r o u g h t t o y o u b y
U T K W O R K S H O P # 3( T H A N K Y O U , A G A I N ! )


0 3 _ A G E N C YD A T A / / a R G U M E N T

D E S I G N T H I N K I N G I S O U R
S U P E R - P O W E R .
R E P R E S E N T A T I O N
I S O U R C U R R E N C Y
W E S E L L B I G I D E A S .

S E T T I N G F O O T I N T H E
d i g i t a l w i l d e r n e s s .

T O D A Y W E A R E
W O R K I N G W I T H M A P P E D
D A T A .
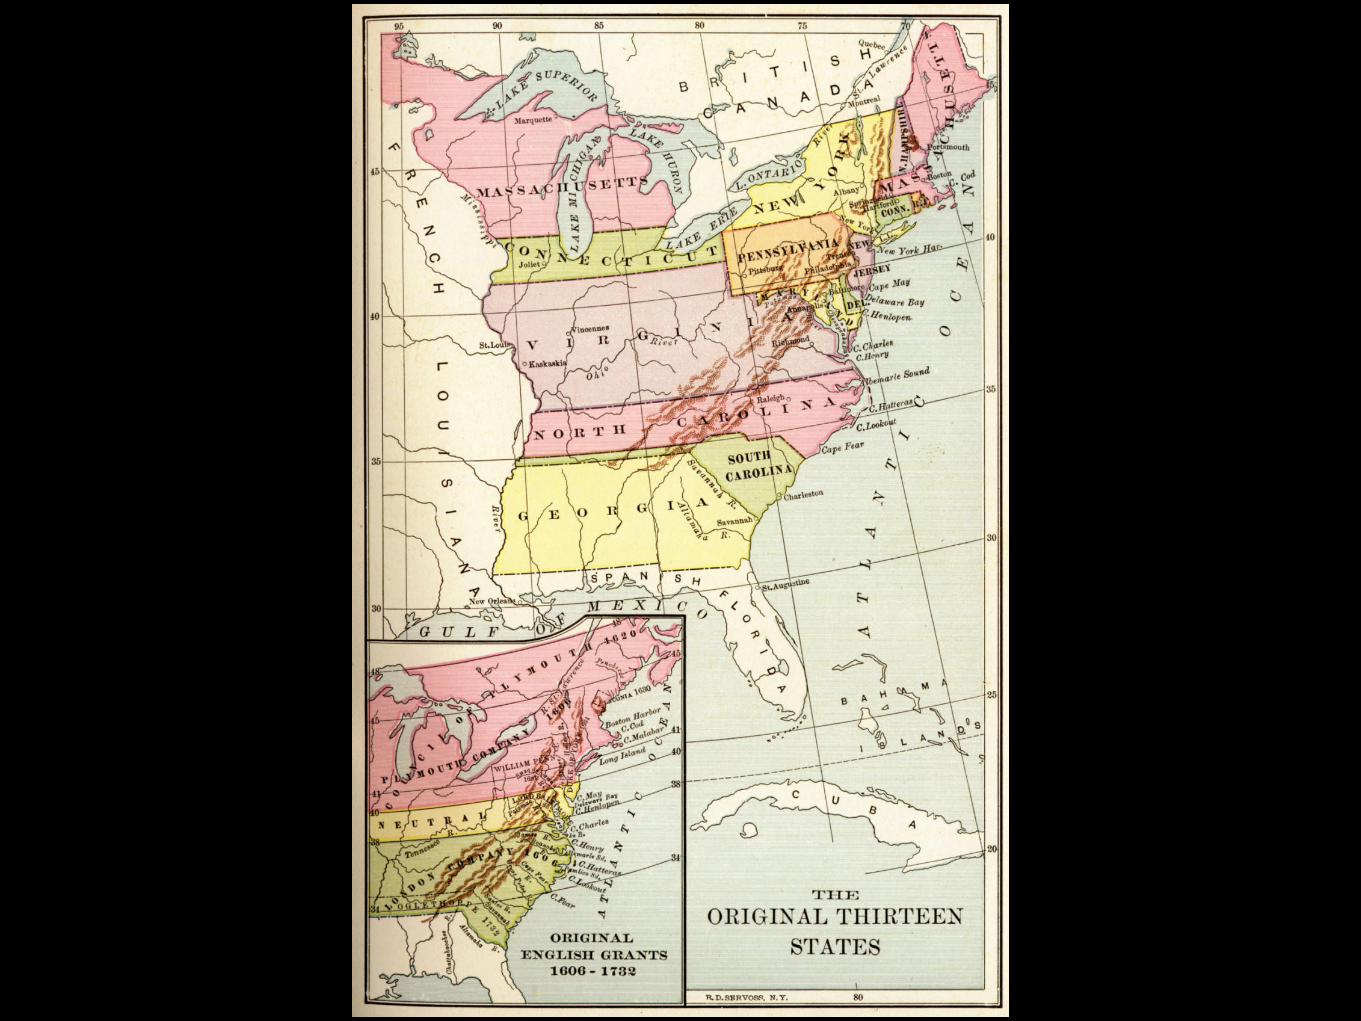
ETYMOLOGY
1520s, shortening of Middle English mapemounde “map of the world” (late 14c.), and in part from Middle French mappe, shortening of Old French mapemonde, both English and French words from Medieval Latin mappa mundi “map of the world;” first element from Latin mappa “napkin, cloth” (on which maps were drawn), “tablecloth, signal-cloth, flag,” said by Quintilian to be of Punic origin (cf. Talmudic Hebrew mappa, contraction of Mishnaic menaphah “a fluttering banner, streaming cloth”) + Latin mundi “of the world,” from mundus “universe, world” (see mundane). Commonly used 17c. in a figurative sense of “epitome; detailed representation.” To put (something) on the map “bring it to wide attention” is from 1913.
Source: Online Etymology Dictionary

DEFINITION
1. A picture or chart that shows the rivers, mountains, streets, etc., in a particular area2. A picture or chart that shows the different parts of something
- Merriam-Webster
1. A diagrammatic representation of an area of land or sea showing physical features, cities, roads, etc.:
a street map- OxfordDictionaries.com
“Maps are graphic representations that facilitate a spatial understanding of things, concepts, conditions, processes, or events in the human world.”
- JB Harley and David Woodward
History of Cartography, 1987
DEFINITION
“Maps are graphic representations that facilitate a spatial understanding of things, concepts, conditions, processes, or events in the human world.”
- JB Harley and David Woodward
History of Cartography, 1987
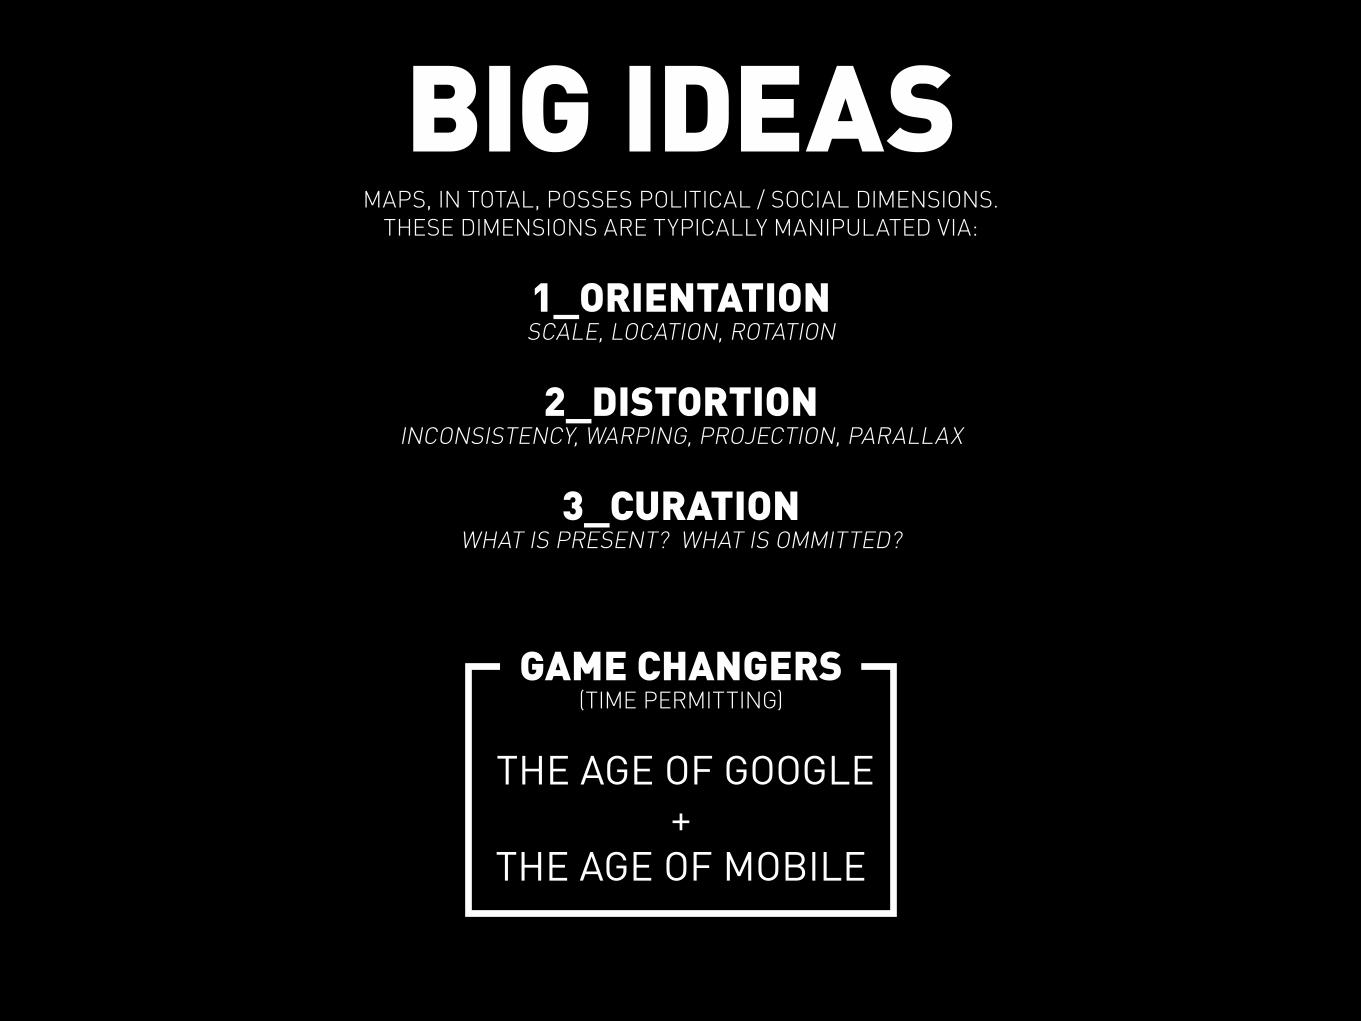
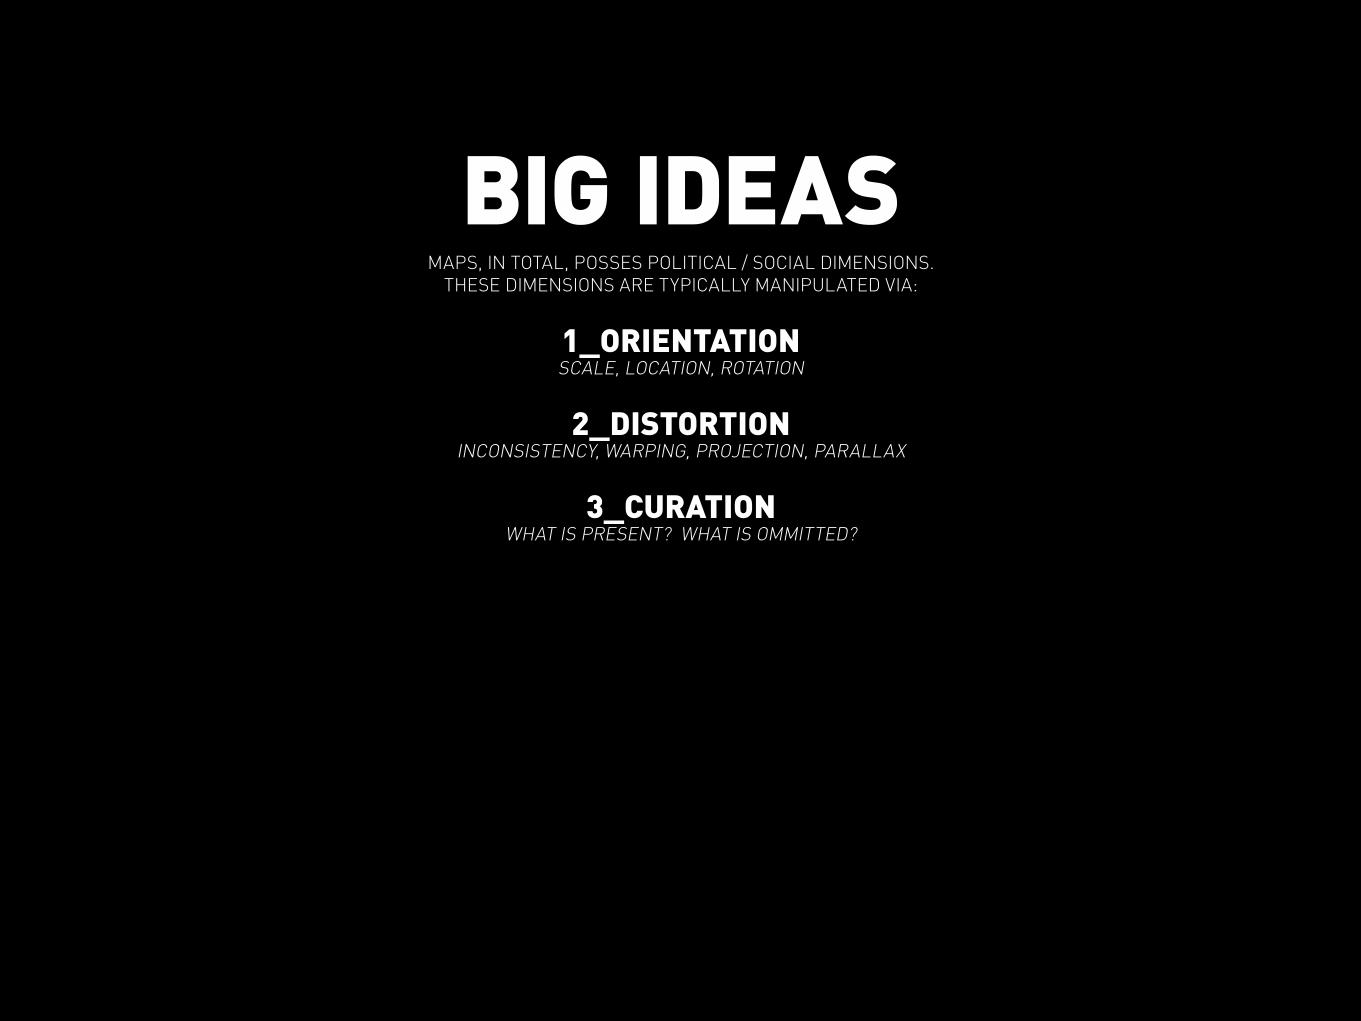
BIG IDEASMAPS, IN TOTAL, POSSES POLITICAL / SOCIAL DIMENSIONS.
THESE DIMENSIONS ARE TYPICALLY MANIPULATED VIA:
1_ORIENTATIONSCALE, LOCATION, ROTATION
2_DISTORTIONINCONSISTENCY, WARPING, PROJECTION, PARALLAX
3_CURATIONWHAT IS PRESENT? WHAT IS OMMITTED?
GAME CHANGERS(TIME PERMITTING)
THE AGE OF GOOGLE+
THE AGE OF MOBILE

1_ORIENTATIONSCALE, LOCATION, ROTATION


2_DISTORTIONINCONSISTENCY, WARPING, PROJECTION, PARALLAX

hectares per person
Rank Territory Value191 Nauru 0.154192 Barbados 0.143193 Bahrain 0.101194 Maldives 0.100195 Bangladesh 0.091196 Malta 0.080197 Holy See 0.044198 Singapore 0.016199 Hong Kong (China) 0.015200 Monaco 0.006
MOST AND LEAST LANDTechnical notes WORLD LAND DISTRIBUTION
© Copyright 2006 SASI Group (University of Sheffield) and Mark Newman (University of Michigan)
Rank Territory Value1 Greenland 8212 Western Sahara 973 Mongolia 604 Namibia 415 Australia 396 Suriname 397 Mauritania 378 Iceland 339 St Vincent & The Grenadines 3310 Botswana 31
Land Area
www.worldmapper.org
Produced by the SASI group (Sheffield) and Mark Newman (Michigan)
“Secure access to land remains essential for diverse land-based livelihoods and is a precondition for sustainableagriculture, economic growth and poverty reduction ”
The land area of each territory isshown here.
The total land area of these 200territories is 13056 million hectares.Divided up equally that would be 2.1hectares for each person. A hectareis 100 metres by 100 metres.
However, population is not evenlyspread: Australia’s land area is 21 timesbigger than Japan’s, but Japan’spopulation is more than six timesbigger than Australia’s.
• Principal data source: United Nations EnvironmentProgramme, 2005
• Land area excludes land covered by major rivers,lakes and the sea
• Population data used is from 2002.• See web site for further information
Each territory’s size on the map is drawn according toits land area.
Map 001
Central Africa3.7%
Southeastern Africa18.5%
Northern Africa10.7%
Southern Asia2.7%
Asia Pacific8.5%Middle East
18.0%
Eastern Asia7.4%
South America12.1%
Eastern Europe1.9%
North America13.8%
Western Europe2.4%
Japan0.2%
Oxfam, 2006
CARTOGRAM_LAND AREA
Credit: Mark NewmanSource: Worldmapper.org

Rank Territory Value11 Ukraine 2812 Bangladesh 2813 Poland 2514 Pakistan 2415 Spain 1916 Brazil 1817 Viet Nam 1618 Nigeria 1619 Turkey 1420 Mexico 14
TWENTY HIGHEST POPULATIONS IN 1900
Technical notes
© Copyright 2006 SASI Group (University of Sheffield) and Mark Newman (University of Michigan)
population in millions
Rank Territory Value1 China 4002 India 2343 United States 764 Germany 545 Russian Federation 506 Japan 447 Indonesia 438 France 419 United Kingdom 3710 Italy 34
Land area
Population 1900
www.worldmapper.org
Produced by the SASI group (Sheffield) and Mark Newman (Michigan)
“It has been stated that, as men progress, they shall be able to travel in airships and reach any part of the worldin a few hours.”
The world population tripled between1500 and 1900, to an estimated 1564million. In that period, the populationsof the United Kingdom and theUnited States increased more thanten-fold, the population of theNetherlands increased five-fold. Formost of this time the Netherlandswere known as the United Provinces,whilst neither the United Kingdom,nor the United States, had beenformed.
In 1900 much of the world was underimperial rule. New territorialboundaries were being defined andcontested. Today’s borders of Africa,shown in this map, were mostly drawnat the Treaty of Versaille in 1919.
• Data source: Angus Maddison, 2003• The contemporary political boundaries shown
differ from those in 1900.• See website for further information.
This map shows the distribution of the world’s populationin 1900.
Map 009
Mahatma Ghandi, 1909
WORLD POPULATION
0
200
400
600
800
1000
1200
1400
Regi
onal
pop
ulat
ion
(mill
ions
)
1100 1200 1300 1400 1500 1600 1700 1800 1900 2000Year
CARTOGRAM_POPULATION, 1900
Credit: Mark NewmanSource: Worldmapper.org

Rank Territory Value11 Pakistan 5012 Italy 5013 France 4614 Ukraine 4315 Nigeria 4016 Mexico 3817 Viet Nam 3218 Spain 3119 Poland 3020 Philippines 29
TWENTY HIGHEST POPULATIONS IN 1960
Technical notes
© Copyright 2006 SASI Group (University of Sheffield) and Mark Newman (University of Michigan)
population in millions
Rank Territory Value1 China 6672 India 4343 United States 1814 Russian Federation 1205 Indonesia 956 Japan 947 Germany 728 Brazil 729 Bangladesh 5510 United Kingdom 52
Land area
Population 1960
www.worldmapper.org
Produced by the SASI group (Sheffield) and Mark Newman (Michigan)
“May the day come soon, when the people of the world will rouse themselves, and together effectively stamp outany threat to peace in whatever quarter of the world it may be found.”
The world population in 1960 was3039 million. As is the case today, thepopulations of China and India are(independently) more than twice asbig as that of the next largest territory.
South America has increased itsproportion of the world’s populationliving there since 1900. The WesternEuropean proportion of the worldpopulation began to decline in 1900when it was 15%, to 11% in 1960 andthen 6% in 2000.
• Data source: Angus Maddison, 2003• The contemporary political boundaries shown
differ from those in 1960.• See website for further information.
This map shows the 1960 distribution of the world’spopulation.
Map 010
Albert Lutuli, 1961
WORLD POPULATION
0
200
400
600
800
1000
1200
1400
Regi
onal
pop
ulat
ion
(mill
ions
)
1100 1200 1300 1400 1500 1600 1700 1800 1900 2000Year
CARTOGRAM_POPULATION, 1960
Credit: Mark NewmanSource: Worldmapper.org
thousands
Rank Territory Value191 Saint Kitts & Nevis 42192 Monaco 34193 Liechtenstein 33194 San Marino 27195 Palau 20196 Cook Islands 18197 Nauru 13198 Tuvalu 10199 Niue 2200 Holy See 1
MOST AND FEWEST PEOPLE
Technical notes
© Copyright 2006 SASI Group (University of Sheffield) and Mark Newman (University of Michigan)
millions
Rank Territory Value1 China 12952 India 10503 United States 2914 Indonesia 2175 Brazil 1766 Pakistan 1507 Russian Federation 1448 Bangladesh 1449 Japan 12810 Nigeria 121
Land area
Total Population
www.worldmapper.org
Produced by the SASI group (Sheffield) and Mark Newman (Michigan)
“Out of every 100 persons added to the population in the coming decade, 97 will live in developing countries.”
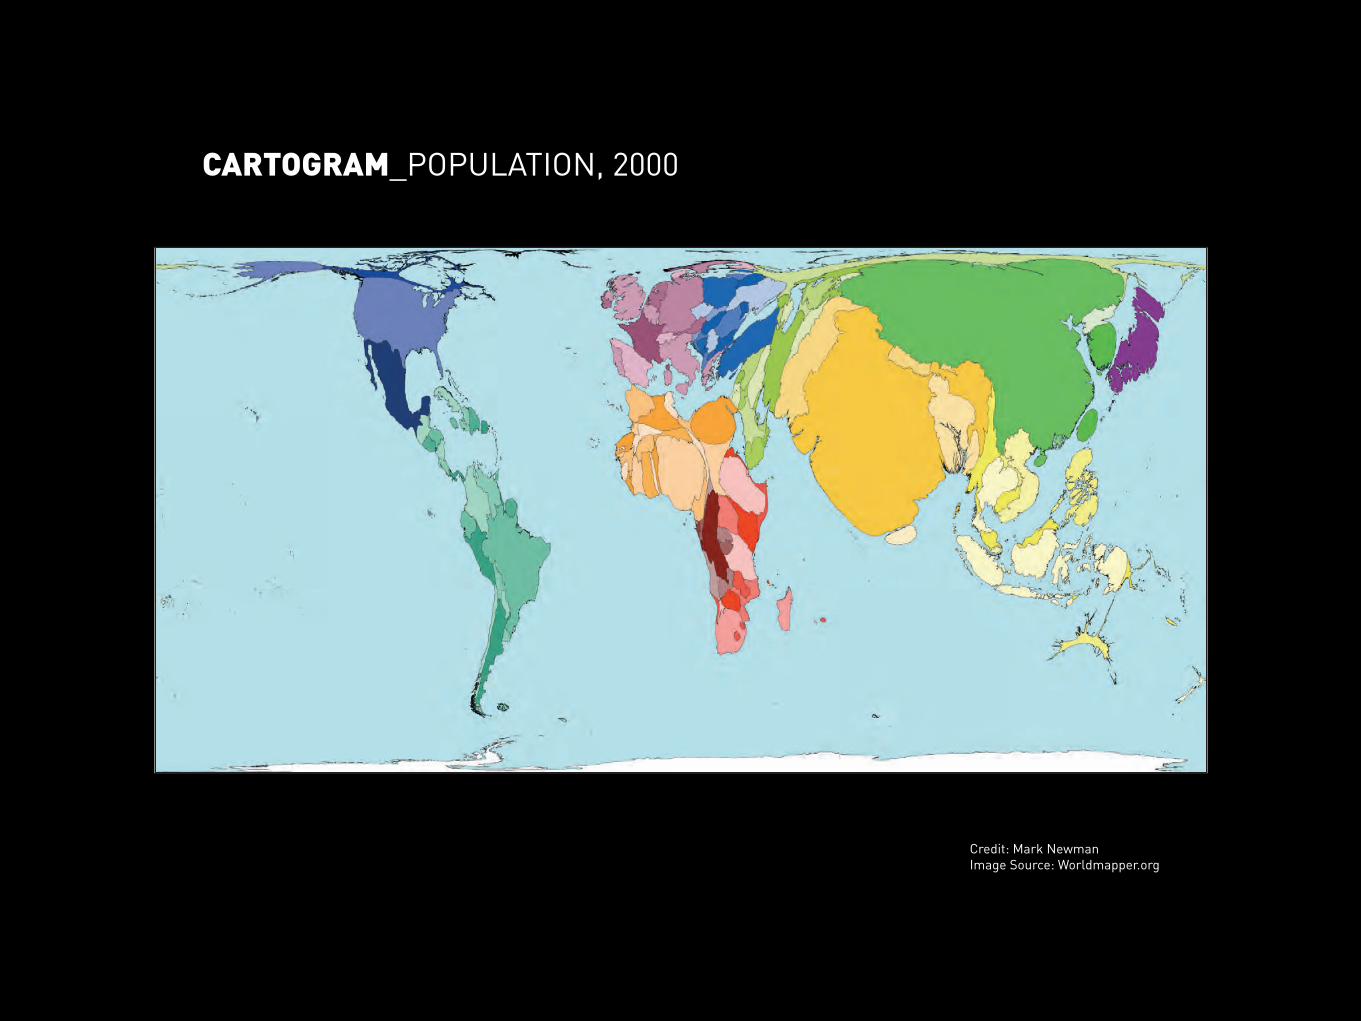
In Spring 2000 world populationestimates reached 6 billion; that is 6thousand million. The distribution ofthe earth’s population is shown in thismap.
India, China and Japan appear largeon the map because they have largepopulations. Panama, Namibia andGuinea-Bissau have small populationsso are barely visible on the map.
Population is very weakly related toland area. However, Sudan, which isgeographically the largest country inAfrica, has a smaller population thanNigeria, Egypt, Ethiopia, DemocraticRepublic of Congo, South Africa orTanzania.
• Data source: United Nations DevelopmentProgramme, 2004, Human Development Report.
• Population data is from 2002• The population not included is estimated as 2 to
3 million (see Appendix map 2).• See website for further information.
The size of each territory shows the relative propotionof the world’s population living there.
Map 002
Hania Zlotnik, 2005
WORLD POPULATION BY REGION
0
200
400
600
800
1000
1200
1400
Regi
onal
pop
ulat
ion
(mill
ions
)
1100 1200 1300 1400 1500 1600 1700 1800 1900 2000Year
CARTOGRAM_POPULATION, 2000
Credit: Mark NewmanImage Source: Worldmapper.org

population in millions
Rank Territory Value11 Mexico 13912 Philippines 12713 Uganda 12714 Egypt 12615 Viet Nam 11716 Japan 11217 Russian Federation 11218 Islamic Republic of Iran 10219 Turkey 10120 Afghanistan 97
TWENTY HIGHEST PREDICTED POPULATIONS IN 2050
Technical notes
© Copyright 2006 SASI Group (University of Sheffield) and Mark Newman (University of Michigan)
Rank Territory Value1 India 15932 China 13723 United States 3954 Pakistan 3055 Indonesia 2856 Nigeria 2587 Brazil 2538 Bangladesh 2439 Democratic Republic of Congo 17710 Ethiopia 170
Land area
0
500
1,000
1,500
2,000
2,500
Japa
nWes
tern
Eur
ope
Nor
th A
mer
ica
East
ern
Euro
pe
Sout
h Am
eric
a
East
ern
Asia
Mid
dle
East
Asia
Pac
ific
Sout
hern
Asi
a
Nor
ther
n Af
rica
Sout
heas
tern
Afri
ca
Cent
ral A
frica
Population 2050
www.worldmapper.org
Produced by the SASI group (Sheffield) and Mark Newman (Michigan)
“The choices that today's generation of young people aged 15-24 years make about the size and spacing of their families willdetermine whether Planet Earth will have 8, 9 or 11 billion people in the year 2050.”
By 2050 it is estimated that the earth’shuman population will be 9.07 billion.62% of the people will live in Africa,Southern Asia and Eastern Asia –numerically this is the same as if allthe world’s current population livedjust in these regions. In additionanother 3000000000 will be spreadacross the rest of the world.
All numbers shown here are estimates– estimates are rarely perfect.
• Data source: United Nations, 2004, WorldPopulation Projections
• The predicted population mapped here is basedon a medium population variant.
• See website for further information.
This map shows the predicted distribution for theestimated world population in 2050.
Map 011
United Nations Population Fund, 1999
POPULATION DISTRIBUTION YEAR 2050
popu
latio
n in
mill
ions
CARTOGRAM_POPULATION, 2050
Credit: Mark NewmanImage Source: Worldmapper.org

Rank Territory Value11 Uganda 15512 Yemen 13013 Mexico 12714 Philippines 12515 Egypt 12516 Viet Nam 11417 Islamic Republic of Iran 10118 Japan 10119 Niger 9420 Russian Federation 92
TWENTY HIGEST PREDICTED POPULATIONS IN 2300
Technical notes
© Copyright 2006 SASI Group (University of Sheffield) and Mark Newman (University of Michigan)
population in millions
Rank Territory Value1 India 13722 China 12853 United States 4934 Pakistan 3595 Nigeria 2836 Indonesia 2767 Bangladesh 2438 Brazil 2239 Ethiopia 20710 Democratic Republic of Congo 183
Land area
0
500
1000
1500
2000
2500
Japa
nWes
tern
Eur
ope
Nor
th A
mer
ica
East
ern
Euro
pe
Sout
h Am
eric
aEast
ern
Asia
Mid
dle
East
Asia
Pac
ific
Sout
hern
Asi
a
Nor
ther
n Af
rica
Sout
heas
tern
Afri
ca
Cent
ral A
frica
Population 2300
www.worldmapper.org
Produced by the SASI group (Sheffield) and Mark Newman (Michigan)
“... if fertility levels remain unchanged at today's levels, world population would rise to 244 billion persons in 2150 and 134trillion in 2300, clearly indicating that current levels of high fertility cannot continue indefinitely.”
The United Nations forecasts that by2300 the global population will bejust under 9 billion. World populationis expected to rise, peak and thendecline slightly between 2050 and2300. The highest long termpopulation growth is predicted forAfrica. Africa is currentlyunderpopulated and has the lowestlife expectancies. Other regions’populations are predicted to stay levelor decline. Between 2050 and 2300the areas currently known as India,China, the United States and Pakistanmaintain their ranked order as havingthe world’s highest populations.
The numbers shown here areestimates – based on predicted futurebehaviours.
• Data source: United Nations, 2004,WorldPopulation Projections
• The contemporary political boundaries shownmay differ from those in 2300.
• See website for further information.
This map shows the predicted distribution for theestimated world population in 2300.
Map 012
Population Coalition, 2005
POPULATION DISTRIBUTION YEAR 2300
popu
latio
n in
mill
ions
CARTOGRAM_POPULATION, 2300
Credit: Mark NewmanImage Source: Worldmapper.org
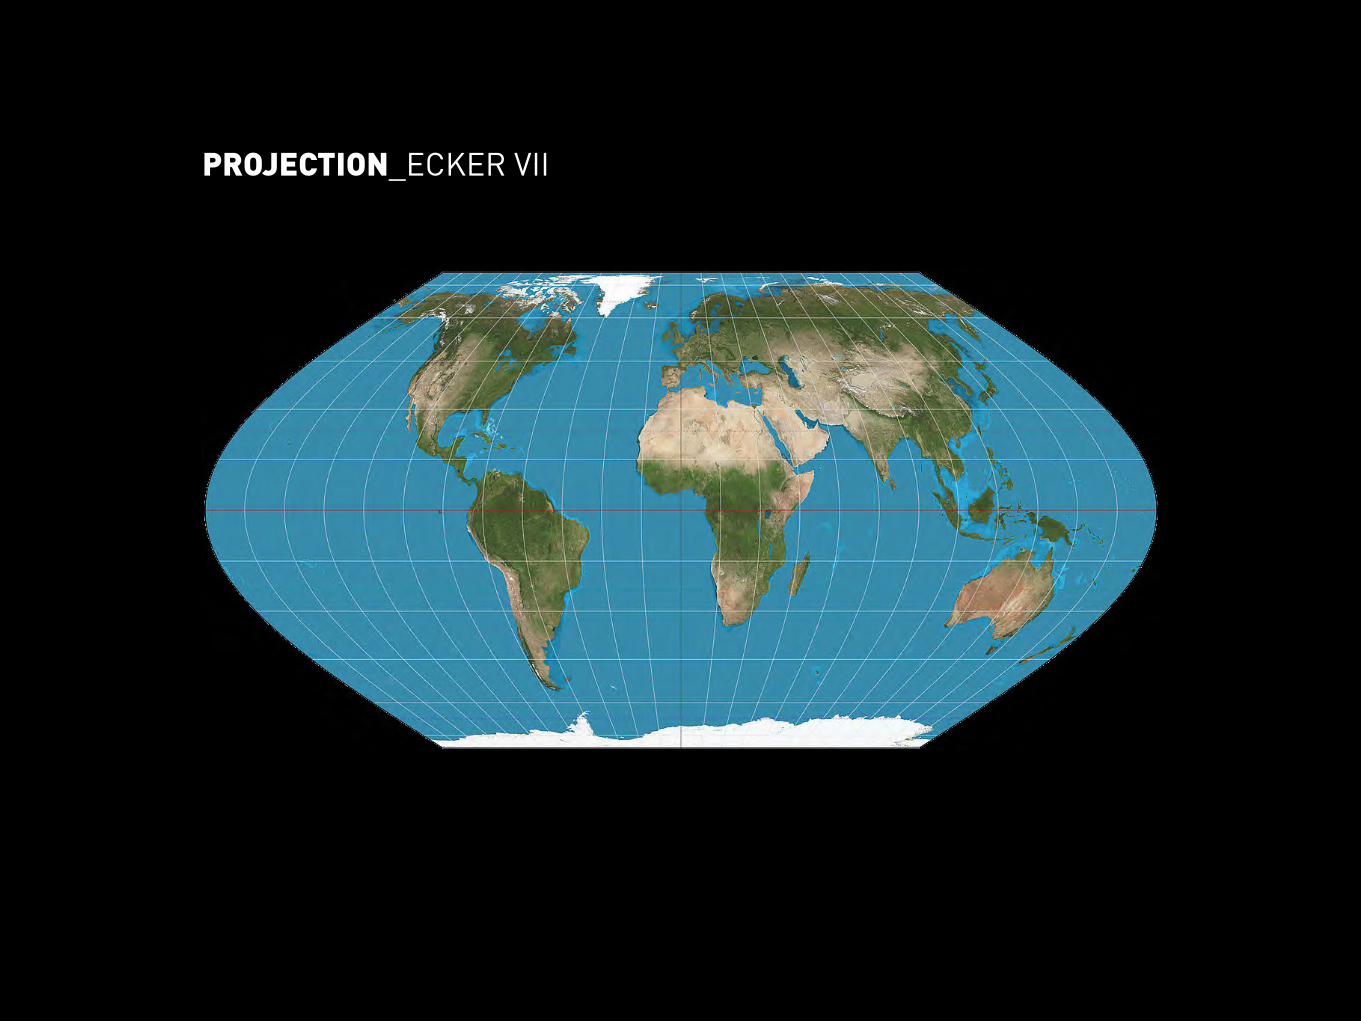
PROJECTION_ECKER VII

PROJECTION_GOODE HOMOLOSINE

PROJECTION_MOLLWEIDE

PROJECTION_DYMAXION MAP

PROJECTION_DYMAXION MAP

3_CURATIONWHAT IS PRESENT? WHAT IS OMMITTED?

MAPPA MUNDI
Psalter Map, 1265Image Source: petrus.agricola (flickr.om)

MAPPA MUNDI
Hereford Mappa Mundi, 1285Image Source: ithaca.edu

Lassen Volcanic National Park, 2010Image Source: usgs.gov
BIG IDEASMAPS, IN TOTAL, POSSES POLITICAL / SOCIAL DIMENSIONS.
THESE DIMENSIONS ARE TYPICALLY MANIPULATED VIA:
1_ORIENTATIONSCALE, LOCATION, ROTATION
2_DISTORTIONINCONSISTENCY, WARPING, PROJECTION, PARALLAX
3_CURATIONWHAT IS PRESENT? WHAT IS OMMITTED?

AGENCYO N E ’ s c a p a c i t y t o d o m e a n i n g f u l
w o r k , p r o v i d e a s e r v i c e , O R E N A C T
A N A G E N D A .

AGENCYO N E ’ s c a p a c i t y t o d o m e a n i n g f u l
w o r k , p r o v i d e a s e r v i c e , O R E N A C T
A N A G E N D A .
W h a t ’ s y o u r a r g u e m e n t ? I n t e n t ?
F o r y o u r s e l f ; f o r o t h e r s ?
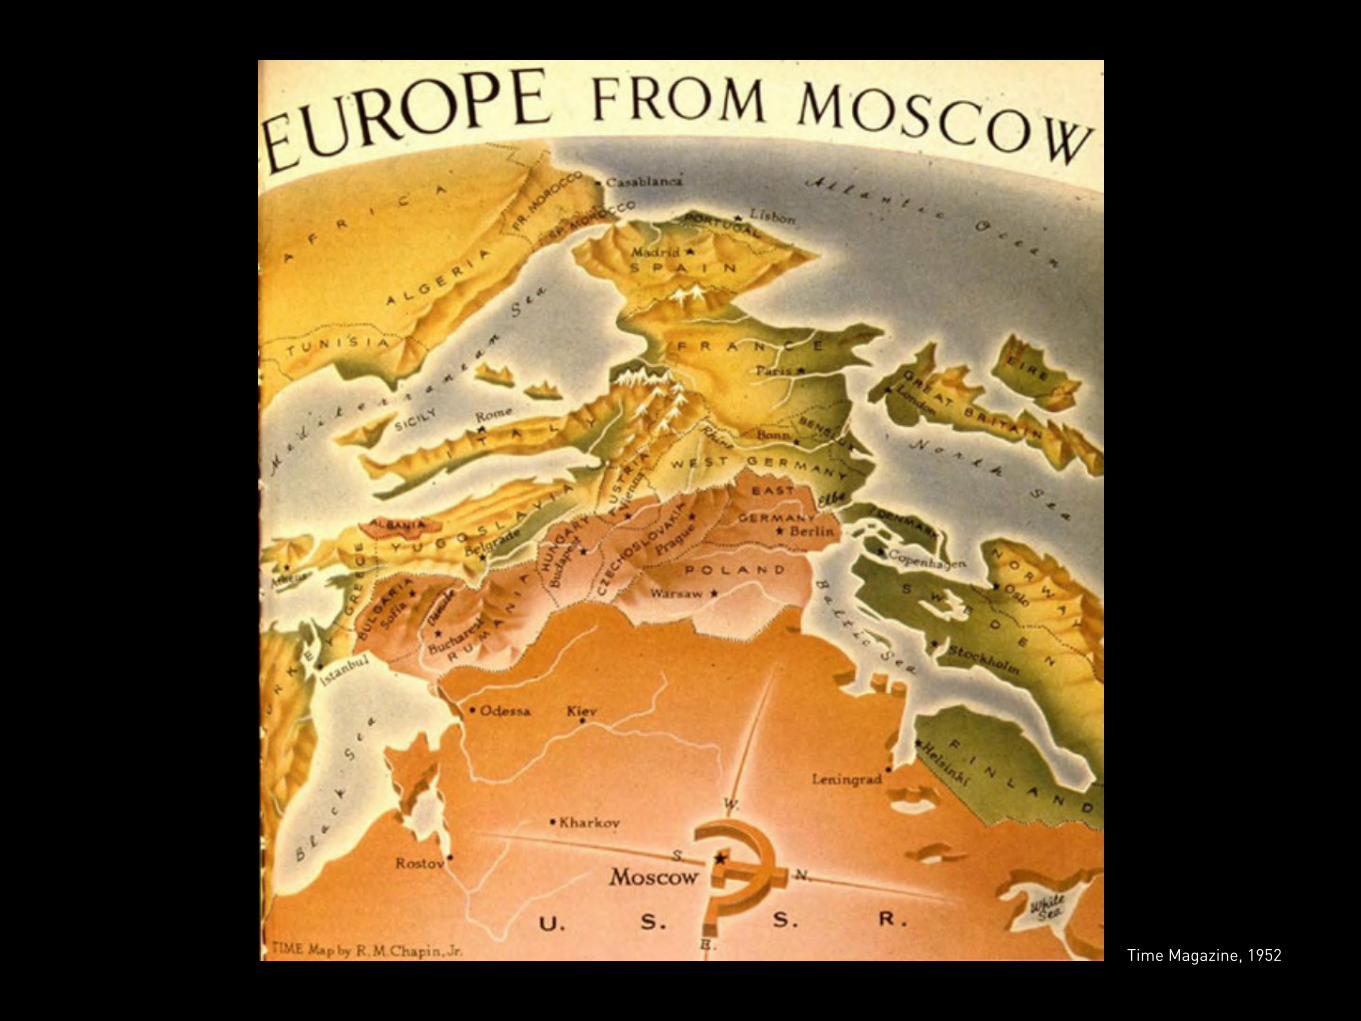
Time Magazine, 1952

NO
RTH
15°
30°
45°
60°
75°
EA
ST 105°
120°
135°
150°
165°
SO
UTH
195°
210°
225°
240°
255°
WEST285°
300°
315°
330°
345°
10 k
m/h
20 k
m/h
30 k
m/h
40 k
m/h
50 k
m/h
hrs
294+
264
235
205
176
147
117
88
58
<29
Prevailing WindsWind Frequency (Hrs)
Location: Detroit Metropolitan Arpt, USA (42.2°, -83.3°)Date: 1st January - 31st December
Time: 00:00 - 24:00© Weather Manager
*Apple
*Coca-Cola
*Ford
*Glad
*i3Detroit
*Mi Bike Collective
*this space for rent
*Jim’s M
etal Scr
ap
*Ford
*GM
*Soil Farm
*Ford
*DTW
*Detroit
*Comingled*$$$
*$$
*$
*Ferrous
*Bulky
40 years
30 years
20 years
10 years


T H I S I S . . . I R R E V E R E N T I R O N C H E F

3 FILTERS1 . S I T E C O N D I T I O N
2 . R E P R E S E N T A T I O N A L C O N V E N T I O N
3 . S C A L E

SITE CONDITIONSE D G E S , H U B S , M E C C A S

C H O O S E Y O U R G R A P H I C C U S T O M
REPRESENTATIONAL
CONVENTIONS

SCALED E T E R M I N E Y O U R E X T E N T S


Rip Curl Canyon (2006)Ball-Nogues Studio

Rip Curl Canyon (2006)Ball-Nogues Studio

Rip Curl Canyon (2006)Ball-Nogues Studio

0 3 _ A G E N C Y
1 _ P i c k THRE E ‘ F I LT ERS ’ F ROM A HAT
2 _ SK ETCH CONC EPTS AND WR IT E ASSUMPT I ONS
3 _ RH I NO + GRASSHOPP ER + E L K I NTRO
4 _ DEV E LOP NOV E L MAPP I NGS w/ ARGUEMENT
5 _ SPAT IA L I ZE YOUR WORK ( I N HAB I TABL E E X H I B I T I ON/DATA R I C H )
6 _ WRAP UP WORK , d i g i ta l ly S UBM IT
7 _ D I S C USS I ON AND CR I T I Q UE W ITH A S P EC I A L GUEST !
D A T A / / A R G U M E N T
sun
sat