F O U R T H E D I T I O N Quality Control Tools for Improving Processes © The McGraw-Hill...
55
F O U R T H E D I T I O N Quality Control Tools for Improving Processes © The McGraw-Hill Companies, Inc., 2003 supplement 6 DAVIS AQUILANO CHASE PowerPoint Presentation by Charlie Cook
-
date post
19-Dec-2015 -
Category
Documents
-
view
227 -
download
5
Transcript of F O U R T H E D I T I O N Quality Control Tools for Improving Processes © The McGraw-Hill...
F O U R T H E D I T I O N
Quality Control Tools for Improving Processes
© The McGraw-Hill Companies, Inc., 2003
supplement 6
DAVIS
AQUILANO
CHASE
PowerPointPresentation
byCharlieCook

Fundamentals of Operations Management 4e © The McGraw-Hill Companies, Inc., 2003 S6–2
Supplement ObjectivesSupplement ObjectivesSupplement ObjectivesSupplement Objectives
• Introduce the different quality control tools that are used in analyzing and improving the quality of processes.
• Describe in detail the two major approaches (that is, acceptance sampling and statistical process control) in which statistical analysis can be used to improve process quality.
• Define the two different types of errors that can occur when statistical sampling is used.
• Distinguish between attributes and variables with respect to the statistical analysis of processes.

Fundamentals of Operations Management 4e © The McGraw-Hill Companies, Inc., 2003 S6–3
Supplement Objectives (cont’d)Supplement Objectives (cont’d)Supplement Objectives (cont’d)Supplement Objectives (cont’d)
• Discuss Taguchi methods and how they are different from traditional statistical quality control methods.
• Describe the quantitative methodology behind six sigma.
Fundamentals of Operations Management 4e © The McGraw-Hill Companies, Inc., 2003 S6–4
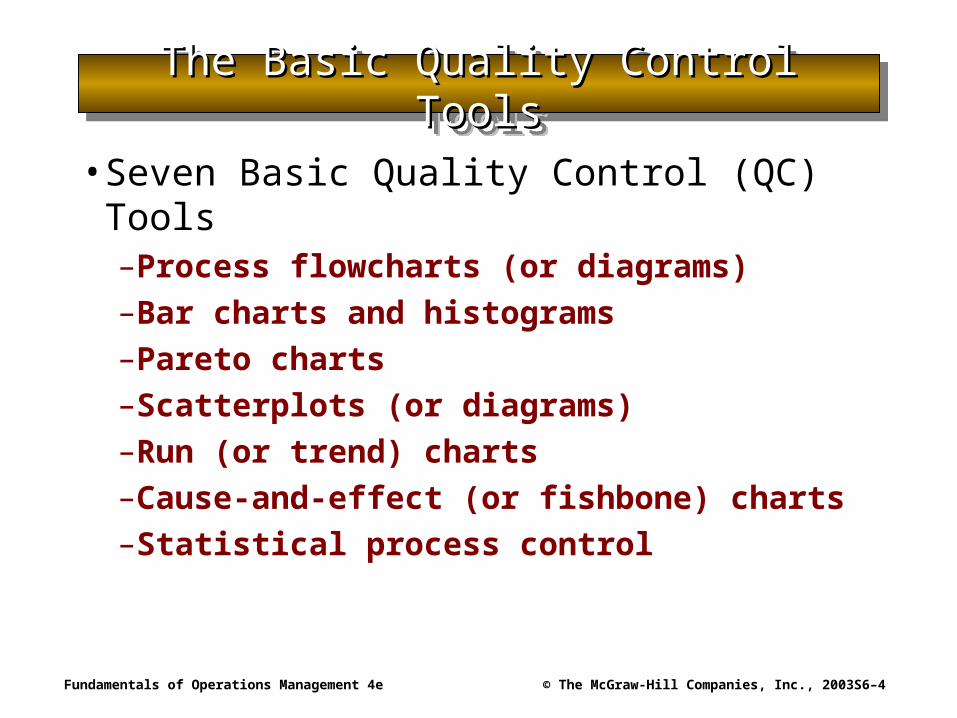
The Basic Quality Control ToolsThe Basic Quality Control ToolsThe Basic Quality Control ToolsThe Basic Quality Control Tools
• Seven Basic Quality Control (QC) Tools–Process flowcharts (or diagrams)–Bar charts and histograms–Pareto charts–Scatterplots (or diagrams)–Run (or trend) charts–Cause-and-effect (or fishbone) charts–Statistical process control
Fundamentals of Operations Management 4e © The McGraw-Hill Companies, Inc., 2003 S6–5
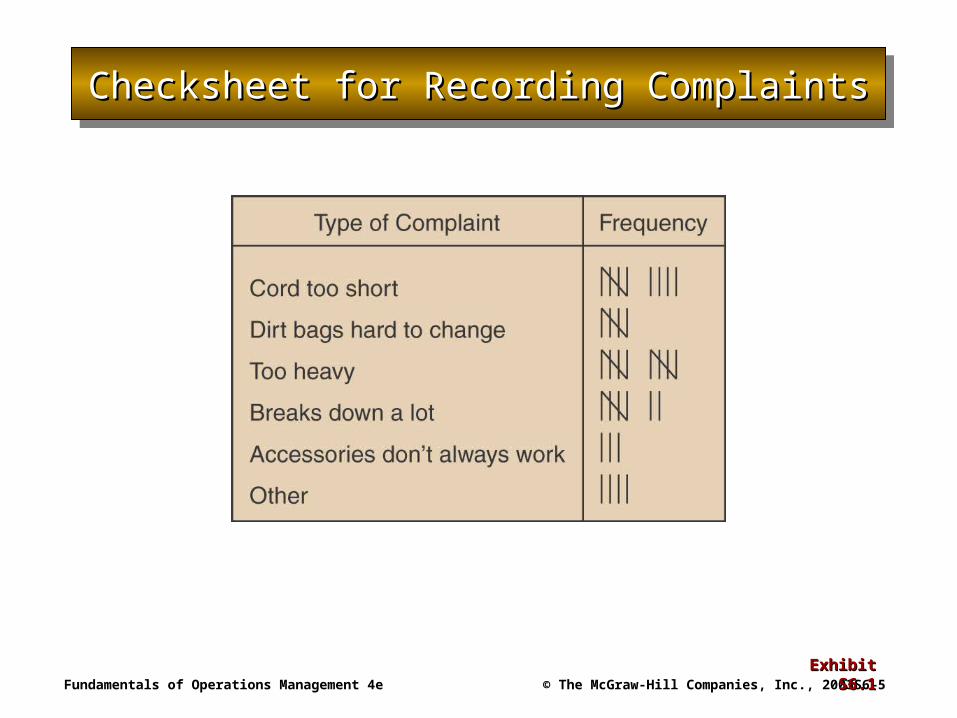
Checksheet for Recording ComplaintsChecksheet for Recording ComplaintsChecksheet for Recording ComplaintsChecksheet for Recording Complaints
Exhibit S6.1Exhibit S6.1
Fundamentals of Operations Management 4e © The McGraw-Hill Companies, Inc., 2003 S6–6
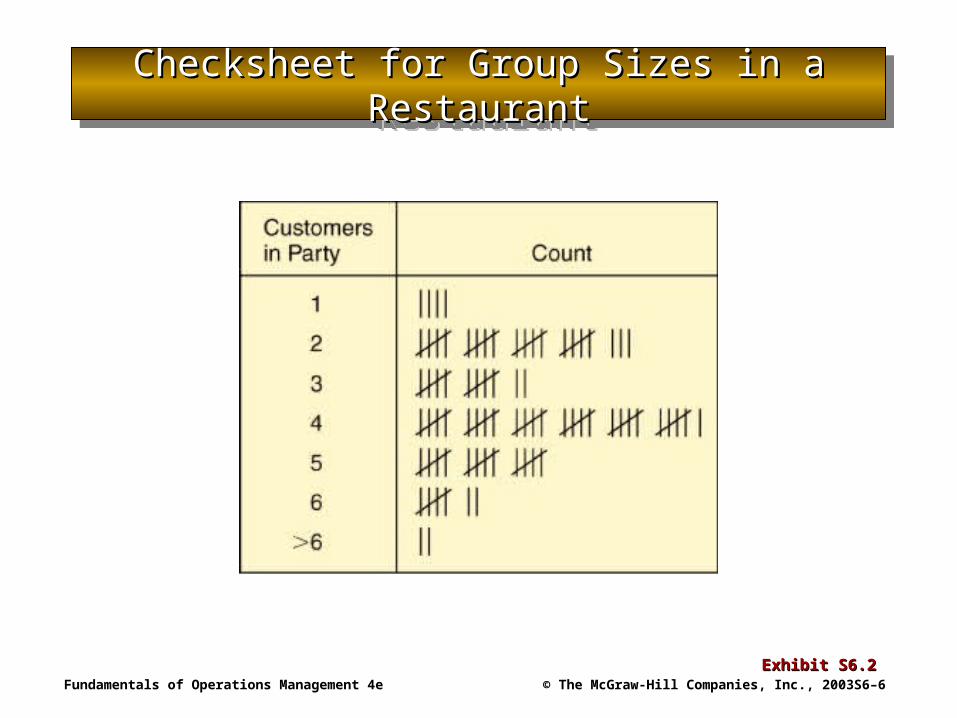
Checksheet for Group Sizes in a Checksheet for Group Sizes in a RestaurantRestaurant
Checksheet for Group Sizes in a Checksheet for Group Sizes in a RestaurantRestaurant
Exhibit S6.2Exhibit S6.2
Fundamentals of Operations Management 4e © The McGraw-Hill Companies, Inc., 2003 S6–7
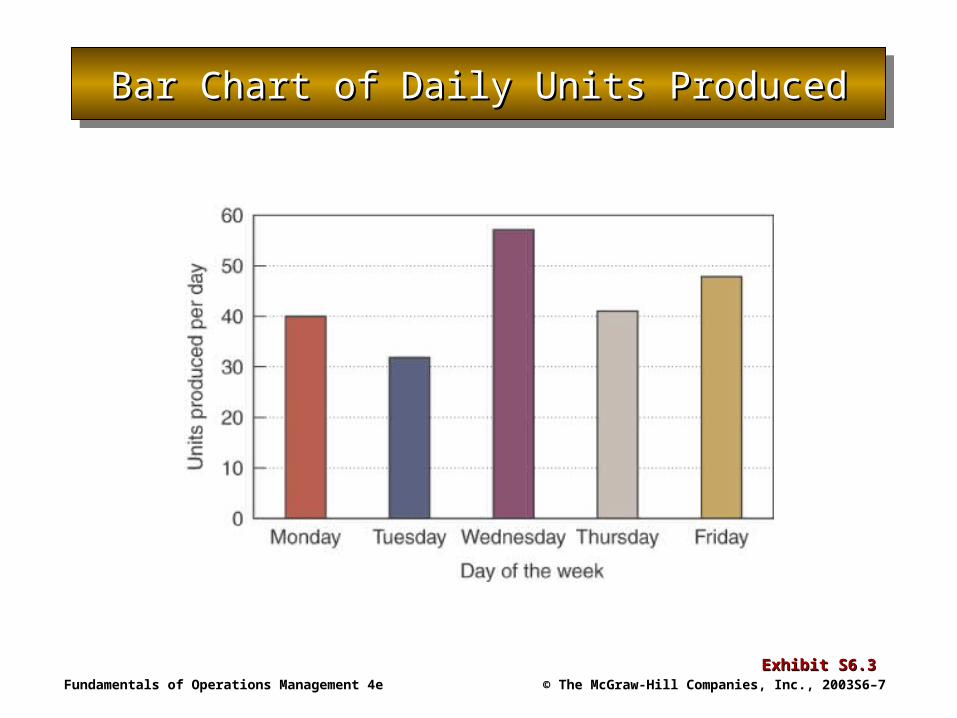
Bar Chart of Daily Units ProducedBar Chart of Daily Units ProducedBar Chart of Daily Units ProducedBar Chart of Daily Units Produced
Exhibit S6.3Exhibit S6.3
Fundamentals of Operations Management 4e © The McGraw-Hill Companies, Inc., 2003 S6–8
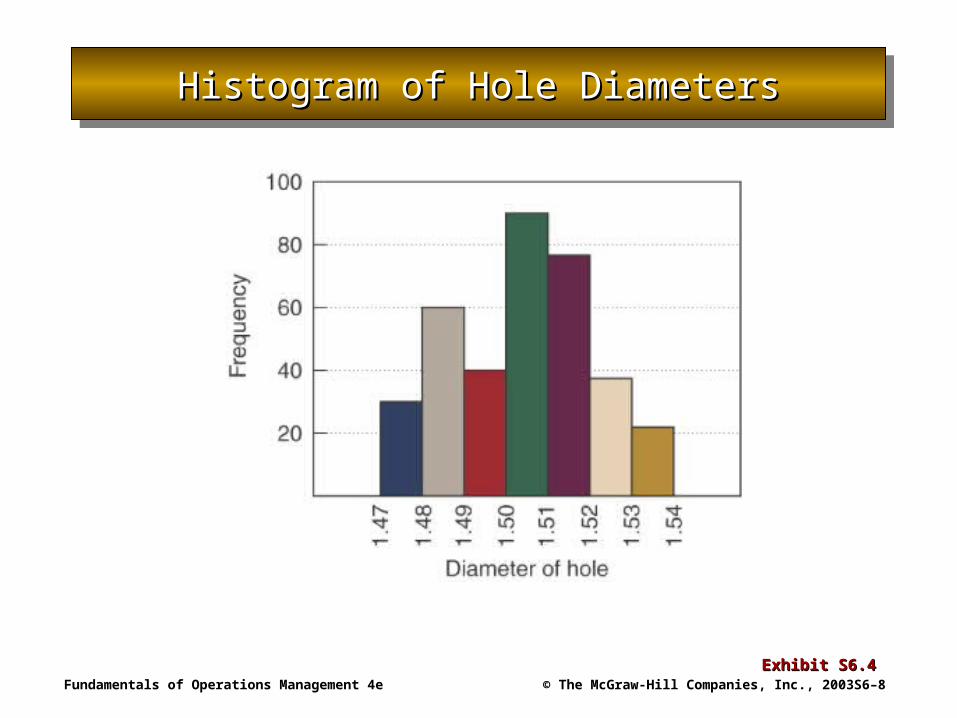
Histogram of Hole DiametersHistogram of Hole DiametersHistogram of Hole DiametersHistogram of Hole Diameters
Exhibit S6.4Exhibit S6.4
Fundamentals of Operations Management 4e © The McGraw-Hill Companies, Inc., 2003 S6–9
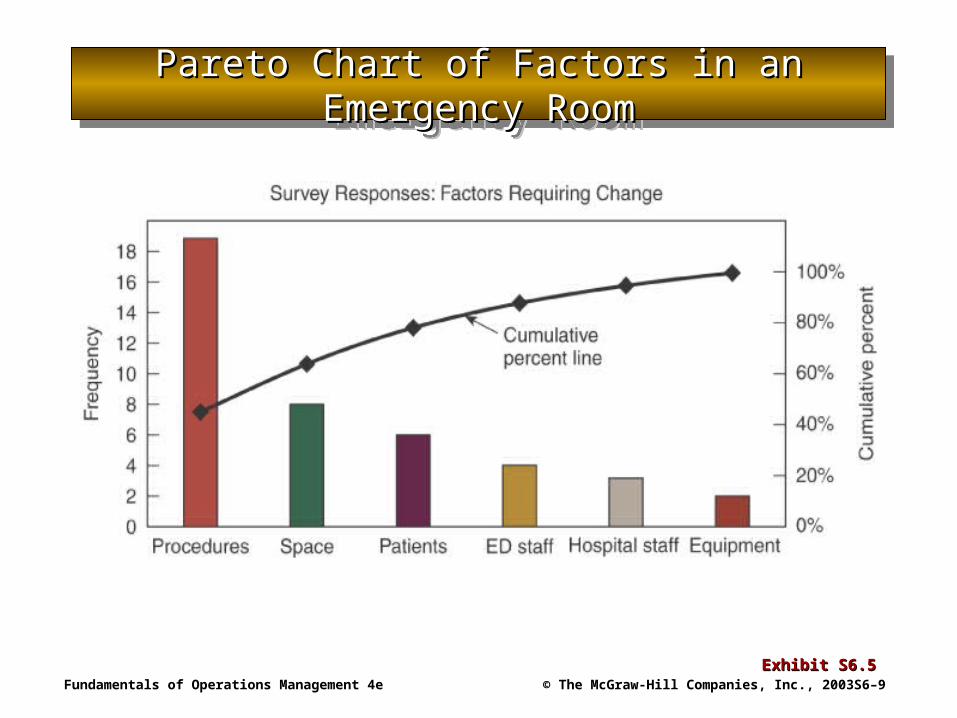
Pareto Chart of Factors in an Emergency Pareto Chart of Factors in an Emergency RoomRoom
Pareto Chart of Factors in an Emergency Pareto Chart of Factors in an Emergency RoomRoom
Exhibit S6.5Exhibit S6.5

Fundamentals of Operations Management 4e © The McGraw-Hill Companies, Inc., 2003 S6–10
Scatterplot of Customer Satisfaction and Scatterplot of Customer Satisfaction and Waiting Time in an Upscale RestaurantWaiting Time in an Upscale Restaurant
Scatterplot of Customer Satisfaction and Scatterplot of Customer Satisfaction and Waiting Time in an Upscale RestaurantWaiting Time in an Upscale Restaurant
Exhibit S6.6Exhibit S6.6
Fundamentals of Operations Management 4e © The McGraw-Hill Companies, Inc., 2003 S6–11
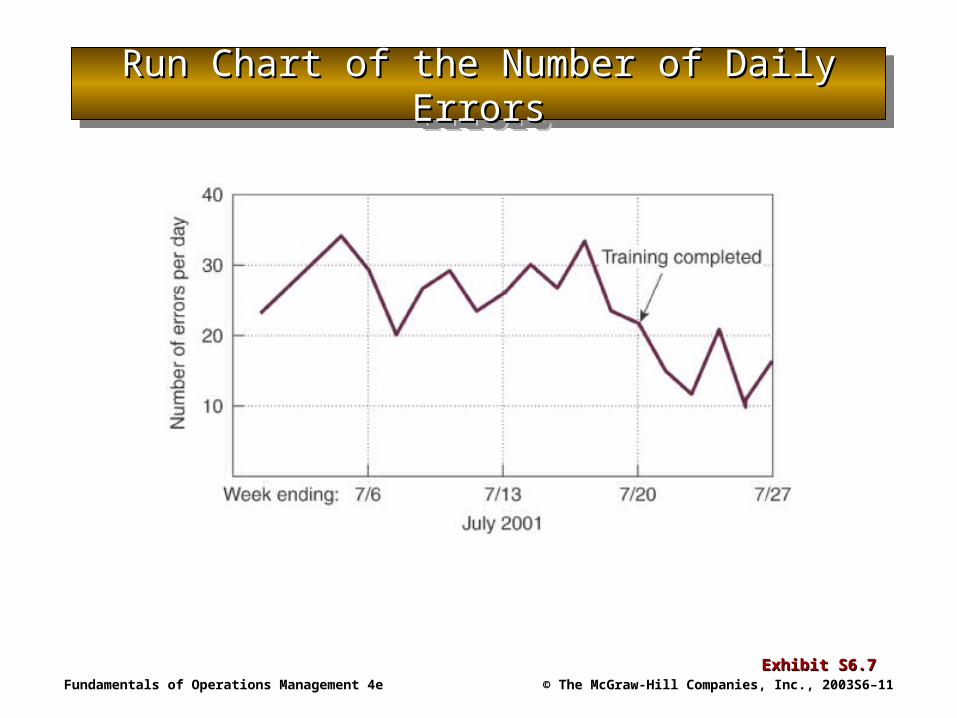
Run Chart of the Number of Daily ErrorsRun Chart of the Number of Daily ErrorsRun Chart of the Number of Daily ErrorsRun Chart of the Number of Daily Errors
Exhibit S6.7Exhibit S6.7

Fundamentals of Operations Management 4e © The McGraw-Hill Companies, Inc., 2003 S6–12
Cause-and-Effect Diagram for Cause-and-Effect Diagram for Customer Complaints in a RestaurantCustomer Complaints in a Restaurant
Cause-and-Effect Diagram for Cause-and-Effect Diagram for Customer Complaints in a RestaurantCustomer Complaints in a Restaurant
Exhibit S6.8Exhibit S6.8

Fundamentals of Operations Management 4e © The McGraw-Hill Companies, Inc., 2003 S6–13
Statistical Analysis of ProcessesStatistical Analysis of ProcessesStatistical Analysis of ProcessesStatistical Analysis of Processes
• Statistical Analysis–Requires less labor (reduces costs)–Useful when testing destroys products
• Categories of Statistical Tools–Acceptance sampling
• Assesses the quality of parts or products after they have been produced.
–Statistical process control• Assesses whether or not an ongoing process is
performing within established limits.

Fundamentals of Operations Management 4e © The McGraw-Hill Companies, Inc., 2003 S6–14
Attributes and VariablesAttributes and VariablesAttributes and VariablesAttributes and Variables
• Types of Data–Attribute data
• Data that count items, such as the number of defective items in a sample.
–Variable data• Data that measure of a particular product characteristic
such as length or width.

Fundamentals of Operations Management 4e © The McGraw-Hill Companies, Inc., 2003 S6–15
Statistical Quality Control MethodsStatistical Quality Control MethodsStatistical Quality Control MethodsStatistical Quality Control Methods
Exhibit S6.9Exhibit S6.9
Fundamentals of Operations Management 4e © The McGraw-Hill Companies, Inc., 2003 S6–16
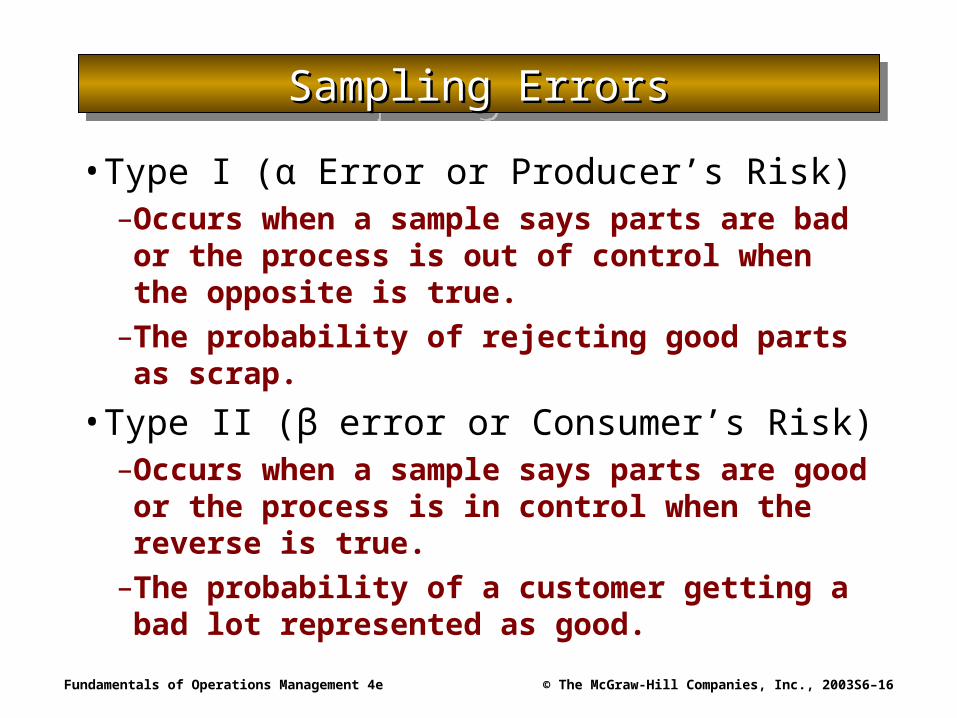
Sampling ErrorsSampling ErrorsSampling ErrorsSampling Errors
• Type I (α Error or Producer’s Risk)–Occurs when a sample says parts are bad or the
process is out of control when the opposite is true.
–The probability of rejecting good parts as scrap.
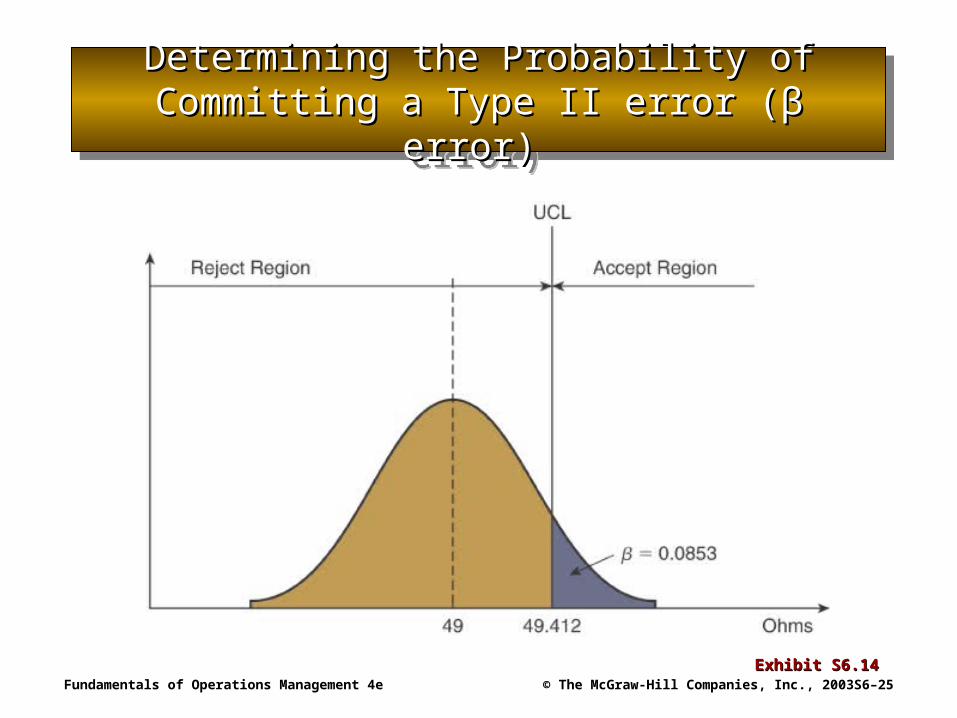
• Type II (β error or Consumer’s Risk)–Occurs when a sample says parts are good or
the process is in control when the reverse is true.
–The probability of a customer getting a bad lot represented as good.

Fundamentals of Operations Management 4e © The McGraw-Hill Companies, Inc., 2003 S6–17
Types of Sampling ErrorsTypes of Sampling ErrorsTypes of Sampling ErrorsTypes of Sampling Errors
Exhibit S6.10Exhibit S6.10
Fundamentals of Operations Management 4e © The McGraw-Hill Companies, Inc., 2003 S6–18
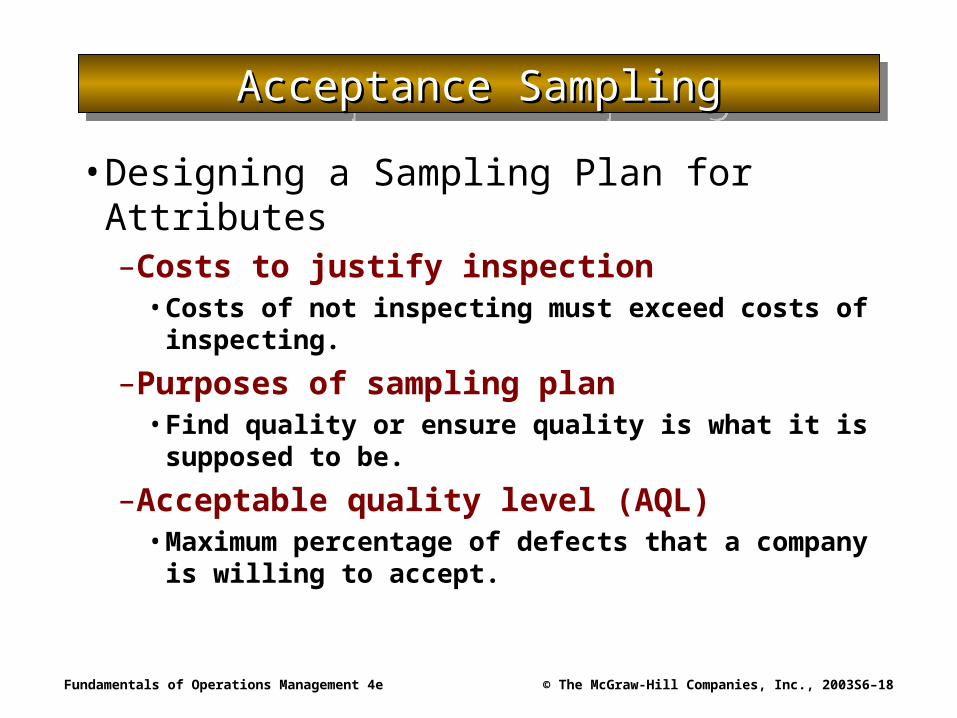
Acceptance SamplingAcceptance SamplingAcceptance SamplingAcceptance Sampling
• Designing a Sampling Plan for Attributes–Costs to justify inspection
• Costs of not inspecting must exceed costs of inspecting.
–Purposes of sampling plan• Find quality or ensure quality is what it is supposed to
be.
–Acceptable quality level (AQL)• Maximum percentage of defects that a company is
willing to accept.

Fundamentals of Operations Management 4e © The McGraw-Hill Companies, Inc., 2003 S6–19
Attribute SamplingAttribute SamplingAttribute SamplingAttribute Sampling
• Defining an Attribute Sampling Plan–N: number of units in the lot–n: number of units in the sample–c: the acceptance number (the maximum
number of defectives allowed in the sample before the whole lot is rejected.
• LTPD–Lot tolerance percentage defective: the
percentage of defective units that can be in a single lot.
Fundamentals of Operations Management 4e © The McGraw-Hill Companies, Inc., 2003 S6–20
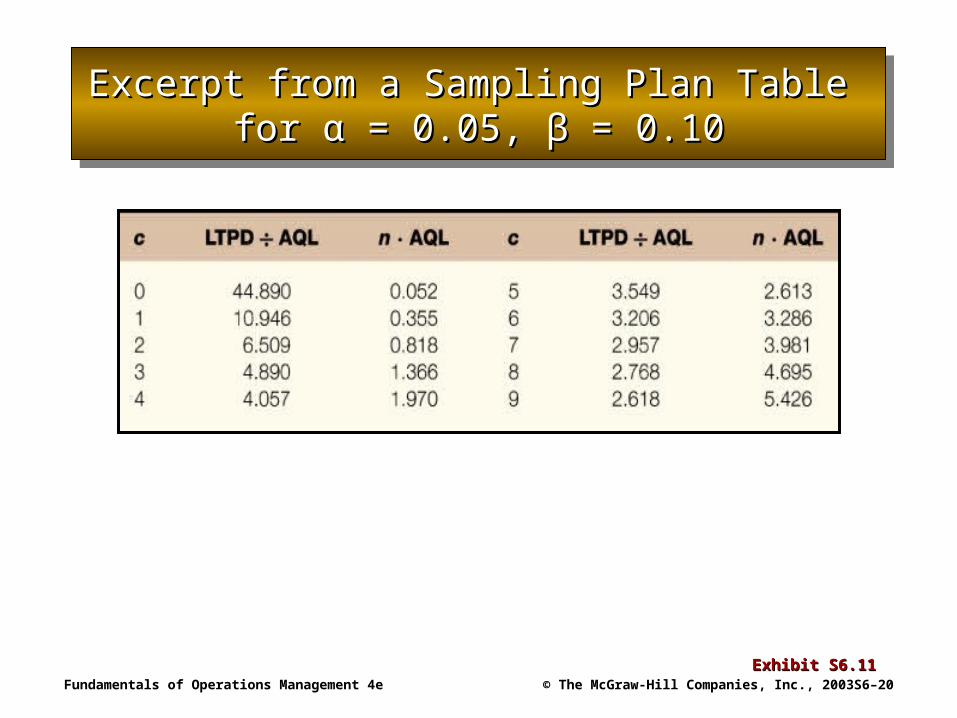
Excerpt from a Sampling Plan Table Excerpt from a Sampling Plan Table for for α = 0.05, β = 0.10α = 0.05, β = 0.10
Excerpt from a Sampling Plan Table Excerpt from a Sampling Plan Table for for α = 0.05, β = 0.10α = 0.05, β = 0.10
Exhibit S6.11Exhibit S6.11
Fundamentals of Operations Management 4e © The McGraw-Hill Companies, Inc., 2003 S6–21
Operating Characteristic CurvesOperating Characteristic CurvesOperating Characteristic CurvesOperating Characteristic Curves
• Operating Characteristic (OC) Curves–Curves that illustrate graphically the probability
of accepting lots that contain different percent defectives.

Fundamentals of Operations Management 4e © The McGraw-Hill Companies, Inc., 2003 S6–22
Operating Characteristic Curve for AQL=.020, Operating Characteristic Curve for AQL=.020, α = 0.05, LTPD= 0.80, β = 0.10α = 0.05, LTPD= 0.80, β = 0.10
Operating Characteristic Curve for AQL=.020, Operating Characteristic Curve for AQL=.020, α = 0.05, LTPD= 0.80, β = 0.10α = 0.05, LTPD= 0.80, β = 0.10
Exhibit S6.12Exhibit S6.12

Fundamentals of Operations Management 4e © The McGraw-Hill Companies, Inc., 2003 S6–23
Developing a Sampling Plan for Developing a Sampling Plan for VariablesVariables
Developing a Sampling Plan for Developing a Sampling Plan for VariablesVariables
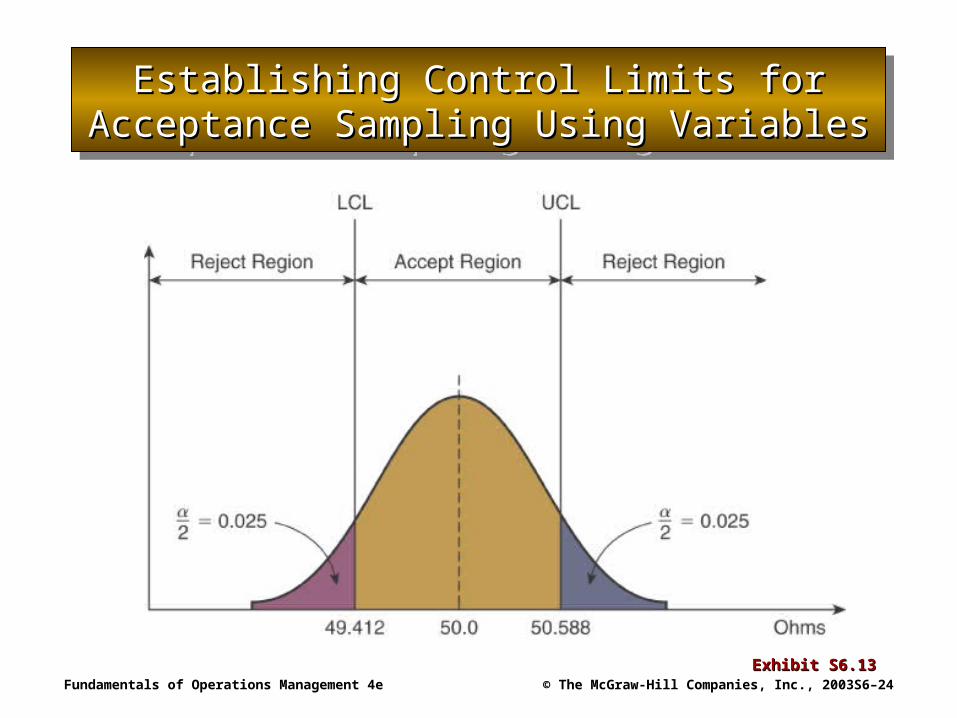
• Control Limits–Points on an acceptance sampling chart that
distinguish the accept and reject region(s).–Also, the points on a process control chart that
distinguish between a process being in or out of control.
• Factors to Consider in Designing a Plan–The probability of rejecting a good lot (α error)–The probability of accepting bad lot (β error)–The size of the sample (n)
Fundamentals of Operations Management 4e © The McGraw-Hill Companies, Inc., 2003 S6–24
Establishing Control Limits for Acceptance Establishing Control Limits for Acceptance Sampling Using VariablesSampling Using Variables
Establishing Control Limits for Acceptance Establishing Control Limits for Acceptance Sampling Using VariablesSampling Using Variables
Exhibit S6.13Exhibit S6.13
Fundamentals of Operations Management 4e © The McGraw-Hill Companies, Inc., 2003 S6–25
Determining the Probability of Committing Determining the Probability of Committing a Type II error (a Type II error (β error)β error)
Determining the Probability of Committing Determining the Probability of Committing a Type II error (a Type II error (β error)β error)
Exhibit S6.14Exhibit S6.14
Fundamentals of Operations Management 4e © The McGraw-Hill Companies, Inc., 2003 S6–26
Statistical Process ControlStatistical Process ControlStatistical Process ControlStatistical Process Control
• Statistical Process Control (SPC)–A quantitative method for determining whether a
particular process is in or out of control.
• Central Limit Theorem–Sample means will be normally distributed no
matter what the shape of the distribution.
• Variation–Random variation–Nonrandom (assignable) variation
Fundamentals of Operations Management 4e © The McGraw-Hill Companies, Inc., 2003 S6–27
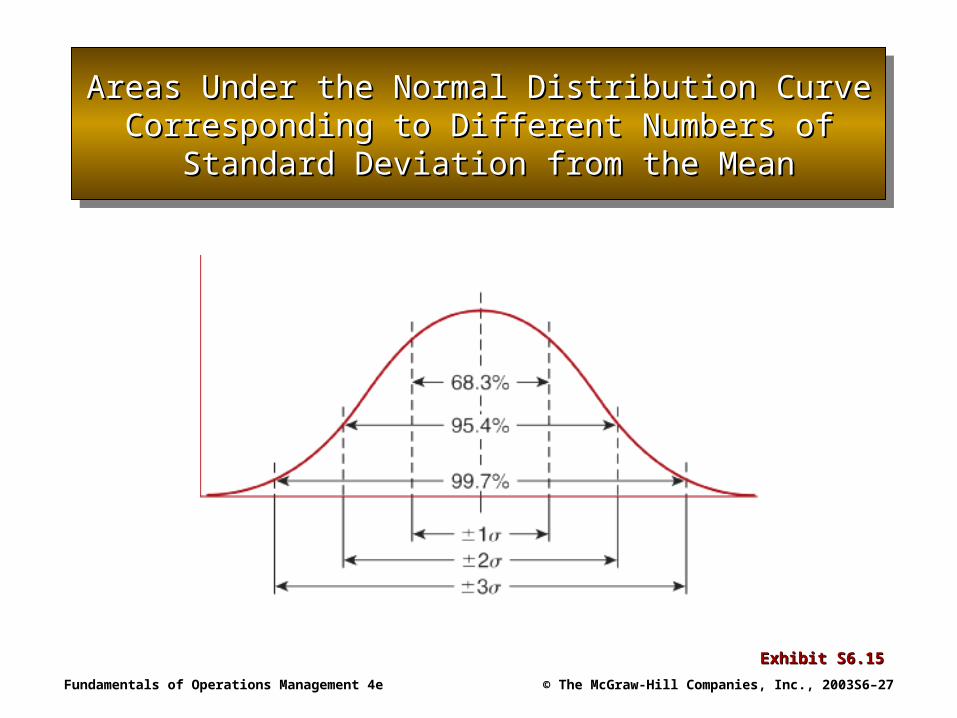
Areas Under the Normal Distribution Curve Areas Under the Normal Distribution Curve Corresponding to Different Numbers ofCorresponding to Different Numbers of
Standard Deviation from the Mean Standard Deviation from the Mean
Areas Under the Normal Distribution Curve Areas Under the Normal Distribution Curve Corresponding to Different Numbers ofCorresponding to Different Numbers of
Standard Deviation from the Mean Standard Deviation from the Mean
Exhibit S6.15Exhibit S6.15
Fundamentals of Operations Management 4e © The McGraw-Hill Companies, Inc., 2003 S6–28
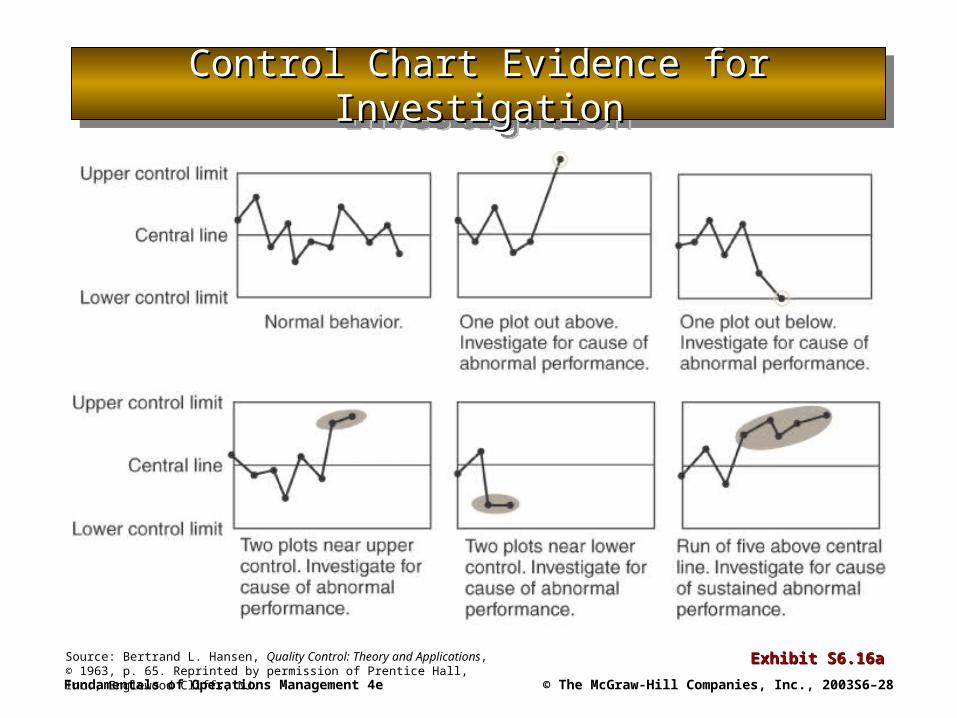
Control Chart Evidence for InvestigationControl Chart Evidence for InvestigationControl Chart Evidence for InvestigationControl Chart Evidence for Investigation
Exhibit S6.16aExhibit S6.16aSource: Bertrand L. Hansen, Quality Control: Theory and Applications, © 1963, p. 65. Reprinted by permission of Prentice Hall, Inc., Englewood Cliffs, NJ.
Fundamentals of Operations Management 4e © The McGraw-Hill Companies, Inc., 2003 S6–29
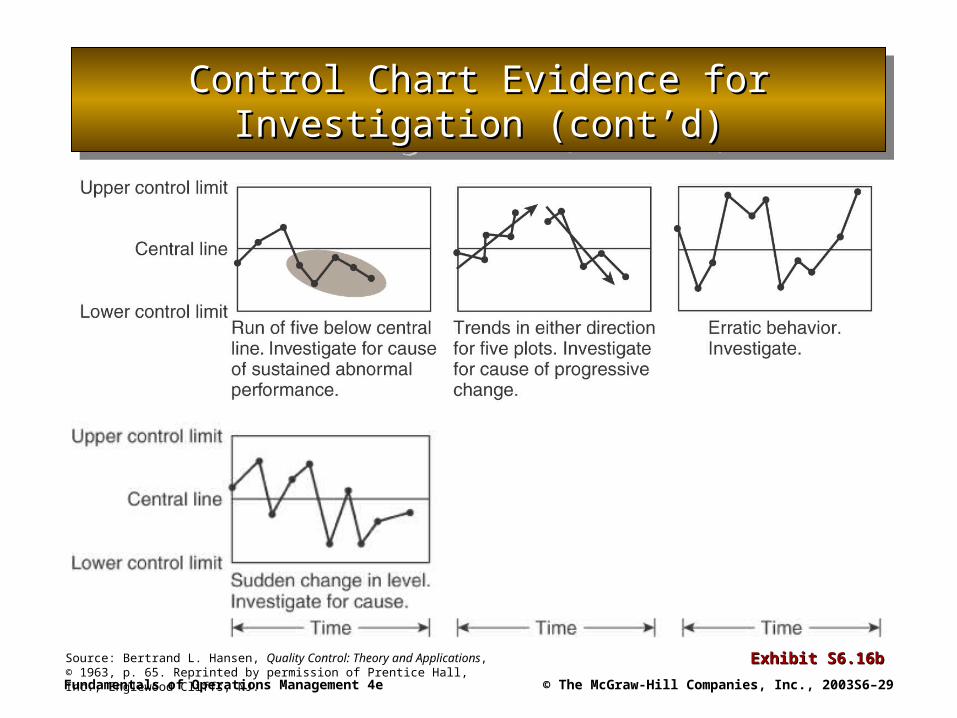
Control Chart Evidence for Investigation Control Chart Evidence for Investigation (cont’d)(cont’d)
Control Chart Evidence for Investigation Control Chart Evidence for Investigation (cont’d)(cont’d)
Exhibit S6.16bExhibit S6.16bSource: Bertrand L. Hansen, Quality Control: Theory and Applications, © 1963, p. 65. Reprinted by permission of Prentice Hall, Inc., Englewood Cliffs, NJ.
Fundamentals of Operations Management 4e © The McGraw-Hill Companies, Inc., 2003 S6–30
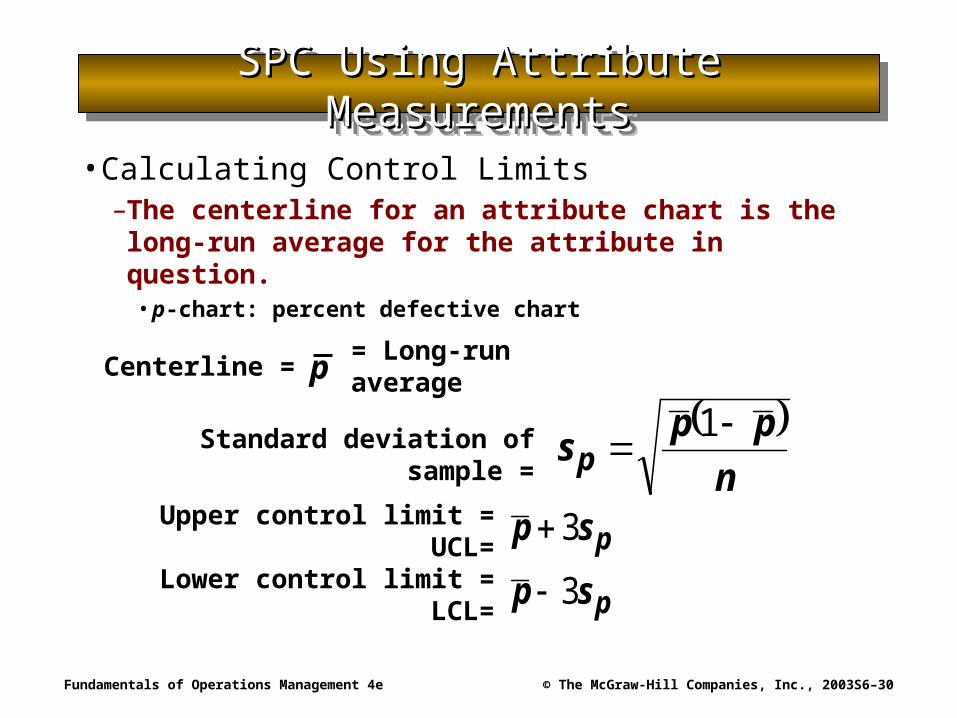
SPC Using Attribute MeasurementsSPC Using Attribute MeasurementsSPC Using Attribute MeasurementsSPC Using Attribute Measurements
• Calculating Control Limits–The centerline for an attribute chart is the long-
run average for the attribute in question.• p-chart: percent defective chart
Centerline = p = Long-run average
Standard deviation of sample =
Upper control limit = UCL= psp 3
n
pps p
1
psp 3Lower control limit = LCL=
Fundamentals of Operations Management 4e © The McGraw-Hill Companies, Inc., 2003 S6–31
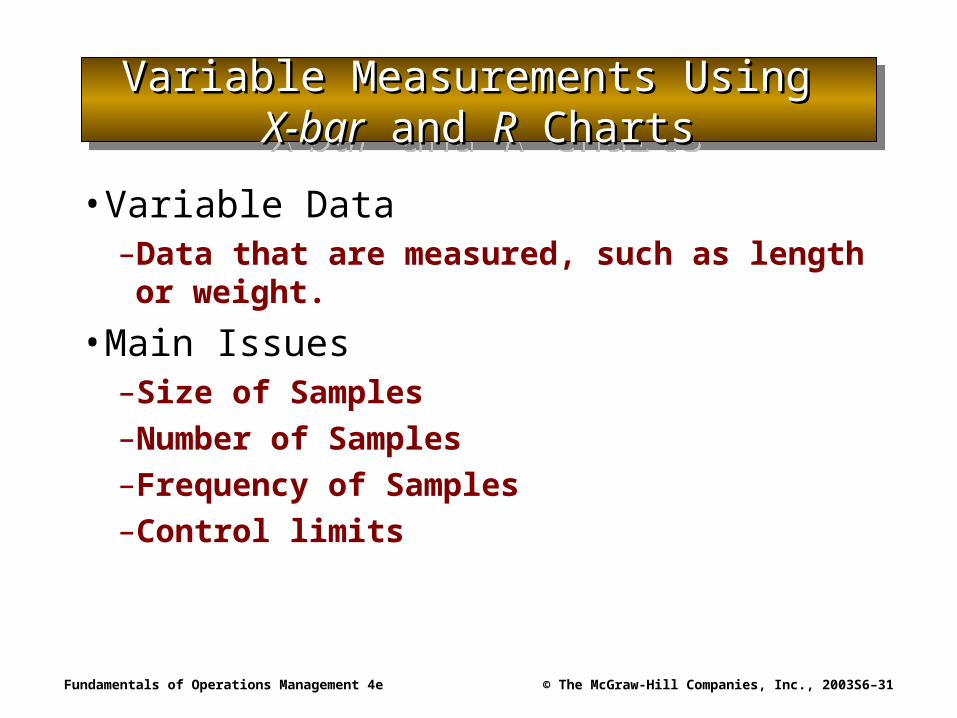
Variable Measurements Using Variable Measurements Using X-barX-bar and and RR Charts Charts
Variable Measurements Using Variable Measurements Using X-barX-bar and and RR Charts Charts
• Variable Data–Data that are measured, such as length or
weight.
• Main Issues–Size of Samples–Number of Samples–Frequency of Samples–Control limits

Fundamentals of Operations Management 4e © The McGraw-Hill Companies, Inc., 2003 S6–32
Constructing Constructing X-barX-bar Charts ChartsConstructing Constructing X-barX-bar Charts Charts
• X-bar Chart–A chart that tracks the changes in the means of
the samples by plotting the means that were taken from a process.
n
X
X
n
ii
1Total number of items in the sample
Item number
Mean of the sample
n
i
X
m
X
X
m
jj
1Total number of samples
Sample number
The average of the means of the samples
m
j
X
Fundamentals of Operations Management 4e © The McGraw-Hill Companies, Inc., 2003 S6–33
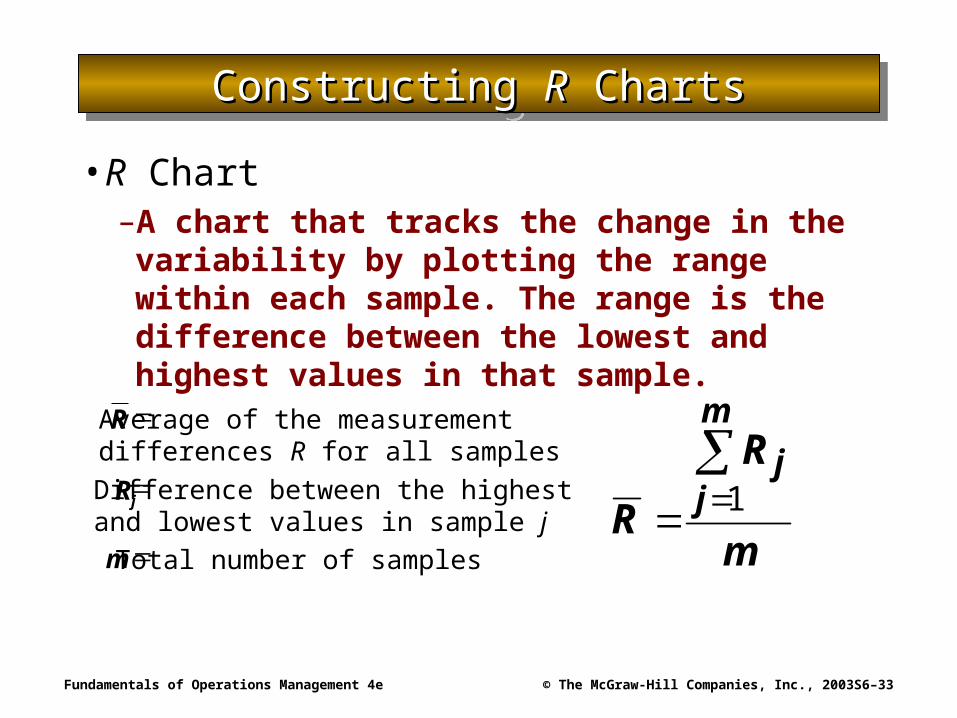
Constructing Constructing RR Charts ChartsConstructing Constructing RR Charts Charts
• R Chart–A chart that tracks the change in the variability
by plotting the range within each sample. The range is the difference between the lowest and highest values in that sample.
m
R
R
m
jj
1
Total number of samples
Difference between the highest and lowest values in sample j
Average of the measurement differences R for all samples
m
Rj
R
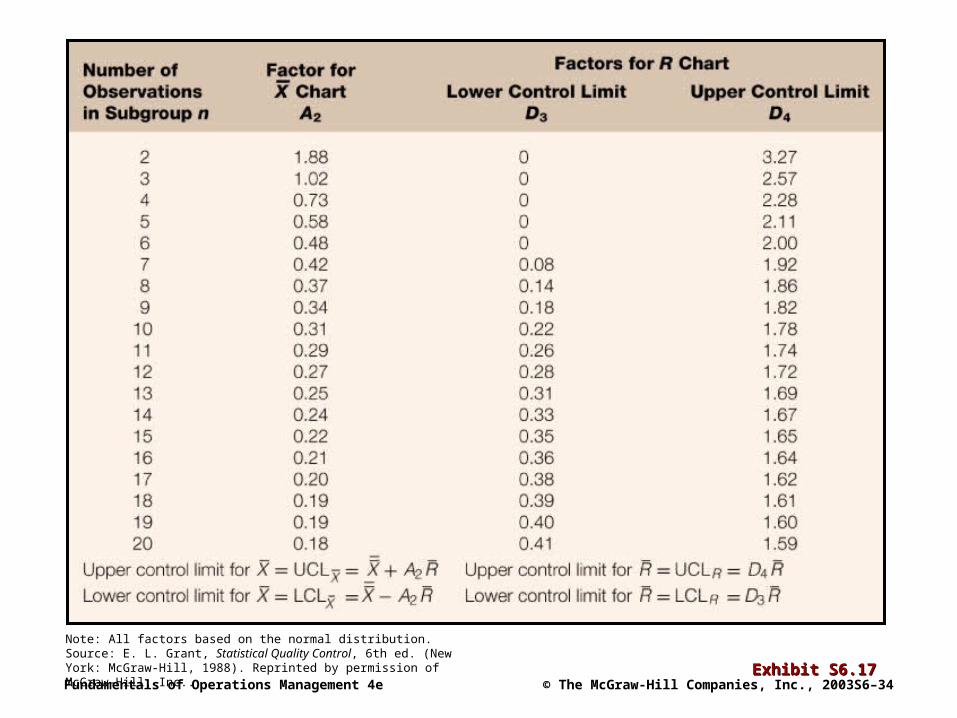
Fundamentals of Operations Management 4e © The McGraw-Hill Companies, Inc., 2003 S6–34Exhibit S6.17Exhibit S6.17
Note: All factors based on the normal distribution.Source: E. L. Grant, Statistical Quality Control, 6th ed. (New York: McGraw-Hill, 1988). Reprinted by permission of McGraw-Hill, Inc..

Fundamentals of Operations Management 4e © The McGraw-Hill Companies, Inc., 2003 S6–35
Exhibit S6.18Exhibit S6.18
Fundamentals of Operations Management 4e © The McGraw-Hill Companies, Inc., 2003 S6–36
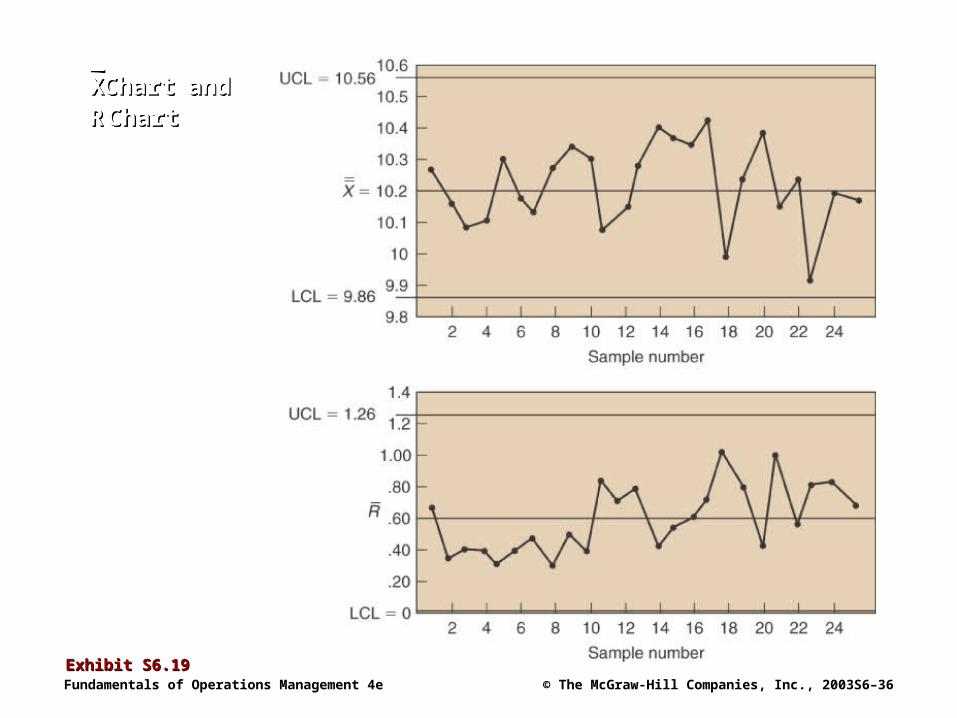
Exhibit S6.19Exhibit S6.19
ChartChartRR and andChart Chart XX
Fundamentals of Operations Management 4e © The McGraw-Hill Companies, Inc., 2003 S6–37
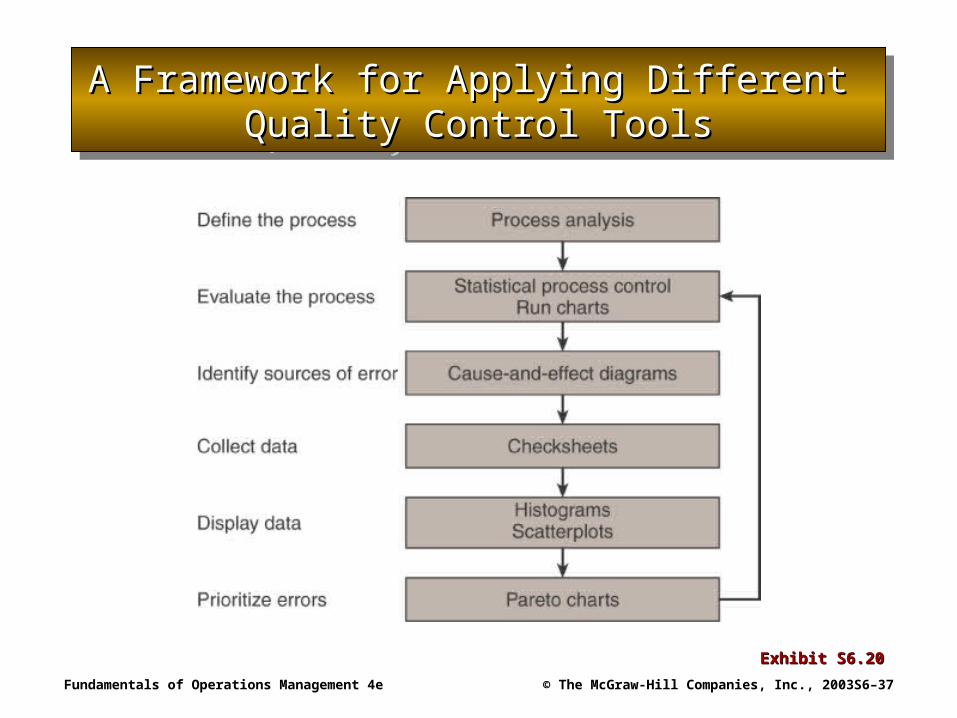
A Framework for Applying Different A Framework for Applying Different Quality Control ToolsQuality Control Tools
A Framework for Applying Different A Framework for Applying Different Quality Control ToolsQuality Control Tools
Exhibit S6.20Exhibit S6.20
Fundamentals of Operations Management 4e © The McGraw-Hill Companies, Inc., 2003 S6–38
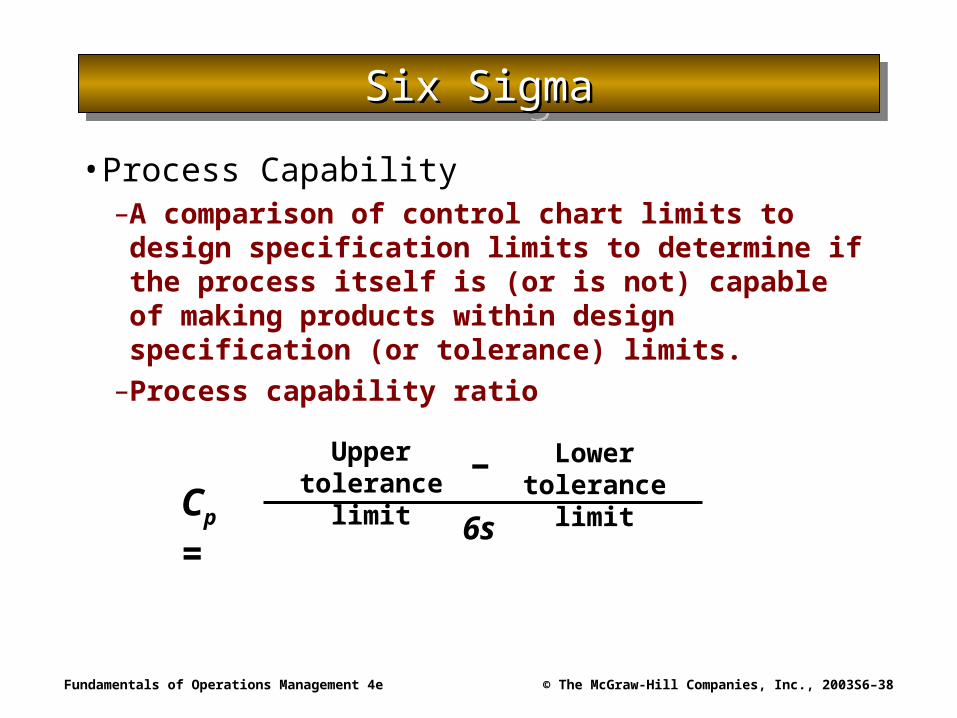
Six SigmaSix SigmaSix SigmaSix Sigma
• Process Capability–A comparison of control chart limits to design
specification limits to determine if the process itself is (or is not) capable of making products within design specification (or tolerance) limits.
–Process capability ratio
Cp =
Upper tolerance limit - Lower tolerance
limit
6s
Fundamentals of Operations Management 4e © The McGraw-Hill Companies, Inc., 2003 S6–39
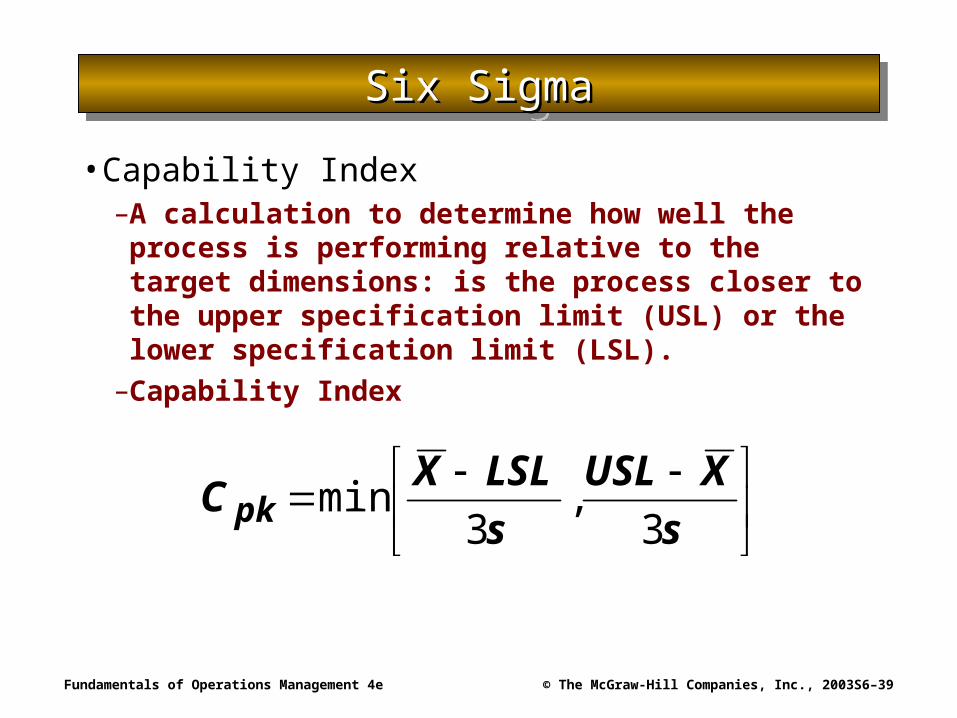
Six SigmaSix SigmaSix SigmaSix Sigma
• Capability Index–A calculation to determine how well the process
is performing relative to the target dimensions: is the process closer to the upper specification limit (USL) or the lower specification limit (LSL).
–Capability Index
s
XUSL
s
LSLXC pk 3
,3
min

Fundamentals of Operations Management 4e © The McGraw-Hill Companies, Inc., 2003 S6–40
Reducing Process Variance So that All Reducing Process Variance So that All Parts Are within Specification (Tolerance)*Parts Are within Specification (Tolerance)*
Reducing Process Variance So that All Reducing Process Variance So that All Parts Are within Specification (Tolerance)*Parts Are within Specification (Tolerance)*
Exhibit S6.21aExhibit S6.21a*Tolerance: The range within which all individual measurements of units produced is desired to fall.Source: Robert W. Hall, Attaining Manufacturing Excellence: Just-in-Time Manufacturing, Total Quality, Total People Involvement (Homewood, IL: Dow Jones-Irwin, 1987), p. 66. By permission of The McGraw-Hill Companies.
Fundamentals of Operations Management 4e © The McGraw-Hill Companies, Inc., 2003 S6–41
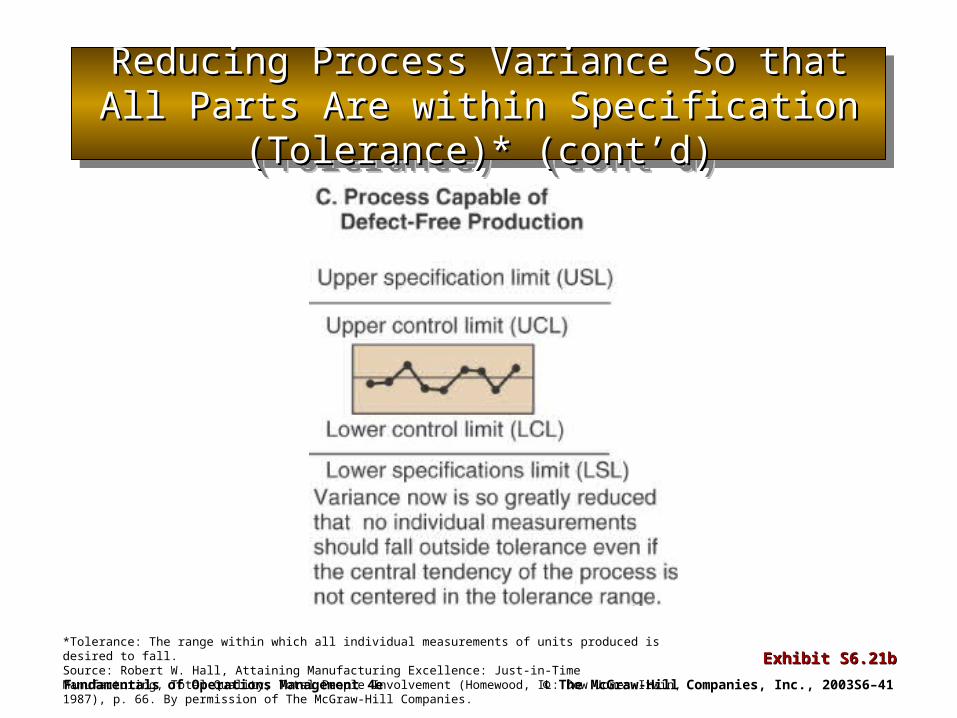
Reducing Process Variance So that All Reducing Process Variance So that All Parts Are within Specification (Tolerance)* Parts Are within Specification (Tolerance)*
(cont’d)(cont’d)
Reducing Process Variance So that All Reducing Process Variance So that All Parts Are within Specification (Tolerance)* Parts Are within Specification (Tolerance)*
(cont’d)(cont’d)
Exhibit S6.21bExhibit S6.21b*Tolerance: The range within which all individual measurements of units produced is desired to fall.Source: Robert W. Hall, Attaining Manufacturing Excellence: Just-in-Time Manufacturing, Total Quality, Total People Involvement (Homewood, IL: Dow Jones-Irwin, 1987), p. 66. By permission of The McGraw-Hill Companies.

Fundamentals of Operations Management 4e © The McGraw-Hill Companies, Inc., 2003 S6–42
The Goal of Six SigmaThe Goal of Six SigmaThe Goal of Six SigmaThe Goal of Six Sigma
Exhibit S6.22Exhibit S6.22
Fundamentals of Operations Management 4e © The McGraw-Hill Companies, Inc., 2003 S6–43
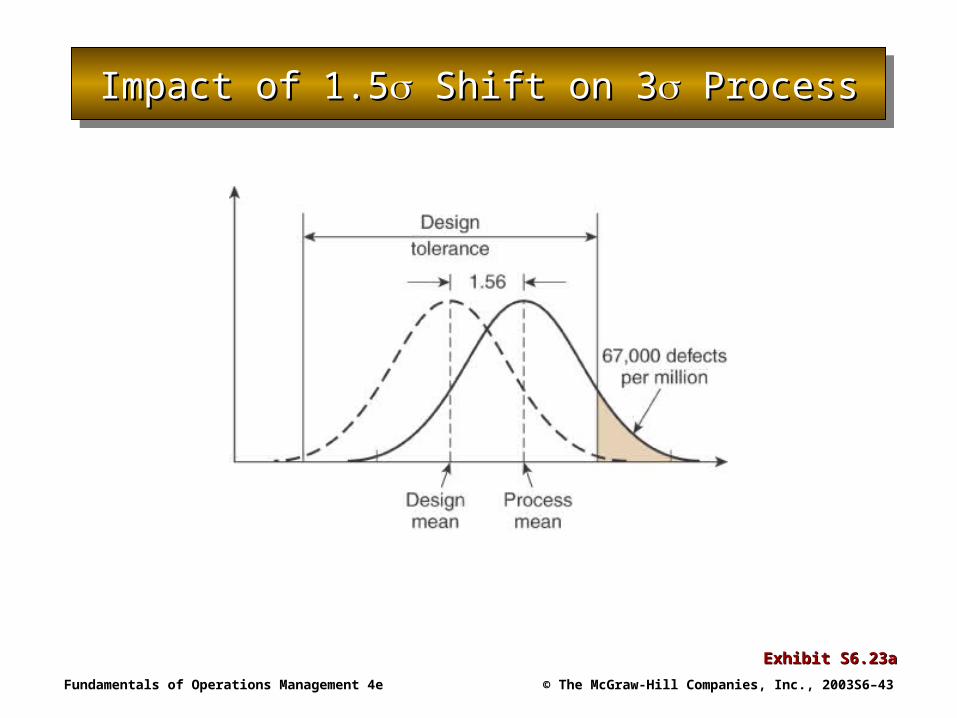
Impact of 1.5Impact of 1.5 Shift on 3 Shift on 3 Process ProcessImpact of 1.5Impact of 1.5 Shift on 3 Shift on 3 Process Process
Exhibit S6.23aExhibit S6.23a
Fundamentals of Operations Management 4e © The McGraw-Hill Companies, Inc., 2003 S6–44
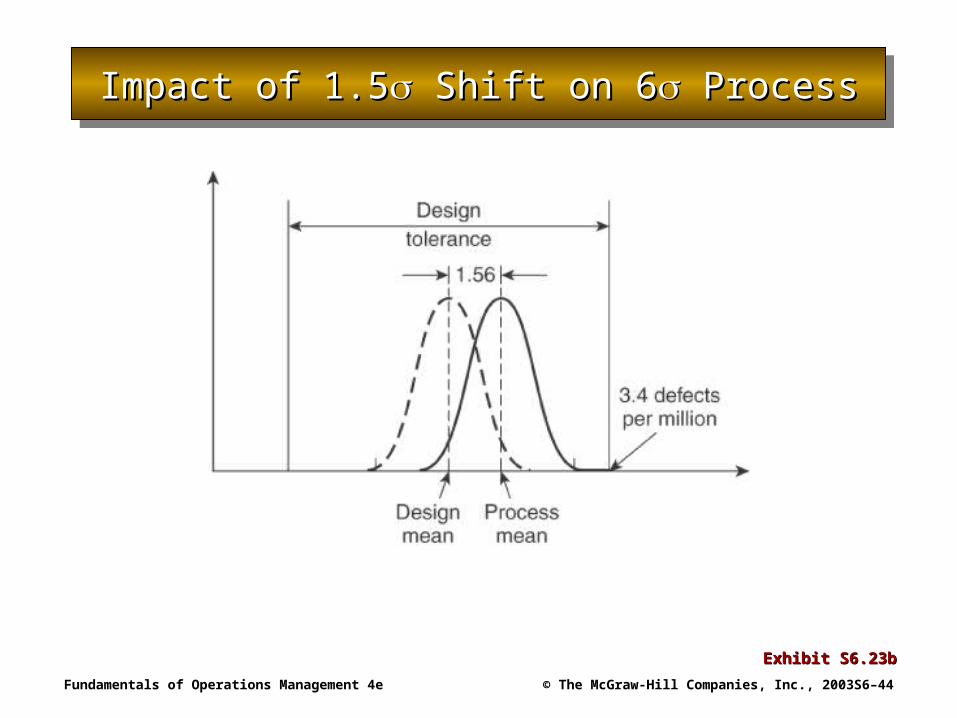
Impact of 1.5Impact of 1.5 Shift on 6 Shift on 6 Process ProcessImpact of 1.5Impact of 1.5 Shift on 6 Shift on 6 Process Process
Exhibit S6.23bExhibit S6.23b
Fundamentals of Operations Management 4e © The McGraw-Hill Companies, Inc., 2003 S6–45
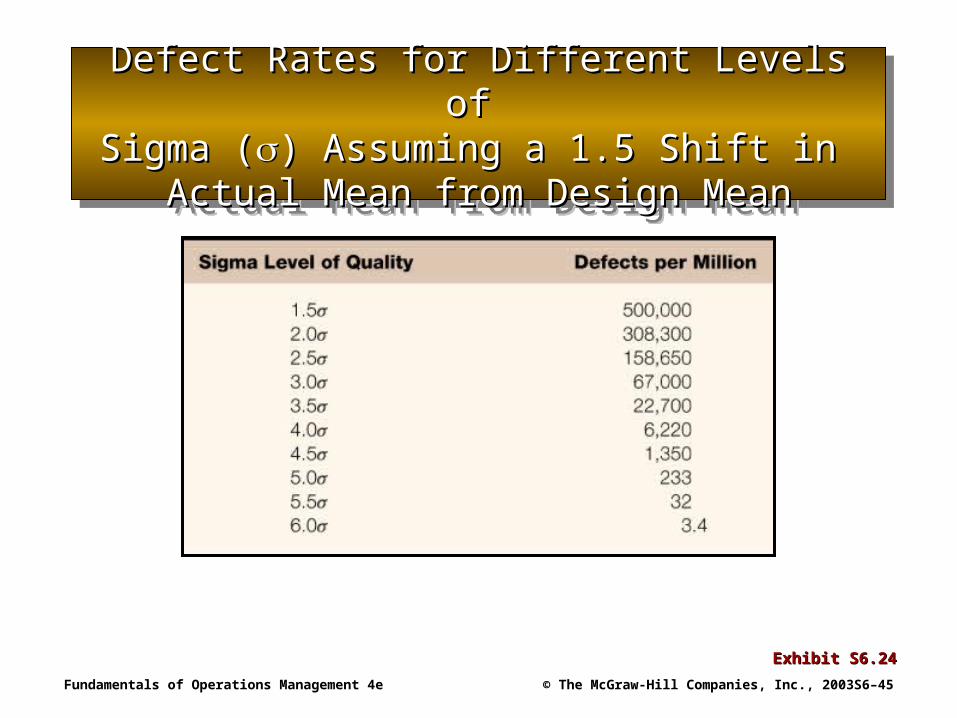
Defect Rates for Different Levels of Defect Rates for Different Levels of Sigma (Sigma () Assuming a 1.5 Shift in ) Assuming a 1.5 Shift in
Actual Mean from Design MeanActual Mean from Design Mean
Defect Rates for Different Levels of Defect Rates for Different Levels of Sigma (Sigma () Assuming a 1.5 Shift in ) Assuming a 1.5 Shift in
Actual Mean from Design MeanActual Mean from Design Mean
Exhibit S6.24Exhibit S6.24
Fundamentals of Operations Management 4e © The McGraw-Hill Companies, Inc., 2003 S6–46
Taguchi MethodsTaguchi MethodsTaguchi MethodsTaguchi Methods
• Taguchi Methods–Used for identifying the cause(s) of process
variation that reduces the number of tests that are necessary.
–Use to conduct experiments to determine the best combinations of product and process variables to make a product at the lowest cost with the highest uniformity.
–Quality loss function• Relates the cost of quality directly to variation in a
process.• Any deviation from target quality is a loss to society.
Fundamentals of Operations Management 4e © The McGraw-Hill Companies, Inc., 2003 S6–47
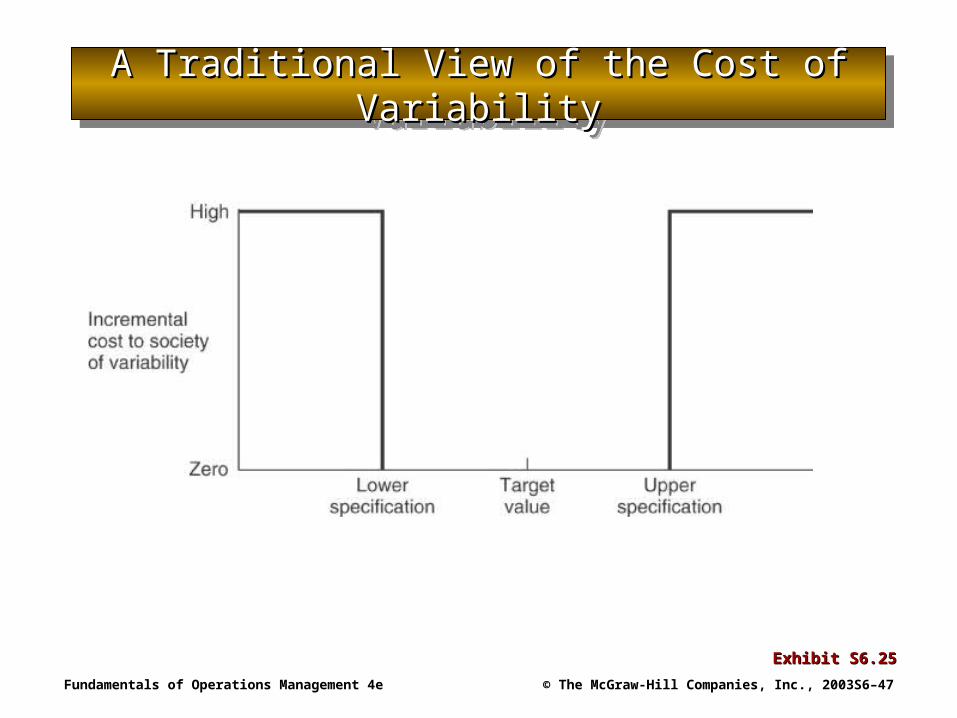
A Traditional View of the Cost of A Traditional View of the Cost of VariabilityVariability
A Traditional View of the Cost of A Traditional View of the Cost of VariabilityVariability
Exhibit S6.25Exhibit S6.25

Fundamentals of Operations Management 4e © The McGraw-Hill Companies, Inc., 2003 S6–48
Taguchi’s View of the Cost of VariabilityTaguchi’s View of the Cost of VariabilityTaguchi’s View of the Cost of VariabilityTaguchi’s View of the Cost of Variability
Exhibit S6.26Exhibit S6.26
Fundamentals of Operations Management 4e © The McGraw-Hill Companies, Inc., 2003 S6–49
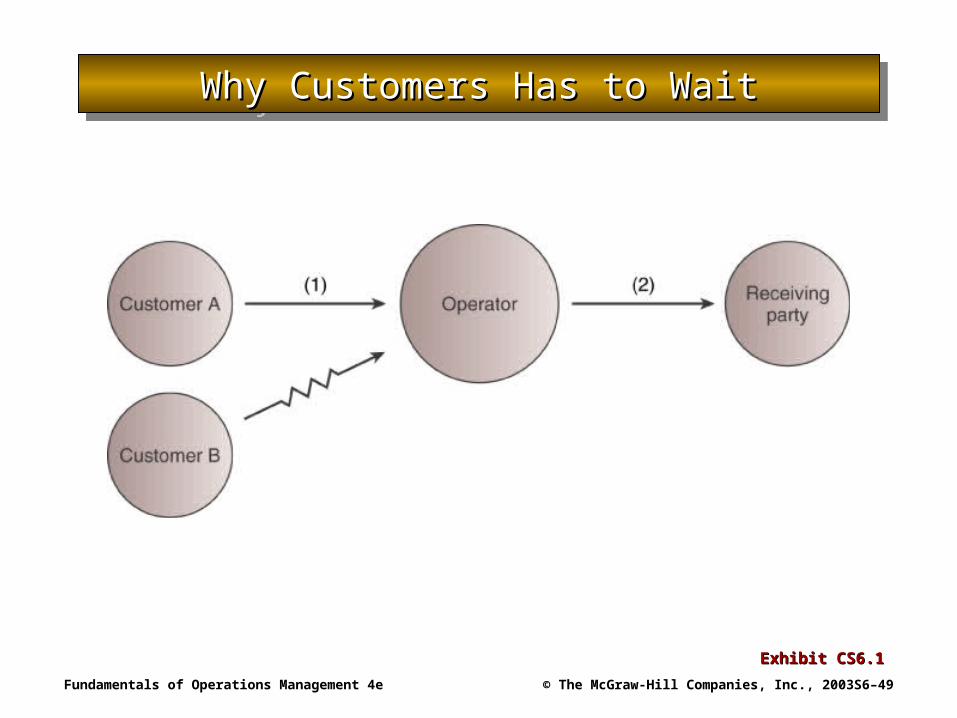
Exhibit CS6.1Exhibit CS6.1
Why Customers Has to WaitWhy Customers Has to WaitWhy Customers Has to WaitWhy Customers Has to Wait
Fundamentals of Operations Management 4e © The McGraw-Hill Companies, Inc., 2003 S6–50
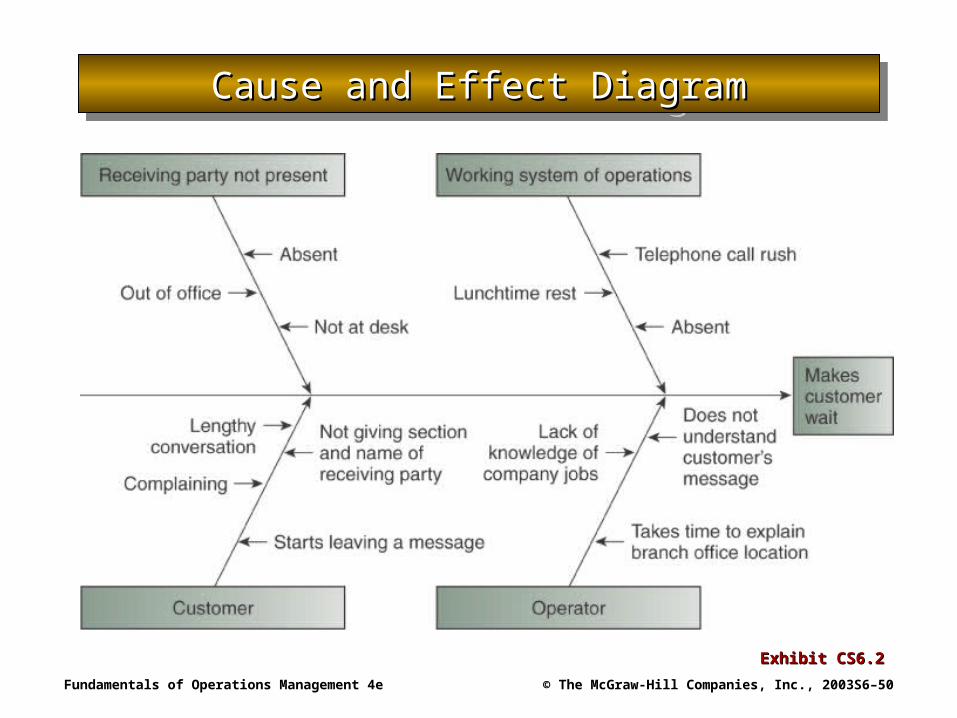
Exhibit CS6.2Exhibit CS6.2
Cause and Effect DiagramCause and Effect DiagramCause and Effect DiagramCause and Effect Diagram

Fundamentals of Operations Management 4e © The McGraw-Hill Companies, Inc., 2003 S6–51
Exhibit CS6.3AExhibit CS6.3A
Causes of Callers’ WaitsCauses of Callers’ WaitsCauses of Callers’ WaitsCauses of Callers’ Waits
Checklist—Designed to identify the problems

Fundamentals of Operations Management 4e © The McGraw-Hill Companies, Inc., 2003 S6–52
Exhibit CS6.3BExhibit CS6.3B
Causes of Callers’ Waits (cont’d)Causes of Callers’ Waits (cont’d)Causes of Callers’ Waits (cont’d)Causes of Callers’ Waits (cont’d)
Reasons Why Callers Had to Wait
Fundamentals of Operations Management 4e © The McGraw-Hill Companies, Inc., 2003 S6–53
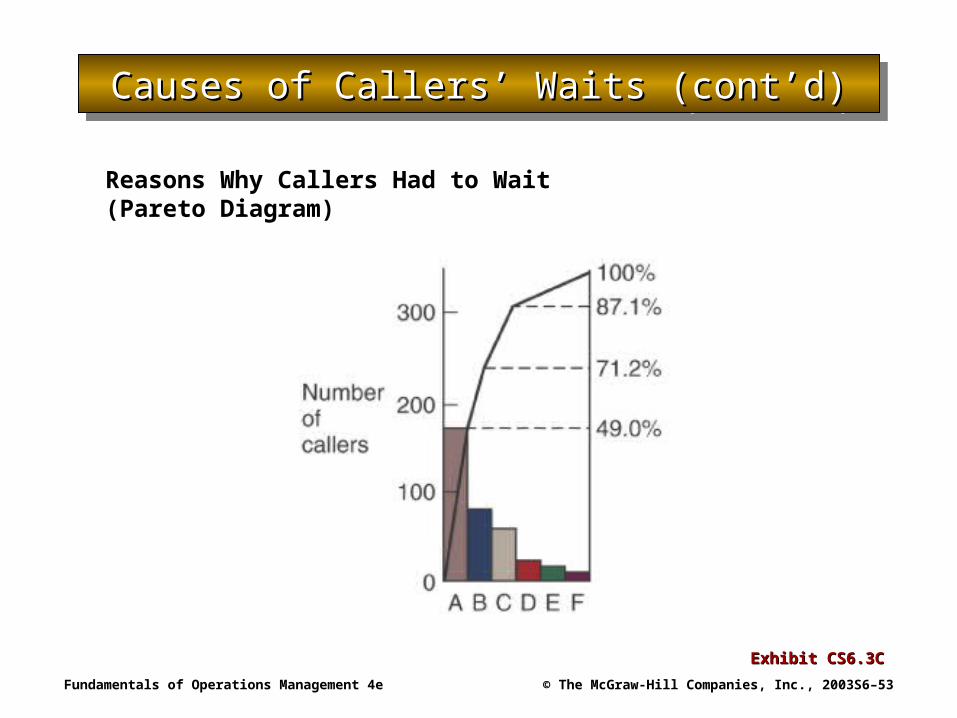
Exhibit CS6.3CExhibit CS6.3C
Causes of Callers’ Waits (cont’d)Causes of Callers’ Waits (cont’d)Causes of Callers’ Waits (cont’d)Causes of Callers’ Waits (cont’d)
Reasons Why Callers Had to Wait (Pareto Diagram)

Fundamentals of Operations Management 4e © The McGraw-Hill Companies, Inc., 2003 S6–54
Exhibit CS6.4AExhibit CS6.4A
Effects of QCEffects of QCEffects of QCEffects of QC
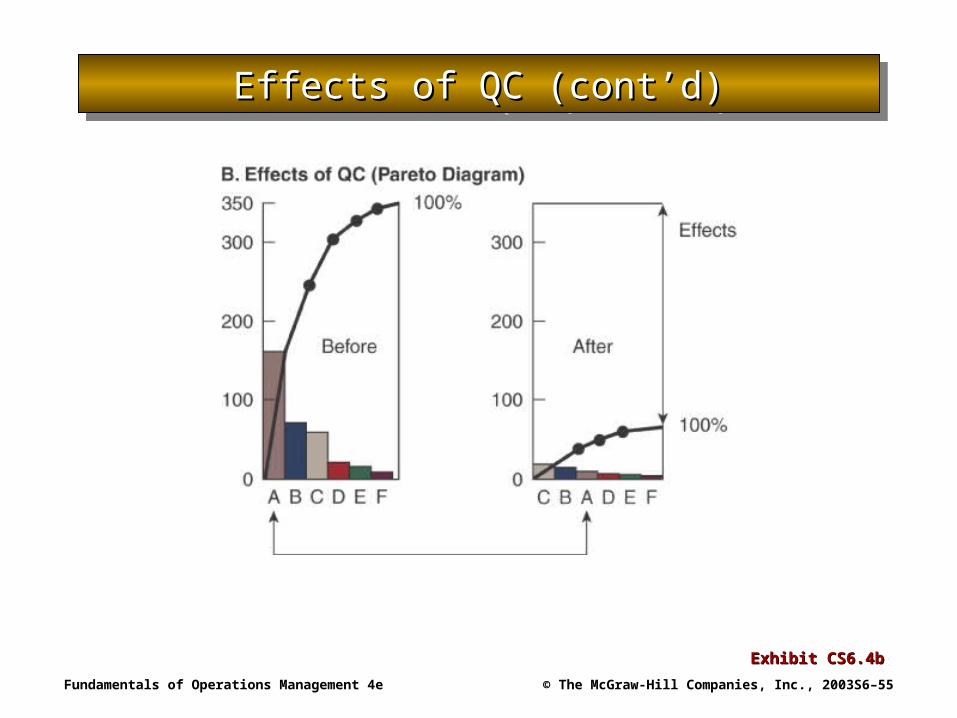
A. Effects of QC (Comparison Before and After QC)Total number Daily average
Reasons why callers had to wait Before After Before After
A One operator (partner out of the office) 172 15 14.3 1.2
B Receiving party not present 73 17 6.1 1.4
C No one present in the section receiving the call 61 20 5.1 1.7
D Section and name of receiving party not given 19 4 1.6 0.3
E Inquiry about branch office Locations 16 3 1.3 0.2
F Others 10 0 0.8 0
Total 351 59 29.2 4.8
Period: 12 days from Aug. 17 to 30.
Problems are classified according to cause and presented in order of the amount of time consumed. The are illustrated in a bar graph. 100% indicates the total number of time-consuming calls.
Fundamentals of Operations Management 4e © The McGraw-Hill Companies, Inc., 2003 S6–55
Exhibit CS6.4bExhibit CS6.4b
Effects of QC (cont’d)Effects of QC (cont’d)Effects of QC (cont’d)Effects of QC (cont’d)


![project appraisal document (pad) - P166538 (Final)...s^> s o µ } ( ^ ] ] o > ] ( t t ( ] } o Z ] o ] v / v À u v W } i t t } o v l t,K t } o , o Z K P v ] Ì ] } v z>> z } ( o ]](https://static.fdocuments.us/doc/165x107/5fe39b73ebe5ce13dc01d30f/project-appraisal-document-pad-p166538-final-s-s-o-o.jpg)