F 2020 PROJECTIONS
46
Fall 2019 Population Projections California Department of Corrections and Rehabilitation FALL 2020 POPULATION PROJECTIONS Division of Correctional Policy Research and Internal Oversight OFFICE OF RESEARCH | JANUARY 2021
Transcript of F 2020 PROJECTIONS

Fall 2019 Population Projections
i
California Department of Corrections and Rehabilitation
FALL 2020
POPULATION PROJECTIONS
Division of Correctional Policy Research and Internal Oversight
OFFICE OF RESEARCH | JANUARY 2021

You can obtain reports by contacting the Department of Corrections and Rehabilitation on the internet at:
https://cdcr.ca.gov/research/
The Mission of CDCR’s Office of Research: "To inform public policy by analyzing correctional trends, developing population projections, guiding
research projects and publishing Department reports."
Kathleen Allison, Secretary Jennifer Barretto, Undersecretary
Amy Miller, Director Chris Chambers, Deputy Director
Loran Sheley, Chief
Produced by:
Juan Angel Villon, Research Data Specialist II Paul Whiteley, Research Data Specialist II Jenny Belnas, Research Data Supervisor I
Matthew Basinger, Research Data Specialist I Miguel Lizarde, Research Data Analyst I
Tyler Kirkbride, Student Assistant

Fall 2020 Population Projections
ii
Table of Contents
1 Introduction .......................................................................................................................................... 1
1.1 Changes for Fall 2020 Population Projections ................................................................................. 1
2 Adult Population Projections ................................................................................................................ 3
2.1 Adult Total Institution Population Trends and Projections ............................................................. 4
2.2 Adult Institution Population Trends and Projections by Gender ..................................................... 7
2.3 Comparison of Spring 2020 and Fall 2020 Total Institution Population Projections ..................... 10
2.3.1 Comparison of Spring 2020 and Fall 2020 Total Institution Population Projections by Gender ..................................................................................................................................... 11
3 Court Commitments ........................................................................................................................... 12
3.1 Felon Court Commitment Trends and Projections by Gender ...................................................... 15
3.2 Felon Second Strike Court Commitment Trends and Projections ................................................. 16
4 Male Inmate Placement Needs .......................................................................................................... 17
5 Parole Population ............................................................................................................................... 18
5.1 Active Parole Population Trends and Projections.......................................................................... 18
5.2 Comparison of Spring 2020 and Fall 2020 Active Parole Population Projections ......................... 21
6 Juvenile Population Projections .......................................................................................................... 22
Appendix A – Methodology, Technical Notes, and Limitations .................................................................. 23
Methodology and Technical Notes ......................................................................................................... 23
Limitations ............................................................................................................................................... 24
Appendix B – Significant Chaptered Legislation, Initiatives, and Policy Changes ....................................... 25
Adults ...................................................................................................................................................... 25
Legislation ............................................................................................................................................ 25
Initiatives ............................................................................................................................................. 25
Policy Changes ..................................................................................................................................... 26
Juveniles .................................................................................................................................................. 29
Legislation ............................................................................................................................................ 29
Initiatives ............................................................................................................................................. 29
Appendix C – Glossary of Terms ................................................................................................................. 30
Appendix D – Population Projections Tables 9 to 20 .................................................................................. 32

Fall 2020 Population Projections
iii
List of Tables and Figures
Tables
Table 1. Institution and Active Parole Population, June 30, 2011 through June 30, 2025 ........................... 3
Table 2. Comparison of Spring 2020 and Fall 2020 Total Institution Population Projections .................... 10
Table 3. Comparison of Spring 2020 and Fall 2020 Total Institution Population Projections by Gender .. 11
Table 4. Felon Court Commitments and Projections by Gender, Fiscal Years 2010-11 through 2024-25 . 13
Table 5. Male Institution Population Projections by Housing Level, June 30, 2020 through
June 30, 2025 ................................................................................................................................. 17
Table 6. Active Parole Population Supervised in California, June 30, 2011 through June 30, 2025 ........... 19
Table 7. Comparison of Spring 2020 and Fall 2020 Active Parole Population Projections ......................... 21
Table 8. Juvenile Average Daily Population and Projected Average Daily Population,
June 2011 through June 2022 ........................................................................................................ 22
Table 9. Actual Felon Court Commitments, Fiscal Years 2010-11 through 2019-20 .................................. 32
Table 10. Actual Male Felon Court Commitments, Fiscal Years 2010-11 through 2019-20 ....................... 32
Table 11. Actual Female Felon Court Commitments, Fiscal Years 2010-11 through 2019-20 ................... 33
Table 12. Fall 2020 Projected Felon Institution Court Commitments, Fiscal Years 2020-21
through 2024-25 ............................................................................................................................ 33
Table 13. Fall 2020 Projected Male Felon Institution Court Commitments, Fiscal Years 2020-21
through 2024-25 ............................................................................................................................ 34
Table 14. Fall 2020 Projected Female Felon Institution Court Commitments, Fiscal Years 2020-21
through 2024-25 ............................................................................................................................ 34
Table 15. Institution Population by Quarter and Gender, Fiscal Years 2020-21 through 2021-22 ............ 35
Table 16. Average Daily Institution Population by Quarter and Gender, Fiscal Years 2020-21
through 2021-22 ............................................................................................................................ 35
Table 17. Projected Institution Population by Quarter and Housing Level, Fiscal Years 2020-21
through 2021-22 ............................................................................................................................ 36
Table 18. Projected Institution Population by Housing Level, June 30, 2020 through June 30, 2025 ....... 36
Table 19. California Active Parole Population by Quarter, Fiscal Years 2020-21 through 2021-22 ........... 37
Table 20. California Average Daily Active Parole Population by Quarter, Fiscal Years 2020-21
through 2021-22 ............................................................................................................................ 37

Fall 2020 Population Projections
iv
Figures
Figure 1. Total Institution Population Trends and Projections, June 30, 2011 through June 30, 2025 ........ 6
Figure 2. Male Population Trends and Projections, June 30, 2011 through June 30, 2025 ......................... 8
Figure 3. Female Population Trends and Projections, June 30, 2011 through June 30, 2025 ...................... 9
Figure 4. Felon Court Commitments and Projections, Fiscal Years 2010-11 through 2024-25 .................. 14
Figure 5. Felon Court Commitment Trends and Projections by Gender, Fiscal Years 2010-11
through 2024-25 ............................................................................................................................ 15
Figure 6. Actual and Projected Second Strike Court Commitments, Fiscal Years 2010-11
through 2024-25 ............................................................................................................................ 16
Figure 7. Active Parole Population Trends and Projections, June 30, 2011 through June 30, 2025 .......... 20

Fall 2020 Population Projections
v
Executive Summary
This report presents the California Department of Corrections and Rehabilitation’s (CDCR) Fall 2020 adult institution, parole, and juvenile institution populations projections. CDCR developed these projections using historical trend data, time series forecasting techniques, and a new simulation model. The institution and parole projections are provided through June 2025, and juvenile projections are provided through June 2022.
Similar to past population projections, these projections incorporate the impacts of several court-ordered population reduction measures, Proposition 47, Proposition 57, as well as recently implemented policy changes that were included in previous population projections.1 The Fall 2020 Projections additionally include the impacts of actions CDCR implemented as a response to COVID-19 and several new policy changes on adult institution and parole and juvenile institution populations.
The full impact of COVID-19 and recent policy changes on CDCR’s populations are still developing, and due to the extraordinary circumstances surrounding the Fall 2020 projections, the authors of this report suggest using extreme caution when interpreting these projection results.
Adult Institution Projections
CDCR predicts the adult institution population will decrease each year throughout the projections cycle due to the continuing impact of Proposition 57 as well as the recent policy changes and the actions taken in response to COVID-19.
In March 2020, CDCR halted the transfer of court commitments into the state’s institutions and youth correctional facilities. A brief reopening and subsequent closing was followed by a gradual resumption of admissions into CDCR Reception Centers in August 2020.2 In November 2020 intake was halted again, and CDCR will continue to assess and adjust the intake of court commitments based on the continuing impacts of COVID-19. Between April and June 2020, CDCR received approximately 95 percent fewer individuals from county jails compared to the same time period in 2019 (221 compared to 8,997). The Fall 2020 Population Projections assume that court commitments will remain at lower levels for several months before increasing to approximately half of pre-pandemic levels by June 2021, and returning to
1 Many court-ordered measures were subsequently enacted with the implementation of Proposition 57. Additional information is available at: https://www.cdcr.ca.gov/3-judge-court-update. Proposition 47 was passed by voter initiative in November 2014 and reduced penalties for most non-serious, non-violent property and drug crimes by mandating a misdemeanor instead of a felony sentence for certain crimes. Proposition 57 was passed by voter initiative in November 2016. More information is available at: https://www.cdcr.ca.gov/proposition57/. 2 More information about transfers to CDCR from county jail during the COVID-19 pandemic is available at https://www.cdcr.ca.gov/covid19/covid-19-response-efforts/#CJI.

Fall 2020 Population Projections
vi
pre-pandemic levels near the end of calendar year 2021.3 In July 2020, CDCR announced a series of actions to facilitate expedited release in an effort to further decompress the population.4 Lastly, CDCR granted a one-time credit of 12 weeks of Positive Programming Credits (PPC) to offenders eligible as of July 9, 2020. These credits were applied to eligible inmates without any serious rule violations between March 1 and July 5, 2020, and were intended to recognize the impact on access to programs and credit earning during the COVID-19 pandemic.5
Several other changes are included in the Fall 2020 Population Projections and impacted the institution population. These include: a change to good conduct credit earning for certain offenders to be effective in January 2021, and changes to Reception Center processing beginning in September 2020 that may be able to reduce the time spent in the Reception Center from the historical average of 90 to 120 days to allow earlier opportunities for programming.6
The institution population of 113,403 inmates on June 30, 2020 is expected to decrease to 92,991 inmates by June 30, 2021. The institution population is then expected to increase reaching 100,798 inmates by June 30, 2025, a net five-year decrease of 11.1 percent or 12,605 inmates. The population begins to increase in Fiscal Year (FY) 2021-22 when CDCR projects court commitments to return to pre-pandemic levels. Prior to this, court commitments are expected to remain at reduced levels, which, in addition to expedited releases taking place, contribute to the earlier decline. As court commitments resume, the population will see an increase, though not to the level it had been pre-COVID-19. After a peak, CDCR anticipates the population to return to its previous decreasing pattern related to recent policy reforms (such as Proposition 57-related credit earning opportunities) as well as new credit earning changes planned in 2021.
The institution population on June 30, 2020 was 113,403, 7.9 percent lower than expected in the Spring 2020 Projections. The Fall 2020 institution projections range from 8.5 to 23.7 percent lower than the Spring 2020 projections each year.
Adult Parole Projections
CDCR predicts the parole population will decrease throughout the projections cycle due primarily to changes made as part of the Fiscal Year 2020-21 Budget7 that shorten the maximum length of parole for most offenders, and allow for review for possible discharge from parole after 12 months.
3 The Fall 2020 projections do not incorporate any assumptions about court commitments that are currently unprocessed due to court closures and may create a temporary increase in the future. As additional data become available, future projections may include such an adjustment. 4 More information about expedited releases is available at https://www.cdcr.ca.gov/covid19/frequently-asked-questions-expedited-releases/. 5 More information about Positive Programming Credits is available at https://www.cdcr.ca.gov/covid19/memo-positive-programming-credits/. 6 More information about these changes may be found in Appendix B of this report. 7 More information about these changes may be found in Appendix B of this report.

Fall 2020 Population Projections
vii
The parole population of 53,427 parolees on June 30, 2020 is expected to decrease to 49,003 parolees by June 30, 2021. The parole population is then expected to decrease reaching 38,239 parolees by June 30, 2025, a net five-year decrease of 28.4 percent or 15,188 parolees.
Juvenile Projections
CDCR predicts the total juvenile average daily population will exhibit an 8.9 percent increase from June 2020 to June 2021 to reach 834 youth, then decrease by 29.4 percent to reach 589 youth by June 2022. The projected growth in the juvenile population accounts for the continuing impact of Proposition 57 The subsequent decline reflects the planned realignment of the youth currently supervised by the Division of Juvenile Justice (DJJ) to local systems, a result of changes made in the State Budget for FY 2020-21.8 As a result of these changes, commitments to DJJ will end July 31, 2021; however, due to the DJJ delivery process, the Fall 2020 Projections assume youth will continue to arrive through September 2021 and youth received at DJJ through this point will remain there to finish their terms.
8 Reflected in statutory changes Chapter 337, Statutes of 2020, (SB 823).

Fall 2020 Population Projections
1
CALIFORNIA DEPARTMENT OF CORRECTIONS AND REHABILITATION FALL 2020 POPULATION PROJECTIONS
1 Introduction
This report presents the California Department of Corrections and Rehabilitation’s (CDCR) Fall 2020 adult institution, parole, and juvenile institution population projections. CDCR developed these projections using historical trend data, time series and simulation modeling techniques. The population projections methodology is described in Appendix A. The projections incorporate the effects of existing laws and regulations on the state institution and parole populations. Unless otherwise noted, the projections do not include the impact of proposed legislation, programs, propositions, or policy changes that have not been signed, affirmed, or implemented as of June 30, 2020.
1.1 Changes for Fall 2020 Population Projections
The Fall 2020 Projections include the impact of actions CDCR implemented as a response to COVID-19 and the effect of several new policy changes on both the parole and institution populations.1 The full impact of COVID-19 and recent policy changes on CDCR’s populations are still developing. Due to the extraordinary circumstances surrounding the Fall 2020 projections, the authors of this report suggest using extreme caution when interpreting these projection results including the following figures, and tables.
In March 2020, CDCR halted the transfer of court commitments into the state’s institutions and youth correctional facilities. There was a brief reopening in May 2020, and that was followed by a gradual resumption since August 2020.2 In November 2020 intake was halted again, and CDCR will continue to assess and adjust the intake of court commitments based on the continuing impacts of COVID-19. Between April and June 2020, CDCR received approximately 95 percent fewer individuals compared to the same time period in 2019 (221 compared to 8,997). Commitments will remain at lower levels for several months before increasing to approximately half of the pre-pandemic levels by June 2021 and returning to pre-pandemic levels near the end of calendar year 2021.3 Additional information about court commitments is included in Section 3.
In July 2020, CDCR announced further actions to reduce the institution population in response to COVID-19, including identifying cohorts to screen for expedited release. CDCR also granted a one-time credit of 12 weeks to inmates eligible as of July 9, 2020.
1 Additional detail about the changes for Fall 2020 may be found in Appendix B. 2 More information about transfers to CDCR from county jail during the COVID-19 pandemic is available at https://www.cdcr.ca.gov/covid19/covid-19-response-efforts/#CJI. 3 The Fall 2020 projections do not incorporate any assumptions about court commitments that are currently unprocessed due to court closures and may create a temporary increase in the future. As additional data become available, future projections may include such an adjustment.

Fall 2020 Population Projections
2
The Fall 2020 Population Projections also include planned increases to credit earning for certain offenders to be implemented starting in January 2021. These changes will advance offenders’ release dates and provide greater incentives for offenders to engage in good conduct, and the changes will result in a decrease in the institution population. Another change involves decreasing the time spent in Reception Centers. Beginning in September 2020, the average time spent in Reception Centers may decrease from 90 to 120 days to approximately 30 days. The change will result in population decreases in Reception Centers and will allow offenders to begin earning enhanced good conduct credits earlier as these credits are not earned while offenders are pending classification in the Reception Center.4 Due to current transfer restrictions in place surrounding the COVID-19 pandemic, the Fall 2020 Projections assume that the Reception Center process may take up to 60 days to complete through calendar year 2021.
The Fall 2020 Projections also include a change that shortens the maximum length of parole for most offenders and allows for review for possible discharge from parole after 12 months.
Finally, these projections include a change to realign the Division of Juvenile Justice to local systems. As a result of the change, commitments to DJJ will end July 31, 2021; and youth received at DJJ through that point will remain there to finish their terms.
4 Due to current transfer restrictions in place surrounding the COVID-19 pandemic, it is assumed that the Reception Center process may take up to 60 days to complete through calendar year 2021.

Fall 2020 Population Projections
3
2 Adult Population Projections
CDCR observed annual decreases in the institution population each June between the years 2011 and 2016, with the exception of 2014 (see Table 1). The declines were primarily due to the impacts of 2011 Realignment legislation, several court-ordered population reduction measures, and the effects of Proposition 47.5 Those decreases were outpaced by longer-term trends that caused growth in groups such as inmates convicted of violent offenses or sentenced to life institution terms, which contributed to a 2.0 percent (2,617 inmates) annual population increase from June 30, 2016 to June 30, 2017.
Table 1. Institution and Active Parole Population, June 30, 2011 through June 30, 2025
June 30 Female Male TotalPercent Change Total
Percent Change
Actual2011 9,565 152,804 162,369 N/A 90,813 N/A2012 6,471 128,852 135,323 -16.7% 69,435 -23.5%2013 5,995 127,019 133,014 -1.7% 51,300 -26.1%2014 6,306 129,294 135,600 1.9% 44,499 -13.3%2015 5,857 123,325 129,182 -4.7% 45,473 2.2%2016 5,769 122,874 128,643 -0.4% 43,814 -3.6%2017 5,971 125,289 131,260 2.0% 45,261 3.3%2018 5,906 123,511 129,417 -1.4% 47,370 4.7%2019 5,691 119,781 125,472 -3.0% 50,822 7.3%2020 4,721 108,682 113,403 -9.6% 53,427 5.1%
Projected2021 3,711 89,280 92,991 -18.0% 49,003 -8.3%2022 4,849 95,247 100,096 7.6% 41,914 -14.5%2023 5,113 102,466 107,579 7.5% 42,442 1.3%2024 4,734 99,715 104,449 -2.9% 38,130 -10.2%2025 4,864 95,934 100,798 -3.5% 38,239 0.3%
Institution Active Parole
5 Proposition 47 was passed by voter initiative in November 2014 and reduced penalties for most non-serious, non-violent property and drug crimes by mandating a misdemeanor instead of a felony sentence for certain crimes.

Fall 2020 Population Projections
4
Proposition 57-related changes began to impact the adult institution and parole populations in 2017, which has contributed to the current population decline. Proposition 57 and other recent policy changes contributed to a 3.0 percent annual decrease (3,945 inmates) in the total institution population from June 30, 2018 to June 30, 2019. Most recently, the institution population has been impacted by COVID-19. Beginning in March 2020, CDCR temporarily halted the intake of commitments into institutions and facilities and implemented policies that resulted in an increase in releases from institutions.6 The institution population declined 9.6 percent from June 30, 2019 to June 30, 2020 (125,472 to 113,403 inmates).
CDCR predicts the adult institution population will continue to decrease throughout the projections cycle, due to the continuing impact of Proposition 57 and other recent policy changes such as good conduct credits. Effective January 2021, CDCR will implement changes to good conduct credits. Based on the changes, a violent offender’s credit earning rate will increase from 20 percent to 33.3 percent. For non-violent second strikers in minimum custody, the credit earning rate will increase from 33.3 percent to 50 percent. These changes will advance offenders’ release dates by increasing the earning rate for second strikers in minimum custody. The institution population of 113,403 inmates on June 30, 2020 is expected to decrease 18.0 percent to 92,991 inmates by June 30, 2021 (see Table 1).
Following that decrease, annual increases for June 2022 and June 2023 ranging from 7.5 percent to 7.6 percent are projected, followed by decreases between 2.9 percent and 3.5 percent which will lead to an adult institution population of 100,798 inmates by June 30, 2025, for a net five-year decrease of 11.1 percent or 12,605 inmates.
The active parole population is projected to decrease and then stabilize around the fourth year of the projections cycle. The Fall 2020 Projections predict the active parole population will decrease 8.3 percent (4,424 parolees) from June 30, 2020 to June 30, 2021. The active parole population is projected to reach 38,239 parolees by June 30, 2025, a net five-year decrease of 28.4 percent or 15,188 parolees. The decrease is related primarily to recent changes that shorten the maximum length of parole for most offenders, and allow review and possible discharge from parole after 12 months.
2.1 Adult Total Institution Population Trends and Projections
The adult total institution population decreased each year between 2011 and 2013 (see Table 1 and Figure 1). The largest single-year percent decrease occurred after the implementation of Realignment legislation in October 2011, when the institution population decreased 16.7 percent or 27,046 inmates from June 30, 2011 to June 30, 2012 (162,369 to 135,323 inmates). The population continued to decrease the following year, reaching 133,014 inmates on June 30, 2013. However, after several years of decline, the population grew by 1.9 percent (2,586 inmates) to 135,600 inmates on June 30, 2014. Following that year of growth, the institution population decreased in the two subsequent years to
6 More information about expedited releases is available at https://www.cdcr.ca.gov/covid19/frequently-asked-questions-expedited-releases/.

Fall 2020 Population Projections
5
128,643 inmates on June 30, 2016 (a two-year decrease of 5.1 percent or 6,957 inmates). The decrease was primarily due to the impacts of several court-ordered population reduction measures and Proposition 47.
The adult institution population experienced another increase of 2.0 percent (2,617 inmates) from June 30, 2016 to June 30, 2017 (128,643 to 131,260 inmates). The previously mentioned court-ordered population reduction measures and the effects of Proposition 47 mainly impacted non-serious, non-violent, and non-sex-registrant offenders. The associated decreases were outpaced by long-term trends in groups such as offenders convicted of violent offenses and sentenced to life institution terms, who were mostly unaffected by the changes. A simultaneous increase in court commitments also contributed to the increase in the adult institution population. More recently, CDCR has observed a decrease in the institution population, primarily because of Proposition 57 and other recent policy changes. The adult institution population declined 1.4 percent (1,843 inmates) from 131,260 inmates on June 30, 2017 to 129,417 inmates on June 30, 2018. This was followed by a decrease of 3.0 percent (3,945 inmates) from 129,417 inmates on June 30, 2018 to 125,472 inmates on June 30, 2019. On June 30, 2020, the adult institution population decreased 9.6 percent to 113,403 (a decrease of 12,069 inmates from June 30, 2019). The decrease in the population is related to the impact on admissions and releases stemming from COVID-19 along with policy changes that resulted in more offenders being released early.
The institution population is projected to increase in FY 2021-22 when CDCR projects court commitments will return to pre-pandemic levels. In particular, the Fall 2020 Population Projections assume that court commitments will remain at lower levels for several months before increasing to approximately half of pre-pandemic levels by June 2021, and returning to pre-pandemic levels near the end of calendar year 2021.7 8 After a peak, CDCR anticipates the population to return to its previous decreasing pattern related to recent policy reforms (such as Proposition 57-related credit earning opportunities) as well as new changes planned in 2021.
A change to good conduct credit earning for certain offenders will be effective in January 2021, and changes to Reception Center processing beginning in September 2020 may reduce the time spent in the Reception Center from the historical average of 90 to 120 days to allow earlier opportunities for programming.9 The good conduct credit change and as well as the Reception Center change are expected to result in advancing offenders’ release dates, which will decrease the institution population.
7 The Fall 2020 projections do not incorporate any assumptions about court commitments that are currently unprocessed due to court closures and may create a temporary increase in the future. As additional data become available, future projections may include such an adjustment. 8 It should be noted that the Fall 2020 Court Commitment projections do not account for a possible future increase that might occur if a backlog of court cases is processed and individuals are sentenced to CDCR terms. Information necessary to estimate this is not currently available at this time. CDCR will continue to monitor trends and information and update projections as additional data become available. 9 More information about these changes may be found in Appendix B of this report.

Fall 2020 Population Projections
6
The institution population of 113,403 inmates on June 30, 2020 is expected to decrease to 92,991 inmates by June 30, 2021. The institution population is then expected to increase reaching 100,798 inmates by June 30, 2025, a net five-year decrease of 11.1 percent or 12,605 inmates.
The institution population is expected to decrease 18.0 percent to 92,991 inmates on June 30, 2021 (see Table 1 and Figure 1). The projected decrease is the largest percent change in a single year since Realignment. During Fiscal Years (FY) 2021-22 and FY 2022-23, CDCR expects the institution population to increase. By June 2022 and June 2023, the Fall 2020 Projections predicts the institution population will increase by 7,105 inmates (7.6 percent) to 100,096 inmates and by 7,483 inmates (7.5 percent) to 107,579 inmates, respectively. After these increases, CDCR expects to see decreases in the institution population by 2.9 percent by June 2024 and another 3.5 percent decrease by June 2025 as court commitments are expected to stabilize to historical levels for the remainder of the projection cycle.
Figure 1. Total Institution Population Trends and Projections, June 30, 2011 through June 30, 2025
162,369
135,323133,014
135,600
129,182 128,643
131,260
129,417
125,472
113,403
92,991
100,096
107,579
104,449100,798
90,000
100,000
110,000
120,000
130,000
140,000
150,000
160,000
170,000
2011 2012 2013 2014 2015 2016 2017 2018 2019 2020 2021 2022 2023 2024 2025
Actuals Fall 2020 Projections
Fall 2020 Population Projections
7
2.2 Adult Institution Population Trends and Projections by Gender
Male inmates comprise the majority of the adult institution population. As expected, male population trends are similar to the total institution population trends. Specifically, the male population decreased by 16.9 percent (25,785 inmates) from June 30, 2011 to June 30, 2013 (152,804 to 127,019 inmates; see Table 1 and Figure 2). Following that, the male population increased by 1.8 percent in the subsequent year (127,019 to 129,294 inmates). The male population decreased in the two years immediately following the passage of Proposition 47, dropping 4.6 percent (5,969 inmates) from 129,294 inmates on June 30, 2014 to 123,325 inmates on June 30, 2015 followed by a 0.4 percent decrease (451 inmates) to 122,874 inmates on June 30, 2016. CDCR observed a 2.0 percent increase (2,415 inmates) to 125,289 inmates on June 30, 2017. The male population decreased following the implementation of Proposition 57, falling to 123,511 inmates on June 30, 2018, a 1.4 percent decrease (1,778 inmates), followed by a 3.0 percent decrease (3,730 inmates) to 119,781 on June 30, 2019.
On June 30, 2020, the male population decreased by 9.3 percent to 108,682 inmates. The male institution population is projected to decrease to 89,280 by June 30, 2021 and then increase to 95,247 by June 30, 2022. This will be followed by an increase to 102,466 by June 30, 2023. After that, the population will decrease in June 2024 and June 2025. The Fall 2020 Projections predict the male population will decrease to 95,934 by June 30, 2025, a net five-year decrease of 11.7 percent or 12,748 inmates (see Table 1 and Figure 2).

Fall 2020 Population Projections
8
Figure 2. Male Population Trends and Projections, June 30, 2011 through June 30, 2025
152,804
128,852127,019
129,294
123,325 122,874
125,289
123,511
119,781
108,682
89,280
95,247
102,466
99,715
95,934
80,000
90,000
100,000
110,000
120,000
130,000
140,000
150,000
160,000
2011 2012 2013 2014 2015 2016 2017 2018 2019 2020 2021 2022 2023 2024 2025
Actuals Fall 2020 Projections
The female institution population decreased 37.3 percent between June 30, 2011 and June 30, 2013 (9,565 to 5,995 inmates; see Table 1 and Figure 3), which was a larger percent decrease than observed in the male population during the same time period. From June 30, 2013 to June 30, 2014, the female population increased by 5.2 percent (5,995 to 6,306 inmates). Similar to the male population, this was a reversal of several years of reduction, and it was a larger percent increase than observed in the male population. The female institution population decreased in the two subsequent years following the implementation of Proposition 47. CDCR observed a 7.1 percent decrease (449 inmates) in the female population to 5,857 inmates on June 30, 2015 and another 1.5 percent decrease (88 inmates) to 5,769 inmates on June 30, 2016. The female population increased by 3.5 percent (202 inmates) to 5,971 inmates on June 30, 2017. Following the introduction of Proposition 57, the female population experienced a decrease of 1.1 percent (65 inmates) to 5,906 inmates on June 30, 2018, followed by a 3.6 percent decrease (215 inmates) to 5,691 inmates on June 30, 2019.

Fall 2020 Population Projections
9
On June 30, 2020, the female population decreased by 17.0 percent to 4,721. The female population is expected to decrease in June 2021, followed by increases from June 2022 to June 2023 and then decline to 4,864 inmates on June 30, 2025, a net five-year increase of 3.0 percent or 143 inmates (see Table 1 and Figure 3).
Quarterly projections of the institution population by gender for FY 2020-21 and FY 2021-22 are available in Appendix D, Tables 15 and 16.
Figure 3. Female Population Trends and Projections, June 30, 2011 through June 30, 2025
9,565
6,471
5,995
6,306
5,857 5,769
5,971
5,9065,691
4,721
3,711
4,8495,113
4,734
4,864
3,000
4,000
5,000
6,000
7,000
8,000
9,000
10,000
11,000
2011 2012 2013 2014 2015 2016 2017 2018 2019 2020 2021 2022 2023 2024 2025
Actuals Fall 2020 Projections

Fall 2020 Population Projections
10
2.3 Comparison of Spring 2020 and Fall 2020 Total Institution Population Projections
On June 30, 2020, the total institution population was 113,403, 7.9 percent lower than expected in the Spring 2020 Projections. The Fall 2020 Projections predict a total institution population of 92,991 inmates on June 30, 2021, which is 23.7 percent or 28,805 inmates lower than the Spring 2020 Projections (see Table 2). After that, the two projections show variations up to 16.2 percent throughout the projections cycle.
The difference between the two projections is due to lower court commitments in Fall 2020 than projected in Spring 2020 and other new changes that were not included in the Spring 2020 Projections. The Fall 2020 Projections assume court commitments will remain at reduced levels for a time, then gradually resume to pre-pandemic levels by the end of 2021. As court commitments resume, the institution population will see an increase, though not to the level it had been pre-COVID-19.
Table 2. Comparison of Spring 2020 and Fall 2020 Total Institution Population Projections
June 30 Spring 2020 Fall 2020 DifferencePercent
Difference2020 123,133 *113,403 -9,730 -7.9%2021 121,796 92,991 -28,805 -23.7%2022 119,421 100,096 -19,325 -16.2%2023 117,589 107,579 -10,010 -8.5%2024 116,362 104,449 -11,913 -10.2%2025 N/A 100,798 N/A N/A
*Actual Population

Fall 2020 Population Projections
11
2.3.1 Comparison of Spring 2020 and Fall 2020 Total Institution Population Projections by Gender
As shown in Table 3, the difference in the male institution population between the Fall 2020 Projections and the Spring 2020 Projections reveals a smaller population. The male institution population is projected to reach 95,934 on June 30, 2025 (see Table 3).
The female institution population in the Fall 2020 Projections is lower throughout the projections cycle when compared to the Spring 2020 Projections. However, the Spring 2020 and Fall 2020 projections are similar for 2023. The female institution population is projected to reach 4,864 by June 30, 2025 (see Table 3).
Table 3. Comparison of Spring 2020 and Fall 2020 Total Institution Population Projections by Gender
June 30 Spring 2020 Fall 2020 DifferencePercent
Difference Spring 2020 Fall 2020 DifferencePercent
Difference2020 117,712 *108,682 -9,030 -7.7% 5,421 *4,721 -700 -12.9%2021 116,510 89,280 -27,230 -23.4% 5,286 3,711 -1,575 -29.8%2022 114,216 95,247 -18,969 -16.6% 5,205 4,849 -356 -6.8%2023 112,470 102,466 -10,004 -8.9% 5,119 5,113 -6 -0.1%2024 111,283 99,715 -11,568 -10.4% 5,079 4,734 -345 -6.8%2025 N/A 95,934 N/A N/A N/A 4,864 N/A N/A
*Actual Population
Male Female
Fall 2020 Population Projections
12
3 Court Commitments
The number of felon court commitments10 decreased 32.7 percent from FY 2010-11 and FY 2013-14 (57,747 to 38,853 commitments; see Table 4 and Figure 4). The largest single-year percent decrease of 32.5 percent occurred in FY 2011-12 (57,747 to 39,001 commitments), following the implementation of 2011 Realignment legislation. After two consecutive years of decrease between FY 2010-11 and FY 2012-13, court commitments experienced a 7.9 percent increase (2,856 commitments) in FY 2013-14 (35,997 to 38,853 commitments). Total court commitments then decreased 8.5 percent in FY 2014-15 (38,853 to 35,547 commitments), primarily due to the passage of Proposition 47. Felon court commitments increased by 0.3 percent in FY 2015-16 (35,547 to 35,637 commitments), then by 2.6 percent in FY 2016-17 (35,637 to 36,556 commitments). Following these two years of increases, court commitments decreased 1.0 percent in FY 2017-18 (36,556 to 36,204 commitments) and 3.5 percent in FY 2018-19 to 34,932 commitments, which was the lowest number of commitments received during a fiscal year in decades.
In response to COVID-19, CDCR temporarily halted the intake of court commitments into the state’s institutions. Consequently, court commitments decreased sharply for both males and females for FY 2019-20. After a brief reopening and subsequent closing in May 2020, admissions to CDCR resumed at limited levels in August 2020. In November 2020 intake was halted again, and CDCR will continue to assess and adjust the intake of court commitments based on the continuing impacts of COVID-19. Male court commitments decreased 29.2 percent for males (32,293 to 22,852 commitments) and 28.4 percent for females (2,639 to 1,890 commitments). The Fall 2020 Projections assume that court commitments will remain low for several months before increasing to pre-pandemic levels near the end of calendar year 2021. Specifically, felon court commitments to state institution are predicted to decrease by 62.5 percent (15,459 commitments) in FY 2020-21, followed by an increase of 220.3 percent (20,451 commitments) in FY 2021-22 before stabilizing for the remainder of the projection cycle (see Table 4 and Figure 4).11
Detailed tables showing actual and projected rates of court commitments are shown in Appendix D, Tables 9 through 14.
10 Felon court commitments are a major factor in population growth or decline. Increasing court commitments generally lead to population growth, and decreasing court commitments generally lead to population decline. These general patterns may be counterbalanced by other factors; such as changes in length of stay. 11 The Fall 2020 projections do not incorporate any assumptions about court commitments that are currently unprocessed due to court closures and may create a temporary increase in the future. As additional data become available, future projections may include such an adjustment.

Fall 2020 Population Projections
13
Table 4. Felon Court Commitments and Projections by Gender, Fiscal Years 2010-11 through 2024-25
Fiscal Year MalePercent of
TotalPercent Change Female
Percent of Total
Percent Change Total
Percent Change
Actual2010-11 51,306 88.8% N/A 6,441 11.2% N/A 57,747 N/A2011-12 35,855 91.9% -30.1% 3,146 8.1% -51.2% 39,001 -32.5%2012-13 33,660 93.5% -6.1% 2,337 6.5% -25.7% 35,997 -7.7%2013-14 36,085 92.9% 7.2% 2,768 7.1% 18.4% 38,853 7.9%2014-15 33,080 93.1% -8.3% 2,467 6.9% -10.9% 35,547 -8.5%2015-16 33,263 93.3% 0.6% 2,374 6.7% -3.8% 35,637 0.3%2016-17 33,958 92.9% 2.1% 2,598 7.1% 9.4% 36,556 2.6%2017-18 33,526 92.6% -1.3% 2,678 7.4% 3.1% 36,204 -1.0%2018-19 32,293 92.4% -3.7% 2,639 7.6% -1.5% 34,932 -3.5%2019-20 22,852 92.4% -29.2% 1,890 7.6% -28.4% 24,742 -29.2%
Projected2020-21 8,835 95.2% -61.3% 448 4.8% -76.3% 9,283 -62.5%2021-22 27,415 92.2% 210.3% 2,319 7.8% 417.6% 29,734 220.3%2022-23 31,445 92.2% 14.7% 2,651 7.8% 14.3% 34,096 14.7%2023-24 31,435 92.1% 0.0% 2,686 7.9% 1.3% 34,121 0.1%2024-25 31,425 92.0% 0.0% 2,726 8.0% 1.5% 34,151 0.1%
Commitments

Fall 2020 Population Projections
14
Figure 4. Felon Court Commitments and Projections, Fiscal Years 2010-11 through 2024-25
57,747
39,001
35,997
38,853
35,547
35,637 36,556
36,204
34,932
24,742
9,283
29,734
34,096 34,121 34,151
5,000
15,000
25,000
35,000
45,000
55,000
65,000
2010
-201
1
2011
-201
2
2012
-201
3
2013
-201
4
2014
-201
5
2015
-201
6
2016
-201
7
2017
-201
8
2018
-201
9
2019
-202
0
2020
-202
1
2021
-202
2
2022
-202
3
2023
-202
4
2024
-202
5
Actuals Fall 2020 Projections

Fall 2020 Population Projections
15
3.1 Felon Court Commitment Trends and Projections by Gender
CDCR observed a 29.2 percent decrease (9,441 commitments) during FY 2019-20 in male felon court commitments compared to the preceding fiscal year. Male felon court commitments are projected to decrease by 61.3 percent in FY 2020-21. This is projected to be followed by a 210.3 percent increase in FY 2021-22 (see Table 4 and Figure 5).
The Fall 2020 Projections predict female court commitments will decrease by 76.3 percent in FY 2020- 21. After this initial decrease, female court commitments are projected to increase each year of the projections cycle, which is similar to the male court commitments with the exception of FY 2023-24 and FY 2024-25 (see Table 4 and Figure 5).
Figure 5. Felon Court Commitment Trends and Projections by Gender, Fiscal Years 2010-11 through 2024-25
51,306
35,85533,660
36,085
33,080
33,263 33,958
33,52632,293
22,852
8,835
27,415
31,445
31,435
31,425
6,441
3,146 2,337 2,768 2,467 2,374 2,598 2,678 2,639 1,890448
2,319 2,651 2,686 2,726
0
5,000
10,000
15,000
20,000
25,000
30,000
35,000
40,000
45,000
50,000
55,000
2010
-201
1
2011
-201
2
2012
-201
3
2013
-201
4
2014
-201
5
2015
-201
6
2016
-201
7
2017
-201
8
2018
-201
9
2019
-202
0
2020
-202
1
2021
-202
2
2022
-202
3
2023
-202
4
2024
-202
5
Male Actuals Male: Fall 2020 Projections Female Actuals Female: Fall 2020 Projections

Fall 2020 Population Projections
16
3.2 Felon Second Strike Court Commitment Trends and Projections
The number of felon Second Strike court commitments increased 20.6 percent from FY 2010-11 to FY 2012-13 (7,551 to 9,103 Second Strike commitments; see Figure 6). During the two years after the implementation of the 2011 Realignment legislation, Second Strike court commitments increased to an all-time high, reaching 10,376 in FY 2013-14. However, following the passage of Proposition 47, Second Strike commitments decreased 13.7 percent down to 8,959 commitments in FY 2015-16. Following these two years of decrease, Second Strike commitments increased 8.7 percent (8,959 to 9,738 commitments) from FY 2015-16 to FY 2016-17, which was a larger percentage increase than observed in total court commitments. Similar to total felon court commitments, Second Strike court commitments decreased 3.5 percent (342 commitments) from FY 2016-17 to FY 2017-18 and 6.2 percent (580 commitments) from FY 2017-18 to FY 2018-19.
For FY 2019-20, Second Strike court commitments decreased 29.3 percent to 6,236. Following the overall trend of total felon court commitments, the Fall 2020 Projections predict a steep decrease for FY 2020-21 down to 2,129 followed by increases over the projections cycle to 8,609 in FY 2024-25.
Figure 6. Actual and Projected Second Strike Court Commitments, Fiscal Years 2010-11 through 2024-25
7,551
7,558
9,103
10,376
9,134 8,959
9,738
9,396
8,816
6,236
2,129
7,491
8,600 8,603 8,609
1,000
2,000
3,000
4,000
5,000
6,000
7,000
8,000
9,000
10,000
11,000
2010
-201
1
2011
-201
2
2012
-201
3
2013
-201
4
2014
-201
5
2015
-201
6
2016
-201
7
2017
-201
8
2018
-201
9
2019
-202
0
2020
-202
1
2021
-202
2
2022
-202
3
2023
-202
4
2024
-202
5
Actuals Fall 2020 Projections

Fall 2020 Population Projections
17
4 Male Inmate Placement Needs
Table 5 presents the Fall 2020 male institution population by housing level, based on historical trends. CDCR’s Reception Center population was 4,250 inmates on June 30, 2020, a decrease from historical levels, which was driven by the halt of intake to CDCR from county jails. CDCR predicts Reception Center needs will initially decrease in June 2021 and then increase to remain relatively stable in subsequent years, increasing to 7,808 inmates by June 30, 2025, which is also a lower than historical level and reflects the change starting in September 2020 to reduce the time spent in Reception Centers.12
Of inmates requiring housing in Security Levels I through IV, CDCR predicts a decrease from historical levels throughout the projection cycle due to the continuing impact of Proposition 57 and the recent policy changes and actions made in response to COVID-19, however, the full impact in the later years will require further study as more information becomes available. Level II inmates are expected to encompass the largest proportion of the male population, while Level I inmates are expected to represent the smallest proportion throughout the projections cycle.
Identifying and understanding the full effect of COVID-19 and other recent policy changes on CDCR’s populations by housing level may take some time. Due to the extraordinary circumstances that may potentially impact the Fall 2020 projections, the authors of this report suggest using extreme caution when interpreting these projections. The projections are likely to be refined as we obtain further information and will be reevaluated in Spring 2021.
Quarterly housing level projections through June 30, 2022, and annual housing level projections through June 30, 2025 are available in Appendix D, Tables 17 and 18.
Table 5. Male Institution Population Projections by Housing Level, June 30, 2020 through June 30, 2025
Reception Center Level I Level II Level III Level IV PHU SHU
Total Male
2020 (Actual) 4,250 11,941 45,706 19,821 26,118 6 840 108,6822021 3,906 10,146 38,209 15,267 20,926 6 820 89,2802022 7,716 11,659 38,540 15,399 21,107 6 820 95,2472023 7,749 12,543 41,777 16,692 22,879 6 820 102,4662024 7,870 12,200 40,478 16,173 22,168 6 820 99,7152025 7,808 11,712 38,819 15,510 21,259 6 820 95,934
June 30
Security Level
12 More information on this change is available in Appendix B.

Fall 2020 Population Projections
18
5 Parole Population
5.1 Active Parole Population Trends and Projections
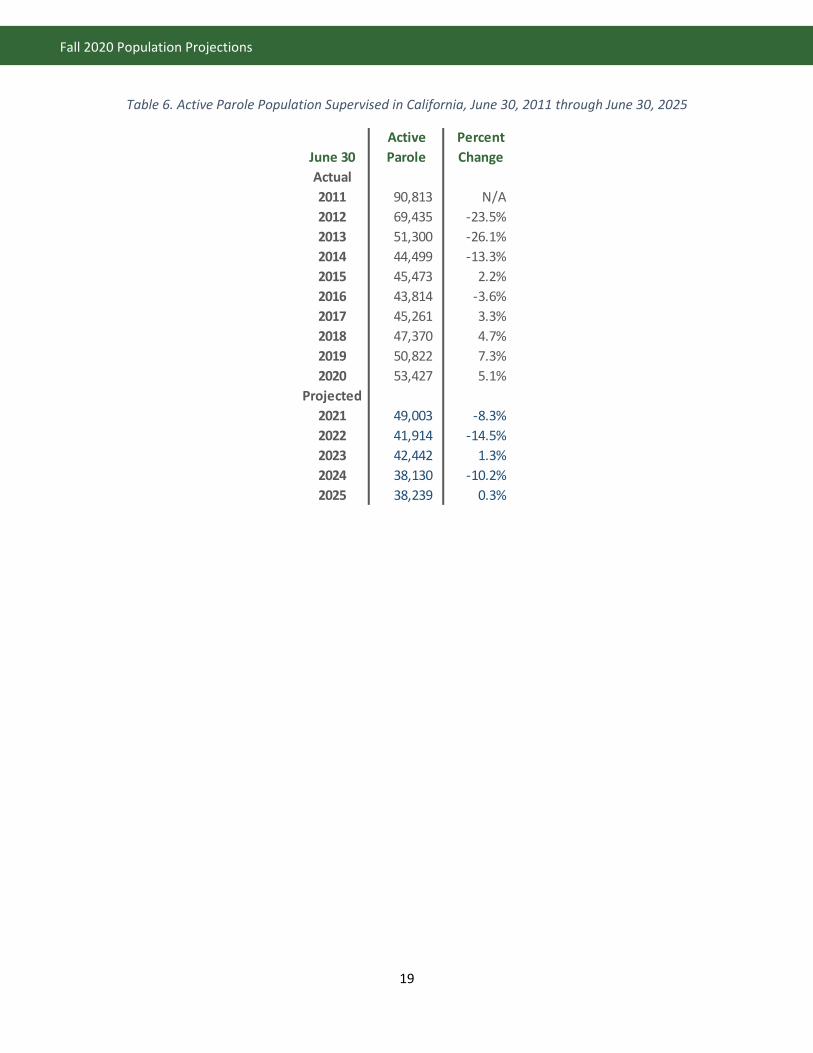
The population of active parolees supervised in California decreased by 51.0 percent between 2011 and 2014 (90,813 to 44,499 parolees; see Table 6 and Figure 7). The largest single-year percent decrease of 26.1 percent occurred between June 30, 2012 and June 30, 2013 (69,435 to 51,300 parolees) and coincided with the implementation of 2011 Realignment legislation. Following four years of decline, the parole population increased 2.2 percent from June 30, 2014 to June 30, 2015 (44,499 to 45,473 parolees). This change was driven by the effects of Proposition 47, which resulted in approximately 4,700 offenders being resentenced and released from the institution. Most resentenced offenders subsequently served a one-year parole period.13 A short-term 3.6 percent decrease (1,659 parolees) was observed between June 30, 2015 and June 30, 2016 (45,473 to 43,814 parolees) as Proposition 47 parolees were discharged from parole.
The active parole population grew by 3.3 percent from June 30, 2016 to June 30, 2017 (43,814 to 45,261 parolees). This was followed by a 4.7 percent increase from June 30, 2017 to June 30, 2018 (45,261 parolees to 47,370 parolees), and a 7.3 percent increase from June 30, 2018 to June 30, 2019 (47,370 parolees to 50,822 parolees). From June 30, 2019 to June 30, 2020, the population increased 5.1 percent (50,822 parolees to 53,427 parolees). In more recent years, the parole population saw increases related to a growing number of parolees who served life institution terms and were consequently expected to serve long lengths of stay on parole, as well as an increased number of releases from the institutions due to the impacts of Proposition 57 and other recent policy changes.
CDCR projects the active parole population will experience a decrease of 8.3 percent (4,424 parolees) from June 30, 2020 to June 30, 2021 (53,427 parolees to 49,003 parolees). The decrease will accelerate as the parole population is expected to decline to 41,914 by June 30, 2022 (a decrease of 14.5 percent) and will further decrease in June 2024 with a slight increase in June 2025. This anticipated decrease is related to the impact of changes to earned discharge and parole cap that started in July 2020. The change allows offenders released to parole on or after July 1, 2020 to serve a maximum two-year parole period as long as they are non-sex registrant determinately sentenced parolees. The cap is three years for those with an indeterminate sentence.
Quarterly projections of the active parole population through June 2022 are available in Appendix D, Tables 19 and 20.
13 In addition to the impact of resentencing while in CDCR institution, offenders may also be resentenced while serving time in county jail or under other county-level supervision and subsequently placed on state parole supervision under Proposition 47 (court walkovers).
Fall 2020 Population Projections
19
Table 6. Active Parole Population Supervised in California, June 30, 2011 through June 30, 2025
June 30 Active Parole
Percent Change
Actual2011 90,813 N/A2012 69,435 -23.5%2013 51,300 -26.1%2014 44,499 -13.3%2015 45,473 2.2%2016 43,814 -3.6%2017 45,261 3.3%2018 47,370 4.7%2019 50,822 7.3%2020 53,427 5.1%
Projected2021 49,003 -8.3%2022 41,914 -14.5%2023 42,442 1.3%2024 38,130 -10.2%2025 38,239 0.3%

Fall 2020 Population Projections
20
Figure 7. Active Parole Population Trends and Projections, June 30, 2011 through June 30, 2025
90,813
69,435
51,300
44,499
45,473
43,814 45,261
47,370
50,82253,427
49,003
41,914
42,442
38,130
38,239
30,000
40,000
50,000
60,000
70,000
80,000
90,000
100,000
2011 2012 2013 2014 2015 2016 2017 2018 2019 2020 2021 2022 2023 2024 2025
Actuals Fall 2020 Projections
Fall 2020 Population Projections
21
5.2 Comparison of Spring 2020 and Fall 2020 Active Parole Population Projections
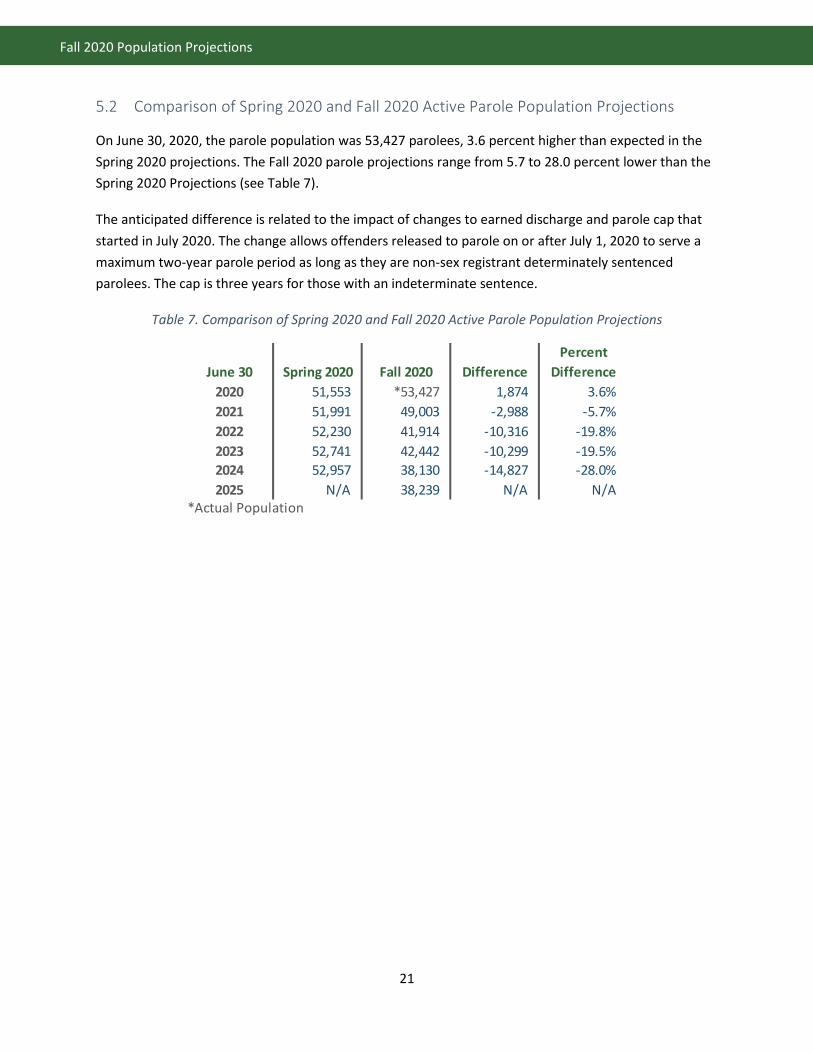
On June 30, 2020, the parole population was 53,427 parolees, 3.6 percent higher than expected in the Spring 2020 projections. The Fall 2020 parole projections range from 5.7 to 28.0 percent lower than the Spring 2020 Projections (see Table 7).
The anticipated difference is related to the impact of changes to earned discharge and parole cap that started in July 2020. The change allows offenders released to parole on or after July 1, 2020 to serve a maximum two-year parole period as long as they are non-sex registrant determinately sentenced parolees. The cap is three years for those with an indeterminate sentence.
Table 7. Comparison of Spring 2020 and Fall 2020 Active Parole Population Projections
June 30 Spring 2020 Fall 2020 DifferencePercent
Difference2020 51,553 *53,427 1,874 3.6%2021 51,991 49,003 -2,988 -5.7%2022 52,230 41,914 -10,316 -19.8%2023 52,741 42,442 -10,299 -19.5%2024 52,957 38,130 -14,827 -28.0%2025 N/A 38,239 N/A N/A
*Actual Population

Fall 2020 Population Projections
22
6 Juvenile Population Projections
Between June 2011 and June 2018, the total juvenile population decreased 48.9 percent, from a June average daily population (ADP) of 1,238 to 633 youth (see Table 8). The total juvenile population increased from June 2018 to June 2019 by 13.3 percent (84 youth). Male youth consistently make up the majority of the juvenile population. Specifically, the male juvenile June ADP decreased 49.2 percent from 1,196 to 608 youth from 2011 to 2018 then increased by 13.3 percent (81 youth) from 2018 to 2019. In 2020, the male population increased by 6.8 percent to 736 youth compared to 689 in 2019. The female juvenile June ADP decreased 40.1 percent from 42 to 25 youth from 2011 to 2018 then increased by 12.0 percent (3 youth) from 2018 to 2019. In 2020, the female population increased by 7.1 percent to 30 youth in 2020 compared to 28 youth in 2019.
CDCR predicts the total juvenile June ADP will experience an 8.9 percent (68 youth) increase to reach 834 youth by June 2021, and then decrease 29.4 percent to reach 589 youth by June 2022. The projected growth in the juvenile population is a result of the continuing impact of Proposition 57. Additionally, the projected decline in 2022 reflects anticipated changes as the Division of Juvenile Justice is realigned to local systems. As a result of the change, commitments to DJJ will end July 31, 2021, and youth received at DJJ through that point will remain there to finish their terms. More information about this change is included in Appendix B.
Table 8. Juvenile Average Daily Population and Projected Average Daily Population, June 2011 through June 2022
June Male Female TotalActual2011 1,196 42 1,2382012 934 26 9602013 709 26 7352014 665 23 6882015 665 25 6902016 678 26 7052017 613 21 6342018 608 25 6332019 689 28 7172020 736 30 766
Projected2021 806 28 8342022 565 24 589
Fall 2020 Population Projections
23
Appendix A – Methodology, Technical Notes, and Limitations
Methodology and Technical Notes
Most corrections population experts agree that projections beyond two- to three-year time horizons are difficult to model with precision.14 Due to the need to prepare longer-term projections for planning purposes, this report presents up to five years of projections for some populations. CDCR’s Office of Research uses the most current data available to produce its population projections. Routine database updates may cause some reported values to differ from previously reported values.
The adult population projections were developed using historical trend data and a simulation model that projects individual offender movements for the population in custody at the start of the projections and projected future court commitments. The model forecasts anticipated changes in housing levels over the incarceration period and releases from the institution to parole or county post release community supervision. The timing of the projected actions is based on trend data entered into the model.
Juvenile population projections were developed using historical trend data and time series forecasting techniques. Juvenile forecasts were constructed based on weekly average daily populations of all juvenile facilities and juvenile offenders who are the responsibility of DJJ but not physically housed in a DJJ facility. The juvenile population, however, does not include juveniles housed in adult institutions or juveniles under county supervision in accordance with Assembly Bill (AB) 1628.15
Beginning with the Spring 2014 Population Projections, the active parole population excludes parolees on non-revocable parole. Parole population values reported in earlier reports included parolees on non-revocable parole.
Beginning with the Fall 2015 Projections, CDCR adopted a new court commitment forecasting procedure that relies solely on data observed after the implementation of 2011 Realignment legislation (October 2011) for determinately sentenced offenders. This approach was employed because sufficient data became available at that point to conduct robust analyses of the predictive power of pre-Realignment compared to post-Realignment data. These analyses have revealed predictions using only data collected after the implementation period are more accurate than predictions using both pre-and post-Realignment commitment data.
Additionally, beginning with the Fall 2015 Projections, CDCR utilized offender classification data collected in the Strategic Offender Management System (SOMS). This change resulted in shifts of projected housing placement needs compared to past projections, primarily in housing Levels II and III. The deployment of SOMS in 2013 coincided with a revised classification scoring structure that changed
14 See Limitations below. 15 More information on AB 1628 is available in Appendix B.

Fall 2020 Population Projections
24
the cut points for determining housing placements.16 As inmates were rescored under the new classification structure, there was a data entry lag for some offender information into the legacy Inmate Classification Scoring System. The SOMS data provide a more complete and accurate account of current offender placement needs.
Beginning with the Spring 2016 Projections, the adult institution population includes offenders in alternative custody and community re-entry programs, as well as offenders on medical parole. CDCR made this change to create a more comprehensive view of the adult offender population serving an institution term. The authors of this report recommend exercising caution when comparing projections published in past reports.
The California population data used to calculate the commitment rates to an institution are based on demographic data obtained from the California Department of Finance.17 These population data are provided for calendar year midpoints (July 1). For the purposes of this report, data for two points in time were averaged to afford a closer fit to the state fiscal year.
Limitations
Although CDCR’s population projections are designed to be as accurate as possible, it is difficult to model projections beyond a two- to three-year time horizon with precision. Nevertheless, this report provides up to five years of projections for some populations.
The full impact of COVID-19 and recent policy changes on CDCR’s populations are still developing, and due to the extraordinary circumstances surrounding the Fall 2020 projections, the authors of this report suggest using extreme caution when interpreting these projection results.
16 A summary of the findings by the related study is available at: https://www.cdcr.ca.gov/news/2012/03/09/new-study-makes-recommendations-for-cdcrs-inmate-classification-score-system 17 State of California, Department of Finance, Report P-3: State and County Population Projections by Race/Ethnicity, Detailed Age, and Gender, 2010-2060, Sacramento, California, January 2020.

Fall 2020 Population Projections
25
Appendix B – Significant Chaptered Legislation, Initiatives, and Policy Changes18
Adults
Legislation
Chapter 590, Statutes of 2019, [Senate Bill (SB) SB 136]
Signed by Governor and chaptered on October 8, 2019. Removed from law a one-year enhancement for prior non-violent institution terms. The estimated impact of this legislation is factored into the Population Projections with an assumed effective date of January 1, 2020.
Chapter 577, Statutes of 2019, [Assembly Bill (AB) 965]
Signed by Governor and chaptered on October 8, 2019. Allows Educational Merit Credits to be applied to an offender’s Youth Eligibility Parole Date. The estimated impact of this legislation is factored into the Population Projections with an assumed effective date of January 1, 2020.
Chapter 471, Statutes of 2015, (SB 261)
Required the Board of Parole Hearings (BPH) to conduct youth offender parole hearings to consider release of offenders who committed specified crimes when they were under 23 years of age and who were sentenced to state institution. The impact of this legislation is factored into the Population Projections to the extent the impact is in trend.
Initiatives
Proposition 57 – Public Safety and Rehabilitation Act of 2016.
The proposition 1) increased the number of non-violent offenders eligible for parole consideration and allowed parole consideration after serving the full term of the sentence for their primary offense; 2) authorized CDCR to award sentence credits for rehabilitation, good behavior, or educational achievements; and 3) provided juvenile court judges authority to decide whether juveniles age 14 and older should be sentenced as adults for specified offenses. This proposition was passed into law on November 8, 2016, and is factored into the Population Projections.
Proposition 47 – Criminal Sentences, Misdemeanor Penalties, Initiative Statute.
Required misdemeanor instead of felony sentence for certain drug possession offenses. Required misdemeanor instead of felony sentence for the following crimes when amount involved is $950 or less:
18 Information about Significant Legislation, Initiatives, and Policy Changes implemented prior to 2014 may be found in earlier population projections reports available at https://www.cdcr.ca.gov/research/population-reports.

Fall 2020 Population Projections
26
petty theft, receiving stolen property, and forging/writing bad checks. Allowed felony sentence for these offenses if a person has had previous conviction for crimes such as rape, murder, or child molestation or is a registered sex offender. Required resentencing for persons serving felony sentences for these offenses unless court finds unreasonable public safety risk.
The proposition resulted in fewer commitments to state institution from court. The Proposition 47-related decreases in the institution population includes the effect of resentencing avoided court commitments. The impact of avoided court commitments is assumed to continue indefinitely. This proposition was passed into law on November 4, 2014, and is factored into the Population Projections.
Policy Changes
Change in Credit Earning for Violent Offenders and Non-Violent Second Strikers in Minimum Custody
The projections assume CDCR will implement changes to good conduct credits with a planned effective date of January 2021. Specifically, the projections assume violent offenders’ credit earning rates will increase from 20 percent to 33.3 percent. For non-violent second strikers, the projections assume credit earning rates will increase from 33.3 percent to 50 percent for those in minimum custody. These changes will advance the offender’s release dates and provide greater incentives for offenders to engage in good conduct. The policy will result in a decrease in the institution population.
The estimated impact of is factored into the Population Projections with an assumed effective date of January 1, 2021.
Reduced Time in Reception Center
Effective September 2020, CDCR implemented changes to the Reception Center process that may shorten the time in the Reception Center from historical levels of 90 to 120 days to 30 days. However, due to current transfer restrictions in place surrounding the COVID-19 pandemic, the Fall 2020 Projections assume that the Reception Center process may take up to 60 days to complete through calendar year 2021. Shorter time in Reception Centers would result in population decreases in Reception Centers and would allow offenders to begin earning enhanced good conduct credits faster as these credits are not earned while offenders are pending classification in the Reception Center.
The estimated impact of this change is factored into the Population Projections with an assumed effective date of September 1, 2020, and additionally incorporates an assumption that the process may take up to 60 days process through the end of the 2021 calendar year.

Fall 2020 Population Projections
27
Changes to Lengths of Parole Terms and Earned Discharge Process
A change made in the Fiscal Year 2020-21 Budget process19 allows offenders released to parole on or after July 1, 2020 to serve a maximum two-year parole period as long as they are non-sex registrant determinately sentenced parolees. A three-year cap would apply to parolees who were indeterminately sentenced. Additionally, the changes would require the Division of Adult Parole Operations to review parolees for possible discharge no later than 12 months after release from prison.
Additionally, parolees who started their parole period prior to July 1, 2020 would be reviewed for discharge under an updated discharge review policy.
The estimated impact of this change is factored into the Population Projections with an assumed effective date of July 1, 2020.
Actions to Reduce Population and Maximize Space in response to COVID-19:
CDCR expedited the release of incarcerated persons serving a sentence for non-violent offenses, who do not have to register as a sex offender and had 60 days or less to serve in April 2020.
In July 2020 CDCR announced an additional series of release actions in an effort to further decompress the population to maximize space for physical distancing, and isolation/quarantine efforts.20
CDCR implemented a one-time Positive Programming Credit that provided 12 weeks of credit to eligible offenders as of July 9, 2020, who did not have any serious rule violations between March 1 and July 5, 2020.21
The impacts of these actions are factored into the Population Projections.
Supplemental Reforms to Credit Earning
Implemented to enhance the credits made available under Proposition 57. These policy changes became operationally effective in May 2019.
Rehabilitative Achievement Credit: Prospectively increased credit earning from 7 days to 10 days per 52 hours of participation, up to maximum of 40 days of credit per year.
19 Reflected in statutory changes Chapter 29, Statutes of 2020, (SB 118). 20 More information about expedited releases is available at https://www.cdcr.ca.gov/covid19/frequently-asked-questions-expedited-releases/. 21 More information about Positive Programming Credits is available at https://www.cdcr.ca.gov/covid19/memo-positive-programming-credits/.

Fall 2020 Population Projections
28
Educational Merit Credit: Increased credit earning from 90 days to 180 days for General Equivalency Diplomas (GED), High School Diploma, or equivalent.
Changes to 60-day release restriction for certain offenders unless otherwise required by statute.
Parole Determination Process for Indeterminately-sentenced Non-violent Offenders
Created a process for certain indeterminately-sentenced non-violent offenders to be reviewed for parole consideration by BPH after serving the full term of their primary offense effective January 2019.
Automatic Restoration of Forfeited Credits
Effective on April 3, 2019, California Code of Regulations, Title 15, section 3329.5 allows for Good Conduct Credits forfeited by Rules Violation Reports (RVR) to be automatically restored. Previously, offenders were required to apply for restoration once eligible. This change is expected to result in an increase in restored credits, and a consequent decrease in length of stay for impacted offenders. However, the impact of the change was not able to be quantified and is not included in the population projections.
Penal Code Section 1170(d) Recall and Resentencing Changes
Changed Penal Code section 1170(d) authorizing the resentencing of an offender to a lesser sentence under certain circumstances. These changes were made as part of the FY 2018-19 Budget.
Court-ordered Measures Subsequently Enacted with the Implementation of Proposition 57
CDCR implemented the following policies and programs subsequently enacted with the implementation of Proposition 57. The impact is assumed to continue indefinitely and is factored into the Population Projections.
Credit-earning change for specific offenders: Prospectively increased credit earning for non-violent, non-sex-registrant Second Strike offenders from 20 percent to 33.3 percent, and allowed these offenders to earn milestone credits for rehabilitative programs. This policy became operationally effective in February 2014. Prospectively increased credit earning for all offenders designated Minimum Custody who were eligible to earn day-for-day (50 percent) credits to two days of credit for each day served (2-for-1). This policy became effective by court order on January 1, 2015.
Parole determination process for certain Second-Strike offenders: Created a process for certain non-violent, non-sex-registrant Second Strike offenders to be reviewed for parole consideration by BPH once 50 percent of their sentence has been served. This policy became effective by court order on January 1, 2015.

Fall 2020 Population Projections
29
Utilization of Administrative Determinants and Increased Access to Rehabilitative Programs
The California Code of Regulations, Title 15, sections 3375 and 3375.2, allowed for the placement of offenders in facilities with higher or lower security levels than indicated by offender placement scores. In order to expand access to rehabilitative programs for offenders who have demonstrated positive programming, CDCR clarified its application of these regulations in July 2016. This policy change is factored into the Population Projections and is expected to result in an overall decreased need for male Level IV housing and a corresponding net increased need for male Level II and III housing.
Segregated Housing
Effective in June 2015, the regulations provided for shorter segregated housing unit stays based on offender behavior and reduced the number of offenses that may result in Security Housing Unit (SHU) terms. The projections incorporate the effects of the Ashker settlement, which outlined a process for ending indeterminate SHU terms.
Juveniles
Legislation
Chapter 337, Statutes of 2020, (SB 823) The legislation will realign the Division of Juvenile Justice to local systems. As a result of the changes, commitments to DJJ will end July 31, 2021; and youth received at DJJ through that point will remain there to finish their terms. This change is factored into the Population Projections.
Initiatives
Proposition 57 – Public Safety and Rehabilitation Act of 2016.
Provided juvenile court judges authority to decide whether juveniles age 14 and older should be sentenced as adults for specified offenses. This proposition was passed into law on November 8, 2016, and is factored into the Population Projections.

Fall 2020 Population Projections
30
Appendix C – Glossary of Terms22
ADP (Average Daily Population): The average population per day for a stated population for a specified time period, usually one year.
DJJ 290: Juvenile sex registrants.
DJJ 707(b): Serious and violent juvenile offenders.
DJJ AB 1628: Youth who leave DJJ but are not put on parole, rather they are released back to communities for probation supervision.
DJJ Contract Cases (P): Youth held under a contract agreement for alternative county placement court-ordered by the Juvenile Court to DJJ. They have been previously housed by DJJ and have been released to the county for probation supervision under AB 1628, and are now returning to custody.
DJJ “E” Cases: Youth sentenced to adult institution but sent to DJJ if under 18 years of age regardless of educational status. They will transfer to adult facilities at age 18 unless they can serve their time and be eligible to be out on parole prior to reaching age 21.
DJJ “M” Cases: Youth committed to adult institution and court-ordered to DJJ for housing. They are housed at DJJ until they reach age 21 at which time they are transferred to adult facilities.
DOF: Department of Finance.
DISCHARGE: When an offender is no longer under the jurisdiction of CDCR.
DSL: Cases that fall under the Determinate Sentencing Law.
FELON: A person convicted of a felony offense and sentenced to state institution by the court.
IN FACILITY: A juvenile offender who is physically located and housed in a DJJ facility.
LEVEL I, II, III, IV: The security level, and therefore the facility level, assigned to offenders based on their classification score ranges. The higher the score, the higher the security level.
OFF FACILITY: Any juvenile offender who is the responsibility of DJJ but is not physically in a DJJ facility. This could include juvenile offenders who are in a medical facility, out to court, or being housed in an adult facility.
PAL (Parolee-At-Large): A felon parolee who absconds (hides) from parole supervision.
22 Some terms may not be used in this report.
Fall 2020 Population Projections
31
PAROLE: After the institution term is served, offenders are supervised in the community by CDCR for an established period up to the statutory maximum.
PAROLEE: A felon released from confinement in state institution to supervision in the community by CDCR, as defined in Penal Code section 3000.08.
PENDING REVOCATION: A parolee who has been charged with violating a condition of parole and placed in CDCR custody pending investigation to determine if revocation time will be assessed.
PHU: Protective Housing Unit.
POST RELEASE COMMUNITY SUPERVISION (PRCS): Felons released from confinement in state institution who do not meet the criteria for state parole supervision are released to PRCS for community supervision at the local level.
PV-RTC (Parole Violator-Returned to Custody): A parolee who has violated the conditions of parole and has been returned to institution.
PV-WNT (Parole Violator-Returned with a New Term): A parolee who has received a court sentence for a new crime and been returned to institution.
RECEPTION CENTER: An institution designated as a center for the reception of prisoners newly committed to CDCR.
SERIOUS/VIOLENT: Serious, as defined in Penal Code (PC) sections 1192.7(c) and 1192.8, and Violent as defined in PC section 667.5(c).
SHU: Security Housing Unit.
SOMS: Strategic Offender Management System.
SUSPENSION: The interruption of a parole period, usually by absconding. Time on suspension is not credited to the period of parole.
TOTAL RESPONSIBLE POPULATION: All individuals in the juvenile population regardless of status or place of residence, for whom the DJJ is responsible. This includes all off facility, AB 1628, parole detainees, and youth responsible to DJJ but housed in adult institutions.

Fall 2020 Population Projections
32
Appendix D – Population Projections Tables 9 to 20
Tables 9 through 14 display actual and projected court commitments as rates relative to the California state population ages 18 to 49, for the total population and by gender. Actual rates are displayed for Fiscal Years (FY) 2010-11 through 2019-20 and projected rates are displayed for FY 2020-21 through 2024-25.
Table 9. Actual Felon Court Commitments, Fiscal Years 2010-11 through 2019-20
Fiscal YearFelon Court
Commitments
State Population Ages 18-49
(in Thousands)* Commitment
Rate 2010-11 57,747 17,183 336.12011-12 39,001 17,259 226.02012-13 35,997 17,322 207.82013-14 38,853 17,365 223.72014-15 35,547 17,403 204.32015-16 35,637 17,433 204.42016-17 36,556 17,478 209.22017-18 36,204 17,525 206.62018-19 34,932 17,525 199.32019-20 24,742 17,486 141.5
Table 10. Actual Male Felon Court Commitments, Fiscal Years 2010-11 through 2019-20
Fiscal YearFelon Court
Commitments
State Population Ages 18-49
(in Thousands)* Commitment
Rate 2010-11 51,306 8,744 586.82011-12 35,855 8,790 407.92012-13 33,660 8,829 381.32013-14 36,085 8,855 407.52014-15 33,080 8,878 372.62015-16 33,263 8,892 374.12016-17 33,958 8,914 381.02017-18 33,526 8,936 375.22018-19 32,293 8,935 361.42019-20 22,852 8,916 256.3
*Source of state population data is the California Department of Finance. See Appendix A, Methodology and Technical Notes.

Fall 2020 Population Projections
33
Table 11. Actual Female Felon Court Commitments, Fiscal Years 2010-11 through 2019-20
Fiscal YearFelon Court
Commitments
State Population Ages 18-49
(in Thousands)* Commitment
Rate 2010-11 6,441 8,439 76.32011-12 3,146 8,469 37.12012-13 2,337 8,493 27.52013-14 2,768 8,510 32.52014-15 2,467 8,526 28.92015-16 2,374 8,541 27.82016-17 2,598 8,565 30.32017-18 2,678 8,589 31.22018-19 2,639 8,590 30.72019-20 1,890 8,570 22.1
Table 12. Fall 2020 Projected Felon Institution Court Commitments, Fiscal Years 2020-21 through 2024-25
Fiscal YearFelon Court
Commitments
State Population Ages 18-49
(in Thousands)*Commitment
Rate 2020-21 9,283 17,463 53.22021-22 29,734 17,486 170.02022-23 34,096 17,548 194.32023-24 34,121 17,639 193.42024-25 34,151 17,749 192.4
*Source of state population data is the California Department of Finance. See Appendix A, Methodology and Technical Notes.

Fall 2020 Population Projections
34
Table 13. Fall 2020 Projected Male Felon Institution Court Commitments, Fiscal Years 2020-21 through 2024-25
Fiscal YearFelon Court
Commitments
State Population Ages 18-49
(in Thousands)*Commitment
Rate 2020-21 8,835 8,907 99.22021-22 27,415 8,921 307.32022-23 31,445 8,952 351.32023-24 31,435 8,998 349.42024-25 31,425 9,052 347.2
Table 14. Fall 2020 Projected Female Felon Institution Court Commitments, Fiscal Years 2020-21 through 2024-25
Fiscal YearFelon Court
Commitments
State Population Ages 18-49
(in Thousands)*Commitment
Rate 2020-21 448 8,556 5.22021-22 2,319 8,565 27.12022-23 2,651 8,596 30.82023-24 2,686 8,642 31.12024-25 2,726 8,697 31.3
*Source of state population data is the California Department of Finance. See Appendix A, Methodology and Technical Notes
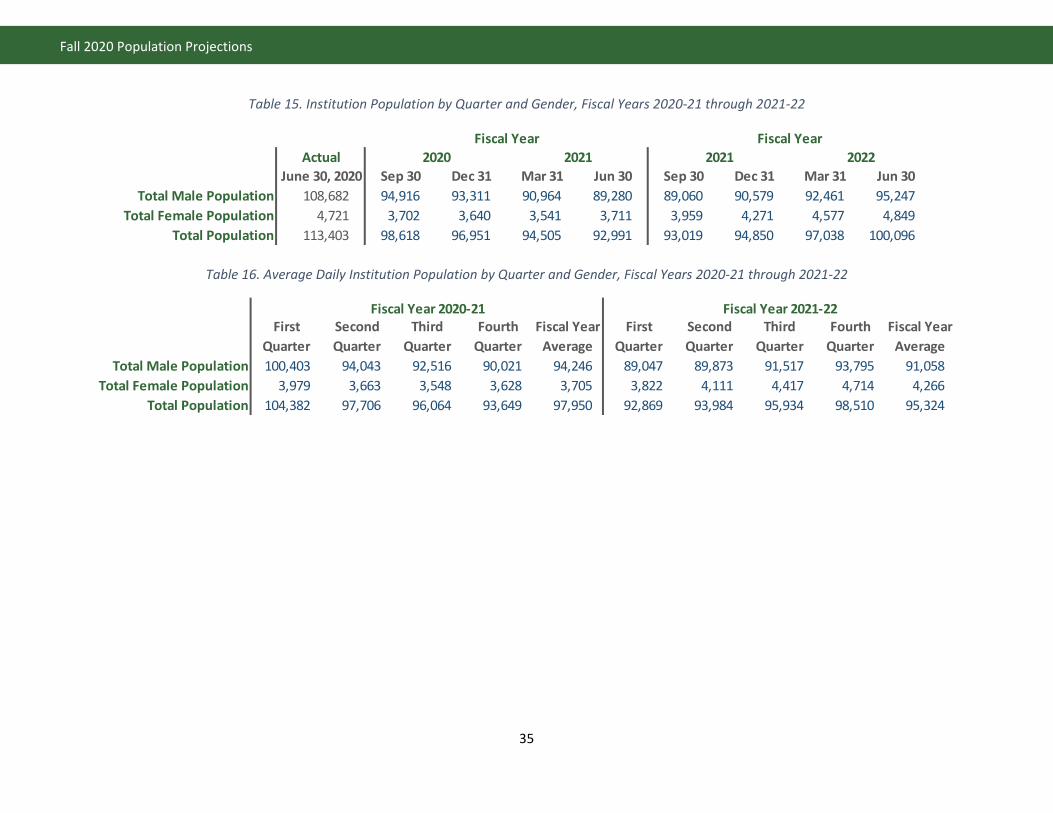
Fall 2020 Population Projections
35
Table 15. Institution Population by Quarter and Gender, Fiscal Years 2020-21 through 2021-22
ActualJune 30, 2020 Sep 30 Dec 31 Mar 31 Jun 30 Sep 30 Dec 31 Mar 31 Jun 30
Total Male Population 108,682 94,916 93,311 90,964 89,280 89,060 90,579 92,461 95,247Total Female Population 4,721 3,702 3,640 3,541 3,711 3,959 4,271 4,577 4,849
Total Population 113,403 98,618 96,951 94,505 92,991 93,019 94,850 97,038 100,096
Fiscal Year2021 2021 20222020
Fiscal Year
Table 16. Average Daily Institution Population by Quarter and Gender, Fiscal Years 2020-21 through 2021-22
First Quarter
Second Quarter
Third Quarter
Fourth Quarter
Fiscal Year Average
First Quarter
Second Quarter
Third Quarter
Fourth Quarter
Fiscal Year Average
Total Male Population 100,403 94,043 92,516 90,021 94,246 89,047 89,873 91,517 93,795 91,058Total Female Population 3,979 3,663 3,548 3,628 3,705 3,822 4,111 4,417 4,714 4,266
Total Population 104,382 97,706 96,064 93,649 97,950 92,869 93,984 95,934 98,510 95,324
Fiscal Year 2020-21 Fiscal Year 2021-22

Fall 2020 Population Projections
36
Table 17. Projected Institution Population by Quarter and Housing Level, Fiscal Years 2020-21 through 2021-22
Reception Center Level I Level II Level III Level IV PHU SHU Male Female
Total Population
2020-21 Sep 30 3,132 10,915 41,107 16,424 22,512 6 820 94,916 3,702 98,618Dec 31 3,132 10,722 40,381 16,135 22,115 6 820 93,311 3,640 96,951Mar 31 3,132 10,441 39,320 15,711 21,534 6 820 90,964 3,541 94,505Jun 30 3,906 10,146 38,209 15,267 20,926 6 820 89,280 3,711 92,991
2021-22 Sep 30 5,377 9,943 37,444 14,962 20,508 6 820 89,060 3,959 93,019Dec 31 6,456 9,996 37,644 15,041 20,616 6 820 90,579 4,271 94,850Mar 31 7,461 10,989 37,584 15,017 20,584 6 820 92,461 4,577 97,038Jun 30 7,716 11,659 38,540 15,399 21,107 6 820 95,247 4,849 100,096
Fiscal Year Quarter Ending
Security Level
Table 18. Projected Institution Population by Housing Level, June 30, 2020 through June 30, 2025
June 30 Reception
Center Level I Level II Level III Level IV PHU SHU Male Female Total
Population 2020 (Actual) 4,250 11,941 45,706 19,821 26,118 6 840 108,682 4,721 113,403
2021 3,906 10,146 38,209 15,267 20,926 6 820 89,280 3,711 92,9912022 7,716 11,659 38,540 15,399 21,107 6 820 95,247 4,849 100,0962023 7,749 12,543 41,777 16,692 22,879 6 820 102,466 5,113 107,5792024 7,870 12,200 40,478 16,173 22,168 6 820 99,715 4,734 104,4492025 7,808 11,712 38,819 15,510 21,259 6 820 95,934 4,864 100,798
Security Level

Fall 2020 Population Projections
37
Table 19. California Active Parole Population by Quarter, Fiscal Years 2020-21 through 2021-22
ActualJune 30, 2020 Sep 30 Dec 31 Mar 31 Jun 30 Sep 30 Dec 31 Mar 31 Jun 30
Total Population 53,427 56,518 53,870 49,978 49,003 48,176 46,378 43,625 41,914
Fiscal Year Fiscal Year2020 2021 2021 2022
Table 20. California Average Daily Active Parole Population by Quarter, Fiscal Years 2020-21 through 2021-22
First Quarter
Second Quarter
Third Quarter
Fourth Quarter
Fiscal Year Average
First Quarter
Second Quarter
Third Quarter
Fourth Quarter
Fiscal Year Average
Total Population 55,089 55,441 51,918 49,465 52,978 48,597 47,271 44,984 42,731 45,896
Fiscal Year 2020-21 Fiscal Year 2021-22

California Department of Corrections and Rehabilitation Division of Correctional Policy Research and Internal Oversight
Office of Research