Ezz Steel - Initiation of Coverage - January 2016
26
PRIME INVESTMENT RESEARCH AUTOMOTIVE |EGYPT GB AUTO – INITIATION OF COVERAGE JANUARY, 14 TH 2016 PRIME INVESTMENT RESEARCH BUILDING MATERIALS |EGYPT EZZ STEEL – INITIATION OF COVERAGE JANUARY, 24 TH 2016 WE INTIATE COVERAGE FOR … EZZ STEEL … ASSIGNING A “BUY” RATING EGYPT’S STEEL DEMAND IS SOLID AND PERFORMING WELL, SUPPORTED BY THE LARGEST AND GROWING POPULATION IN THE MENA REGION, STRONG DEMAND FOR RESIDENTIAL UNITS AND PLANS OF MEGA PROJECTS. SLOWDOWN IN THE CHINESE ECONOMY WEIGHS ON THE GLOBAL STEEL INDUSTRY AND ACCORDINGLY, THE DOMESTIC ONE. CONTINUITY OF OVERSUPPLY OF IRON ORE OVER THE SHORT-TERM, WILL MAINTAIN GLOBAL PRICE UNDER PRESSURE AND PREVENTING LOCAL PLAYERS FROM PASSING FULL INCREASES IN COGS TO END CONSUMERS, ESPECIALLY WITH THE AVAILABILITY OF CHEAPER IMPORTED STEEL. EZZ STEEL SHOWED SOLID OPERATING PERFORMANCE IN THE PAST YEARS DESPITE THE POLITICAL UNREST IN EGYPT. AL EZZ AL DEKHILA IS THE CORNERSTONE FOR THE GROUP, WHEN IT FALLS THE WHOLE GROUP COLLAPSE. NEW DRI PLANT TO ENHANCE MARGINS IN BOTH EFS & ESR, AND ACCORDINGLY THE WHOLE GROUP OVER THE MEDIUM TERM. WE INITIATE COVERAGE FOR EZZ STEEL AT A FAIR VALUE OF EGP 11.22/SHARE IMPLYING A 69% UPSIDE POTENTIAL. HENCE, WE ASSIGN ESRS A “BUY” RATING.
-
Upload
mohamed-magdi -
Category
Documents
-
view
263 -
download
2
Transcript of Ezz Steel - Initiation of Coverage - January 2016

PRIME INVESTMENT RESEARCH AUTOMOTIVE |EGYPT
GB AUTO – INITIATION OF COVERAGE JANUARY, 14TH
2016
PRIME INVESTMENT RESEARCH
BUILDING MATERIALS |EGYPT EZZ STEEL – INITIATION OF COVERAGE
JANUARY, 24TH 2016
WE INTIATE COVERAGE FOR … EZZ STEEL … ASSIGNING A “BUY” RATING
EGYPT’S STEEL DEMAND IS SOLID AND PERFORMING
WELL, SUPPORTED BY THE LARGEST AND GROWING
POPULATION IN THE MENA REGION, STRONG
DEMAND FOR RESIDENTIAL UNITS AND PLANS OF
MEGA PROJECTS. SLOWDOWN IN THE CHINESE ECONOMY WEIGHS ON
THE GLOBAL STEEL INDUSTRY AND ACCORDINGLY, THE
DOMESTIC ONE. CONTINUITY OF OVERSUPPLY OF IRON ORE OVER THE
SHORT-TERM, WILL MAINTAIN GLOBAL PRICE UNDER
PRESSURE AND PREVENTING LOCAL PLAYERS FROM
PASSING FULL INCREASES IN COGS TO END
CONSUMERS, ESPECIALLY WITH THE AVAILABILITY OF
CHEAPER IMPORTED STEEL. EZZ STEEL SHOWED SOLID OPERATING PERFORMANCE
IN THE PAST YEARS DESPITE THE POLITICAL UNREST IN
EGYPT. AL EZZ AL DEKHILA IS THE CORNERSTONE FOR THE
GROUP, WHEN IT FALLS THE WHOLE GROUP COLLAPSE. NEW DRI PLANT TO ENHANCE MARGINS IN BOTH EFS
& ESR, AND ACCORDINGLY THE WHOLE GROUP OVER
THE MEDIUM TERM.
WE INITIATE COVERAGE FOR EZZ STEEL AT A FAIR
VALUE OF EGP 11.22/SHARE IMPLYING A 69%
UPSIDE POTENTIAL. HENCE, WE ASSIGN ESRS A “BUY” RATING.

2
PRIME INVESTMENT RESEARCH EZZ STEEL INITIATION OF COVERAGE
JANUARY, 24TH 2016
Ezz Steel is the leading steel producer in Egypt and the MENA region. The company dominated the local steel market for many years and will likely dominate it for many years coming. Ezz steel has managed to occupy half of the local market for long steel with a production capacity of 3.5mn ton. It also occupies almost the half of local market for flat steel with production capacity of 1mn ton. Moreover, EFS operates a flexible capacity of 1.3mn ton whether long or flat. In addition to its directly owned company, Ezz Steel Rebars with a capacity of 1mn ton of long steel, Ezz steel holding company has three subsidiaries, 1- Al Ezz Al Dekhila (2mn ton long steel, 1mn ton flat steel & 3.2mn ton DRI). 2- Al Ezz Flat Steel (1.3mn ton flexible capacity). 3- Al Ezz Rolling Mills (500k ton of long steel).
One of the main advantages that differentiate Ezz Steel from its peers is using the highly efficient production method of Direct Reduced Iron (DRI). This production method depends on the lower cost iron ore and natural gas as main factors of production. The alternative methods use raw materials as scrap and coal which are more expensive relative to iron ore and natural gas. This gives Ezz steel a high cost advantage against its peers. The existing DRI plant is owned and operated by Ezz Al Dekhila with a production capacity of 3.2mn tons of DRI. In addition, Ezz steel enjoys a good reputation in Egypt’s market, through offering high quality products. Ezz Steel to duplicate EZDK business model in EFS & ESR, through a new DRI plant owned by Al Ezz Rolling Mills with a production capacity of 1.9mn ton. The new DRI plant will mainly supply Ezz Flat Steel with the required DRI for production, the remainder DRI will be supplied to Ezz Steel Rebar. The new DRI plant started production in December 2015, supplying Ezz Flat Steel with required raw materials, leading to a limited improve in margins. We believe the new DRI plant will improve EFS & ESR’s margins through providing raw materials, leading to an increase in utilization rates. Meanwhile, the company’s decision to make the new DRI plant under ERM’s control will boost revenues and margins of ERM through selling DRI to EFS & ESR. Therefore, we believe the new DRI will take Ezz Steel to new levels of revenues over the short term and margins over the medium term, in conjunction with the stability in global steel industry. However, we expect Ezz Steel to keep recording net losses till 2018. Our expectation is attributed to the high levels of Ezz Steel’s interest expenses as Ezz has a high level of debt. World’s steel industry is in pain. The sluggish steel demand by China, the largest producer and consumer of steel in the world, led to steel glut in the country. Steel producers in China dumped the rest of the world with that glut leading to plunging prices and suffering high cost producers. Commodities prices also plunged with the lowest iron ore and coking coal prices in more than 7 years. A market share war between iron ore producers led to higher supply and lower prices. The golden age of steel industry is over. The coming years are carrying bad news for the global industry; China’s demand has finally reached its peak when no one was ready, slowing economic growth will make things worse. Prices will keep declining until the situation in China stabilizes leading to stabilizing steel prices, but not booming. With global steel industry suffering, local industry was not any better. An energy crisis arises making it impossible for steel mills to operate. Higher cost of energy since the mid of 2014 coupled with declining steel global prices, has pressured local prices. Unlike global industry, local industry is healing, however, in a slow pace. The energy situation is getting better, and by 2018 we expect the crisis to end. But till then, the crisis will take its time to disappear.
We reached a Fair Value of EGP 11.22 with a “Buy” recommendation, driven from an upside potential of 69%, Using Sum of Parts valuation (SOPT) method. We see Ezz Steel as a very efficient organization but it is faced by many obstacles that tumble its performance.
EZZ STEEL … EFFICIENCY, INTEGRATION & COST ADVANTAGE ….. STILL NOT ENOUGH
Stock Data Outstanding Shares [in mn] 543.26 Mkt. Cap [in mn] 3,536.7 Bloomberg – Reuters ESRS EY / ESRS.CA 52-WEEKS 6.11-16.91 DAILY AVERAGE TURNOVER [in mn] 9.97
Ownership Ezz Industries 65% Free Float 35%
Financial Highlights
EGP mn 2014 2015E 2016E 2017E
Revenues 19,398 19,237 23,121 24,156 GPM (%) 7% 7% 11% 12% EBITDA 645 567 1,535 1,878
N.Att,Income (835) (946) (752) (638)
EPS -1.3 -1.3 -1.2 -1.3 P/E -5.38x -5.41x -5.62x -5.16x BV/S 9.6 13.4 13.1 12.9 P/BV 0.72x 0.51x 0.53x 0.53x
Source: Ezz Steel, Prime Estimates All prices are as of 21 January 2016
Source: Bloomberg
“BUY” MARKET PRICE EGP 6.65 FAIR VALUE EGP 11.22 POTENTIAL 69% UPSIDE
INVESTMENT GRADE “VALUE”
Report Contents Valuation & Risks 3-6 Financial Statements 7 Industry Overview 8 Supply Side 9 Consumption 10 Outlook 11 Raw Materials 12-14
Iron Ore Scrap Coking Coal
Global Steel Price 14 Egypt’s Steel Industry 16
Domestic Supply 17 Consumption 19 Price 19
Company Profile 20 Financial Overview 23 Disclaimer 26
0 2 4 6 8
10 12 14 16 18
05-
Jan
-15
05-
Feb
-15
05-
Mar
-15
05-
Ap
r-15
05-
May
-15
05-
Jun
-15
05-
Jul-1
5
05-
Au
g-1
5
05-
Se
p-1
5
05-
Oct
-15
05-
No
v-15
05-
De
c-15
05-
Jan
-16
ESRS EGX - rebased

3
PRIME INVESTMENT RESEARCH EZZ STEEL INITIATION OF COVERAGE
JANUARY, 24TH 2016
PRICE
SOURCE: EZZ STEEL & PRIME ESTIMATES
Valuation
We initiate Ezz Steel with a Fair Value
of EGP 11.22, with a “Buy”
recommendation, using sum of parts
(SOPTs) valuation method. In sum of
parts we conducted separate valuation
models for each company on a standalone
basis.
Despite the global challenges, we are bullish on the Egyptian steel industry, supported by the domestic
demand, which is expected to maintain its powerful for the following,
1- The Largest population in MENA region which hit 90mn in December 2015, with an annual growth rate of
2%. Additionally, Egypt enjoys a young population, with 60% of population are under age of 30 years old.
2- The political stability in Egypt through elections of the parliament members, represents a strong factor in
the process of attracting FDI’s.
3- Massive mega projects in Egypt declared in 2015 presents a strong incentive for the local steel demand
growth in the coming years.
4- With more than one million marriages per annum, the rate of marriages in Egypt increased by 5% in 2014
compared to 2013, which increases demand for residential units as the main engine of steel industry in
Egypt, supporting our positive outlook for the local demand.
5- Mortgage finance in Egypt increased by 54% in the first 10 months of 2015 to register EGP 732mn compared
to EGP 474mn in the same period last year. However, mortgages still represent only 1% of GDP. The CBE
targets increasing this percentage, as it recently introduced amendments to facilitate and increase
mortgages provided for low income segment. The increase in mortgages, which in turn will boost demand
for residential units, will support domestic demand for steel.
6- In addition to the above mentioned factors, Shortage of NG supply will ease starting 2016. We expect Ezz
Steel’s DRI plants to get 50% of NG required for production in 2016. We believe NG supply to plants will
increase gradually.
Ezz steel is not immune from the global plunge in steel
prices. We expect global prices to remain depressed and
will likely decline further in the upcoming 2 years,
however, it will pick up gradually in the long run. As we
expect supply of iron ore will ease through the exit of
small producers from the Chinese market, leading iron
ore prices up. This in turn, will lead to minimize steel
oversupply in Chinese market, and hence in the whole
world. However, local prices will not be highly affected
by this drop for three main reasons: 1- we expect
government to impose higher import tariffs on steel
imports, in response to requests of domestic
manufacturers. 2- Imports restrictions by the CBE on a
lot of the “unnecessary imports” according to the CBE governor, which will limit FX amount allocated to
steel importers & hence reduce imported amount.
3- The devaluation of the local currency.
These reasons will allow Ezz steel to sell at a premium in the domestic market relative to global prices.
Company Equity Value Ownership Contribution
EZDK 6,599,506 55% 3629728.565
ESR/ERM 2,273,731 100% 2273731.47
EFS 563,354 34% 191540.5018
EV 6,095,001
No. of Shares 543,265
Fai Value 11.22
2,000
2,500
3,000
3,500
4,000
4,500
5,000
2015E 2016F 2017F 2018F 2019F 2020F
EG
P/T
on
Global Price (EGP/ton) Ezz price (EGP/ton)

4
PRIME INVESTMENT RESEARCH EZZ STEEL INITIATION OF COVERAGE
JANUARY, 24TH 2016
BEFORE NEW DRI PLANT AFTER NEW DRI PLANT
SOURCE: EZZ STEEL & PRIME ESTIMATES
The new DRI plant will help in diversifying the risk of depending on EZDK as the main source of profit for Ezz
Steel group. With EFS starting production using DRI, it will be transferred to higher levels of margins. The
total DRI production capacity within Ezz group will reach 5.1mn tpa, through adding a new 1.85mn tpa in
ERM to the existing 3.2mn tpa in EZDK.
But with the current energy crisis in Egypt, how the plant would work? According to Ezz steel, they had agreed with
the local government to provide 60-65% of the plant’s needs of NG in 2016, which is sufficient to provide enough DRI
to operate EFS with full capacity. Even if the problem of natural gas continued, operations in facilities will be
maintained. Scrap prices declined from USD 425/ton in 1st of January 2014 to USD 250/ton in Jan 1st
2016 with a
decline of 41%. So we believe that, even if the case of natural gas supply shortage appeared again in 2016 the effect
on operations of Ezz Steel will not be as severe as before, but this will result in recording lower profitability margins as
we saw in EZDK results in 2014 & 2015, due to the higher contribution of scrap in production process to replace DRI.
Process EZDK ESR+ERM EFS
DRI (Mtpa) 3.2 0 0
Meltshop (Mtpa) 3 0.85 1.3
Final product (Mtpa) 3 1.5 1.3
Process EZDK ESR+ERM EFS
DRI (Mtpa) 3.2 1.9 0
Meltshop (Mtpa) 3 0.85 1.3
Final product (Mtpa) 3 1.5 1.3
Source: Prime Calculations

5
PRIME INVESTMENT RESEARCH EZZ STEEL INITIATION OF COVERAGE
JANUARY, 24TH 2016
SOURCE: EZZ STEEL & PRIME ESTIMATES
SOURCE: EZZ STEEL & PRIME ESTIMATES
DRI PRODUCTION & UTILIZATION RATES
SOURCE: EZZ STEEL & PRIME ESTIMATES
EZDK
EZDK is the real deal for Ezz group as
mentioned earlier, so when EZDK faced
problems the whole group was suffering.
The average utilization rates of EZDK for
the three lines of production are
expected to improve in the coming
years, with the expected gradual
increase in NG supply.
We expect that, DRI plant will get higher supply of NG
than previously, which will improve utilization rates and
margins. Our forecast is backed by the improvements in
oil & gas sector and the new discoveries in the
Mediterranean area. In addition, the government started
to pay its debts to foreign oil companies, which will
encourage them to restore their discoveries in the
country.
Nonetheless, we expect low selling prices to put
revenues on the declining trend over the short term and
to pick up gradually. On the other hand, margins will
improve as a result of the higher percentage of DRI used
in production process.
EFS
We are optimistic about EFS and we consider it as the new story. The new DRI plant is finally online and, according
to the company, it started production in December 2015. The new plant owned by ERM will mainly feed EFS with its
needs of DRI, which will turn EFS into an integrated facility; this will boost utilization rates in EFS pushing up sales
revenues for levels that EFS did not witness before. Gross profit margins are expected to improve, because of the cost
advantage of using DRI relative to scrap. However, EFS will not get the full advantage of using DRI, since it will get DRI
supply at prices close to that of scrap. This is one of the reasons we do not see EFS booming the way for Ezz group like
EZDK. Still, it will enhance operation margins, enabling the company to start repaying its debts and helping the group
to reduce high debts level.
EZDK 2014a 2015e 2016f 2017f 2018f
Utilization Rate 80% 67% 75% 79% 83%
Revenues 12,131 11,035 10,712 10,954 11,656
Cogs/Sales 92% 94% 92% 88% 87%
EBITDA Margin 7% 5% 8% 12% 13%
Net Income 36 -241 -155 255 423
NPM 0.3% -2.2% -1.4% 2.3% 3.6%
Dividend Yield 7% 0% 0% 3% 8%
P/B 1.20 1.47 1.57 1.41 1.28
EFS 2014a 2015e 2016f 2017f 2018f
Utilization Rate 30% 25% 70% 75% 85%
Revenues 1,946 1,301 3,811 4,081 4,846
Cogs/Sales 107% 108% 88% 89% 86%
EBITDA Margin -9% -10% 10% 9% 12%
Net Income -438 -399 -41 -73 99
NPM -23% -31% -1% -2% 2%
40.0%
50.0%
60.0%
70.0%
80.0%
90.0%
0
500
1,000
1,500
2,000
2,500
3,000
2013A 2014A 2015E 2016F 2017F 2018F 2019F 2020F
Th
ou
san
d T
on
DRI Production Utilization Rate in NG

6
PRIME INVESTMENT RESEARCH EZZ STEEL INITIATION OF COVERAGE
JANUARY, 24TH 2016
SOURCE: EZZ STEEL & PRIME ESTIMATES
ESR/ERM
We do not expect profitability margins to enhance significantly in ESR/ERM. The New DRI plant, located in Al Ein
Sokhna, is owned by ERM. Sales revenues from the DRI will boost ERM reported revenues, through selling DRI at
prices near that of scrap, however, margins
will not be enhanced since ERM will still
depends on high cost raw materials in
operating its own 0.5mn tpa of rebar steel.
The main production of the DRI plant will
mainly support EFS with its needs and the
remainder will be allocated to ESR. So that
is why we believe ESR’s margins will not
boom too, as it will buy DRI near scrap
prices, similar to EFS’s case.
Upside Risks
Higher than anticipated steel demand by China leading to a pickup in prices and decline in oversupply.
More NG supply to DRI plants, hence pushing utilization rates margins up.
Higher than expected import tariffs, allowing Ezz Steel to control prices with no pressure.
Lower than expected devaluation of the EGP against USD, reducing the cost of importing raw materials.
Downside Risks
Easing FX crisis, making it easier to import steel leading to availability of cheaper imported steel and
accordingly more aggressive competition.
Lower than expected import tariffs or removal of import barriers by the government. Lower NG supply to DRI plants, leading to lower utilization rates and higher cost of production.
Slowdown in local steel demand.
ESR/ERM 2014a 2015e 2016f 2017f 2018f
Utilization Rate 76% 83% 86% 86% 90%
Revenues 5,321 6,900 8,598 9,120 9,938
Cogs/Sales 96% 93% 91% 92% 93%
EBITDA Margin -1% 1% 3% 2% 1%
Net Income -433 -306 -556 -820 -521
NPM -8% -4% -6% -9% -5%

7
PRIME INVESTMENT RESEARCH EZZ STEEL INITIATION OF COVERAGE
JANUARY, 24TH 2016
Income Statement 2014a 2015e 2016f 2017f 2018f
Revenue 19,398 19,237 23,121 24,156 26,440
Growth -8.9% -0.8% 20.2% 4.5% 9.5%
COGS 17,990 17,815 20,590 21,234 23,121
S,G & Admin. Expenses -605 -659 -797 -839 -921
Other Provisions -15 -15 -7 -7 -5
EBITDA 645 567 1,535 1,878 2,179
Growth -71.9% -12.2% 170.8% 22.3% 16.0%
EBITDA Margin 3% 2.9% 7% 8% 8%
Depreciation & Amortization 707 706 911 923 935
EBIT -62 -139 624 955 1,244
Interest Income 72 36 36 36 36
Investment Income 0 9 9 9 9
Non-Operating Income 38 6 4 13 32
Non-Operating Expenses 13 4 2 7 18
Extra-Ordinary Items -16 0 0 0 0
Net Income Before Minority -835 -946 -752 -639 1.3
Fiscal Year 2014a 2015e 2016f 2017f 2018f
Revenue (EGP mn) 19,398 19,236 23,120 24,156 26,440
Growth -9% -1% 20% 4% 9%
EBITDA margin 3% 3% 7% 8% 8%
Net Income (EGP mn) -697 -693 -668 -727 -225
Net Attr. Income (EGP mn) -729 -131 -126 -137 -42
EPS (EGP) -1.3 -1.3 -1.2 -1.3 -0.4
EPS Growth 232% -0.5% -3.7% 8.9% -69.1%
BVPS (EGP) 9.6 13.4 13.1 12.9 14.0
P/E x -5.19 -5.21 -5.41 -4.97 -16.07
Dividend Yield 0% 0% 0% 0% 0%
P/BV x 0.69 0.51 0.53 0.53 0.49

8
PRIME INVESTMENT RESEARCH EZZ STEEL INITIATION OF COVERAGE
JANUARY, 24TH 2016
PRODUCTION METHODS USAGE
SOURCE: WORLD STEEL ASSOCIATION
SOURCE: WORLD STEEL ASSOCIATION
PRODUCTION METHODS
Industry Overview
Technology of Steel production process has witnessed significant changes over the years. Bessemer process is the first
method discovered for mass producing steel in which iron could be heated while oxygen could be blown through the
molten metal. Today, steel production comes from two processes; 1- integrated Blast Furnace (BOF) and 2- Electric
Arc Furnaces (EAF). The main difference between the two routes is the type of raw materials that is consumed in
each, for the BOF the raw materials are iron ore (to get pig iron), coal and scrap. For the EAF raw materials are iron
ore and/or scrap.
BOF works through chemically reducing and physically convert iron
oxides into liquid iron called “hot metal or pig iron”, and then
turning this carbon rich pig iron into steel through basic oxygen
steel making method. Blast Furnace uses on average 1,400kg of iron
ore, 800kg of coal, 300kg of limestone, and 120kg of recycled steel
to produce 1,000kg of crude steel.
EAF production process is much easier and faster process. There are
two routes in EAF production based on the used raw material: 1-
Using only scrap with electricity as the source of energy. 2- Using a
mix of scrap and DRI, where natural gas is the main factor in
producing DRI. The used raw material is introduced into a furnace
and re-melted along with some other additions to produce the final
product. Electric arc furnace uses on average 880kg of recycled steel, 16kg of coal and 64kg of limestone to produce
1,000kg of crude steel.
The reduced iron ore or scrap in EAF gets to a melt shop giving molten steel and then it gets to casters that shape
molten steel to steel slabs and billets. The final step is to reshape these slabs and billets (through heating) into the
final product long or flat steel.
There is another steel making method called the Open Hearth Furnace (OHF), it is very energy intensive and the
amount of steel produced by this method is declining every year because of its environmental and economic
disadvantages.
So briefly we can say steel’s production process
consists of the following steps:
1- Reduction of iron ore to DRI in EAF or
converting iron ore to pig iron in BOF.
2- Melting Scrap or a mix of DRI & Scrap in
the melt shop or convert liquid iron into
steel via basic oxygen steelmaking in
BOF.
3- Casters shaping molten steel to slabs or
billets.
4- Reshape billets into long steel and slabs
into flat steel.
70%
29%
1% BOF
EAF
OHF
9
PRIME INVESTMENT RESEARCH EZZ STEEL INITIATION OF COVERAGE
JANUARY, 24TH 2016
CHINA VS WORLD SUPPLY
SOURCE: WSA & PRIME ESTIMATES
TOP STEEL PRODUCERS STEEL PRODUCTION
SOURCE: WSA & PRIME CALCULATIONS
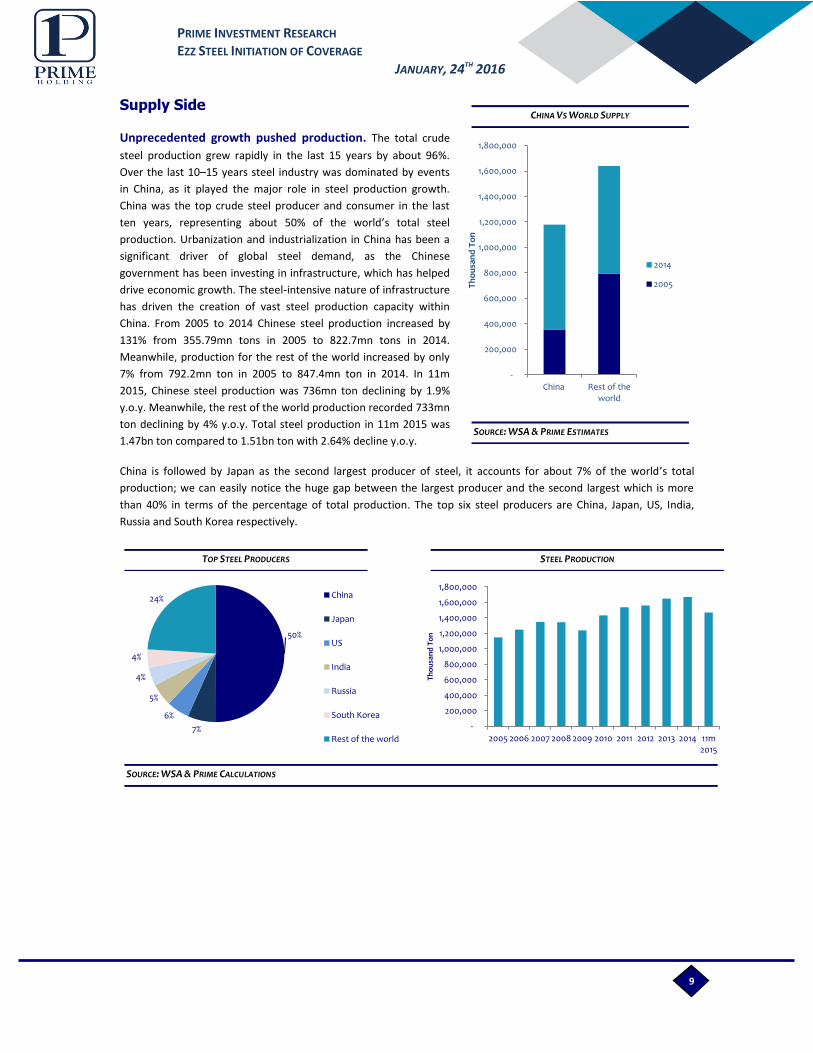
Supply Side
Unprecedented growth pushed production. The total crude
steel production grew rapidly in the last 15 years by about 96%.
Over the last 10–15 years steel industry was dominated by events
in China, as it played the major role in steel production growth.
China was the top crude steel producer and consumer in the last
ten years, representing about 50% of the world’s total steel
production. Urbanization and industrialization in China has been a
significant driver of global steel demand, as the Chinese
government has been investing in infrastructure, which has helped
drive economic growth. The steel-intensive nature of infrastructure
has driven the creation of vast steel production capacity within
China. From 2005 to 2014 Chinese steel production increased by
131% from 355.79mn tons in 2005 to 822.7mn tons in 2014.
Meanwhile, production for the rest of the world increased by only
7% from 792.2mn ton in 2005 to 847.4mn ton in 2014. In 11m
2015, Chinese steel production was 736mn ton declining by 1.9%
y.o.y. Meanwhile, the rest of the world production recorded 733mn
ton declining by 4% y.o.y. Total steel production in 11m 2015 was
1.47bn ton compared to 1.51bn ton with 2.64% decline y.o.y.
China is followed by Japan as the second largest producer of steel, it accounts for about 7% of the world’s total
production; we can easily notice the huge gap between the largest producer and the second largest which is more
than 40% in terms of the percentage of total production. The top six steel producers are China, Japan, US, India,
Russia and South Korea respectively.
-
200,000
400,000
600,000
800,000
1,000,000
1,200,000
1,400,000
1,600,000
1,800,000
China Rest of the world
Th
ou
san
d T
on
2014
2005
50%
7%
6%
5%
4%
4%
24% China
Japan
US
India
Russia
South Korea
Rest of the world
-
200,000
400,000
600,000
800,000
1,000,000
1,200,000
1,400,000
1,600,000
1,800,000
2005 2006 2007 2008 2009 2010 2011 2012 2013 2014 11m 2015
Th
ou
san
d T
on
Top Steel Producers
Source: WSA & Prime Calculations
Top Steel Producers

10
PRIME INVESTMENT RESEARCH EZZ STEEL INITIATION OF COVERAGE
JANUARY, 24TH 2016
WORLD’S CONSUMPTION CHINA’S CONSUMPTION
SOURCE: WSA & PRIME CALCULATIONS
GLOBAL CONSUMPTION
APPARENT CONSUMPTION
SOURCE: WSA & PRIME CALCULATIONS
Consumption
On the other hand, steel consumption also increased remarkably in the last 10-15 years. The key driver for that
growth was also China. Whereas, many countries and regions, specially developed ones, witnessed declining levels of
consumption. However, all of these declines combined were lower than the increasing demand in China, which drove
steel consumption to unprecedented rates in the last decade. The difference in steel consumption growth is depicted
in the below graphs. It is so clear that, if it wasn’t for China’s demand growth, steel industry would have shrunk a lot.
According to WSA estimates, steel consumption is estimated to decline by 1.7% in 2015 to be 1.513bn ton.
China, on its own, consumes almost the half of the world’s total consumption with 711mn ton. The rest of Asian countries except for China, India and Japan, constitutes about 10% and then comes the EU with 9.55%.
Country 2014 mtpa %
China 711 46.24%
India 75 4.90%
Japan 68 4.39%
NAFTA 145 9.41%
EU 147 9.55%
Other Asia 155 10.06%
Other Europe 73 4.75%
CIS 57 3.68%
Africa 64 4.16%
Middle East 52 3.38%
Central and south America 48 3.13%
Australia & New Zealand 7 0.48%
World 1,537 100%
0.00
100.00
200.00
300.00
400.00
500.00
600.00
700.00
800.00
900.00
2008 2014
Mn
To
n
-34%
0
100
200
300
400
500
600
700
800
2008 2014
Mn
To
n
59%
0.0%
10.0%
20.0%
30.0%
40.0%
50.0%
60.0%
70.0%
80.0%
2014
2004

11
PRIME INVESTMENT RESEARCH EZZ STEEL INITIATION OF COVERAGE
JANUARY, 24TH 2016
CHINA’S GDP AND STEEL PRODUCTION CORRELATION
SOURCE: WSA & PRIME ESTIMATES
GLOBAL STEEL PRODUCTION & CONSUMPTION
SOURCE: WSA & PRIME CALCULATIONS
Outlook
However, the outlook for steel Industry is not as good as
its history. As mentioned before, global steel industry
mainly depends on China as its main engine. In 2014
Chinese steel demand declined for the first time since
1995. This was a result of the slowdown in the real estate
sector, which accounts for almost half of steel demand in
China. Accordingly, global steel demand declined, prices
crashed and the world found itself with steel glut. The
relationship between global steel market and Chinese
economic growth is depicted in the graph. Any slowdown
in China’s real GDP growth rates is accompanied with
lower steel production, when we calculated the
correlation between GDP growth in China and global steel prices; it was 0.9, which refers to a very high correlation
between the both. In the short run, we believe conditions will be the same in China with declining steel demand or in
best cases a flat one. Our view is backed by the expectations of China’s GDP to continue slowing down to 6.3% in
2016 compared to 6.8% in 2015. Accordingly, we see the economic slowdown in China to weigh negatively on global
steel industry. The even worst case scenario is that, economic growth in China is turning to be at a normal level of
4.5%, which will be another shock for the global market. With estimations that steel demand in China is decreased by
3.3% in 2015 and expected to decrease by 1.9% in 2016, we do not expect a strong rebound in the market in the short
term; however, industry will stabilize at lower rates relative to its history. Our opinion is stemmed from the believe
that; what is happening now in China is a normalization stage that all developed markets have been through before
when they turned from developing markets into developed ones. The historical booming in the industry was
abnormal; we saw that without China, the global steel production and consumption would not grew in these
remarkable levels. Hence, we believe that with China’s economy normalizing, global steel industry will normalize too.
Source: Bloomberg & Prime Research
-10%
-5%
0%
5%
10%
15%
20%
-
200,000
400,000
600,000
800,000
1,000,000
1,200,000
1,400,000
1,600,000
1,800,000
2006 2007 2008 2009 2010 2011 2012 2013 2014
Th
ou
san
d T
on
Steel Production Steel Consumption % Change in Production % Change in Consumption
-10.00%
-5.00%
0.00%
5.00%
10.00%
15.00%
20.00%
2005 2007 2009 2011 2013 2015
China’s GDP Growth % Steel production Growth %
12
PRIME INVESTMENT RESEARCH EZZ STEEL INITIATION OF COVERAGE
JANUARY, 24TH 2016
SOURCE: WORLD BANK & PRIME CALCULATION
IRON ORE PRODUCERS
SOURCE: WORLD BANK & PRIME CALCULATION
So the simple question now is, has China reached its peak? All indicators show that it is already there and the curve is
declining until it reaches normality. In addition, China is beginning to depend on demand and supply as the main
market factors instead of depending on centrally planned investment, which was concentrated on mass real estate
constructions. And these are not the only bad news, China’s population growth rates are turning downside for the
first time since 2010 and it seems that, it is more of a stable decline not a sudden one, which is, according to experts,
a normal decline and the population growth would have taken a downside route sooner or later.
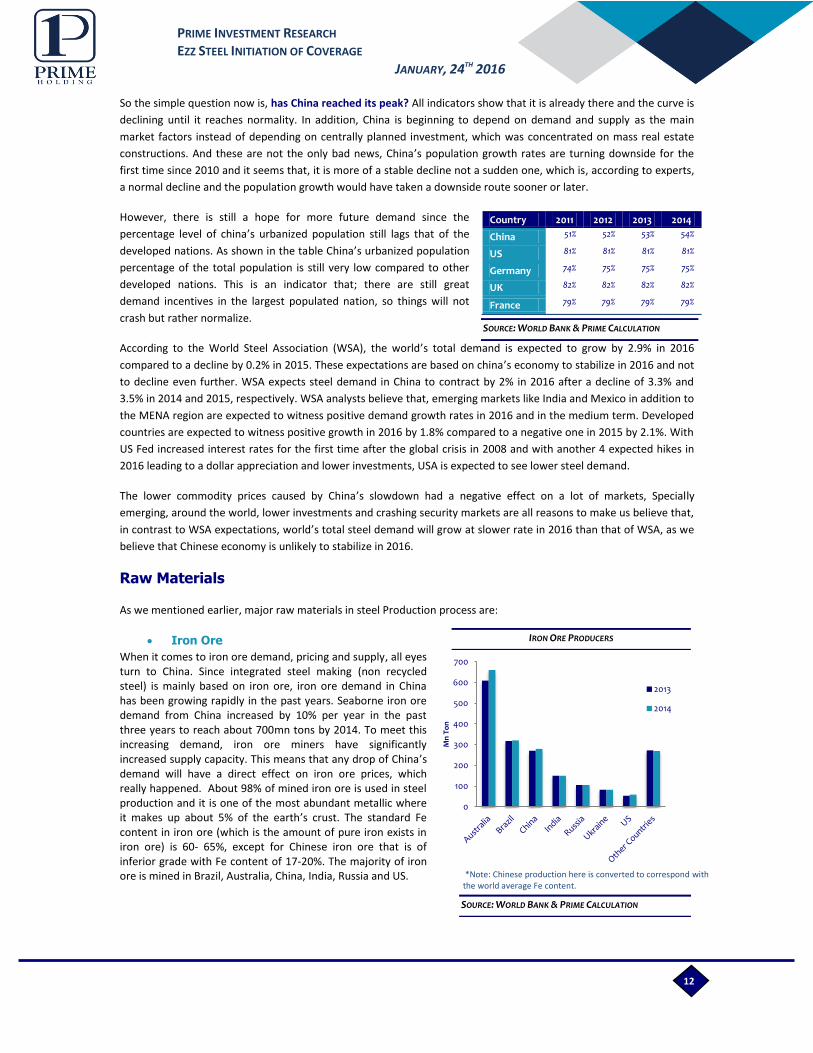
However, there is still a hope for more future demand since the
percentage level of china’s urbanized population still lags that of the
developed nations. As shown in the table China’s urbanized population
percentage of the total population is still very low compared to other
developed nations. This is an indicator that; there are still great
demand incentives in the largest populated nation, so things will not
crash but rather normalize.
According to the World Steel Association (WSA), the world’s total demand is expected to grow by 2.9% in 2016
compared to a decline by 0.2% in 2015. These expectations are based on china’s economy to stabilize in 2016 and not
to decline even further. WSA expects steel demand in China to contract by 2% in 2016 after a decline of 3.3% and
3.5% in 2014 and 2015, respectively. WSA analysts believe that, emerging markets like India and Mexico in addition to
the MENA region are expected to witness positive demand growth rates in 2016 and in the medium term. Developed
countries are expected to witness positive growth in 2016 by 1.8% compared to a negative one in 2015 by 2.1%. With
US Fed increased interest rates for the first time after the global crisis in 2008 and with another 4 expected hikes in
2016 leading to a dollar appreciation and lower investments, USA is expected to see lower steel demand.
The lower commodity prices caused by China’s slowdown had a negative effect on a lot of markets, Specially
emerging, around the world, lower investments and crashing security markets are all reasons to make us believe that,
in contrast to WSA expectations, world’s total steel demand will grow at slower rate in 2016 than that of WSA, as we
believe that Chinese economy is unlikely to stabilize in 2016.
Raw Materials
As we mentioned earlier, major raw materials in steel Production process are:
Iron Ore
When it comes to iron ore demand, pricing and supply, all eyes turn to China. Since integrated steel making (non recycled steel) is mainly based on iron ore, iron ore demand in China has been growing rapidly in the past years. Seaborne iron ore demand from China increased by 10% per year in the past three years to reach about 700mn tons by 2014. To meet this increasing demand, iron ore miners have significantly increased supply capacity. This means that any drop of China’s demand will have a direct effect on iron ore prices, which really happened. About 98% of mined iron ore is used in steel production and it is one of the most abundant metallic where it makes up about 5% of the earth’s crust. The standard Fe content in iron ore (which is the amount of pure iron exists in iron ore) is 60- 65%, except for Chinese iron ore that is of inferior grade with Fe content of 17-20%. The majority of iron ore is mined in Brazil, Australia, China, India, Russia and US.
Country 2011 2012 2013 2014
China 51% 52% 53% 54%
US 81% 81% 81% 81%
Germany 74% 75% 75% 75%
UK 82% 82% 82% 82%
France 79% 79% 79% 79%
0
100
200
300
400
500
600
700
Mn
To
n
2013
2014
*Note: Chinese production here is converted to correspond with the world average Fe content.

13
PRIME INVESTMENT RESEARCH EZZ STEEL INITIATION OF COVERAGE
JANUARY, 24TH 2016
IRON ORE EXPORTERS IRON ORE IMPORTERS
SOURCE: WSA & PRIME CALCULATIONS
IRON ORE PRICE
SOURCE: BLOOMBERG
Iron ore top producer is Australia followed by Brazil; the two countries together constitute about 50% of iron ore production around the world. Therefore, the largest iron ore producing companies Rio Tinto, Vale and BHP Billiton are located in both Australia and Brazil. China comes third in production by 15% of total production followed by India 8%, Russia 5%, Ukraine 4% and then U.S with 3%.
As the main producers, Australia and Brazil are also the top exporters of iron ore. Both countries constitute together
70% of the total iron ore exports. On the other hand, China dominates imports of iron ore, accounting for more than
60% of the world’s total imports of Iron ore.
With lower demand on iron ore by the main importer China, iron ore prices crashed from USD 133/ton in Jan 1st
2014
to USD 39.58/ton in January 1st
2016, declining by 70%. We expect that; iron ore prices will stay in the thirties for a
while and prices will not be lifted above the thirties before 2017. Our view is backed by the market share war
between the largest iron ore producers and the Chinese small ones. With the lowest cost producers BHP Billiton, Vale
and Rio Tinto want to dominate the Chinese market and throw small producers out of the market completely.
The main sources of iron ore supply to China are Vale (Brazilian company) ,Rio Tinto & BHP Billiton (Australian
companies); presenting about 60% of China’s iron ore imports which gave them a monopolistic pricing power over
iron ore. Iron ore supply increased, although
expectations of cuts in production in response to the
decline in Chinese demand. Large companies mainly
depended on cost cuts in order to meet plunging prices.
BHP Billiton increased its output of iron ore in the
second half of 2015 by 4%, although it reduced its
output of all other commodities like coal and copper.
Rio Tinto also showed increase in both iron ore
production and shipments by 11% in 9m 2015
compared to 9m 2014. The case was not so different
for Vale which increased its iron ore production by 5%
in 2015 compared to the same period in 2014. So if this
case of market share war maintained in 2016 coupled
with the lower Chinese demand for steel, we expect
that iron ore prices will plunge even more for 2016 and
start stabilizing by 2017, with the exit of high cost minors.
Source: WSA & Prime Calculations
Australia 46%
Brazil 24%
south africa 5%
Canada 3%
Ukraine 3%
Russia 2%
Other Countries
17%
China 64%
Rest of the world
36%
0
20
40
60
80
100
120
140
US
D/T
on
14
PRIME INVESTMENT RESEARCH EZZ STEEL INITIATION OF COVERAGE
JANUARY, 24TH 2016
STEEL SCRAP PRICE
SOURCE: BLOOMBERG
COKING COAL IMPORT PRICE IN CHINA
SOURCE: BLOOMBERG
GLOBAL STEEL PRICE
SOURCE: BLOOMBERG
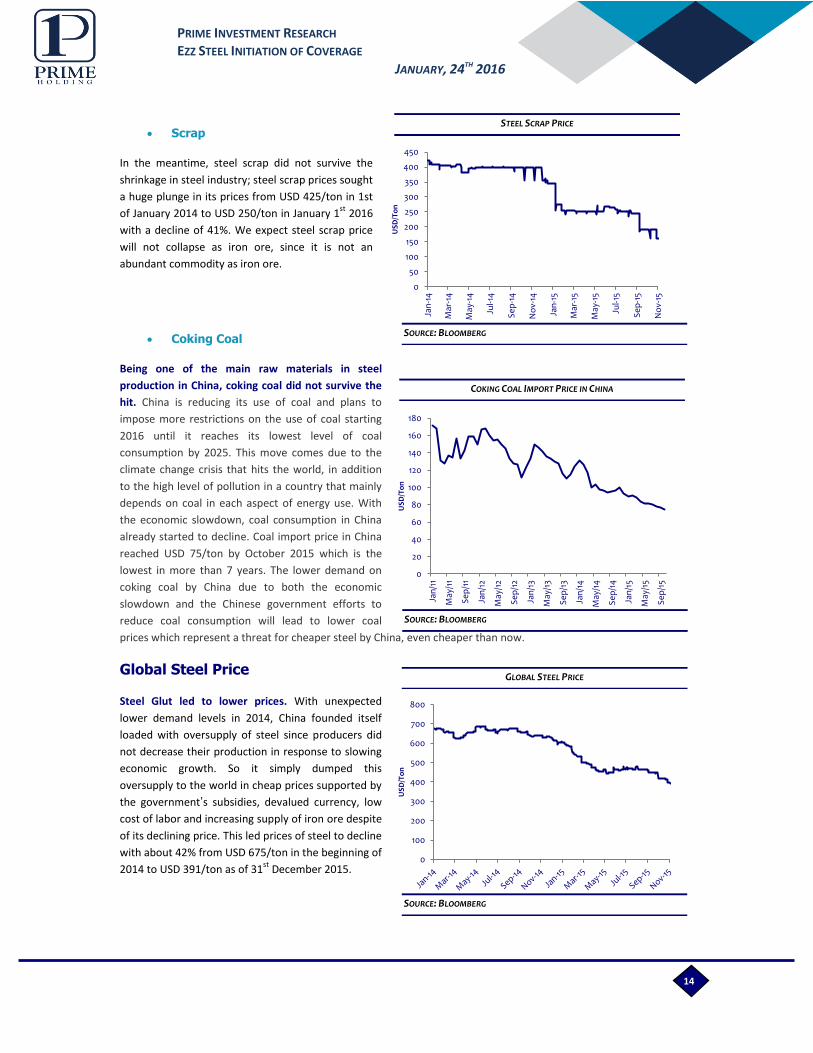
Scrap
In the meantime, steel scrap did not survive the
shrinkage in steel industry; steel scrap prices sought
a huge plunge in its prices from USD 425/ton in 1st
of January 2014 to USD 250/ton in January 1st
2016
with a decline of 41%. We expect steel scrap price
will not collapse as iron ore, since it is not an
abundant commodity as iron ore.
Coking Coal
Being one of the main raw materials in steel
production in China, coking coal did not survive the
hit. China is reducing its use of coal and plans to
impose more restrictions on the use of coal starting
2016 until it reaches its lowest level of coal
consumption by 2025. This move comes due to the
climate change crisis that hits the world, in addition
to the high level of pollution in a country that mainly
depends on coal in each aspect of energy use. With
the economic slowdown, coal consumption in China
already started to decline. Coal import price in China
reached USD 75/ton by October 2015 which is the
lowest in more than 7 years. The lower demand on
coking coal by China due to both the economic
slowdown and the Chinese government efforts to
reduce coal consumption will lead to lower coal
prices which represent a threat for cheaper steel by China, even cheaper than now.
Global Steel Price
Steel Glut led to lower prices. With unexpected
lower demand levels in 2014, China founded itself
loaded with oversupply of steel since producers did
not decrease their production in response to slowing
economic growth. So it simply dumped this
oversupply to the world in cheap prices supported by
the government’s subsidies, devalued currency, low
cost of labor and increasing supply of iron ore despite
of its declining price. This led prices of steel to decline
with about 42% from USD 675/ton in the beginning of
2014 to USD 391/ton as of 31st
December 2015.
0
20
40
60
80
100
120
140
160
180
Jan
/11
May
/11
Se
p/1
1
Jan
/12
May
/12
Se
p/1
2
Jan
/13
May
/13
Se
p/1
3
Jan
/14
May
/14
Se
p/1
4
Jan
/15
May
/15
Se
p/1
5
US
D/T
on
0
100
200
300
400
500
600
700
800
US
D/T
on
0
50
100
150
200
250
300
350
400
450
Jan
-14
Mar
-14
May
-14
Jul-1
4
Se
p-1
4
No
v-14
Jan
-15
Mar
-15
May
-15
Jul-1
5
Se
p-1
5
No
v-15
US
D/T
on

15
PRIME INVESTMENT RESEARCH EZZ STEEL INITIATION OF COVERAGE
JANUARY, 24TH 2016
STEEL PRODUCTION IN CHINA
SOURCE: BLOOMBERG & PRIME CALCULATIONS
In other words, while demand was faltering, steel production was not reduced enough in response to that.
Consequently, imported steel became attractive in many countries despite high freight costs. The increase in Chinese
steel exports is attributed to many reasons: 1- declining levels of demand in China. 2- Subsidies given to exporters
that reached 256% in some countries like USA. 3- Crashes in all raw materials costs. Noting that steel production in
China declined by only 1.9% in the first 11m of 2015 compared to the same period for 2014. For steel prices the
situation is unlikely to change soon. With declining Chinese demand for steel and increasing levels of steel
production and iron ore supply, global prices are expected to stay on the declining trend.
Backed by the depressed global prices, many steel producers suffered from the lower cost excess capacity of China,
which threatened the domestic production of steel in these countries. Thousands of workers lost their jobs in steel
mills around the world, many companies had to reduce capacities and shutting down mills whether temporarily or
permanently like Wisconsin steel in the United States. Chinese steel exports are estimated to be 100mn tons in 2015.
This spurred steel producers around the world to seek governmental intervention to protect the local industry, many
governments responded to steel makers and imposed tariffs on imported steel. Egypt imposed 8% tariff on imported
steel from China and Turkey, Brazil is considering hiking its tariff rate on steel from 8-14% to 5-20%. With 34% of US
mills became idle in 2015; the country is considering a plan to impose 256% tariffs on imported steel from China that
gets 256% subsidies from the Chinese authority. In the meantime, the EU imposed 5 year trade protection against
electric steel products from 5 countries namely; US, Russia, Japan, China and South Korea in order to curb
competition in the local markets.
Although the Chinese government signaled that it intends
to cut excess steel capacity to reduce the oversupply, we
expect that this is unlikely to happen at least in the short
run. And even if it happened it won’t be big enough to
curb massive exports by Chinese steel mills and lift prices
up again. With the end of the Chinese unprecedented
growth cycle that boosted steel demand for the last
decade it is uncertain what will take its place. The low
Chinese demand growth rates are expected to continue
for a long time, since it is very difficult to witness another
booming growth cycle as the one that we witnessed in
China and even if this happened it will take time to help in
the rebound process of steel market. However, many experts see India as the coming force that will take china’s place
and help boosting steel demand. This is unlikely in our opinion due to the huge differences between the two
countries, like political differences in the way that the country is ruled since China is a communist country where the
government controls all the resources which allows it to plan the required production instead of being based on
demand and supply. Planned economy in China allowed the government to direct resources for industrialization
sector to boost GDP growth, however, an economy that is more based on supply & demand will not do that.
Hence, we believe that, the current situation will be maintained for a while, with markets will take some time to get
used to the new demand levels in China and the low commodity prices especially for countries that mainly depends
on some of these commodities as a main source of income such as Australia with iron ore.
56 000
58 000
60 000
62 000
64 000
66 000
68 000
70 000
72 000
Jan Feb Mar Apr May Jun Jul Aug Sep Oct Nov
Th
ou
san
d T
on
2014
2015

16
PRIME INVESTMENT RESEARCH EZZ STEEL INITIATION OF COVERAGE
JANUARY, 24TH 2016
Egypt’s Steel Industry
An industry fighting too many opponents. Although the Egyptian steel market has a lot of advantages like; low cost
manpower and strong domestic demand, it is still faced by many obstacles. The Egyptian steel industry is currently in
a deadlock as it is struggling to survive faced by many challenges; we can set them as follows:
Energy crisis is the big deal here, the country is in a big trouble concerning natural gas supply after 25th of
January 2011 revolution, with the instability of the country causing investors to fly out of it. The main reason of
the crisis is the inability of the government to pay dues owed to foreign oil companies due to the depletion of
foreign reserves. This was faced by the suspension of production and exploration in Egypt by these companies.
The country is facing a real energy crisis since 2012 that reached its peak in 2014 and 2015. Many factories were
not able to operate specially in 3Q 2014 and some factories halted production for many days including EZDK’s
DRI facility that stopped operations for more than 50 days.
The government took a decision in 2014 to remove subsidies on energy sources over the upcoming five years
starting 2014. The decision included the increase of natural gas price for steel industry by 75% from 4
USD/mmbtu to 7 USD/mmbtu and electricity to be 33 piaster/kwh instead of 30 piaster/kwh and it will increase
gradually for 5 years till 2019.
Capital restrictions introduced in February to crush the FX black market, while firms struggled to open letters of
credit to import raw materials. In addition, the devaluation of the Egyptian pound increased cost of raw
materials for any industry that depends on imported raw materials. Not to mention the FX shortage in 2015
made it difficult to import raw materials.
Domestic steel manufacturers were not able to reap the fruits of declining raw material prices. As the cost of
production in the Egyptian steel market increased due to; subsidies removal, depreciated EGP and shortage of
NG, which led to a drop in utilization rates. In addition, declining global steel prices prevented local producers
from passing full increases in cost of production to the end consumer.
Chinese, Ukrainian and Turkish steel imports increased last year to be more than 600k tons. Turkish steel has
the main advantage over the other exporters to Egypt and over the local industry, as it is sold in relatively lower
prices considering of course the low transportation and freight costs since the distance between Egypt and
Turkey is only 1,100 kilometers. Price per ton of Turkish steel reached EGP 5,000 (post the devaluation of the
Egyptian pound against US dollar) after tariffs, transportation and freight costs compared to local steel which
was sold at more than EGP 5,200 (post the devaluation too).
Turkey’s new policy focuses on increasing exports to MENA region to cover the loss of markets like Iraq, where
its exports declined by more than 60% and other markets where Chinese steel exports dumped in with lower
prices. Note that imported steel from Turkey increased by 70% in the first nine months of 2015 to reach 359k
ton with further expectations that it will increase even more. This urged local companies to pressure the
government to impose tariffs on imported steel, the government finally responded and imposed import tariff of
8% on steel rebar for three years with at least EGP 408/ton in the first year and decreasing gradually in the
second and third years. This rate of tariff is considered not enough for local producers who called to impose
anti-dumping tariffs reaching 40% on rebar. We expect that, the government will respond to companies and will
impose higher tariffs on imported steel in the near future as almost all countries around the world took or
planning to take the same step, US for example is planning to impose imported tariffs reaching 256% as
mentioned before.
17
PRIME INVESTMENT RESEARCH EZZ STEEL INITIATION OF COVERAGE
JANUARY, 24TH 2016
EGYPT’S STEEL PRODUCTION
SOURCE: WSA & PRIME CALCULATIONS
EGYPT’S MONTHLY STEEL PRODUCTION
SOURCE: WSA & PRIME CALCULATIONS
SOURCE: WSA & PRIME CALCULATIONS
WORLD STEEL PRODUCTION
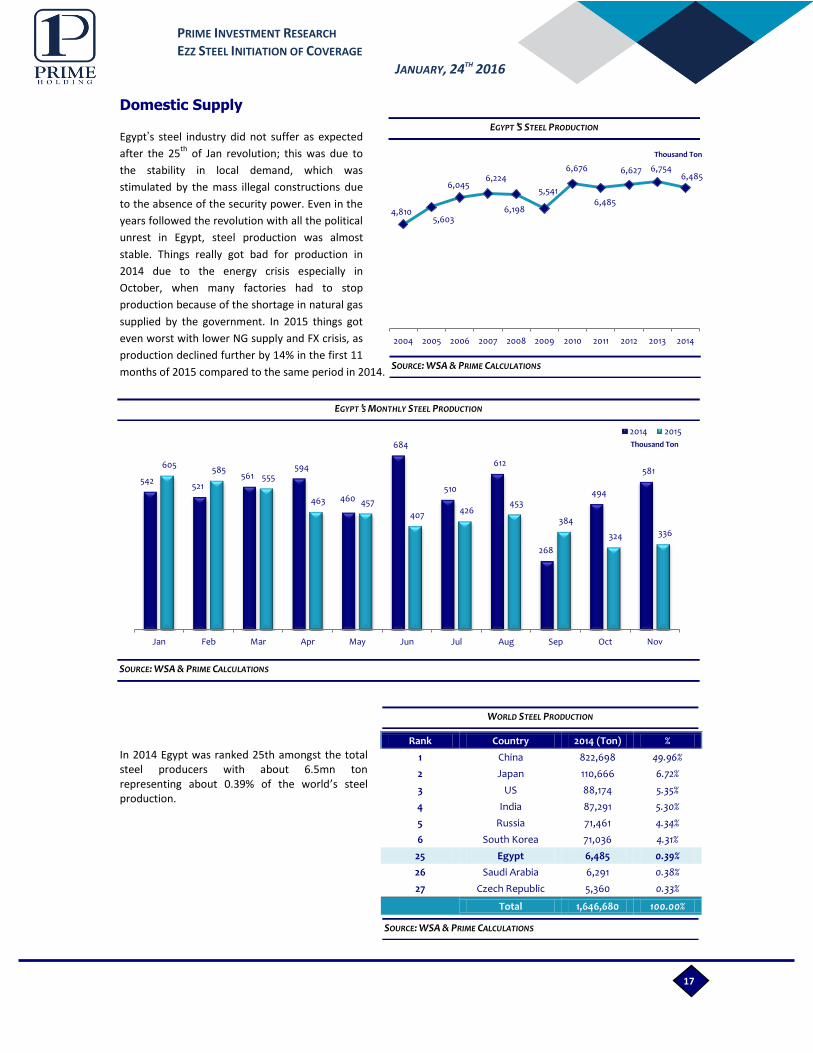
Domestic Supply
Egypt’s steel industry did not suffer as expected
after the 25th
of Jan revolution; this was due to
the stability in local demand, which was
stimulated by the mass illegal constructions due
to the absence of the security power. Even in the
years followed the revolution with all the political
unrest in Egypt, steel production was almost
stable. Things really got bad for production in
2014 due to the energy crisis especially in
October, when many factories had to stop
production because of the shortage in natural gas
supplied by the government. In 2015 things got
even worst with lower NG supply and FX crisis, as
production declined further by 14% in the first 11
months of 2015 compared to the same period in 2014.
In 2014 Egypt was ranked 25th amongst the total steel producers with about 6.5mn ton representing about 0.39% of the world’s steel production.
Rank Country 2014 (Ton) %
1 China 822,698 49.96%
2 Japan 110,666 6.72%
3 US 88,174 5.35%
4 India 87,291 5.30%
5 Russia 71,461 4.34%
6 South Korea 71,036 4.31%
25 Egypt 6,485 0.39%
26 Saudi Arabia 6,291 0.38%
27 Czech Republic 5,360 0.33%
Total 1,646,680 100.00%
4,810 5,603
6,045 6,224
6,198
5,541
6,676
6,485
6,627 6,754 6,485
2004 2005 2006 2007 2008 2009 2010 2011 2012 2013 2014
Thousand Ton
542 521
561 594
460
684
510
612
268
494
581 605
585 555
463 457
407 426
453
384
324 336
Jan Feb Mar Apr May Jun Jul Aug Sep Oct Nov
Thousand Ton
2014 2015

18
PRIME INVESTMENT RESEARCH EZZ STEEL INITIATION OF COVERAGE
JANUARY, 24TH 2016
FX shortage is not that bad. Despite all the negativity concerning the currency crisis, we believe that there is
something positive about it. Backed by this shortage of foreign currency, and Spurred by the desire to reduce imports
bill and achieve more control on it, the CBE issued some regulations: 1- Capital restrictions introduced in February. 2-
Increasing the required amount to be deposited in EGP to cover letters of credit up to 100% of the total value of letter
of credit from 50%. We believe that, even if local steel industry was affected by this, it had a much more severe effect
on steel importers. For example, a company like Ezz steel would face serious problems to get FX required from banks
to import raw materials, but as compared to importers of steel, Ezz steel is in a much better situation. As banks
provide foreign currency based on priority, where raw materials importers, like Ezz steel is in an advanced position
relative to finished steel importers. This will help curbing lower cost steel imports and will ease some of the pressure
on local steel prices.
The energy crisis is easing, that is what we believe. The government started to pay portions of the dues owed to
foreign oil firms, which reached more than USD 3bn in 2015 declining from more than USD 6bn in 2014. This spurred
many oil firms to restore their activities in the country, whether exploration or production. We believe that; the
energy crisis reached its peak in 2015, and factories will be able to operate in 2016 better than 2015, taking in
consideration low oil prices trading below USD 30 now, with expectations that it might reach USD 20 in 2016 (with
Iran resume exporting). These low prices helped to ease the cost of energy for the local government, allowing it to
import more NG shipments at lower cost. President El Sisi declared in November 2015, that; NG supply shortage is
over and factories will be able to operate normally starting November. In addition, household consumption eased in
4Q 2015 because of the end of summer overload, allowing the government to allocate more NG to industrial sector.
But would it be enough to return to the normal production levels and for factories to operate and make profits? Well
there are other problems like the devaluation of the Egyptian pound and the shortage of the US dollar that continue
to be main obstacles for companies that import raw materials.
Zohr an Industry Resurrection. The hopes to end the energy crisis got really high after ENI, an Italian energy group,
announced in August that; it had discovered the largest known gas field in the Mediterranean off the Egyptian coast
called “Zohr” field that could hold 30tn cubic feet of gas covering an area of about 100sq kilometers, with the
company adjusting later that it could be even bigger than expected. The government agreed with ENI’s CEO that; the
discovery will be completely allocated to the internal market in order to cover all the local needs and the stage of
exporting will probably come later. ENI’s plan was to start production by 2018, but the Egyptian government stated it
hopes that the production will start by 2017. The production will begin at 700mn to 1bn cubic feet per day increasing
to 2.7bn cubic feet per day by 2019. It is expected that the field will satisfy all the needs in the local market by 2018,
so we still believe that in the short run the shortage will continue to hit the industry but with less severity, as we
believe that; the government will prioritize household sector over the industrial one.

19
PRIME INVESTMENT RESEARCH EZZ STEEL INITIATION OF COVERAGE
JANUARY, 24TH 2016
EGYPT’S STEEL CONSUMPTION
SOURCE: WSA & PRIME CALCULATIONS
STEEL PRICES
SOURCE: CBE, BLOOMBERG & PRIME CALCULATIONS
STEEL EXPORTS
SOURCE: CBE & PRIME CALCULATIONS
Consumption
Egypt’s consumption of steel is about 0.66% of the world’s total consumption, with 10mn tons in 2014 ranked 23
rd amongst the
global steel consumers. The key driver for this consumption is real estate sector since Egypt is one of the heavy populated countries in the MENA region with population that reached about 90mn people by December 2015. Although our negative outlook for global steel demand especially in China, we have positive outlook for steel demand in Egypt. We expect demand to witness moderate growth rates, not booming of course, or worst case to be flat but it will maintain its high levels. Egypt witnessed a strong demand in the past years, although political and economical unrest. We are positive on local demand outlook and we believe that the problem is not in demand; however, the problem is in the local industry’s ability to meet this demand which led to massive imports of steel from countries like China and Turkey.
Local Steel Prices
Prices increased largely in 2013 by 11%, caused mainly by the devaluation of the local currency against US dollar by more than 70 piaster. In 2014 the local price stood at the same levels as 2013, affected by the plunge in global prices and competition by imported steel from China and Turkey in relatively lower prices. The lower raw materials cost in 2015 pushed prices down even further; however, Egypt’s steel is still selling at a premium reaching 20% relative to global steel price coupled with the devaluation in EGP. In relation, cheap imported steel, especially from Turkey, helped to depress the local prices. Although the lower raw materials cost can be considered as an advantage for the local steel mills, but this advantage cannot be felt by the companies because of their inability to increase prices to cover the increase in both energy and electricity prices.
Exports are not any better, after 25th of January 2011 revolution exports of steel declined with about 50% and things did not get any better after that, with our expectations that exports will decline even further this year 2015 and will stay low for many years to come, due to higher cost of producing steel locally than in exporting countries.
Country 2014 %
China 711 46.24%
India 75 4.90%
Japan 68 4.39%
NAFTA 145 9.41%
EU 147 9.55%
Other Asia 155 10.06%
Other Europe 73 4.75%
CIS 57 3.68%
Africa 64 4.16%
Middle East 52 3.38%
Central and south America 48 3.13%
Egypt 10 0.66%
Australia & New Zealand 7 0.48%
World 1,537 100%
0
1000
2000
3000
4000
5000
6000
2009 2010 2011 2012 2013 2014 2015
Local Price EGP/Ton Global Price EGP/Ton
-
100.0
200.0
300.0
400.0
500.0
600.0
700.0
800.0
Mn
US
D
20
PRIME INVESTMENT RESEARCH EZZ STEEL INITIATION OF COVERAGE
JANUARY, 24TH 2016
EZZ STEEL’S TIMELINE
SOURCE: EZZ STEEL
SHAREHOLDERS STRUCTURE
SOURCE: EZZ STEEL
EGYPT’S LONG STEEL MARKET
SOURCE: EZZ STEEL
Company Profile
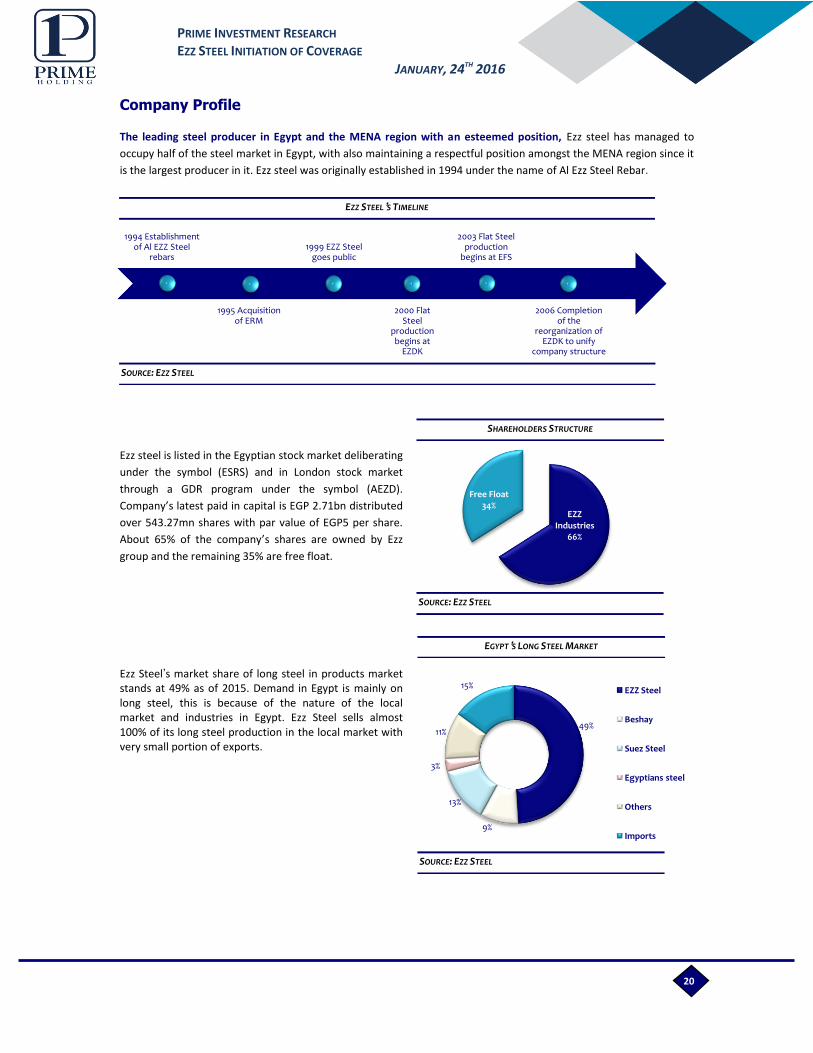
The leading steel producer in Egypt and the MENA region with an esteemed position, Ezz steel has managed to
occupy half of the steel market in Egypt, with also maintaining a respectful position amongst the MENA region since it
is the largest producer in it. Ezz steel was originally established in 1994 under the name of Al Ezz Steel Rebar.
Ezz steel is listed in the Egyptian stock market deliberating
under the symbol (ESRS) and in London stock market
through a GDR program under the symbol (AEZD).
Company’s latest paid in capital is EGP 2.71bn distributed
over 543.27mn shares with par value of EGP5 per share.
About 65% of the company’s shares are owned by Ezz
group and the remaining 35% are free float.
Ezz Steel’s market share of long steel in products market stands at 49% as of 2015. Demand in Egypt is mainly on long steel, this is because of the nature of the local market and industries in Egypt. Ezz Steel sells almost 100% of its long steel production in the local market with very small portion of exports.
1994 Establishment of Al EZZ Steel
rebars
1995 Acquisition of ERM
1999 EZZ Steel goes public
2000 Flat Steel
production begins at
EZDK
2003 Flat Steel production
begins at EFS
2006 Completion of the
reorganization of EZDK to unify
company structure
EZZ Industries
66%
Free Float 34%
49%
9%
13%
3%
11%
15% EZZ Steel
Beshay
Suez Steel
Egyptians steel
Others
Imports
21
PRIME INVESTMENT RESEARCH EZZ STEEL INITIATION OF COVERAGE
JANUARY, 24TH 2016
EGYPT’S FLAT STEEL MARKET
SOURCE: EZZ STEEL
EZZ STEEL’S PRODUCTS
SOURCE: EZZ STEEL
SOURCE: EZZ STEEL
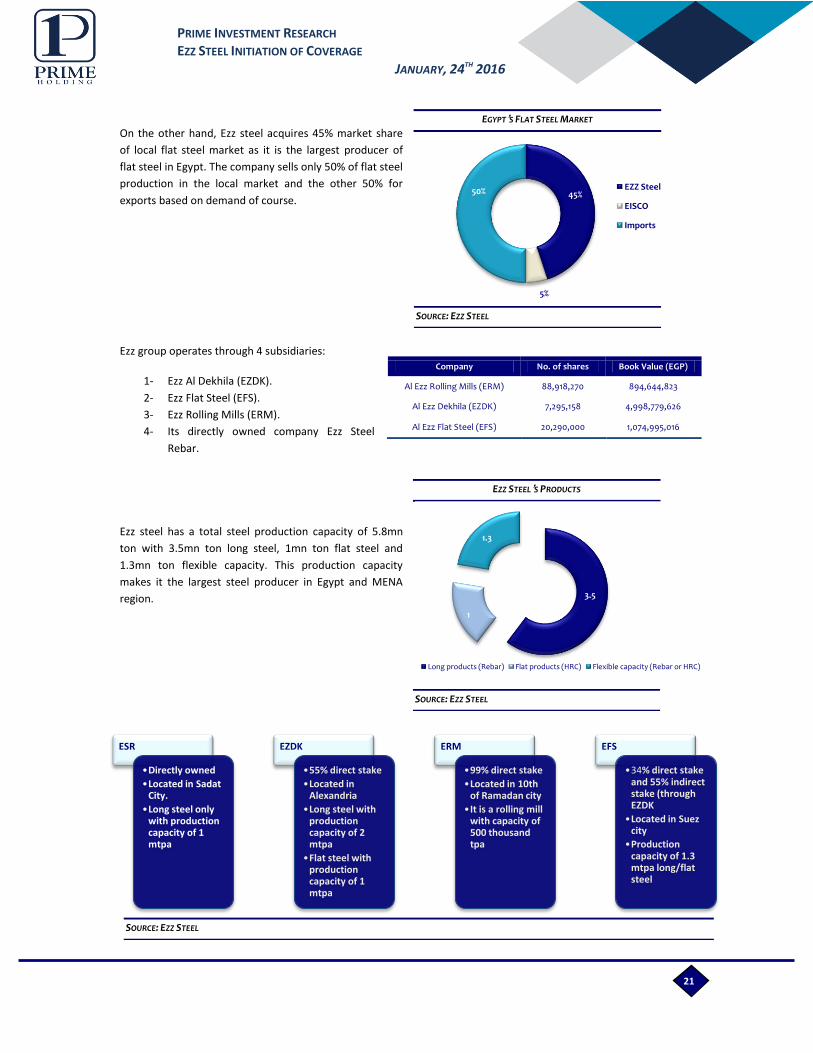
On the other hand, Ezz steel acquires 45% market share
of local flat steel market as it is the largest producer of
flat steel in Egypt. The company sells only 50% of flat steel
production in the local market and the other 50% for
exports based on demand of course.
Ezz group operates through 4 subsidiaries:
1- Ezz Al Dekhila (EZDK).
2- Ezz Flat Steel (EFS).
3- Ezz Rolling Mills (ERM).
4- Its directly owned company Ezz Steel
Rebar.
Ezz steel has a total steel production capacity of 5.8mn
ton with 3.5mn ton long steel, 1mn ton flat steel and
1.3mn ton flexible capacity. This production capacity
makes it the largest steel producer in Egypt and MENA
region.
Company No. of shares Book Value (EGP)
Al Ezz Rolling Mills (ERM) 88,918,270 894,644,823
Al Ezz Dekhila (EZDK) 7,295,158 4,998,779,626
Al Ezz Flat Steel (EFS) 20,290,000 1,074,995,016
Source: Company Data
3.5
1
1.3
Long products (Rebar) Flat products (HRC) Flexible capacity (Rebar or HRC)
ESR
•Directly owned
•Located in Sadat City.
•Long steel only with production capacity of 1 mtpa
EZDK
•55% direct stake
•Located in Alexandria
•Long steel with production capacity of 2 mtpa
•Flat steel with production capacity of 1 mtpa
ERM
•99% direct stake
•Located in 10th of Ramadan city
•It is a rolling mill with capacity of 500 thousand tpa
EFS
•34% direct stake and 55% indirect stake (through EZDK
•Located in Suez city
•Production capacity of 1.3 mtpa long/flat steel
45%
5%
50% EZZ Steel
EISCO
Imports

22
PRIME INVESTMENT RESEARCH EZZ STEEL INITIATION OF COVERAGE
JANUARY, 24TH 2016
EZDK SHAREHOLDERS STRUCTURE
SOURCE: EZZ STEEL
EFS BUSINESS STRUCTURE
SOURCE: EZZ STEEL
Ezz Al Dekhila (EZDK) is the major source of profit for Ezz group; it represents about 52% of Ezz steel’s total
production capacity and deliberates in the Egyptian Stock Market under the symbol (IRAX). It is the only fully
integrated steel producer in Ezz group and Egypt backed by 3.2mn tpa production capacity of DRI supporting 3mn tpa
of steel production (2mn tpa Rebar and 1mn tpa HRC).
EZDK adapts a high efficient unique production process not
only in Egypt but in the whole world where only about 4% of
the world steel producers use the same technique. This
process is called DRI method; where iron ore pellets are
introduced to a direct reduction plant where a certain
chemical process happens that ends with Direct Reduced Iron
or DRI. The DRI then is melted in the melt shop, resulting in
slabs or billets that then get to rolling mills to give long or flat
steel. The main advantage of this production process is that it
mainly depends on the cheaper available raw materials; iron
ore and natural gas compared to steel scrap and coal.
The DRI lower cost advantage compared to scrap makes EZDK achieve the highest profit margins compared to its
peers and other subsidiaries of Ezz steel. EZDK is the only facility that exports steel, the level of exports deteriorated
in 2014 to record 17% of sales only as result of the local crisis in production and the slowdown in the global demand.
EZDK was affected the most by the energy crisis. DRI plants depend on natural gas as a factor of production not a
source of energy, so NG cannot be replaced by coal or any other source of energy. With the unavailability of NG, EZDK
was unable to produce DRI; hence, it had to import higher cost scrap to continue production which led to higher cost
of production affecting the company’s profitability.
Ezz Flat Steel (EFS) was mainly designed to target exports
through the production of Flat Steel with production capacity
of 1.3mn tpa, but with the lower demand on flat steel and
higher production costs due its dependence on scrap as the
main raw material it was upgraded in 2012 to produce long
steel too with the same production capacity, so it has flexible
production of 1.3mn tpa of long steel or flat steel.
Even with the flexibility in production EFS still incur losses
because of its dependence on the high cost scrap. A new DRI
plant was constructed to support EFS with its required DRI
which is supposed to increase utilization rates and lowering
costs of production.
Ezz Steel Rebar (ESR) is the directly owned factory by Ezz Steel with a production capacity of one million tpa, while Ezz
Rolling Mill (ERM) is a rolling mill that purchase billets and turn it into long steel with an annual capacity of 0.5mn
ton. As EFS, ESR depends on scrap as the main raw material in production.
Ezz secured two additional DRI licenses with EGP 660mn in the beginning of 2014 (one of them is returned to the
government), construction of one DRI plant at El Ain El Sokhna is over with investments costs of about USD 550mn
financed through 70% debt and 30% equity. The new DRI facility is expected to add an additional production capacity
of DRI equals to 1.9mn tpa that will mainly support production of EFS and the remainder will support ESR. This will
increase the level of integration in the two facilities to be fully integrated as EZDK.
55%
11%
6%
6%
23%
Ezz steel
National Investment bank
Al Ahly Capital Holding
Governmental Social Insurance Fund
Others
55%
34%
11%
EZDK
Ezz Steel
state owned banks (NBE,BM)
23
PRIME INVESTMENT RESEARCH EZZ STEEL INITIATION OF COVERAGE
JANUARY, 24TH 2016
STEEL SALES STEEL PRODUCTION
SOURCE: EZZ STEEL
COGS & COGS/SALES COGS/SALES
SOURCE: EZZ STEEL
Financial Overview
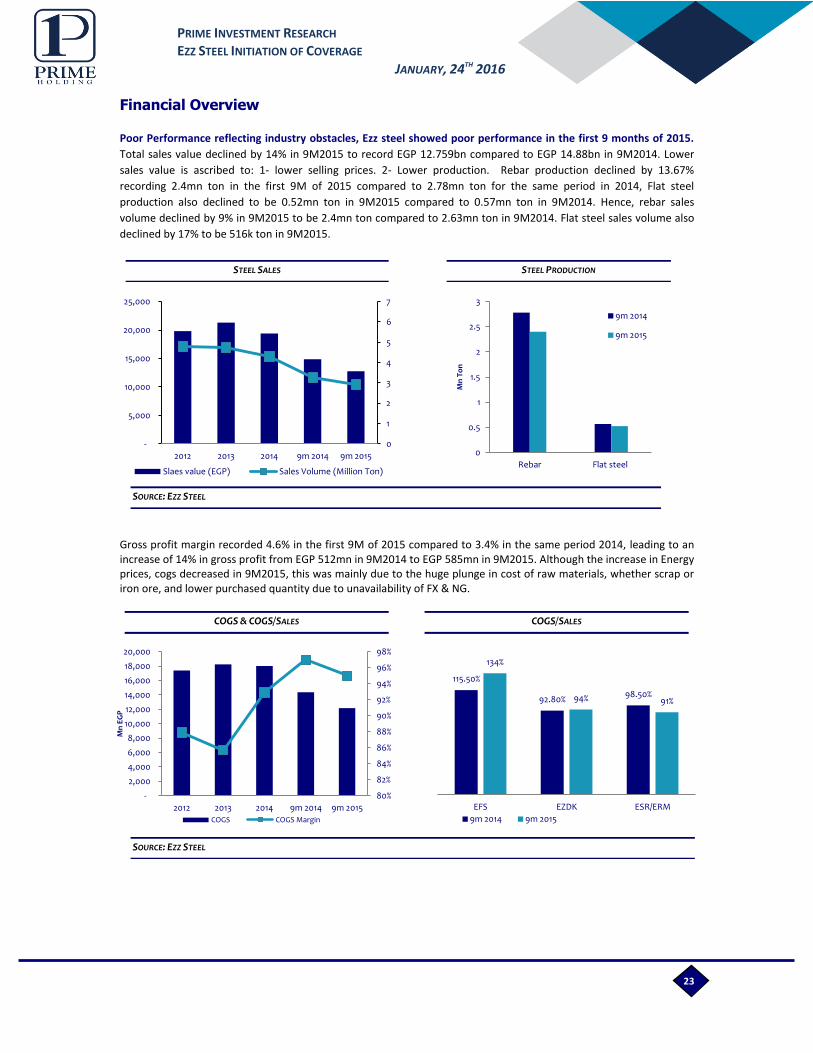
Poor Performance reflecting industry obstacles, Ezz steel showed poor performance in the first 9 months of 2015.
Total sales value declined by 14% in 9M2015 to record EGP 12.759bn compared to EGP 14.88bn in 9M2014. Lower
sales value is ascribed to: 1- lower selling prices. 2- Lower production. Rebar production declined by 13.67%
recording 2.4mn ton in the first 9M of 2015 compared to 2.78mn ton for the same period in 2014, Flat steel
production also declined to be 0.52mn ton in 9M2015 compared to 0.57mn ton in 9M2014. Hence, rebar sales
volume declined by 9% in 9M2015 to be 2.4mn ton compared to 2.63mn ton in 9M2014. Flat steel sales volume also
declined by 17% to be 516k ton in 9M2015.
Gross profit margin recorded 4.6% in the first 9M of 2015 compared to 3.4% in the same period 2014, leading to an increase of 14% in gross profit from EGP 512mn in 9M2014 to EGP 585mn in 9M2015. Although the increase in Energy prices, cogs decreased in 9M2015, this was mainly due to the huge plunge in cost of raw materials, whether scrap or iron ore, and lower purchased quantity due to unavailability of FX & NG.
0
1
2
3
4
5
6
7
-
5,000
10,000
15,000
20,000
25,000
2012 2013 2014 9m 2014 9m 2015
Slaes value (EGP) Sales Volume (Million Ton)
Source: Company Data
0
0.5
1
1.5
2
2.5
3
Rebar Flat steel M
n T
on
9m 2014
9m 2015
80%
82%
84%
86%
88%
90%
92%
94%
96%
98%
-
2,000
4,000
6,000
8,000
10,000
12,000
14,000
16,000
18,000
20,000
2012 2013 2014 9m 2014 9m 2015
Mn
EG
P
COGS COGS Margin
115.50%
92.80% 98.50%
134%
94% 91%
EFS EZDK ESR/ERM
9m 2014 9m 2015

24
PRIME INVESTMENT RESEARCH EZZ STEEL INITIATION OF COVERAGE
JANUARY, 24TH 2016
EBITDA & EBITDA MARGIN
SOURCE: EZZ STEEL
NET PROFIT & NET PROFIT MARGIN
SOURCE: EZZ STEEL
DEBT/EQUITY
SOURCE: EZZ STEEL
EBITDA recorded EGP 533mn for 9M2015 compared to EGP 504mn for 9M2014, an increase of %5.75 y.o.y. Accordingly, EBITDA margin increased to be 4.17% from 3.38% in the same period 2014. This is mainly because of the lower cost of raw materials leading to lower cogs.
The company’s net loss after minority recorded EGP
509mn in 9M2015 compared to EGP 461mn in
9M2014. Despite the higher GPM in 9M2015
compared to that of 9M2014, the company made
higher net loss. This is because of the increase in
interest expenses by EGP 200mn to record EGP
872mn.
High leverage risk. In 9M2015 debt/equity ratio
registered 2.89x compared to 2.04x in 9M2014. There
is no doubt that one of the major risks of Ezz steel is
its heavy weight of debt; which was increasing
through time with more capex used to finance the
new DRI plant. But with the completion of the DRI
plant and with no further expectations for major
investments we expect that, these high levels of debts
will ease through time with higher levels of debts
serving, which will also affect negatively our expected
bottom line over the coming three years.
0.00%
2.00%
4.00%
6.00%
8.00%
10.00%
12.00%
-
500
1,000
1,500
2,000
2,500
2012 2013 2014 9m 2014 9m 2015
Mn
EG
P
EBITDA EBITDA Margin
-5%
-4%
-3%
-2%
-1%
0%
1%
2%
3%
(1,000)
(800)
(600)
(400)
(200)
-
200
400
600
2012 2013 2014 9m 2014 9m 2015
Mn
EG
P
Net profit(loss) Net profit(loss) margin
0
0.5
1
1.5
2
2.5
3
3.5
2012 2013 2014 9m 2015

25
PRIME INVESTMENT RESEARCH EZZ STEEL INITIATION OF COVERAGE
JANUARY, 24TH 2016

26
PRIME INVESTMENT RESEARCH EZZ STEEL INITIATION OF COVERAGE
JANUARY, 24TH 2016
PRIME SALES TEAM
Hassan Samir Managing Director
+202 3300 5611 [email protected]
Mohamed Ezzat Head of Sales & Branches
+202 3300 5784 [email protected]
Shawkat Raslan Heliopolis Branch Manager
+202 3300 5110 [email protected]
Amr Saber Team Head-Institutions Desk
+202 3300 5659 [email protected]
Amr Alaa, CFTe Manager
+202 3300 5609 [email protected]
Mohamed Elmetwaly Manager
+202 3300 5610 [email protected]
Emad Elsafoury Manager
+202 3300 5624 [email protected]
RESEARCH TEAM
+202 3300 5728
HEAD OFFICE PRIME SECURITIES S.A.E. 2 Wadi El Nil St., Liberty Tower, 7th-8th Floor, Mohandessin, Giza, Egypt Tel: +202 33005700/770/650/649 Fax: +202 3760 7543
Disclaimer Information included in this report has no regard to specific investment objectives, financial situation, advices or particular needs of the report users.
The report is published for information purposes only and is not to be construed as a solicitation or an offer to buy or sell any securities or related financial instruments. Unless specifically stated otherwise, all price information is only considered as indicator.
No express or implied representation or guarantee is provided with respect to completeness, accuracy or reliability of information included in this report.
Past performance is not necessarily an indication of future results. Fluctuation of foreign currency rates of exchange may adversely affect the value, price or income of any products mentioned in this report.
Information included in this report should not be regarded by report users as a substitute for the exercise of their own due diligence and analysis based on own assessment and judgment criteria. Any opinions given are subject to change without notice and may significantly differ or be contrary to opinions expressed by other Prime business areas as a result of using different assumptions and criteria. Prime Group is under no obligation responsible to update or keep current the information contained herein.
Prime Group, its directors, officers, employees or clients may have or have had interests or long or short positions in the securities and/or currencies referred to herein, and may at any time make purchases and/or sales in them as principal or agent.
Prime Group, its related entities, directors, employees and agents accepts no liability whatsoever for any loss or damage of any kind arising from the use of all or part of these information included in this report. Certain laws and regulations impose liabilities which cannot be disclaimed. This disclaimer shall, in no way, constitute a waiver or limitation of any rights a person may have under such laws and/or regulations.
Furthermore, Prime Group or any of the group companies may have or have had a relationship with or may provide or have provided other services, within its objectives to the relevant companies. Prime Group 2016 all rights reserved. You are hereby notified that distribution and copying of this document is strictly prohibited without the prior approval of Prime Group.