EyeMMV toolbox: An eye movement post-analysis tool based ...
10
Journal of Eye Movement Research 7(1):1, 1-10 1 Introduction Eye tracking is a tool in scientific fields addressing the study of human vision and perception. Eye move- ment analysis produces indications for the understanding of human vision. The human eyes make successive movements during the observation of a visual scene or display. A fixation occurs at the moment when the eyes remain relatively stationary in a position (Poole & Ball, 2005). This moment is characterized by the miniature movements of tremors, drifts and microsaccades (Martinez-Conde, Macknik, & Hubel, 2004). In practice, the analysis considers as given fact that fixations happen in discriminant points having limited duration and disper- sion. The process of identifying fixations among eye movement protocols can have a great impact on higher- level analysis (Salvucci & Goldberg, 2000). The result of the process of identifying fixations is typically a sequence of the position, the onset time and the duration of each fixation (Salvucci, 2000). The recording of a subject's eye movements provides objective and quantitative evidence for the analysis of visual and attentional processes (Duchowski, 2002). Eye tracking has been used in a number of studies from dif- ferent research areas such as neuroscience, psychology, human and computer interaction (HCI). Specific applica- tions are well summarized in several studies (e.g., Duchowski, 2002; Richardson, 2004; Duchowski, 2007). The main measurements of eye tracking methodology EyeMMV toolbox: An eye movement post-analysis tool based on a two-step spatial dispersion threshold for fixation identification Vassilios Krassanakis National Technical University of Athens Vassiliki Filippakopoulou National Technical University of Athens Byron Nakos National Technical University of Athens Eye movement recordings and their analysis constitute an effective way to examine visual perception. There is a special need for the design of computer software for the perform- ance of data analysis. The present study describes the development of a new toolbox, called EyeMMV (Eye Movements Metrics & Visualizations), for post experimental eye movement analysis. The detection of fixation events is performed with the use of an intro- duced algorithm based on a two-step spatial dispersion threshold. Furthermore, EyeMMV is designed to support all well-known eye tracking metrics and visualization techniques. The results of fixation identification algorithm are compared with those of an algorithm of dispersion-type with a moving window, imported in another open source analysis tool. The comparison produces outputs that are strongly correlated. The EyeMMV software is de- veloped using the scripting language of MATLAB and the source code is distributed through GitHub under the third version of GNU General Public License (link: https://github.com/krasvas/EyeMMV). Keywords: Eye movement analysis, fixation identification, eye movement metrics, eye tracking data visualization DOI 10.16910/jemr.7.1.1 ISSN 1995-8692 This article is licensed under a Creative Commons Attribution 4.0 International license.
Transcript of EyeMMV toolbox: An eye movement post-analysis tool based ...

Journal of Eye Movement Research 7(1):1, 1-10
1
Introduction
Eye tracking is a tool in scientific fields addressing the study of human vision and perception. Eye move-ment analysis produces indications for the understanding of human vision. The human eyes make successive movements during the observation of a visual scene or display. A fixation occurs at the moment when the eyes remain relatively stationary in a position (Poole & Ball, 2005). This moment is characterized by the miniature movements of tremors, drifts and microsaccades (Martinez-Conde, Macknik, & Hubel, 2004). In practice, the analysis considers as given fact that fixations happen in discriminant points having limited duration and disper-
sion. The process of identifying fixations among eye movement protocols can have a great impact on higher-level analysis (Salvucci & Goldberg, 2000). The result of the process of identifying fixations is typically a sequence of the position, the onset time and the duration of each fixation (Salvucci, 2000).
The recording of a subject's eye movements provides objective and quantitative evidence for the analysis of visual and attentional processes (Duchowski, 2002). Eye tracking has been used in a number of studies from dif-ferent research areas such as neuroscience, psychology, human and computer interaction (HCI). Specific applica-tions are well summarized in several studies (e.g., Duchowski, 2002; Richardson, 2004; Duchowski, 2007). The main measurements of eye tracking methodology
EyeMMV toolbox: An eye movement post-analysis tool based on a two-step
spatial dispersion threshold for fixation identification
Vassilios Krassanakis National Technical University of Athens
Vassiliki Filippakopoulou National Technical University of
Athens
Byron Nakos National Technical University of
Athens
Eye movement recordings and their analysis constitute an effective way to examine visual perception. There is a special need for the design of computer software for the perform-ance of data analysis. The present study describes the development of a new toolbox, called EyeMMV (Eye Movements Metrics & Visualizations), for post experimental eye movement analysis. The detection of fixation events is performed with the use of an intro-duced algorithm based on a two-step spatial dispersion threshold. Furthermore, EyeMMV is designed to support all well-known eye tracking metrics and visualization techniques. The results of fixation identification algorithm are compared with those of an algorithm of dispersion-type with a moving window, imported in another open source analysis tool. The comparison produces outputs that are strongly correlated. The EyeMMV software is de-veloped using the scripting language of MATLAB and the source code is distributed through GitHub under the third version of GNU General Public License (link: https://github.com/krasvas/EyeMMV).
Keywords: Eye movement analysis, f ixation identification, eye movement metrics, eye tracking data visualization
DOI 10.16910/jemr.7.1.1 ISSN 1995-8692This article is licensed under aCreative Commons Attribution 4.0 International license.
Journal of Eye Movement Research Krassanakis, V., Filippakopoulou, V., & Nakos, B. (2014) 7(1):1, 1-10 EyeMMV toolbox: An eye movement post-analysis tool
2
include fixations and saccades while multiple derived metrics from main measurements can be used (Poole & Ball, 2005).
Both main and derived metrics are dependent on crite-ria related to different research targets. Goldberg and Kotval (1998) classify metrics of the eye movements for the evaluation of displays. Jacob and Karn (2003) present particular examples for the use of eye movement metrics in usability studies. Furthermore, Poole and Ball (2005) suggest the contribution of specific metrics in several research studies. Derived metrics seem to be a valuable process in experimental studies related to visual tasks and searches. Moreover, the development of methods and techniques for gaze data visualization is also considered very important for the analysis and evaluation processes.
Salvucci and Goldberg (2000) propose a basic taxon-omy of algorithms for fixation identification. In order to distinguish each type, they identify several criteria based on spatial and temporal characteristics of fixations. Their criteria have velocity-based, dispersion-based and area-based attributes for spatial characteristics while the crite-ria that are related to temporal characteristics are the du-ration sensitivity and the local adaption of the algorithms. Salvucci and Goldberg (2000) evaluate and compare fixa-tion identification algorithms and suggest that velocity-based and dispersion-based algorithms provide equivalent performance, while area-based algorithms seem to be more restrictive. Furthermore, their approach clearly demonstrates that the temporal information and its local adaption are very important. The family of dispersion-based algorithms (I-DT) can be found in commercial software including ASL, SMI, Tobii Technology, while other software platforms such us EyeLink combine veloc-ity-based algorithms with criteria related to acceleration and motion thresholds (Nyström & Holmqvist, 2010).
Different tools have been developed in order to im-plement specific approaches in eye movement analysis, such as eSeeTrack that examines patterns of sequential gaze recordings (Tsang, Tory, & Swindells, 2010), or in order to be adapted in existing tools, such as GazeTrack-erTM (Lankford, 2000). Additionally, most commercial eye trackers come with appropriate software in order to implement the process of data capturing and analysis. Unfortunately, commercial software platforms are usually proprietary, non extensible and non modifiable (Gitel-man, 2002). The development and free distribution of eye movement analysis tools, such as ILAB (Gitelman,
2002), OGAMA (Voßkühler, Nordmeier, Kuchinke, & Jacobs, 2008) and GazeAlyze (Berger, Winkels, Lischke, & Hoppner, 2012), can help researchers to investigate different algorithms or parameters in their analysis of visual process. Many studies are examining the most ap-propriate values of the parameters and thresholds related to the methodology of eye tracking (see for example Shic, Scassellati, and Chawarska (2008) and Blignaut, (2009)) (e.g., threshold in an algorithm for fixation identifica-tion). Software modification has proved to encourage users to improve or enrich existing tools. An overview of freely available eye movement analysis tools is presented in Table 1.
Table 1 An overview of the freely available tools appropriate for the performance of eye movement analysis.
Analysis tool Developers
ILAB Eyelink Toolbox iComp openEyes eyePatterns ASTEF iComponent OGAMA ITU Gaze Tracker GazeAlyze EHCA Toolbox GazeParser
Gitelman (2002) Cornelissen, Peters, and Palmer (2002) Heminghous and Duchowski (2006) Li, Badcock and Parkhurst (2006) West, Haake, Rozanski and Karn (2006) Camilli, Nacchia, Terenzi, and Di Nocera (2008) Spakov and Miniotas (2008) Voßkühler et al. (2008)
San Agustin, Mollenbach, and Barret (2010) Berger et al. (2012) Schwab, Würmle, and Altorfer (2012) Sogo (2013)
Most of the free distributed tools consist of a Graphi-cal User Interface (GUI). Although the existence of a GUI is able to improve the interaction between user and software, the process of software modification in order to extend the software’s functions to specific research stud-ies is more difficult. Additionally, most of the existing tools require a special format of the analysis datasets. The execution of a freely distributed tool must be possible independently from the installed operating system (Win-dows, Linux or Mac OS).
In the present study a new toolbox is developed called EyeMMV (Eye Movements Metrics & Visualizations),
DOI 10.16910/jemr.7.1.1 ISSN 1995-8692This article is licensed under aCreative Commons Attribution 4.0 International license.
Journal of Eye Movement Research Krassanakis, V., Filippakopoulou, V., & Nakos, B. (2014) 7(1):1, 1-10 EyeMMV toolbox: An eye movement post-analysis tool
3
for post experimental eye movement analysis. The execu-tion of EyeMMV toolbox is completed by use of the in-stallation of MATLAB from MathWorks®. Therefore, the developed software can be executed in every operating system (Windows, Linux or Mac OS) where MATLAB is installed. EyeMMV toolbox consists of a list of MAT-LAB functions. The list involves functions for fixations identification, metrics analysis, data visualizations and ROI (region of interest) analysis. The identification of fixations is implemented with an algorithm that is based on two spatial parameters and one temporal constraint. In the introduced algorithm the dispersion is calculated by applying a “two-steps” spatial threshold. In both steps, the records are tested comparing the Euclidean distance from a mean point. It means that the spatial threshold is defined through a circle and not through a rectangle, as usually done in I-DT algorithms (Salvucci & Goldberg, 2000; Nyström & Holmqvist, 2010). The implementation of a second spatial parameter in the computation of fixa-tion centers can be used in order to remove the noise of eye tracking data, which is the sensitive point in the per-formance of I-DT algorithms (Nyström & Holmqvist, 2010). An example is presented in order to demonstrate how to use the toolbox and exploit its abilities. In the foregoing example, post-experimental analysis is per-formed using eye-tracking data during the observation of stimulus composed of nine fixed targets. The computa-tion of fixation centers is also performed using OGAMA software (Voßkühler et al., 2008) in order to estimate the differences occurring between the introduced algorithm and the algorithm used by OGAMA.
Methods EyeMMV toolbox is designed and implemented with
the scripting language of MATLAB. EyeMMV enlists several MATLAB functions to be used for the processes needed. Specifically, the supported modules of the tool-box include functions for fixation identification among eye tracking raw data, complete analysis of eye move-ments metrics, heatmap and raw data visualizations, visu-alizations of main and derived metrics, and ROI (region of interest) analysis. The use of MATLAB environment is considered necessary for the execution of EyeMMV toolbox. The functions of the toolbox can be easily em-bedded in every MATLAB script. Additionally, modules are called from command line of the software. In short,
EyeMMV toolbox is a complete utility, appropriate for post-experimental eye movement analysis.
Fixation Identification Algorithm The detection of fixation events is performed with the
use of an introduced algorithm based on spatial and tem-poral constraints. The process of the identification is based on three basic parameters; two spatial parameters and one for minimum duration. The execution of the al-gorithm is necessary for the detection of the coordinates of fixations’ centers, and fixations' durations among the eye movement protocol. Having the eye tracking records (x, y, time) as input and the values of three parameters (tolerance t1, tolerance t2 and minimum duration thresh-old), the implementation of the algorithm is achieved following the successive stages described below.
Step 1. Starting from the first record of the protocol, the mean value of horizontal and vertical coordinates is computed as long as the Euclidean distance between mean point and a record is greater than the value of toler-ance t1. If the distance is greater than t1 parameter, a new fixation cluster is generated. Thus, first taxonomy of re-cords in fixation clusters is achieved.
Step 2. For every cluster, the distance between the mean point and every record in the cluster is computed. If the distance of a record is greater than the predefined value of tolerance t2, the record is not used in the compu-tation of fixation coordinates. After removing the records that are not in agreement with t2 tolerance criterion, the fixations’ coordinates are computed as the mean point of each cluster with duration equal to the difference of the passing times between the last and the first record of the cluster.
Step 3. After applying t1 and t2 spatial constraints, fixation clusters with duration smaller than the minimum value are removed.
As already mentioned the spatial parameters t1, t2
are predefined. But, t2 parameter can be also estimated after comparing the value of the standard deviation of the cluster with the distances between cluster points and mean point. More specifically, after t1 tolerance criterion, the mean point of the cluster is computed (mx±sx, my±sy), where sx and sy are the values of standard deviations of horizontal and vertical coordinates in the cluster corre-spondingly. The distance between each cluster point and the mean point (mx, my) is computed. If the distance of a
DOI 10.16910/jemr.7.1.1 ISSN 1995-8692This article is licensed under aCreative Commons Attribution 4.0 International license.
Journal of Eye Movement Research Krassanakis, V., Filippakopoulou, V., & Nakos, B. (2014) 7(1):1, 1-10 EyeMMV toolbox: An eye movement post-analysis tool
4
cluster point is greater than the statistical interval of 3s, where s=(sx+sy)1/2, the point is not used in the computa-tion of fixation center.
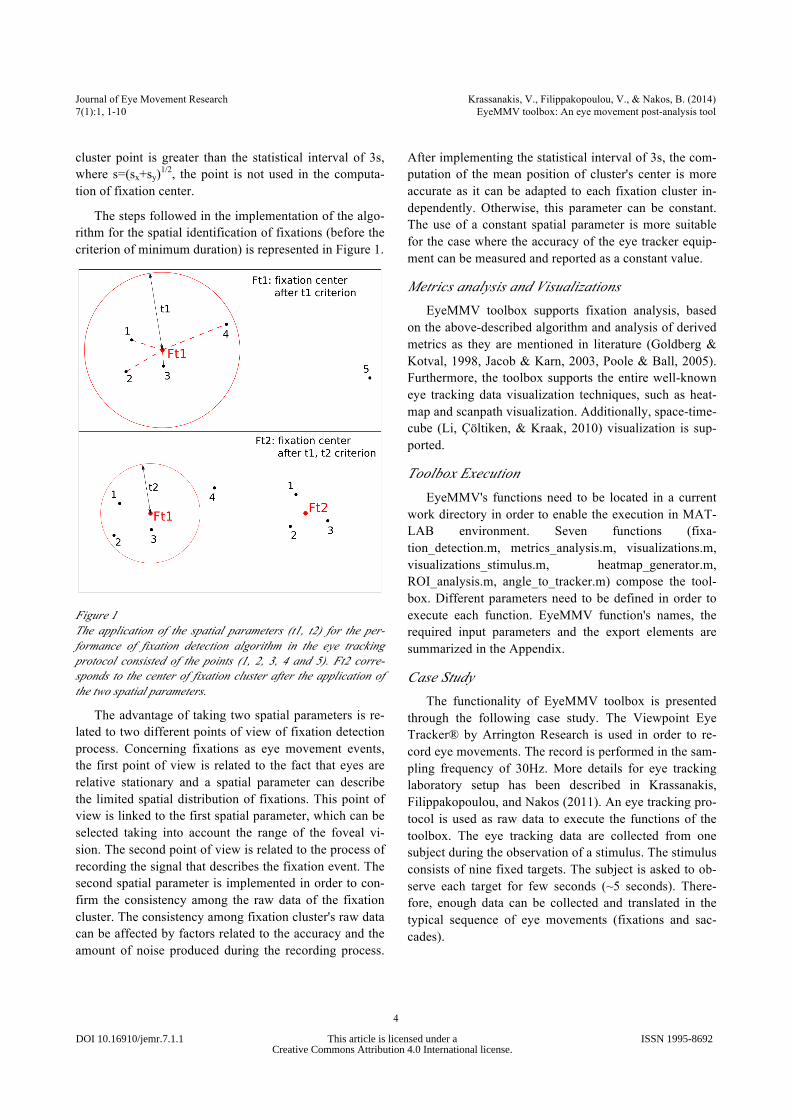
The steps followed in the implementation of the algo-rithm for the spatial identification of fixations (before the criterion of minimum duration) is represented in Figure 1.
Figure 1 The application of the spatial parameters (t1, t2) for the per-formance of fixation detection algorithm in the eye tracking protocol consisted of the points (1, 2, 3, 4 and 5). Ft2 corre-sponds to the center of fixation cluster after the application of the two spatial parameters.
The advantage of taking two spatial parameters is re-lated to two different points of view of fixation detection process. Concerning fixations as eye movement events, the first point of view is related to the fact that eyes are relative stationary and a spatial parameter can describe the limited spatial distribution of fixations. This point of view is linked to the first spatial parameter, which can be selected taking into account the range of the foveal vi-sion. The second point of view is related to the process of recording the signal that describes the fixation event. The second spatial parameter is implemented in order to con-firm the consistency among the raw data of the fixation cluster. The consistency among fixation cluster's raw data can be affected by factors related to the accuracy and the amount of noise produced during the recording process.
After implementing the statistical interval of 3s, the com-putation of the mean position of cluster's center is more accurate as it can be adapted to each fixation cluster in-dependently. Otherwise, this parameter can be constant. The use of a constant spatial parameter is more suitable for the case where the accuracy of the eye tracker equip-ment can be measured and reported as a constant value.
Metrics analysis and Visualizations EyeMMV toolbox supports fixation analysis, based
on the above-described algorithm and analysis of derived metrics as they are mentioned in literature (Goldberg & Kotval, 1998, Jacob & Karn, 2003, Poole & Ball, 2005). Furthermore, the toolbox supports the entire well-known eye tracking data visualization techniques, such as heat-map and scanpath visualization. Additionally, space-time-cube (Li, Çöltiken, & Kraak, 2010) visualization is sup-ported.
Toolbox Execution EyeMMV's functions need to be located in a current
work directory in order to enable the execution in MAT-LAB environment. Seven functions (fixa-tion_detection.m, metrics_analysis.m, visualizations.m, visualizations_stimulus.m, heatmap_generator.m, ROI_analysis.m, angle_to_tracker.m) compose the tool-box. Different parameters need to be defined in order to execute each function. EyeMMV function's names, the required input parameters and the export elements are summarized in the Appendix.
Case Study The functionality of EyeMMV toolbox is presented
through the following case study. The Viewpoint Eye Tracker® by Arrington Research is used in order to re-cord eye movements. The record is performed in the sam-pling frequency of 30Hz. More details for eye tracking laboratory setup has been described in Krassanakis, Filippakopoulou, and Nakos (2011). An eye tracking pro-tocol is used as raw data to execute the functions of the toolbox. The eye tracking data are collected from one subject during the observation of a stimulus. The stimulus consists of nine fixed targets. The subject is asked to ob-serve each target for few seconds (~5 seconds). There-fore, enough data can be collected and translated in the typical sequence of eye movements (fixations and sac-cades).
DOI 10.16910/jemr.7.1.1 ISSN 1995-8692This article is licensed under aCreative Commons Attribution 4.0 International license.
Journal of Eye Movement Research Krassanakis, V., Filippakopoulou, V., & Nakos, B. (2014) 7(1):1, 1-10 EyeMMV toolbox: An eye movement post-analysis tool
5
The import file must include the records list in format (x y t), where x and y are the horizontal and vertical Car-tesian coordinates, respectively, and t is the pass time in ms. The values of parameters in the seven functions are chosen as for the needs of the execution. These values do not imply any actual link to observation conditions. The results obtained by running EyeMMV toolbox are pre-sented below.
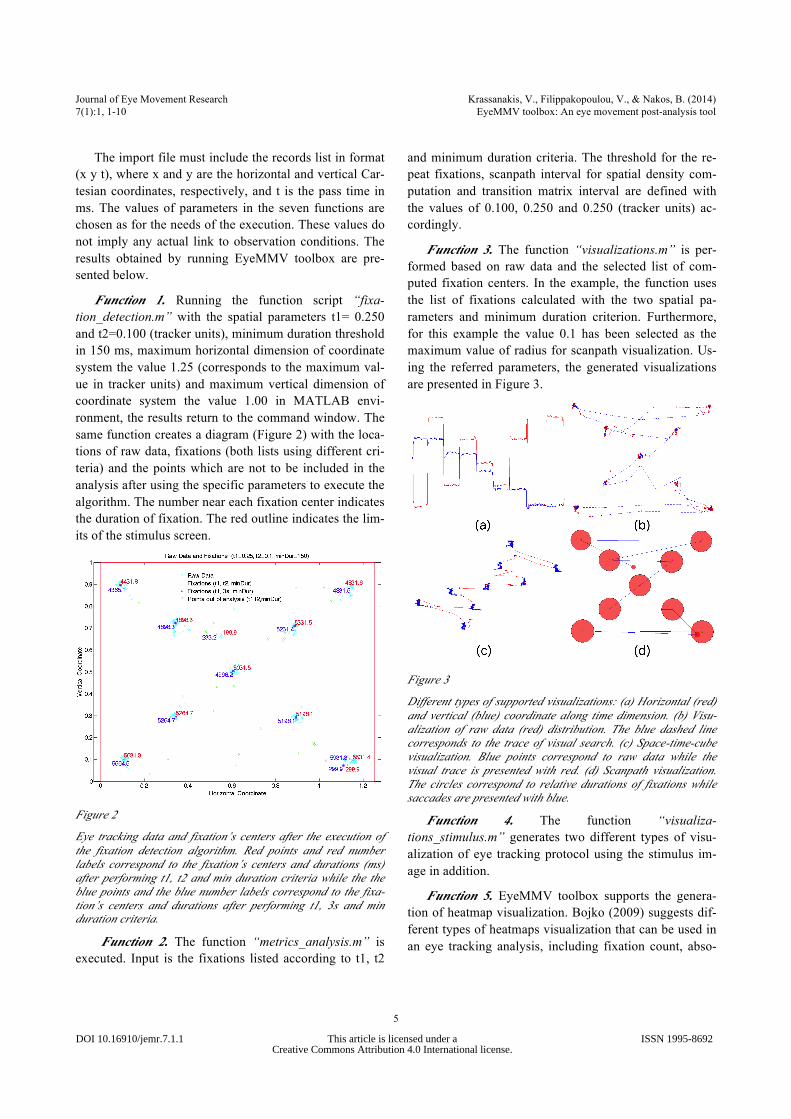
Function 1. Running the function script “fixa-tion_detection.m” with the spatial parameters t1= 0.250 and t2=0.100 (tracker units), minimum duration threshold in 150 ms, maximum horizontal dimension of coordinate system the value 1.25 (corresponds to the maximum val-ue in tracker units) and maximum vertical dimension of coordinate system the value 1.00 in MATLAB envi-ronment, the results return to the command window. The same function creates a diagram (Figure 2) with the loca-tions of raw data, fixations (both lists using different cri-teria) and the points which are not to be included in the analysis after using the specific parameters to execute the algorithm. The number near each fixation center indicates the duration of fixation. The red outline indicates the lim-its of the stimulus screen.
Figure 2
Eye tracking data and fixation’s centers after the execution of the fixation detection algorithm. Red points and red number labels correspond to the fixation’s centers and durations (ms) after performing t1, t2 and min duration criteria while the the blue points and the blue number labels correspond to the fixa-tion’s centers and durations after performing t1, 3s and min duration criteria.
Function 2. The function “metrics_analysis.m” is executed. Input is the fixations listed according to t1, t2
and minimum duration criteria. The threshold for the re-peat fixations, scanpath interval for spatial density com-putation and transition matrix interval are defined with the values of 0.100, 0.250 and 0.250 (tracker units) ac-cordingly.
Function 3. The function “visualizations.m” is per-formed based on raw data and the selected list of com-puted fixation centers. In the example, the function uses the list of fixations calculated with the two spatial pa-rameters and minimum duration criterion. Furthermore, for this example the value 0.1 has been selected as the maximum value of radius for scanpath visualization. Us-ing the referred parameters, the generated visualizations are presented in Figure 3.
Figure 3
Different types of supported visualizations: (a) Horizontal (red) and vertical (blue) coordinate along time dimension. (b) Visu-alization of raw data (red) distribution. The blue dashed line corresponds to the trace of visual search. (c) Space-time-cube visualization. Blue points correspond to raw data while the visual trace is presented with red. (d) Scanpath visualization. The circles correspond to relative durations of fixations while saccades are presented with blue.
Function 4. The function “visualiza-tions_stimulus.m” generates two different types of visu-alization of eye tracking protocol using the stimulus im-age in addition.
Function 5. EyeMMV toolbox supports the genera-tion of heatmap visualization. Bojko (2009) suggests dif-ferent types of heatmaps visualization that can be used in an eye tracking analysis, including fixation count, abso-
DOI 10.16910/jemr.7.1.1 ISSN 1995-8692This article is licensed under aCreative Commons Attribution 4.0 International license.
Journal of Eye Movement Research Krassanakis, V., Filippakopoulou, V., & Nakos, B. (2014) 7(1):1, 1-10 EyeMMV toolbox: An eye movement post-analysis tool
6
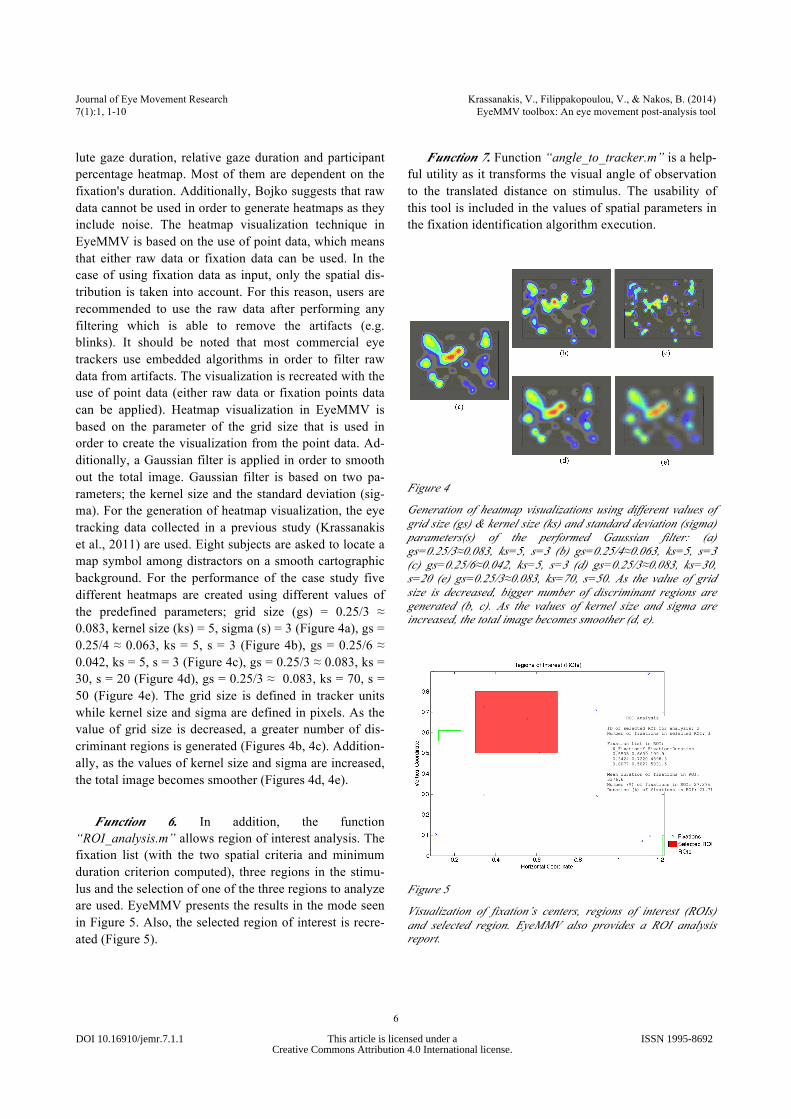
lute gaze duration, relative gaze duration and participant percentage heatmap. Most of them are dependent on the fixation's duration. Additionally, Bojko suggests that raw data cannot be used in order to generate heatmaps as they include noise. The heatmap visualization technique in EyeMMV is based on the use of point data, which means that either raw data or fixation data can be used. In the case of using fixation data as input, only the spatial dis-tribution is taken into account. For this reason, users are recommended to use the raw data after performing any filtering which is able to remove the artifacts (e.g. blinks). It should be noted that most commercial eye trackers use embedded algorithms in order to filter raw data from artifacts. The visualization is recreated with the use of point data (either raw data or fixation points data can be applied). Heatmap visualization in EyeMMV is based on the parameter of the grid size that is used in order to create the visualization from the point data. Ad-ditionally, a Gaussian filter is applied in order to smooth out the total image. Gaussian filter is based on two pa-rameters; the kernel size and the standard deviation (sig-ma). For the generation of heatmap visualization, the eye tracking data collected in a previous study (Krassanakis et al., 2011) are used. Eight subjects are asked to locate a map symbol among distractors on a smooth cartographic background. For the performance of the case study five different heatmaps are created using different values of the predefined parameters; grid size (gs) = 0.25/3 ≈ 0.083, kernel size (ks) = 5, sigma (s) = 3 (Figure 4a), gs = 0.25/4 ≈ 0.063, ks = 5, s = 3 (Figure 4b), gs = 0.25/6 ≈ 0.042, ks = 5, s = 3 (Figure 4c), gs = 0.25/3 ≈ 0.083, ks = 30, s = 20 (Figure 4d), gs = 0.25/3 ≈ 0.083, ks = 70, s = 50 (Figure 4e). The grid size is defined in tracker units while kernel size and sigma are defined in pixels. As the value of grid size is decreased, a greater number of dis-criminant regions is generated (Figures 4b, 4c). Addition-ally, as the values of kernel size and sigma are increased, the total image becomes smoother (Figures 4d, 4e).
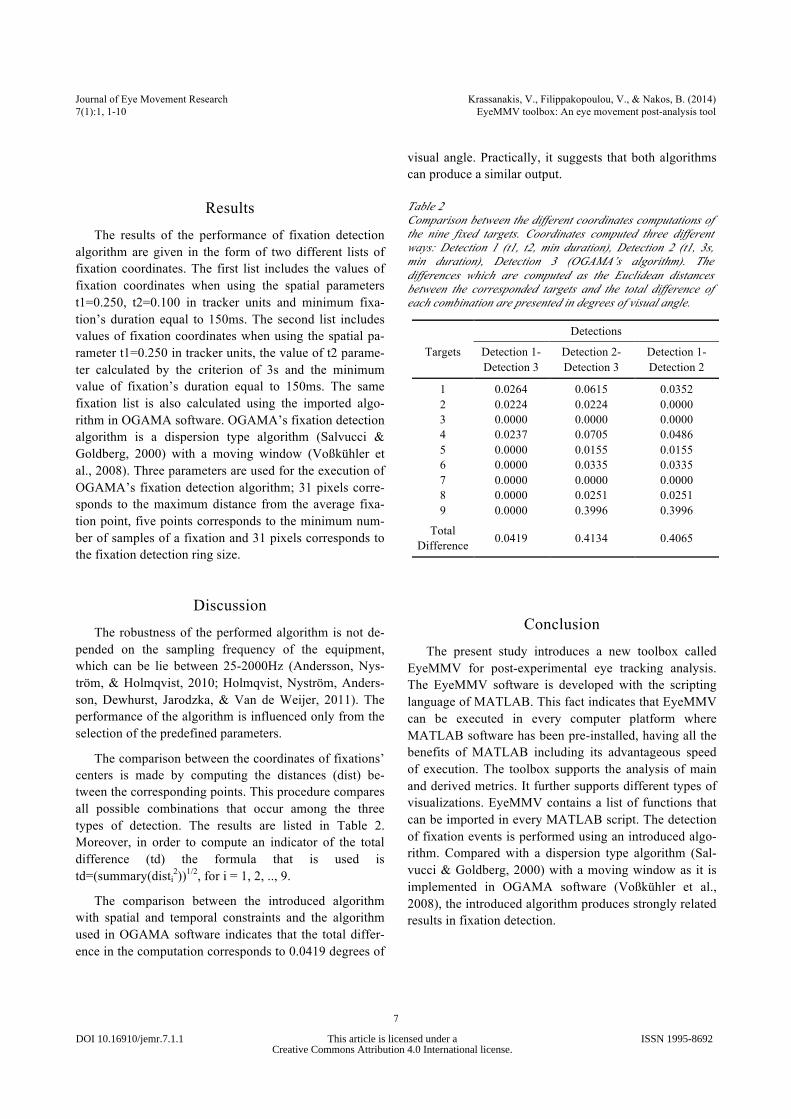
Function 6. In addition, the function “ROI_analysis.m” allows region of interest analysis. The fixation list (with the two spatial criteria and minimum duration criterion computed), three regions in the stimu-lus and the selection of one of the three regions to analyze are used. EyeMMV presents the results in the mode seen in Figure 5. Also, the selected region of interest is recre-ated (Figure 5).
Function 7. Function “angle_to_tracker.m” is a help-ful utility as it transforms the visual angle of observation to the translated distance on stimulus. The usability of this tool is included in the values of spatial parameters in the fixation identification algorithm execution.
Figure 4
Generation of heatmap visualizations using different values of grid size (gs) & kernel size (ks) and standard deviation (sigma) parameters(s) of the performed Gaussian filter: (a) gs=0.25/3≈0.083, ks=5, s=3 (b) gs=0.25/4≈0.063, ks=5, s=3 (c) gs=0.25/6≈0.042, ks=5, s=3 (d) gs=0.25/3≈0.083, ks=30, s=20 (e) gs=0.25/3≈0.083, ks=70, s=50. As the value of grid size is decreased, bigger number of discriminant regions are generated (b, c). As the values of kernel size and sigma are increased, the total image becomes smoother (d, e).
Figure 5
Visualization of fixation’s centers, regions of interest (ROIs) and selected region. EyeMMV also provides a ROI analysis report.
DOI 10.16910/jemr.7.1.1 ISSN 1995-8692This article is licensed under aCreative Commons Attribution 4.0 International license.
Journal of Eye Movement Research Krassanakis, V., Filippakopoulou, V., & Nakos, B. (2014) 7(1):1, 1-10 EyeMMV toolbox: An eye movement post-analysis tool
7
Results The results of the performance of fixation detection
algorithm are given in the form of two different lists of fixation coordinates. The first list includes the values of fixation coordinates when using the spatial parameters t1=0.250, t2=0.100 in tracker units and minimum fixa-tion’s duration equal to 150ms. The second list includes values of fixation coordinates when using the spatial pa-rameter t1=0.250 in tracker units, the value of t2 parame-ter calculated by the criterion of 3s and the minimum value of fixation’s duration equal to 150ms. The same fixation list is also calculated using the imported algo-rithm in OGAMA software. OGAMA’s fixation detection algorithm is a dispersion type algorithm (Salvucci & Goldberg, 2000) with a moving window (Voßkühler et al., 2008). Three parameters are used for the execution of OGAMA’s fixation detection algorithm; 31 pixels corre-sponds to the maximum distance from the average fixa-tion point, five points corresponds to the minimum num-ber of samples of a fixation and 31 pixels corresponds to the fixation detection ring size.
Discussion The robustness of the performed algorithm is not de-
pended on the sampling frequency of the equipment, which can be lie between 25-2000Hz (Andersson, Nys-tröm, & Holmqvist, 2010; Holmqvist, Nyström, Anders-son, Dewhurst, Jarodzka, & Van de Weijer, 2011). The performance of the algorithm is influenced only from the selection of the predefined parameters.
The comparison between the coordinates of fixations’ centers is made by computing the distances (dist) be-tween the corresponding points. This procedure compares all possible combinations that occur among the three types of detection. The results are listed in Table 2. Moreover, in order to compute an indicator of the total difference (td) the formula that is used is td=(summary(disti
2))1/2, for i = 1, 2, .., 9.
The comparison between the introduced algorithm with spatial and temporal constraints and the algorithm used in OGAMA software indicates that the total differ-ence in the computation corresponds to 0.0419 degrees of
visual angle. Practically, it suggests that both algorithms can produce a similar output.
Table 2 Comparison between the different coordinates computations of the nine fixed targets. Coordinates computed three different ways: Detection 1 (t1, t2, min duration), Detection 2 (t1, 3s, min duration), Detection 3 (OGAMA’s algorithm). The differences which are computed as the Euclidean distances between the corresponded targets and the total difference of each combination are presented in degrees of visual angle.
Detections
Targets Detection 1- Detection 3
Detection 2- Detection 3
Detection 1- Detection 2
1 2 3 4 5 6 7 8 9
0.0264 0.0224 0.0000 0.0237 0.0000 0.0000 0.0000 0.0000 0.0000
0.0615 0.0224 0.0000 0.0705 0.0155 0.0335 0.0000 0.0251 0.3996
0.0352 0.0000 0.0000 0.0486 0.0155 0.0335 0.0000 0.0251 0.3996
Total Difference 0.0419 0.4134 0.4065
Conclusion The present study introduces a new toolbox called
EyeMMV for post-experimental eye tracking analysis. The EyeMMV software is developed with the scripting language of MATLAB. This fact indicates that EyeMMV can be executed in every computer platform where MATLAB software has been pre-installed, having all the benefits of MATLAB including its advantageous speed of execution. The toolbox supports the analysis of main and derived metrics. It further supports different types of visualizations. EyeMMV contains a list of functions that can be imported in every MATLAB script. The detection of fixation events is performed using an introduced algo-rithm. Compared with a dispersion type algorithm (Sal-vucci & Goldberg, 2000) with a moving window as it is implemented in OGAMA software (Voßkühler et al., 2008), the introduced algorithm produces strongly related results in fixation detection.
DOI 10.16910/jemr.7.1.1 ISSN 1995-8692This article is licensed under aCreative Commons Attribution 4.0 International license.

Journal of Eye Movement Research Krassanakis, V., Filippakopoulou, V., & Nakos, B. (2014) 7(1):1, 1-10 EyeMMV toolbox: An eye movement post-analysis tool
8
References Andersson, R., Nyström, M., & Holmqvist, K., (2010).
Sampling frequency and eye-tracking measures: how speed affects durations, latencies, and more. Journal of Eye Movement Research, 3(3):6, 1-12.
Blignaut, P. (2009). Fixation identification: The optimum threshold for dispersion algorithm. Attention, Percep-tion, & Psychophysics, 71(4), 881-895.
Berger, C., Winkels, M., Lischke, A., & Hoppner, J. (2012). GazeAlyze: a MATLAB toolbox for the anal-ysis of eye movement data. Behavior Research Meth-ods, 44, 404-419.
Bojko, A. (2009). Informative or Misleading? Heatmaps Deconstruction. In Jacko J.A. (Ed.), Human-Computer Interaction (pp. 30-39), Berlin: Springer-Verlag.
Camilli, M., Nacchia, R., Terenzi, M., & Di Nocera, F. (2008). ASTEF: A simple tool for examining fixa-tions. Behavior Researcher Methods, 40(2), 373-382.
Cornelissen F. W., Peters E. M., & Palmer J. (2002). The Eyelink Toolbox: Eye tracking with MATLAB and the Psychophysics Toolbox. Behavior Research Methods, Instruments, & Computers, 34(4), 613-617.
Duchowski, A. T. (2002). A breath-first survey of eye-tracking applications. Behavior Research Methods, Instruments & Computers, 34(4), 455-470.
Duchowski, A.T. (2007). Eye Tracking Methodology: Theory & Practice (2nd ed.). London: Springer-Verlag.
Gitelman, D. R. (2002). ILAB: A program for postex-perimental eye movement analysis. Behavior Re-search Methods, Instruments, & Computers, 34(4), 605-612.
Goldberg, J. H. & Kotval, X. P. (1999). Computer inter-face evaluation using eye movements: methods and constructs. International Journal of Industrial Ergo-nomics, 24, 631-645.
Heminghous J., & Duchowski A.T. (2006). iComp: A tool for scanpath visualization and comparison. In Proceedings of the 3rd Symposium on Applied Per-ception in Graphics and Visualization, 152-152.
Holmqvist, K., Nyström, M., Andersson, R., Dewhurst, R., Jarodzka, H., & Van de Weijer, J. (2011). Eye tracking: A comprehensive guide to methods and measures. Oxford: Oxford University Press.
Jacob, R. J. K., & Karn, K. S. (2003). Eye Tracking in Human-Computer Interaction and Usability Research: Ready to Deliver the Promises. In Hyona, Radach, & Deubel (Eds.), The Mind's Eyes: Cognitive and Ap-plied Aspects of Eye Movements (pp. 573-605). Ox-ford: Elsevier Science.
Krassanakis, V., Filippakopoulou, V. & Nakos, B. (2011). An Application of Eye Tracking Methodology in Cartographic Research. Proceedings of the Eye-TrackBehavior2011(Tobii).
Lankford, C. (2000). GazeTrackerTM : Software designed to facilitate eye movement analysis. In Proceedings of the 2000 symposium on Eye Tracking research & ap-plications, 51-55.
Li, D., Badcock, J., & Parkhurst, D. J. (2006). openEyes: a low-cost head-mounted eye-tracking solution. In Proceedings of the 2006 symposium on Eye Tracking research & applications, 95-100.
Li, X., Çöltiken, A. & Kraak, M. J. (2010). Visual explo-ration of eye movement data using the Space-Time-Cube. In Fabrikant et al. (Eds.), Geographic Informa-tion Science (pp. 295-309). Berlin: Spinger-Verlag.
Martinez-Conde, S., Macknik, S. L.,& Hubel, D. H. (2004). The role of fixational eye movements in vis-ual perception. Nature Reviews Neuroscience, 5(3), 229-240.
Nyström, M., & Holmqvist, K. (2010). An adaptive algo-rithm for fixation, saccade, and glissade detection in eyetracking data. Behavior Research Methods, 42(1), 188-204.
Poole, A., & Ball, L. J. (2005). Eye Tracking in Human-Computer Interaction and Usability Research: Current Status and Future Prospects. In C. Ghaoui (Eds.), En-cyclopedia of human computer interaction (pp. 211-219). Pennsylvania: Idea Group.
Richardson, D. C. (2004). Eye tracking: Research areas and applications. In G. Wnek & G. Bowlin (Eds.), Encyclopedia of biomaterials and biomedical engi-neering (pp. 573-582). New York: Marcel Dekker.
DOI 10.16910/jemr.7.1.1 ISSN 1995-8692This article is licensed under aCreative Commons Attribution 4.0 International license.
Journal of Eye Movement Research Krassanakis, V., Filippakopoulou, V., & Nakos, B. (2014) 7(1):1, 1-10 EyeMMV toolbox: An eye movement post-analysis tool
9
Salvucci, D. D. (2000). An interactive model-based envi-ronment for eye-movement protocol analysis and vis-ualization, In Proceedings of the Symposium on Eye Tracking Research and Applications, 57-63.
Salvucci, D. D., & Goldberg, J. H. (2000). Identifying Fixations and Saccades in Eye-Tracking Protocols. In Proceedings of the Symposium on Eye Tracking Re-search and Applications, 71-78.
San Agustin, J., Mollenbach, E., & Barret, M. (2010). Evaluation of a Low-Cost Open-source Gaze Tracker. In Proceedings of the 2010 symposium on Eye Track-ing research & applications, 77-80.
Schwab, S., Würmle, O., & Altorfer, A. (2012). Analysis of eye and head coordination in a visual peripheral recognition task. Journal of Eye Movement Research, 5(2):3, 1-9.
Sogo, H. (2013). GazeParser: an open-source and multi platform library for low-cost eye tracking and anal-sysis. Behavior Research Methods, 45(3), 684-695.
Spakov, O., & Miniotas, D. (2008). iComponent: soft-ware with flexible architecture for developing plug-in modules for eye trackers. Information Technology and Control, 37 (1), 26-32.
Shic F., Scassellati, B., & Chawarska, K. (2008). The Incomplete Fixation Measure, In Proceedings of the Symposium on Eye Tracking Research and Applica-tions, 111-114.
Tsang, H. Y., Tory, M., & Swindells, C. (2010). eSeeTrack-Visualizing Sequential Fixation Patters. IEEE Transactions on Visualization and Computer Graphics, 16 (6), 953-962.
Voßkühler, A., Nordmeier, V., Kuchinke, L., & Jacobs, A. M. (2008). OGAMA (Open Gaze and Mouse Ana-lyzer): Open-source software designed to analyze eye and mouse movements in slideshow study designs. Behavior Researcher Methods, 40(4), 1150-1162.
West, J. M., Haake, A. R., Rozanski, P., & Karn, K. S. (2006). eyePatterns: Software for Identifying Patterns and Similarities Across Fixation Sequences. In Pro-ceedings of the 2006 symposium on Eye Tracking re-search & applications, 149-154.
DOI 10.16910/jemr.7.1.1 ISSN 1995-8692This article is licensed under aCreative Commons Attribution 4.0 International license.
Journal of Eye Movement Research Krassanakis, V., Filippakopoulou, V., & Nakos, B. (2014) x,(x):x, x-x EyeMMV toolbox: An eye movement post-analysis tool based on a two-step spatial
dispersion threshold for fixation identification
10
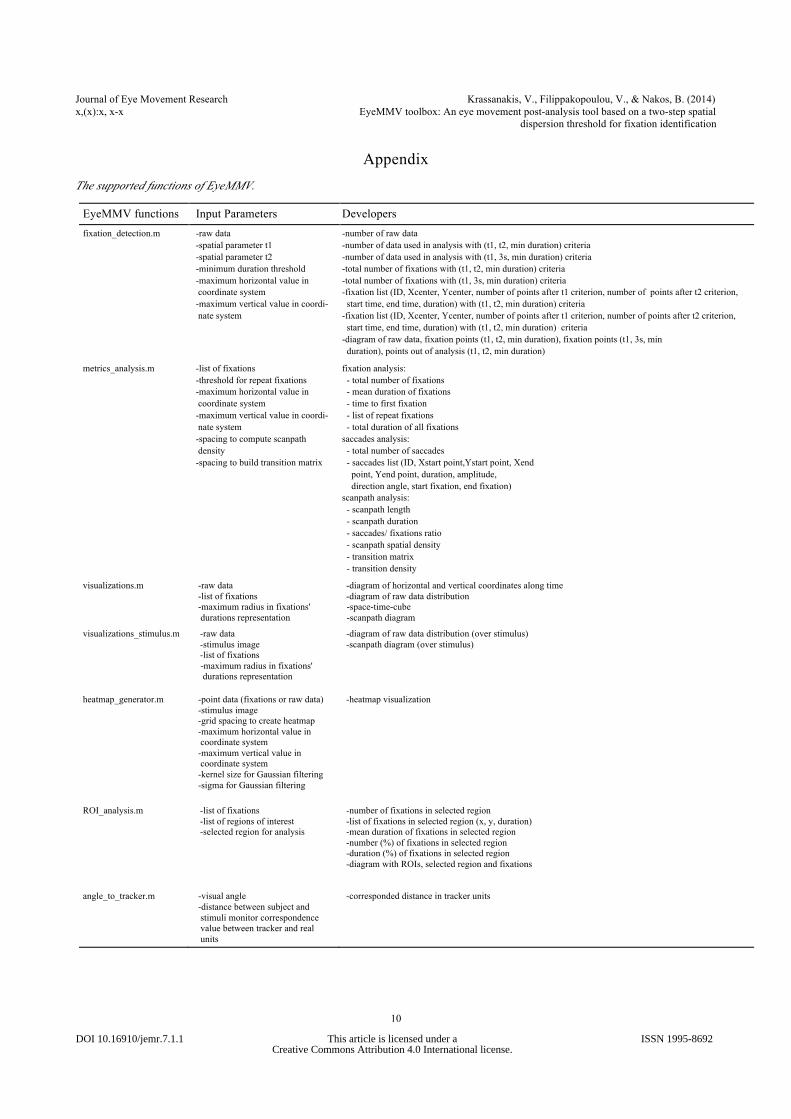
Appendix The supported functions of EyeMMV.
EyeMMV functions Input Parameters Developers fixation_detection.m -raw data
-spatial parameter t1 -spatial parameter t2 -minimum duration threshold -maximum horizontal value in coordinate system -maximum vertical value in coordi-nate system
-number of raw data -number of data used in analysis with (t1, t2, min duration) criteria -number of data used in analysis with (t1, 3s, min duration) criteria -total number of fixations with (t1, t2, min duration) criteria -total number of fixations with (t1, 3s, min duration) criteria -fixation list (ID, Xcenter, Ycenter, number of points after t1 criterion, number of points after t2 criterion, start time, end time, duration) with (t1, t2, min duration) criteria -fixation list (ID, Xcenter, Ycenter, number of points after t1 criterion, number of points after t2 criterion, start time, end time, duration) with (t1, t2, min duration) criteria -diagram of raw data, fixation points (t1, t2, min duration), fixation points (t1, 3s, min duration), points out of analysis (t1, t2, min duration)
metrics_analysis.m -list of fixations -threshold for repeat fixations -maximum horizontal value in coordinate system -maximum vertical value in coordi-nate system -spacing to compute scanpath density -spacing to build transition matrix
fixation analysis: - total number of fixations - mean duration of fixations - time to first fixation - list of repeat fixations - total duration of all fixations saccades analysis: - total number of saccades - saccades list (ID, Xstart point,Ystart point, Xend point, Yend point, duration, amplitude, direction angle, start fixation, end fixation) scanpath analysis: - scanpath length - scanpath duration - saccades/ fixations ratio - scanpath spatial density - transition matrix - transition density
visualizations.m -raw data -list of fixations -maximum radius in fixations' durations representation
-diagram of horizontal and vertical coordinates along time -diagram of raw data distribution
-space-time-cube -scanpath diagram
visualizations_stimulus.m -raw data -stimulus image -list of fixations -maximum radius in fixations' durations representation
-diagram of raw data distribution (over stimulus) -scanpath diagram (over stimulus)
heatmap_generator.m -point data (fixations or raw data) -stimulus image -grid spacing to create heatmap -maximum horizontal value in coordinate system -maximum vertical value in coordinate system -kernel size for Gaussian filtering -sigma for Gaussian filtering
-heatmap visualization
ROI_analysis.m -list of fixations -list of regions of interest -selected region for analysis
-number of fixations in selected region -list of fixations in selected region (x, y, duration) -mean duration of fixations in selected region -number (%) of fixations in selected region -duration (%) of fixations in selected region -diagram with ROIs, selected region and fixations
angle_to_tracker.m -visual angle -distance between subject and stimuli monitor correspondence value between tracker and real units
-corresponded distance in tracker units
DOI 10.16910/jemr.7.1.1 ISSN 1995-8692This article is licensed under aCreative Commons Attribution 4.0 International license.