EY - Analysis of profit warnings · Q2 2015 Analysis of profit warnings Issued by UK quoted...
12
Q2 2015 Analysis of profit warnings Issued by UK quoted companies On the rebound? Profit warning numbers, 2007–Q2 2015 0 20 40 60 80 100 120 140 Quarterly profit warnings 2007 Quarterly profit warning numbers 2007 total: 384 Q4 Q3 Q2 Q1 2008 2008 total: 449 Q4 Q3 Q2 Q1 2009 2009 total: 282 Q4 Q3 Q2 Q1 2010 2010 total: 196 Q4 Q3 Q2 Q1 2011 2011 total: 278 Q4 Q3 Q2 Q1 2012 2012 total: 287 Q4 Q3 Q2 Q1 2013 2013 total: 255 Q4 Q3 Q2 Q1 2014 2014 total: 299 Q4 Q3 Q2 Q1 2015 2015 total: 134 Q4 Q3 Q2 Q1 Q2 UK quoted companies issued just 57 warnings in Q2 15, a near two-year low. Profit warnings normally tail off during the summer, but this is an especially dramatic fall when set against the post-crisis highs recorded in previous quarters. If market conditions improve, profit warning levels can fall quickly — especially after a sharp cut to forecasts. In April, UK profit warnings again hit a seven-year high; however in May, an improving global enduring issues dragging on profits. Rising competition, disruptive new entrants and trends — combined with overcapacity and ‘noflation’ — provide tough conditions in which to raise prices and forecast accurately. Companies need to be actively rejigging their portfolios and focusing on operational and capital resilience to thrive and meet rising investor expectations in this more volatile environment. economic outlook and an unexpectedly decisive General Election result appeared to set the ball rolling on many contracts and investment decisions. This helped companies meet lowered forecasts and feel more confident about the future. The danger is — as ever — that expectations rebound too fast. Summer has brought renewed uncertainties and challenges. Even with helpful economic winds, there are obviously deep and
Transcript of EY - Analysis of profit warnings · Q2 2015 Analysis of profit warnings Issued by UK quoted...
Q2 2015
Analysis of profit warningsIssued by UK quoted companies
On the rebound?
Profit warning numbers, 2007–Q2 2015
0
20
40
60
80
100
120
140
Qua
rter
ly p
rofit
war
ning
s
2007
Quarterly profit warning numbers
2007 total:384
Q4
Q3
Q2Q1
2008
2008 total:449
Q4
Q3
Q2Q1
2009
2009 total:282
Q4
Q3
Q2Q1
2010
2010 total:196
Q4
Q3
Q2Q1
2011
2011 total:278
Q4
Q3
Q2Q1
2012
2012 total:287
Q4
Q3
Q2Q1
2013
2013 total:255
Q4
Q3
Q2Q1
2014
2014 total:299
Q4
Q3
Q2Q1
2015
2015 total:134
Q4
Q3
Q2Q1 Q2
UK quoted companies issued just 57 warnings in Q2 15, a near two-year low. Profit warnings normally tail off during the summer, but this is an especially dramatic fall when set against the post-crisis highs recorded in previous quarters.
If market conditions improve, profit warning levels can fall quickly — especially after a sharp cut to forecasts. In April, UK profit warnings again hit a seven-year high; however in May, an improving global
enduring issues dragging on profits. Rising competition, disruptive new entrants and trends — combined with overcapacity and ‘noflation’ — provide tough conditions in which to raise prices and forecast accurately. Companies need to be actively rejigging their portfolios and focusing on operational and capital resilience to thrive and meet rising investor expectations in this more volatile environment.
economic outlook and an unexpectedly decisive General Election result appeared to set the ball rolling on many contracts and investment decisions. This helped companies meet lowered forecasts and feel more confident about the future.
The danger is — as ever — that expectations rebound too fast. Summer has brought renewed uncertainties and challenges. Even with helpful economic winds, there are obviously deep and

2 | Analysis of profit warnings Q2 2015
Profit warning highlights
Profit warnings by sector, Q2 2015
0
2
4
6
8
10
12
Soft
war
e &
Com
pute
r Ser
vice
s
Supp
ort S
ervi
ces
Elec
tron
ic &
Ele
ctri
cal E
quip
men
t
Gen
eral
Ret
aile
rs
Med
ia
Trav
el &
Lei
sure
Indu
stri
al E
ngin
eeri
ng
Min
ing
Chem
ical
s
Oil
Equi
pmen
t, Se
rvic
es a
nd D
istr
ibut
ion
Cons
truc
tion
& M
ater
ials
Food
Pro
duce
rs
Fixe
d Li
ne T
elec
omm
unic
atio
ns
Hou
seho
ld G
oods
Indu
stri
al T
rans
port
atio
n
Aut
omob
iles
& Pa
rts
Elec
tric
ity
Pers
onal
Goo
ds
Phar
mac
eutic
als
and
Biot
echn
olog
y
Mob
ile T
elec
omm
unic
atio
ns
Hea
lth C
are
Equi
pmen
t & S
ervi
ces
► UK quoted companies issued 57 profit warnings in Q2 15, six fewer than the same period of 2014.
► Profit warning numbers usually dip in summer, but the 26% quarter-on-quarter fall is the sharpest drop for six years.
► Overall, 4.0% of UK quoted companies issued profit warnings in Q2 15, making this the lowest number and percentage of companies warning since Q3 13.
► Most of this recovery came in the Main Market, with the proportion of AIM companies warning higher for only the second quarter in the past ten years.
► This was a quarter of two halves. In April, profit warnings equalled the figure set in the same month of 2008; but May numbers were their lowest since 2003, as confidence improved.
► FTSE sectors leading profit warnings in Q2 15 were: Software & Computer Services (10) Support Services (7), Electronic & Electrical Equipment (7), Media (5) and General Retailers (5).
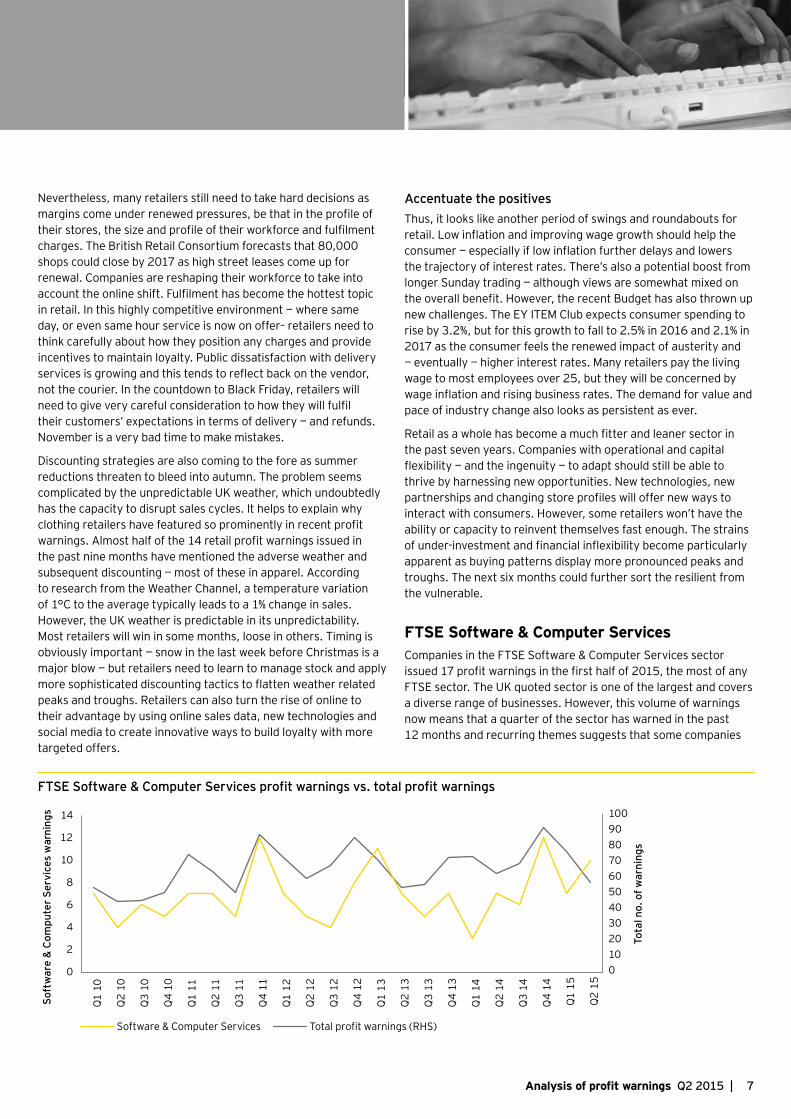
► Fluctuating levels of confidence hit sectors like FTSE Software & Computer Services and FTSE Support Services, which are adversely affected by disruption to contract cycles. Once again, contract issues were reported in around a quarter of warnings in Q2 15.
► Unfavourable and volatile exchange rate movements contributed to 14% of profit warnings in Q2 15, still well above average. The strength of sterling — especially against the Euro — remains an ongoing drag on profits.
► Manufacturers are feeling the impact of volatile currencies and global uncertainties. Over 30% of Industrial Engineering and 40% of Electronic & Electrical Equipment companies have warned in the last year.
► Profit warnings from FTSE Oil & Gas Producers dropped from eight in Q1 15 to zero in Q2 15, helped by a mild recovery in the oil price and internal cost cutting.
► The oil price remains relatively weak and industry restructuring continues, with falling levels of sector activity contributing to nine profit warnings this quarter, mostly from manufacturing sectors.
► Low input prices are helping some sectors. Profit warnings from consumer products companies have fallen to exceptionally low levels.
► The pressure to cut prices, whilst meeting the rising cost of changing customer needs is keeping the pressure on FTSE General Retailers, who have issued the greatest number of first half profit warnings in four years.
► The return of market volatility has raised the stakes for companies who miss forecasts. The median share price fall on the day of warning rose dramatically from 10.8% in Q1 to 14.3% in Q2, the highest since the end of 2011.
This was a quarter of two halves. In April, profit warnings equalled the figure set in the same month of 2008; but May numbers were their lowest since 2003.

3Analysis of profit warnings Q2 2015 |
Economic and sector overviewEconomic and sector overview
Rebound or relapse?This is a year of contrasts and contradictions. Stronger growth and rising deal activity stand in sharp contrast to the Eurozone’s existential crisis and rising emerging market concerns. The contrast between these narratives, combined with heightened monetary policy speculation, has increased market volatility and clouded the outlook for the second half of 2015.
Rebound — in growth and deal activity — should remain the dominant theme for 2015. But the recovery will have less speed and stability if uncertainties abound. This is still a relatively testing period for UK companies and their earnings forecasts. And, for UK earnings the macro environment is only part of the story. Whatever fair and foul economic winds are blowing, many companies are also still contending with dizzying change within their own sector, as disruptive entrants and technologies continue to challenge pricing and old models. Change always brings opportunity, but only for those resilient enough to take advantage.
UK’s pivotal momentIt’s been an eventful second quarter for the UK economy. Early in the quarter, pre-election jitters appeared to stymie activity in a number of areas, particularly construction. The strength of sterling and Eurozone uncertainties hindered parts of the manufacturing sector. However, an unexpected decisive General Election result provided greater certainty by the end of the period, whilst rising disposable incomes, low interest rates and a buoyant housing market provided sufficient momentum for what looks like a solid first half. Official estimates for growth in 2015 are still an enviable — and perhaps conservative — 2.4%. EY ITEM Club expect UK GDP to grow by 2.7%. Two familiar challenges threaten this improving domestic picture: productivity and imbalance.
With unemployment around its lower limit — despite a recent rise — future growth and improvements in living standards depend on reversing the UK’s long running productivity decline. If current levels persist, official GDP growth forecasts could drop by one third. A quick look across the economic outlook highlights why forecasts are so reliant on this productivity boost. It’s the UK economy’s age old foe — imbalance. With an ongoing — albeit moderated — fiscal squeeze and little expectation of a significant export boost, the UK economy will remain reliant on the consumer. Household spending has maintained UK growth in recent years. However, changes to welfare payments and the eventual rise in interest rates is expected to slow consumer spending growth from 3.2% in 2015 to 1.9% in 2018, according to the EY ITEM Club.
What chance of a ‘productive’ recovery? In previous recoveries, low unemployment has pushed up wages and businesses have reacted by investing more, helping to boost productivity. The ‘living wage’ introduced in the summer Budget could accelerate this process, along with other measures aimed at facilitating and incentivising investment. UK plc has funds and financing at hand.
However, the growth of new industries, along with the increasing scale and intricacies of globalisation, make this a more complex problem than previous recoveries. Uncertainty is also the enemy of investment and recent events in the Eurozone and China may also have given companies cause to pause. The upcoming EU referendum, although some distance away, is also drawn into the foreground by recent events.
From Athens to ShanghaiThe challenge of improving exports is exacerbated by an unsettled global outlook. The Eurozone has experienced both an economic turnaround and an existential crisis within the past six months — with the fallout from the protracted Greek crisis likely to provide further repercussions. China’s extreme market volatility is a symptom of its struggle to rebalance whilst carrying huge debts. Combined with the Federal Reserve’s slow march to monetary tightening, a more troubled China is also heaping pressure back on emerging markets. Meanwhile, the US is waking up, but only slowly from its winter freeze. A combination of these forces saw the International Monetary Fund cut its 2015 global growth forecast to 3.3% — down from 3.5% in April. Within these narratives there are pockets of stability and growth. India, if it continues to reform should outpace China. Spain is one of the fastest growing areas in the developed world — albeit still with a heavy debt burden.
The IMF noted the shift of growth back to mature economies in its latest report, a sentiment that chimes with our surveys. Emerging markets still offer faster growth, but increasingly we hear that this isn’t always enough to balance out growing risks. Our latest Capital Confidence Barometer shows the vast majority of respondents focusing on developed markets and most of the recent M&A boom has been centred on US and European targets. In Europe that activity is focused again in the ‘core’ and the UK. The quest for a better geographical mix is just one driver for this explosion of deal activity. Companies are also responding to the need to meet industry challenges and disruptive forces in their markets. They’re consolidating to cut costs and boost margins and making bolder moves to shift the scope of their business in response to challenges posed by technological advances and changing consumer needs.
Buoyant debt and equity markets have been the foundation for the rise in deal making. US and European markets have been relatively resilient, buoyed by growth hopes and central bank support. The chief risk to activity is a change in this supportive picture. Recently we have seen volatility creeping back into equity and currency markets, whilst bond and loan issues stalled during the protracted Greek crisis. The main threat, however, remains a difficult exit from such a prolonged period of ultra-low interest rates. Markets shaped by monetary policy have the potential to correct rapidly and move contrarily on relatively minor shifts in sentiment — as we have seen in recent weeks with European sovereign debt. It still looks as if the Federal Reserve will move first this autumn, with

4 | Analysis of profit warnings Q2 2015
Will the summer profit warnings dip last?After a run of ‘most since 2008’ months and quarters — including April — May was one of the ‘quietest’ months since we started recording profit warnings in 1999. Why the sudden halt? A lack of shocks and an unexpectedly decisive election result may have set the ball rolling on delayed contracts and investment decisions. It certainly reduced domestic uncertainty in some sectors, such as house building and gambling. Meanwhile, through most of the quarter, the escalating Greek crisis was largely outweighed by the Eurozone’s economic recovery. A mostly improving narrative helped more companies feel confident of at least meeting expectations, much reduced by previous high levels of profit warnings.
Earnings expectations bounce back 3mn % change in 12mn forwards earnings (MSCI)
UK Eurozone US
-14
-12
-10
-8
-6
-4
-2
0
2
2012 2013 2014 2015
Have expectations rebounded too far? Profit warnings rise when forecasts run ahead of reality. They tend to really spike when this overrun combines with severe shocks or uncertainties that alter corporate or consumer behaviour. We’re not at that point. However, summer has brought renewed concerns over emerging market and the Eurozone outlooks, notwithstanding the recent Greek deal. Geographical mix can be a major differentiator in these markets. Not just in terms of more variable demand, but also
exchange rates. Currency has featured heavily in profit warnings in the past 18 months and will likely do so whilst the outlook remains volatile and UK polices diverge from the ECB. Demand, price and currency volatility all make harder for companies to forecast and plan.
The UK economy is relatively strong, but many sectors still have low pricing power. Rising competition due to new disruptive entrants and overcapacity — combined with ‘noflation’ are all potential drivers for the increasing price push back, cited in almost a quarter of profit warnings in the past year. Not just in consumer sectors, but also areas like business services where buyers — including the government — have become more price conscious.
These issues go to the heart of why profit warnings have been high of late — even during relatively benign economic periods. There isn’t a ‘normal’ recovery, but this is far from those seen in recent history. A virtual revolution of business models in several sectors has left many companies behind, whilst others have struggled to forecast accurately and show resilience in transformed markets. Internal issues are often exposed when companies are struggling to manage day-to-day.
With this in mind, we’d suggest that this recent dip in profit warnings might signal that expectations have reset. However, there is clearly potential for warnings to pick up again.
Areas to watch for in H2 15:
► Contract dependency: particularly software, computer services and outsourcing contractors - the ‘canaries in the coalmine’ of business confidence. We expect capex cuts from 2016.
► Eurozone exposure: especially in engineering sectors showing vulnerability to Euro weakness and Eurozone uncertainty.
► Commodity exposure: falling prices are hitting suppliers harder than extractors.
► Emerging market reliance: particularly mature industries dependent on emerging economies for growth and higher margins, e.g., automotive and personal goods.
► Deposed market leaders: disintermediated, displaced, left behind and lacking pricing power.
Economic and sector overview (continued)
the Bank of England by spring 2016. Both are doing all they can to prepare markets, but the ride in still looks bumpy.
Getting the right mixThus, there still appears to be sufficient support and momentum for the global economy to continue its rebound if current crises remain relatively contained. Economic and earnings relapse shouldn’t be on the agenda. Nevertheless, the need for corporate agility is underlined by the constant reshaping of the global growth and risk map, combined with ongoing earnings challenges. We expect to see more deal activity as companies continue to
reassess their capital allocation and reshape their businesses to generate the capital needed to invest in faster growing areas. Operational fitness is also a vital to build resilience to meet the challenges of this recovery. Where pressure to change doesn’t come from within, it increasingly comes from without in the form of more active stakeholders. A rebound doesn’t mean companies can relax.

5Analysis of profit warnings Q2 2015 |
Warnings as a percentage of FTSE sector, Q2 2015
Number of companies
warning
Number of companies in FTSE sector
% of companies
warning
Automobiles & Parts 1 4 25%
Chemicals 2 22 9%
Construction & Materials
1 35 3%
Electricity 1 15 7%
Electronic & Electrical Equipment
7 35 20%
Fixed Line Telecommunications
1 11 9%
Food Producers 1 26 4%
General Retailers 5 59 8%
Health Care Equipment & Services
1 35 3%
Household Goods 1 26 4%
Industrial Engineering 3 37 8%
Industrial Transportation
1 17 6%
Media 4 74 5%
Mining 2 109 2%
Mobile Telecommunications
1 10 10%
Oil Equipment, Services & Distribution
2 12 17%
Personal Goods 1 15 7%
Pharmaceuticals & Biotechnology
1 61 2%
Software & Computer Services
10 109 9%
Support Services 6 147 4%
Travel & Leisure 3 69 4%
Total 55
Is AIM the riskier bet?In June, AIM celebrated its 20th anniversary. The nature of the index naturally encourages more start-ups and more speculative ventures, which suggests a higher degree of risk. AIM has certainly seen some high profile failures over the years. However, our figures show that a greater percentage of Main Market companies have issued profit warnings in every year out of the last ten. There are possible structural explanations for this. A higher number of start-ups and lower levels of analyst coverage limit profit expectations for companies to miss. However, Q2 2015 is only the second quarter in the past ten years that warnings from AIM have outstripped those from the Main Market and the gap has often been quite marked. Investors on AIM will however, notice a marked difference in market reaction — average share price falls are normally at least 2% above the Main Market average.
Percentage of index warning
0
5%
10%
15%
20%
25%
30%
2005 2006 2007 2008 2009 2010 2011 2012 2013 2014
Main AIM
The Eurozone’s economic recovery contributed towards the improving narrative and helped more companies feel confident of meeting or beating reduced expectations.

6 | Analysis of profit warnings Q2 2015
Focus on sectors
FTSE General RetailersIt still feels like an uphill battle for many UK retailers. FTSE General Retailers issued five profit warnings in Q2 15, taking the first half total to 11 — the highest since 2011. The recent macro-economic environment appears to offer every advantage. Nevertheless, this hasn’t been enough to cushion some retailers against an unremitting and costly battle to keep pace with changing consumer behaviour and the equally constant demand for low prices. The weather has been a further complicating factor — but when isn’t it?
Lost in translationThe UK consumer outlook continued to improve in the second quarter. GkF reported consumer confidence at a 15-year high, as unemployment fell to its lowest level since mid-2008 and disposable incomes rose on the back of falling food, petrol and utility prices. A tighter labour market continued to feed into higher wages and the housing market also remained supportive, as interest rates remained low.
Nevertheless, retail sales remained volatile in Q2 15. In part, this was due to the timing of Easter. The British Retail Consortium (BRC) retail sales monitor shows like-for-like sales rising by 1.8% in June, remaining static in May and falling by 2.4% in April. Over the quarter, like-for-like sales were 0.1% lower, although much of this decline was due to supermarket price wars. Non-food sales rose by 2.1%. This gives us an improving picture, but these volumes don’t tell us much about the overall health of the sector. Our profit warning data suggests this remains mixed, with over 25% of General Retailers warning in the past year. By sub-sector, apparel is by far and away the sector under most stress — representing half of all FTSE General Retailers warnings issued this year.
What’s preventing the macro picture from translating into more robust sector health? In many cases, it is the continuing price-investment conundrum. Price pressure was unrelenting in the second quarter. The latest BRC-Nielsen survey for June showed shop prices falling for the 26th consecutive month — with the decline only slowing slightly to 1.3%, from 1.9% in May. Consumers are sticking to behaviours adopted during the recession. This isn’t just a passing flirtation with austerity. They have become comfortable with shopping with the discounters and diverting any spare cash to treats. Spending on eating out has risen by 17% in the last year, according to Barclaycard. The high street has serious competition for the consumer pound.
This relentless focus on price has made consumers no less demanding. They are still looking for value and for seamless service across all channels. Keeping up with the latest shifts in technology and related changes in behaviour is placing increasing demands on investment, working capital and on finance and buying functions. These strains — and need for additional investment — become especially apparent in the long run into Christmas, starting with the peak of Black Friday.
New approachesSquaring this need for investment in an era of falling prices is inspiring increasing ingenuity and co-operation across the sector. New technologies require investment, but they also offer significant opportunities to make innovative offers and to use a more personalised approach to encourage loyalty. The need for retailers to meet the demand for increasing purchasing and fulfilment flexibility has also encouraged more partnering between online and physical retailers. The latter are being forced to think more innovatively about how they use their space to maximise ‘Click and Collect’ convenience. It’s also required a location rethink, for example, establishing collection points at transport hubs.
FTSE General Retailer profit warnings vs. total profit warnings
Tota
l no.
of w
arni
ngs
General Retailers Total profit warnings (RHS)
Gen
eral
Ret
aile
r war
ning
s
Q1 1
0
Q2
10
Q3
10
Q4
10
Q1 1
1
Q2
11
Q3
11
Q4
11
Q1 1
2
Q2
12
Q3
12
Q4
12
Q1 1
3
Q2
13
Q3
13
Q4
13
Q1 1
4
Q2
14
Q3
14
Q4
14
Q1 1
5
Q2
15
0102030405060708090100
0
4
8
12
16
7Analysis of profit warnings Q2 2015 |
Nevertheless, many retailers still need to take hard decisions as margins come under renewed pressures, be that in the profile of their stores, the size and profile of their workforce and fulfilment charges. The British Retail Consortium forecasts that 80,000 shops could close by 2017 as high street leases come up for renewal. Companies are reshaping their workforce to take into account the online shift. Fulfilment has become the hottest topic in retail. In this highly competitive environment — where same day, or even same hour service is now on offer– retailers need to think carefully about how they position any charges and provide incentives to maintain loyalty. Public dissatisfaction with delivery services is growing and this tends to reflect back on the vendor, not the courier. In the countdown to Black Friday, retailers will need to give very careful consideration to how they will fulfil their customers’ expectations in terms of delivery — and refunds. November is a very bad time to make mistakes.
Discounting strategies are also coming to the fore as summer reductions threaten to bleed into autumn. The problem seems complicated by the unpredictable UK weather, which undoubtedly has the capacity to disrupt sales cycles. It helps to explain why clothing retailers have featured so prominently in recent profit warnings. Almost half of the 14 retail profit warnings issued in the past nine months have mentioned the adverse weather and subsequent discounting — most of these in apparel. According to research from the Weather Channel, a temperature variation of 1°C to the average typically leads to a 1% change in sales. However, the UK weather is predictable in its unpredictability. Most retailers will win in some months, loose in others. Timing is obviously important — snow in the last week before Christmas is a major blow — but retailers need to learn to manage stock and apply more sophisticated discounting tactics to flatten weather related peaks and troughs. Retailers can also turn the rise of online to their advantage by using online sales data, new technologies and social media to create innovative ways to build loyalty with more targeted offers.
Accentuate the positivesThus, it looks like another period of swings and roundabouts for retail. Low inflation and improving wage growth should help the consumer — especially if low inflation further delays and lowers the trajectory of interest rates. There’s also a potential boost from longer Sunday trading — although views are somewhat mixed on the overall benefit. However, the recent Budget has also thrown up new challenges. The EY ITEM Club expects consumer spending to rise by 3.2%, but for this growth to fall to 2.5% in 2016 and 2.1% in 2017 as the consumer feels the renewed impact of austerity and — eventually — higher interest rates. Many retailers pay the living wage to most employees over 25, but they will be concerned by wage inflation and rising business rates. The demand for value and pace of industry change also looks as persistent as ever.
Retail as a whole has become a much fitter and leaner sector in the past seven years. Companies with operational and capital flexibility — and the ingenuity — to adapt should still be able to thrive by harnessing new opportunities. New technologies, new partnerships and changing store profiles will offer new ways to interact with consumers. However, some retailers won’t have the ability or capacity to reinvent themselves fast enough. The strains of under-investment and financial inflexibility become particularly apparent as buying patterns display more pronounced peaks and troughs. The next six months could further sort the resilient from the vulnerable.
FTSE Software & Computer ServicesCompanies in the FTSE Software & Computer Services sector issued 17 profit warnings in the first half of 2015, the most of any FTSE sector. The UK quoted sector is one of the largest and covers a diverse range of businesses. However, this volume of warnings now means that a quarter of the sector has warned in the past 12 months and recurring themes suggests that some companies
FTSE Software & Computer Services profit warnings vs. total profit warnings
Tota
l no.
of w
arni
ngs
Software & Computer Services Total profit warnings (RHS)
Soft
war
e &
Com
pute
r Ser
vice
s w
arni
ngs
0102030405060708090100
0
2
4
6
8
10
12
14
Q1 1
0
Q2
10
Q3
10
Q4
10
Q1 1
1
Q2
11
Q3
11
Q4
11
Q1 1
2
Q2
12
Q3
12
Q4
12
Q1 1
3
Q2
13
Q3
13
Q4
13
Q1 1
4
Q2
14
Q3
14
Q4
14
Q1 1
5
Q2
15

8 | Analysis of profit warnings Q2 2015
Focus on sectors (continued)
in the sector lack the resilience needed to make the most of the significant opportunities that lie ahead.
Disruption drives growth & deal making… Looking at the headline numbers, growth doesn’t look like a problem. Gartner expects IT spending to rise by 3% on a constant currency basis in 2015 and software to be one of the highest growth segments. Increasing demand for data analysis and storage and mobile connectivity in particular, is driving demand from many other industries. The ‘technologising’ of sectors, like automotive, adds further impetus.
There are challenges behind the headline numbers. The sectors’ strong international focus brings geographical and currency mix into play. The strong dollar has dented the growth prospects of several markets, especially emerging economies. The weak euro hurts UK companies exposed to the region — and ongoing Eurozone uncertainty adds a further unsettling element. Business mix is also increasingly vital. Companies can still generate reasonable returns in mature segments. However, ‘disruptive’ areas like cloud computing, big data, smart mobility, social networking and the ‘Internet of Things’ are growing at considerably faster rates, whilst also being the key drivers for new system and application growth.
The technological landscape is always evolving, but these disruptive elements have contributed to a breakneck pace of change. As a result, M&A has been one of the most significant sector themes of the past year. Deal making has always been part of the technology sector growth story, as companies seek to keep pace with change, drive synergies and seek cost efficiency. But the ever quickening cycle and spread of technology — combined with cheap debt and ample cash — has driven global activity to a post-dot com record as companies within the sector seek to update their profile and compete with nimble new entrants. Meanwhile, companies from ‘traditional’ sectors are also active, looking for technologies to help innovate, differentiate and boost growth and margins in otherwise mature markets.
… can everyone keep up?As in every period of rapid and significant change, some companies emerge as winners and others get left behind. A number of large technology businesses, who previously dominated their sector, have fallen by the way side in recent years. Indeed, dominance and size can be a hindrance, if vested interests and over reliance and attachment to old models blinker management, inhibiting their ability to adapt.
Smaller companies should be more nimble, but they are can also be vulnerable to problems with a single dominant contract. Our UK profit warning data shows just that, with all but one warning issued this year coming from companies with a turnover below £200m. Six of these warnings — over one third — blame contract cancellations or delays. Five cite accounting issues, from a move to less aggressive accounting to contract provisions after companies have underestimated the size and complexity of projects. These are problems common to many sectors reliant on the contract cycle; but companies in FTSE Software & Computer Services have shown themselves to be especially vulnerable, by dominating these warning categories.
This might be a particular issue for the sector due to the large number of fast growing companies with especially heightened market expectations, which will be ultra-sensitive to even small disappointments. Weaker companies are also more susceptible to disruption and the FTSE sector has shrunk by over a third in the past ten years, in good part due to a high volume of deals that will naturally remove the strongest businesses.
Managing across the cycleCompanies can’t afford to stand still in this industry, which makes it especially vital that they’re not hindered by internal issues and that they maintain the trust of their investors. The average share price fall on the day of warning in this FTSE grouping is one of the highest at 20.5% in H1 15, compared with 14.5% for the market as a whole. If companies want to make the most of sector opportunities, they’ll need to think to build resilience and protecting against contract vulnerability should be high on the agenda.
Where possible, companies should think about broadening their client base by market and geography, but beyond that it’s vital to apply best practice in understanding and managing risk across the contract lifecycle. This includes building in flexibility to counteract the risk from wage inflation and volatile exchange rates and also effective and regular monitoring of contract performance to ensure management receives early warning of any issues. Companies should also be applying robust cash forecasting across projects and divisions in order to ensure adequate liquidity and WCAP visibility.
9Analysis of profit warnings Q2 2015 |
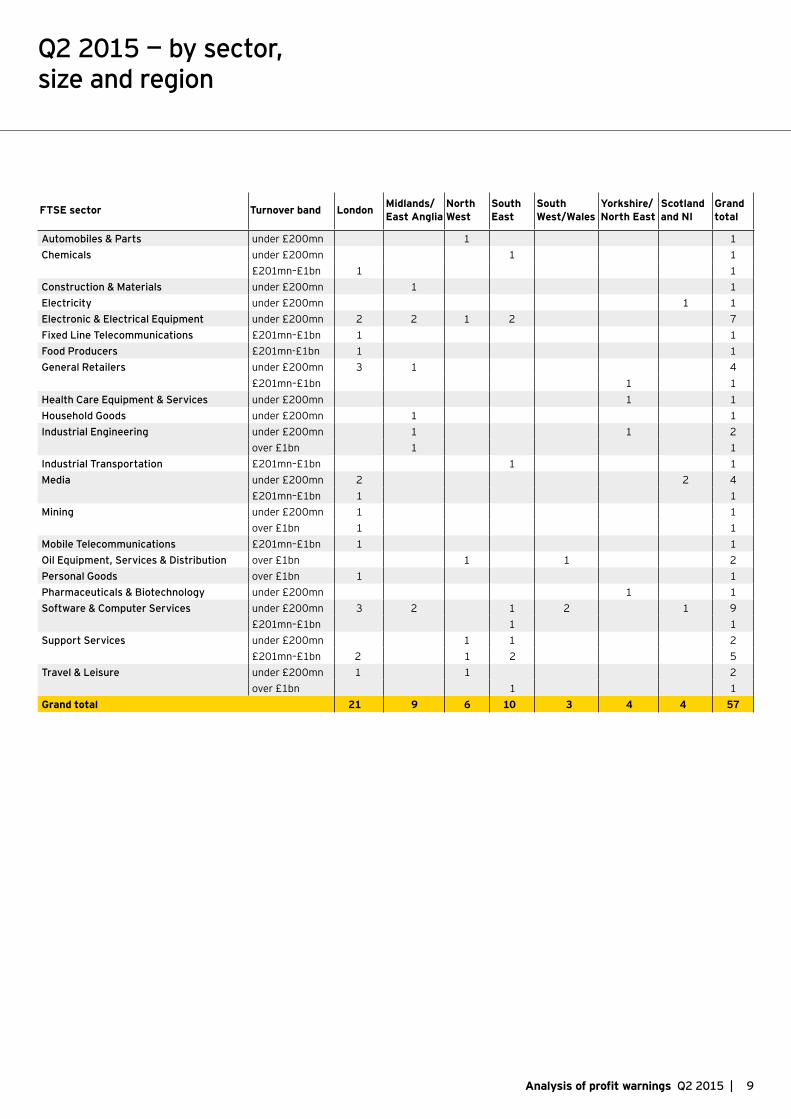
Q2 2015 — by sector, size and region
FTSE sector Turnover band London Midlands/East Anglia
North West
South East
South West/Wales
Yorkshire/North East
Scotland and NI
Grand total
Automobiles & Parts under £200mn 1 1Chemicals under £200mn 1 1
£201mn–£1bn 1 1Construction & Materials under £200mn 1 1Electricity under £200mn 1 1Electronic & Electrical Equipment under £200mn 2 2 1 2 7Fixed Line Telecommunications £201mn–£1bn 1 1Food Producers £201mn-£1bn 1 1General Retailers under £200mn 3 1 4
£201mn–£1bn 1 1Health Care Equipment & Services under £200mn 1 1Household Goods under £200mn 1 1Industrial Engineering under £200mn 1 1 2
over £1bn 1 1Industrial Transportation £201mn–£1bn 1 1Media under £200mn 2 2 4
£201mn–£1bn 1 1Mining under £200mn 1 1
over £1bn 1 1Mobile Telecommunications £201mn–£1bn 1 1Oil Equipment, Services & Distribution over £1bn 1 1 2Personal Goods over £1bn 1 1Pharmaceuticals & Biotechnology under £200mn 1 1Software & Computer Services under £200mn 3 2 1 2 1 9
£201mn–£1bn 1 1Support Services under £200mn 1 1 2
£201mn–£1bn 2 1 2 5Travel & Leisure under £200mn 1 1 2
over £1bn 1 1Grand total 21 9 6 10 3 4 4 57
10 | Analysis of profit warnings Q2 2015
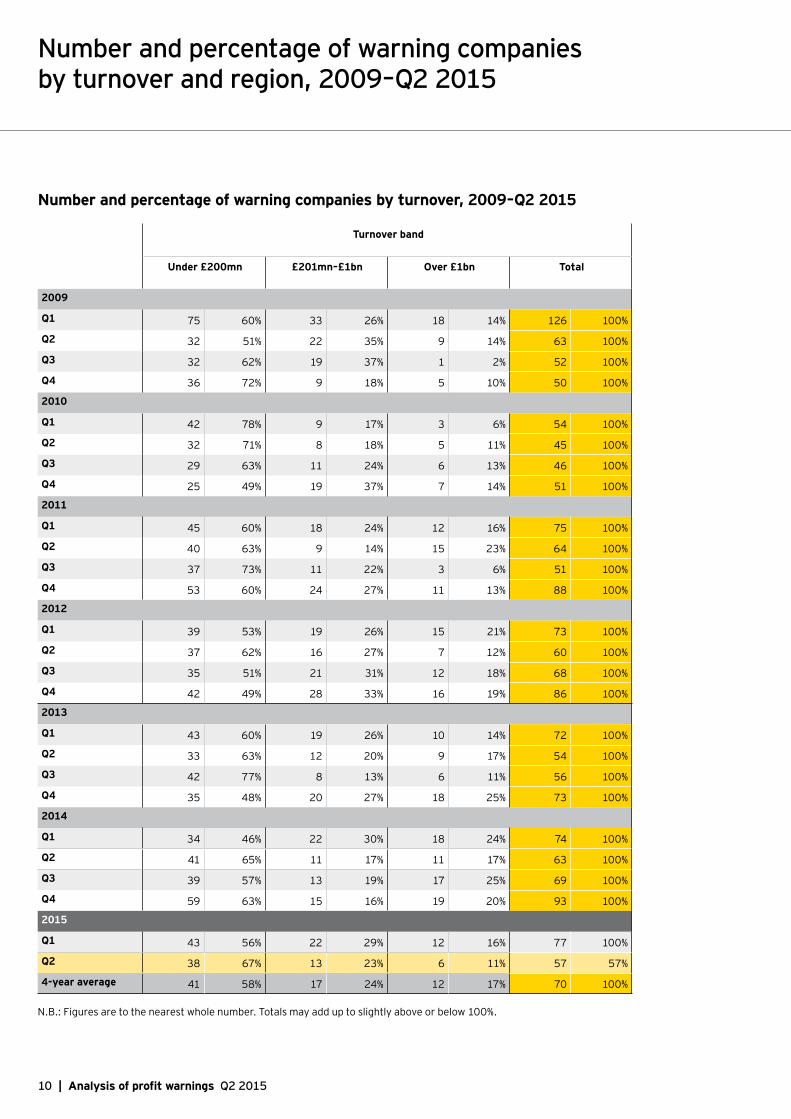
Number and percentage of warning companies by turnover and region, 2009–Q2 2015
Number and percentage of warning companies by turnover, 2009–Q2 2015
Turnover band
Under £200mn £201mn–£1bn Over £1bn Total
2009
Q1 75 60% 33 26% 18 14% 126 100%
Q2 32 51% 22 35% 9 14% 63 100%
Q3 32 62% 19 37% 1 2% 52 100%
Q4 36 72% 9 18% 5 10% 50 100%
2010
Q1 42 78% 9 17% 3 6% 54 100%
Q2 32 71% 8 18% 5 11% 45 100%
Q3 29 63% 11 24% 6 13% 46 100%
Q4 25 49% 19 37% 7 14% 51 100%
2011
Q1 45 60% 18 24% 12 16% 75 100%
Q2 40 63% 9 14% 15 23% 64 100%
Q3 37 73% 11 22% 3 6% 51 100%
Q4 53 60% 24 27% 11 13% 88 100%
2012
Q1 39 53% 19 26% 15 21% 73 100%
Q2 37 62% 16 27% 7 12% 60 100%
Q3 35 51% 21 31% 12 18% 68 100%
Q4 42 49% 28 33% 16 19% 86 100%
2013
Q1 43 60% 19 26% 10 14% 72 100%
Q2 33 63% 12 20% 9 17% 54 100%
Q3 42 77% 8 13% 6 11% 56 100%
Q4 35 48% 20 27% 18 25% 73 100%
2014
Q1 34 46% 22 30% 18 24% 74 100%
Q2 41 65% 11 17% 11 17% 63 100%
Q3 39 57% 13 19% 17 25% 69 100%
Q4 59 63% 15 16% 19 20% 93 100%
2015
Q1 43 56% 22 29% 12 16% 77 100%
Q2 38 67% 13 23% 6 11% 57 57%
4-year average 41 58% 17 24% 12 17% 70 100%
N.B.: Figures are to the nearest whole number. Totals may add up to slightly above or below 100%.

11Analysis of profit warnings Q2 2015 |
Number and percentage of warning companies by region, 2009–Q2 2015
Region
London Midlands/ East Anglia
North West Scotland and NI
South East South West/ Wales
Yorkshire/ North East
Total
2009
Q1 32 27% 12 10% 3 3% 126 100% 24 21% 14 12% 19 16% 117 100%
Q2 18 29% 10 16% 3 5% 63 100% 14 22% 5 8% 10 16% 63 100%
Q3 15 29% 9 17% 0 0% 52 100% 6 12% 7 13% 5 10% 52 100%
Q4 18 36% 7 14% 2 4% 50 100% 9 18% 5 10% 5 10% 50 100%
2010
Q1 11 20% 12 22% 3 6% 1 2% 15 28% 6 11% 6 11% 54 100%
Q2 7 16% 9 20% 2 4% 2 4% 12 27% 7 16% 6 13% 45 100%
Q3 9 20% 8 17% 4 9% 3 7% 11 24% 6 13% 5 11% 46 100%
Q4 11 22% 6 12% 10 20% 1 2% 11 22% 6 12% 6 12% 51 100%
2011
Q1 22 29% 10 13% 8 11% 2 3% 24 32% 2 3% 7 9% 75 100%
Q2 15 23% 4 6% 6 9% 2 3% 15 23% 11 17% 11 17% 64 100%
Q3 21 41% 5 10% 2 4% 2 4% 10 20% 5 10% 6 12% 51 100%
Q4 20 23% 9 22% 8 9% 1 1% 18 20% 9 10% 13 15% 88 100%
2012
Q1 21 29% 3 18% 5 7% 5 7% 17 23% 5 7% 7 10% 73 100%
Q2 13 22% 7 12% 7 12% 5 8% 15 25% 3 5% 10 17% 60 100%
Q3 20 29% 12 18% 8 12% 4 6% 14 21% 5 7% 5 7% 68 100%
Q4 34 40% 10 12% 7 8% 5 6% 18 21% 8 9% 4 5% 86 100%
2013
Q1 22 31% 11 15% 10 14% 2 3% 11 15% 7 10% 9 13% 72 100%
Q2 16 30% 5 9% 4 7% 7 13% 16 30% 2 4% 4 7% 54 100%
Q3 19 34% 10 18% 2 4% 3 5% 10 18% 5 9% 7 13% 56 100%
Q4 19 26% 6 8% 4 5% 8 11% 22 30% 9 12% 5 7% 73 100%
2014
Q1 26 35% 9 12% 5 7% 3 4% 13 18% 9 12% 9 12% 74 100%
Q2 17 27% 8 13% 4 6% 3 5% 14 22% 6 10% 11 17% 63 100%
Q3 26 38% 9 13% 1 1% 5 7% 18 26% 7 10% 3 4% 69 100%
Q4 29 31% 12 13% 7 8% 4 4% 23 25% 11 12% 7 8% 93 100%
2015
Q1 31 40% 6 8% 8 10% 3 4% 16 21% 7 9% 6 8% 77 100%
Q2 21 37% 9 16% 6 11% 4 7% 10 18% 3 5% 4 7% 57 100%
4-year average 22 31% 9 13% 6 8% 4 6% 16 22% 7 10% 7 11% 70 100%

About EYEY is a global leader in assurance, tax, transaction and advisory services. The insights and quality services we deliver help build trust and confidence in the capital markets and in economies the world over. We develop outstanding leaders who team to deliver on our promises to all of our stakeholders. In so doing, we play a critical role in building a better working world for our people, for our clients and for our communities.
EY refers to the global organization, and may refer to one or more, of the member firms of Ernst & Young Global Limited, each of which is a separate legal entity. Ernst & Young Global Limited, a UK company limited by guarantee, does not provide services to clients. For more information about our organization, please visit ey.com.
About EY’s Transaction Advisory ServicesHow you manage your capital agenda today will define your competitive position tomorrow. We work with clients to create social and economic value by helping them make better, more informed decisions about strategically managing capital and transactions in fast changing-markets. Whether you’re preserving, optimizing, raising or investing capital, EY’s Transaction Advisory Services combine a unique set of skills, insight and experience to deliver focused advice. We help you drive competitive advantage and increased returns through improved decisions across all aspects of your capital agenda.
Ernst & Young LLPThe UK firm Ernst & Young LLP is a limited liability partnership registered in England and Wales with registered number OC300001 and is a member firm of Ernst & Young Global Limited.
Ernst & Young LLP, 1 More London Place, London, SE1 2AF.
© 2015 Ernst & Young LLP. Published in the UK. All Rights Reserved.
ED None
7710.indd (UK) 07/15. Artwork by Creative Services Group Design.
In line with EY’s commitment to minimise its impact on the environment, this document has been printed on paper with a high recycled content.
Information in this publication is intended to provide only a general outline of the subjects covered. It should neither be regarded as comprehensive nor sufficient for making decisions, nor should it be used in place of professional advice. Ernst & Young LLP accepts no responsibility for any loss arising from any action taken or not taken by anyone using this material.
ey.com/uk
EY | Assurance | Tax | Transactions | AdvisoryContacts
Alan Hudson Partner + 44 20 7951 9947 [email protected]
Lee Watson Partner + 44 20 7951 3274 [email protected]
Jon Morris Partner + 44 20 7951 9869 [email protected]
Kirsten Tompkins Analyst + 44 121 535 2504 [email protected]