ExxonMobil Chemical Company - US EPA
89
Transcript of ExxonMobil Chemical Company - US EPA


12727 Featherwood drive, Suite 210 • Houston, Texas • 77034 • 281/484-6200 • Fax 281/484-6201
Greenhouse Gas Prevention of Significant Deterioration
Permit Application for Polyethylene Unit
ExxonMobil Chemical Company Mont Belvieu Plastics Plant
Mont Belvieu, Texas
Revised March 2013
Prepared by

Sage Environmental Consulting, L.P. i ExxonMobil Mont Belvieu Plastics Plant Revised March 2013 New Polyethylene Plant Permit Application
TABLE OF CONTENTS
SECTION 1 Introduction .................................................................................................... 1-1 1.1 Background .............................................................................................................. 1-1 1.2 Purpose of Request .................................................................................................. 1-1 1.3 Facility Information ................................................................................................. 1-2 1.4 Federal GHG Permitting Applicability ................................................................... 1-2 1.5 Application Contents ............................................................................................... 1-2
SECTION 2 Project Description......................................................................................... 2-1 2.1 Process Description ................................................................................................. 2-1 2.2 Description of New Facilities .................................................................................. 2-2
2.2.1 Regenerative Thermal Oxidizer .................................................................. 2-2 2.2.2 Vent Collection System ............................................................................... 2-2 2.2.3 Boilers .......................................................................................................... 2-7 2.2.4 Equipment Fugitive Components ................................................................ 2-7 2.2.5 Analyzers ..................................................................................................... 2-8 2.2.6 Hexene Storage Tank .................................................................................. 2-8 2.2.7 Cooling Tower ............................................................................................. 2-8 2.2.8 Wastewater .................................................................................................. 2-8 2.2.9 Miscellaneous Vents .................................................................................... 2-8
SECTION 3 GHG Emission Calculation Methodology .................................................... 3-1 3.1 CO2e Emissions ....................................................................................................... 3-1 3.2 Regenerative Thermal Oxidizer .............................................................................. 3-2 3.3 Vent Collection System ........................................................................................... 3-2 3.4 Boilers ...................................................................................................................... 3-3 3.5 Equipment Fugitive Emissions ................................................................................ 3-3 3.6 Analyzers ................................................................................................................. 3-4 3.7 Hexene Storage Tank .............................................................................................. 3-4 3.8 Cooling Tower ......................................................................................................... 3-4 3.9 Wastewater .............................................................................................................. 3-4 3.10 Miscellaneous Vents ................................................................................................ 3-5
SECTION 4 GHG Best Available Control Technology Analysis .................................... 4-1 4.1 BACT Analysis Methodology ................................................................................. 4-1 4.2 Regenerative Thermal Oxidizer .............................................................................. 4-2
4.2.1 Step 1 – Identification of Potential Control Technologies .......................... 4-3

Sage Environmental Consulting, L.P. ii ExxonMobil Mont Belvieu Plastics Plant Revised March 2013 New Polyethylene Plant Permit Application
4.2.2 Step 2 - Eliminate Technically Infeasible Options ...................................... 4-6 4.2.3 Step 3 - Rank Remaining Control Technologies ......................................... 4-7 4.2.4 Step 4 - Evaluate the Most Effective Controls and Document Results ....... 4-7 4.2.5 Step 5 - Selection of BACT ......................................................................... 4-7
4.3 Vent Collection System ........................................................................................... 4-8 4.3.1 Step 1 – Identification of Potential Control Technologies .......................... 4-9 4.3.2 Step 2 - Eliminate Technically Infeasible Options .................................... 4-10 4.3.3 Step 3 - Rank Remaining Control Technologies ....................................... 4-20 4.3.4 Step 4 - Evaluate the Most Effective Controls and Document Results ..... 4-20 4.3.5 Step 5 - Selection of BACT ....................................................................... 4-20
4.4 Boilers .................................................................................................................... 4-22 4.4.1 Step 1 – Identification of Potential Control Technologies ........................ 4-23 4.4.2 Step 2 - Eliminate Technically Infeasible Options .................................... 4-26 4.4.3 Step 3 - Rank Remaining Control Technologies ....................................... 4-26 4.4.4 Step 4 - Evaluate the Most Effective Controls and Document Results ..... 4-26 4.4.5 Step 5 - Selection of BACT ....................................................................... 4-27
4.5 Equipment Component Fugitives .......................................................................... 4-27 4.5.1 Step 1 – Identify Potential Control Technologies ..................................... 4-28 4.5.2 Step 2 - Eliminate Technically Infeasible Options .................................... 4-28 4.5.3 Step 3 - Rank Remaining Control Technologies ....................................... 4-29 4.5.4 Step 4 - Evaluate the Most Effective Controls and Document Results ..... 4-29 4.5.5 Step 5 - Selection of BACT ....................................................................... 4-30
4.6 Analyzers ............................................................................................................... 4-30
SECTION 5 Other PSD Requirements .............................................................................. 5-1
5.1 Impacts Analysis ..................................................................................................... 5-1 5.2 GHG Preconstruction Monitoring ........................................................................... 5-1 5.3 Additional Impacts Analysis ................................................................................... 5-1 5.4 Endangered Species ................................................................................................. 5-2 5.5 Environmental Justice ............................................................................................. 5-2 5.6 Historical Preservation ............................................................................................ 5-3
SECTION 6 Considerations for Granting a Permit ......................................................... 6-1
SECTION 7 Other Administrative Requirements ............................................................ 7-1

Sage Environmental Consulting, L.P. iii ExxonMobil Mont Belvieu Plastics Plant Revised March 2013 New Polyethylene Plant Permit Application
LIST OF TABLES Table 1-1 GHG PSD Applicability Summary ......................................................... 1-3 Table 3-1 GWP Table ............................................................................................. 3-2 Table 3-2 Emission Point Summary ....................................................................... 3-6 Table 4-1 Economic Analysis for Vent Gas Recovery ......................................... 4-12 Table 4-2 Economic Analysis for Carbon Capture and Compression .................. 4-17 Table 4-3 Economic Analysis for CO2 Transport ................................................. 4-18 Table 4-4 Economic Analysis for CCS ................................................................. 4-19 Table 7-1 Administrative Information .................................................................... 7-2 LIST OF FIGURES Figure 1-1 Area Map ............................................................................................................. 1-4 Figure 1-2 Plot Plan .............................................................................................................. 1-5 Figure 2-1 Process Block Flow Diagram ............................................................................ 2-10 Figure 2-2 Vent Collection System Flare Headers Simplified Schematic .......................... 2-11
LIST OF APPENDICES Appendix A GHG Emission Calculations Appendix B RACT/BACT/LAER Clearinghouse Appendix C Work Practice Standards and Operational Limitations Table

Sage Environmental Consulting, L.P. 1-1 ExxonMobil Mont Belvieu Plastics Plant Revised March 2013 New Polyethylene Plant Permit Application
SECTION 1 INTRODUCTION
ExxonMobil Chemical Company (ExxonMobil) owns and operates a polyethylene plant in Mont Belvieu, Chambers County, Texas known as Mont Belvieu Plastics Plant (MBPP). ExxonMobil is hereby requesting an authorization to construct new equipment at the MBPP which will allow for an increase in polyethylene production, herein referred to as the proposed project.
1.1 Background
Increased North American shale gas production is positive news for the U.S. economy and, in particular, U.S. petrochemical manufacturers who have benefited not only from lower energy costs, but also from the increased availability of advantaged light feedstock such as ethane – both of which lower overall chemical production costs. This has resulted in numerous announcements of North American ethane cracking studies. ExxonMobil’s U.S. Gulf Coast manufacturing facilities are well-positioned to capitalize on the growing U.S. ethane infrastructure, to expand our domestic capability to produce ethylene and polyethylene, and to supply our high quality commodity and specialty products to customers around the world. The proposed investment reflects ExxonMobil’s continued confidence in the natural gas-driven revitalization of the U.S. chemical industry. If ExxonMobil elects to proceed with this project, it could greatly benefit local economies by creating new jobs and economic growth in the U.S. Gulf Coast region. The project is expected to create about 350 full-time jobs and about 10,000 temporary construction jobs; and would be constructed in and integrated into existing ExxonMobil facilities, taking advantage of existing energy infrastructure. It is also estimated that an additional 3,700 permanent jobs would be created in the local community through multiplier effects.
1.2 Purpose of Request
The MBPP is an existing major source as defined within the Federal Prevention of Significant Deteriorations (PSD) Permit Program. Therefore, physical changes and changes in the method of operation are potentially subject to PSD permitting requirements. The proposed project will trigger PSD review for Greenhouse Gas (GHG). The permit application has been prepared based upon EPA’s “New Source Review Workshop Manual” and additional GHG guidance. This permit application is submitted pursuant to EPA's Federal Implementation Plan Regarding Texas' Prevention of Significant Deterioration Program for certain stationary sources that emit greenhouse gases in Texas. 75 Fed. Reg. 82430 (December 30, 2010); 40 CFR 52.2303(d).

Sage Environmental Consulting, L.P. 1-2 ExxonMobil Mont Belvieu Plastics Plant Revised March 2013 New Polyethylene Plant Permit Application
1.3 Facility Information
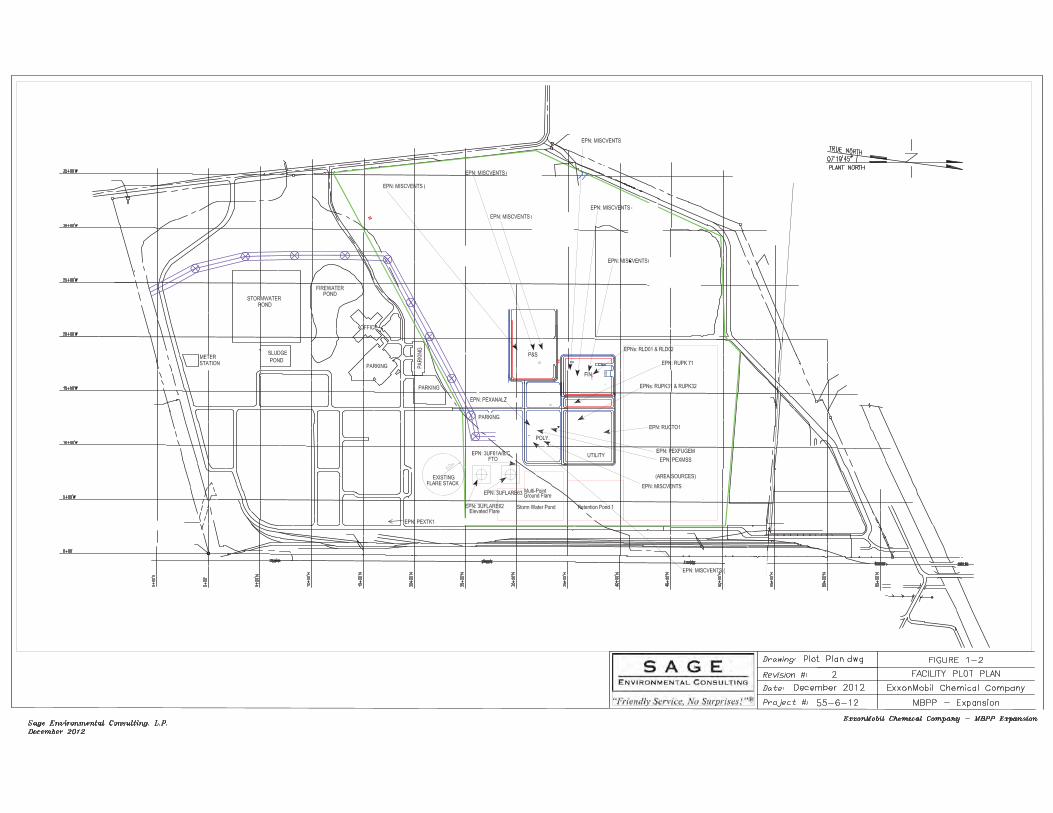
The MBPP is located at 13330 Hatcherville Road, Mont Belvieu, Texas. Figure 1-1 at the end of this section presents the facility location relative to nearby topographic features. This map is based on a United States Geological Survey (USGS) quadrangle map. As indicated by the area map, no schools are located within 3,000 feet of the facility. Figure 1-2, also located at the end of this section, is the facility plot plan showing the location of the emission points associated with the proposed project.
1.4 Federal GHG Permitting Applicability
The MBPP is an existing major source for all criteria pollutants and has potential to emit (PTE) for GHG greater than 100,000 tons per year (tpy) on a Carbon Dioxide-equivalent (CO2e) basis and greater than 100 tpy on a mass basis. GHG emissions from the proposed project are Carbon Dioxide (CO2), Methane (CH4), and Nitrous Oxide (N2O), and are expressed as CO2e. The project GHG emissions from new and modified sources are estimated to be 132,807 tons of CO2e annually; therefore, the project triggers PSD review for GHG emissions.
Any creditable GHG emissions decreases in the contemporaneous period have not been relied upon for the proposed project. Because an air quality impact analysis is not required for GHG emissions and inclusion of contemporaneous GHG emissions increases and decreases would not change the scope of the analyses required for issuance of the permit, both the PSD applicability determination and the subsequent permit application requirements are complete without a full contemporaneous netting analysis. Refer to Table 1-1 at the end of this section for a summary of the proposed project’s GHG PSD applicability.
1.5 Application Contents
Key components of this application are organized as follows:
An area map and plot plan are provided at the end of Section 1;
A project description is included in Section 2;
Emission rate calculation methodologies are discussed in Section 3;
Best Available Control Technology (BACT) analysis is discussed in Section 4;
Other PSD requirements are discussed in Section 5;
Considerations for granting a permit are presented in Section 6;
Other administrative information is contained in Section 7;
Appendix A represents emission calculations tables; and
Appendix B contains the RACT/BACT/LAER Clearinghouse analysis.
Appendix C contains information pertaining to emission unit work practice standards, operational requirements, and/or monitoring.

Sage Environmental Consulting, L.P. 1-3 ExxonMobil Mont Belvieu Plastics Plant Revised March 2013 New Polyethylene Plant Permit Application
Table 1-1 GHG PSD Applicability Summary
POLLUTANTS
GHG1 CO2e
Nonattainment? (yes or no) No
Existing site PTE (tpy)? >100 >100,000
Proposed project emission increases (tpy) 130,364 132,807
Is the existing site a major source2? If not, is the project a major source by itself2? (yes or no) Yes
If site is major, is project increase significant? Yes
Net contemporaneous change, including proposed project (tpy) >100 >75,000
FNSR APPLICABLE? (yes or no) Yes (PSD)
Estimated start of construction? 03/01/2013
Estimated start of operation? 2Q 2016
1 Sum of the mass emissions in tpy of CO2, N2O, and CH4 for the proposed project. 2 PSD thresholds are found in 40 CFR § 51.21(49)(v).

FIGURE 1-1AREA MAPSCALE
Sage Enviromental Consulting, L.P.Revised March 2013
ExxonMobil Chemical Company - Mont Belvieu Plastics Plant
313500 314500 315500 316500
3305
000
3306
000
3307
000
3308
000
3000 Feet
1 Mile
0 250 500 750 1000
New Unit
Plant Boundary

Sage Environmental Consulting, L.P. 2-1 ExxonMobil Mont Belvieu Plastics Plant Revised March 2013 New Polyethylene Plant Permit Application
SECTION 2 PROJECT DESCRIPTION
2.1 Process Description
This section provides a description of the proposed Polyethylene (PE) Unit at the ExxonMobil Chemical Company’s Mont Belvieu Plastics Plant (MBPP).
The MBPP PE Unit will manufacture polyethylene resin (plastics) using low pressure, gas phase fluidized bed reactors. The proposed facilities include feed purification, polymerization, resin degassing, additives addition, pelletization, blending, storage and shipping.
Transition metal halides and metal alkyls are impregnated onto catalyst support particles similar to fine sand. After manufacture, the catalyst is measured and conveyed into the reactor with an inert gas. The catalyst initiates the reaction of monomer (ethylene) and co-monomers (butene, hexene) in the reactor. Potential trace components that may impact the polymerization process are removed from reactor feed streams in the purification area. This purification process takes place in packed bed vessels.
The reaction of gases involves polymerization, which is the linking or bonding of molecules to produce the polymer. Non-reactive components are used to control catalyst activity and/or act as a heat removal medium. In certain products, a metal alkyl is injected in small amounts to scavenge catalyst poisons and act as a co-catalyst.
The polymer produced in the reactor is in the form of granules suspended by circulating gases used to remove heat. The polymer particles in the circulating gas form a fluidized bed in the reactor. Granular polyethylene is periodically removed through a series of tanks, along with entrained gas.
Unreacted gases are removed from the gas/resin stream leaving the reactor by degassing purge vessels that strip the gas from polyethylene product using an inert gas . Stripped gases are recovered with a vent recovery system. Some of the unrecovered residual hydrocarbon lean gases are routed through a vent collection system for destruction in a flameless thermal oxidizer (FTO) system, an elevated flare, and/or a multi-point ground flare (MPGF). The MPGF will manage vent streams during periods of high load. A very small amount of residual hydrocarbon remains in the resin after purging. Liquid and dry additives are added to the granular product in accurately metered concentrations.
Granular resin is air-conveyed from the purger area into silos known as Feed Bins. Bag filters on the bins control particulate emissions. The extruder uses mechanical work to melt the plastic and push it through a die-plate containing small holes. The plastic extrudes through these holes into spaghetti-like strands. Residual hydrocarbon that may evolve during conveying is routed to a regenerative thermal oxidizer (RTO). The strands are cut with a

Sage Environmental Consulting, L.P. 2-2 ExxonMobil Mont Belvieu Plastics Plant Revised March 2013 New Polyethylene Plant Permit Application
series of rotating knives into small pieces known as pellets. These pellets are then conveyed into product silos.
The material is air-conveyed from the product silos to loadout. The product silos and load out stations are equipped with bag filters and cyclones to minimize the emission of particles to the atmosphere. Auxiliary systems include a cooling tower, steam boilers, and wastewater.
There will be miscellaneous vent groups associated with the new PE unit as follows:
A. Miscellaneous vent groups emitting VOC and particulate matter emissions which include:
• Loadout sources • Pellet product sources • Bagging filter system • Finishing and packaging building fugitives
B. Miscellaneous vent groups emitting only particulate matter emissions which include:
• Additive sources • Catalyst transfer sources
Figure 2-1 presents a simplified process flow diagram (PFD) for the proposed project.
2.2 Description of New Facilities
The following subsections provide a brief description of the emission sources from the proposed project. Design capacity is included in the subsections below or Appendix A and an operating schedule is included in Table 7-1 of this application for each of the proposed sources.
2.2.1 Regenerative Thermal Oxidizer The new regenerative thermal oxidizer (RTO) (EPN: RUPK71) will control the residual VOC emissions from the powder hopper bag filter, conveying air vents and extruder feed vents, all of which typically have less than 130 ppmv of residual hydrocarbons. Supplemental fuel is added to the stream during start-up to ensure sufficient heating value.
2.2.2 Vent Collection System
Multiple hydrocarbon vent streams from routine continuous (e.g., purger vent) and intermittent (e.g., feed purification bed regeneration, startup/shutdown, etc.) operations will be controlled by a Vent Collection System. The Vent Collection System is comprised of two separate headers: a High Pressure (HP) Vent Header and a Low Pressure (LP) Vent Header. Figure 2-2 contains a simplified schematic depicting the new control system for the vent collection system.

Sage Environmental Consulting, L.P. 2-3 ExxonMobil Mont Belvieu Plastics Plant Revised March 2013 New Polyethylene Plant Permit Application
The Vent Collection System is designed to handle predominantly hydrocarbon streams in direct contact with the process (enclosed polymerization area) of the polyethylene (PE) unit. Downstream of this section where almost all the hydrocarbons have been purged from the product, there are trace amounts of hydrocarbons (ppmw range). The vents from this area are controlled with the RTO described in section 2.2.1, above.
2.2.2.1 High Pressure Vent Header
The HP Vent Header is designed to receive high load, short duration vent streams, also referred to as the “high volume, high pressure” (HVHP) vent stream from the reactors and the high capacity feed supply depressure. The primary control device that will control VOC emissions on the HP Vent Header is a multi-point ground flare system, such as John Zink Company’s LRGO multi-point flare system, or one that is comparable. The multi-point ground flare system (EPN: 3UFLARE63) has a principle application to the petroleum refining and chemical processing industries due to its internal staging system that ensures short, smokeless flames maintained over the full operating range of the flare since burners are sequentially opened to maintain control.
The multi-point ground flare is expected to achieve a DRE well above the 98 to 99% DRE accepted for assist-type flares. Multi-point ground flare vendors have indicated that available ground flare technology will achieve 99.5% to 99.8%+ DRE for hydrocarbons. In fact, John Zink Company performed testing on the LRGO burner design and submitted the data and results to USEPA. The LRGO burner demonstrated 99.82% combustion efficiency when combusting a crude propylene stream. The composition of the HVHP vent stream that will be routed to the proposed multi-point ground flare system is comparable to the crude propylene used in the John Zink test since it contains highly combustible components such as hexene, hexane, isopentane, butene, butane, and ethylene, resulting in a typical heating value in excess of 800 BTU per standard cubic foot (Btu/scf) of off gas. Furthermore, after reviewing the proposed streams to be combusted in the multi-point ground flare as part of this project, John Zink has provided a performance guarantee stating that the hydrocarbon destruction efficiency will be 99.8% or greater when the multi-point ground flare is operated in the following range:
• Burner operating pressure > 4 psig and
• Flare gas net heating value > 800 BTU/SCF.
The operation of the multi-point ground flare system will be designed to meet the above requirements. Use of staging valves in this multi-header design allows the required minimum pressure of 4 psig to be maintained while the multi-point ground flare is operated. The HVHP vent stream that will be routed to the multi-point ground flare will consistently have a net heating

Sage Environmental Consulting, L.P. 2-4 ExxonMobil Mont Belvieu Plastics Plant Revised March 2013 New Polyethylene Plant Permit Application
value in excess of 800 Btu/scf. However, during the venting process, the stream may be diluted with nitrogen addition. In these instances, a computer control application will safely divert flow away from the multi-point ground flare and route it to the LP header. The two separate headers (HP and LP) will be connected through a spill-over line with a HP to LP valve controlled by a computer control application which will be used to direct the flow away from the HP header system. This may occur during defined periods of unit purging for shutdowns or startups when using nitrogen that dilutes the heat content (BTU/scf). This computer control application will also divert flow from the HP Vent Header to the LP Vent Header upon instances when the HVHP vent does not have adequate pressure above 4 psig. This computer control application will ensure the multi-point ground flare is operated only at times when the HP Vent Header meets the design conditions to achieve good combustion efficiency.
There may be a few instances where the waste gas will contain hydrogen. It is widely known that hydrogen contributes to good combustion more than its volumetric heating value of 274 Btu/scf would imply. Most notably, hydrogen contributes to good combustion as a result of a high flame speed. In an effort to address this consideration, an adjustment to the volumetric heating value of hydrogen is made when calculating the net heating value of waste gas streams routed to flares. This “net heating value of hydrogen as adjusted1” is 1,212 Btu/scf and more accurately reflects the realized contribution hydrogen makes to the good combustion of waste gas streams routed to flares.
The proposed multi-point ground flare system will use an array of high pressure burners to produce short, highly efficient flames. Pressure assisted burners utilize the flare gas pressure to ensure high exit velocity at the burner exit. The high velocity produces the energy required to promote high air entrainment and mixing in the combustion zone. This entrainment / mixing energy in the combustion zone is the key to producing an efficient, smokeless flame. This energy level is created by a high velocity discharge without requiring supplemental energy such as steam or forced air blowers. The philosophy of the control system provides that when gas (energy) flow is low, the number of burners is reduced in order that there is sufficient fuel supply to each burner to maintain the required energy level for clean burning.
The multi-point ground flare system will be provided with multiple headers, each header having multiple risers with burners. The burner is designed such that a number of small diameter ports eject high velocity gas, enhancing air entrainment and mixing for efficient and clean combustion. The aerodynamics of the burner provides air cooling and prevents flame recirculation, eliminating burner over-heating and internal coking. The staging control system, which can be either programmable logic controller (PLC) or distributed control system (DCS) based, will receive input from pressure transmitters and opens and closes staging valves according to waste

Sage Environmental Consulting, L.P. 2-5 ExxonMobil Mont Belvieu Plastics Plant Revised March 2013 New Polyethylene Plant Permit Application
gas pressure. Each stage is operated automatically with an actuated valve that opens or closes upon demand.
For the purposes of estimating GHG emissions, a flare combustion efficiency of 99.5% was applied since the pressure-assisted flare design has demonstrated higher efficiency when the total heating value of the flare stream is greater than 800 Btu/scf. The current multi-point ground flare design contains multiple runners and will contain pilots on each runner that will fire pipeline quality natural gas. A flow measurement system will be installed on the header to the multi-point ground flare. The pilots will be monitored for presence of flame. The emissions calculations for the multi-point ground flare i.e., 3UFLARE63 Intermittent Flaring and 3UFLARE63 Pilot Gas are contained in Appendix A.
2.2.2.2 Low Pressure Vent Header
The LP Vent Header will receive routine continuous vent streams from the process, as well as routine intermittent vent streams. The streams are also referred to as “low volume, low pressure” (LVLP) streams. A high VOC control efficiency can be achieved through the use of multiple flameless thermal oxidizers (FTOs) with an elevated flare serving as a secondary disposition.
The LP Vent Header will be equipped with on-line analyzers that provide real time measurement of the heat content and speciation of vent streams to the LP Vent Header. Since the LP Vent Header is the primary collection header for routine continuous operation vent streams that include potential infrequent periods of low heating value streams, the heat content analyzer provides the signal to allow for supplemental natural gas injection, if required, to maintain minimum heating value content in the vent gas.
2.2.2.2.1 Flameless Thermal Oxidizers
The primary control devices for the LP Vent Header are three FTOs (EPNs: 3UF61A/B/C), operated in parallel. Installing and operating three FTOs provides the capacity to reliably control the expected routine vent stream flow within the LP Vent Header for VOC emissions abatement. An automatic feed control system shall be provided to the FTOs to ensure optimal operation over a wide range of plant operation. Excess flow beyond the capacity of the FTOs will be routed to the elevated flare through a liquid seal drum. This control scheme ensures flow from the LP vent header will preferentially be routed to the FTOs.
Flameless Thermal Oxidizers (FTOs) are state of the art technology to control VOC emissions by achieving a very high destruction efficiency

Sage Environmental Consulting, L.P. 2-6 ExxonMobil Mont Belvieu Plastics Plant Revised March 2013 New Polyethylene Plant Permit Application
(rated at 99.99% VOC DRE) over a wide range of stream compositions. An air blower on the LP Vent Header ensures the flow is preferentially directed to this high efficiency combustion device that requires virtually no supplemental fuel addition for combustion during normal operation.
The proposed FTO system combusts natural gas during startup to achieve required operating temperature of the reaction bed. Once online, the FTO system utilizes natural gas only when the control application determines the minimum heating value is not contained within the incoming vent stream, therefore supplemental fuel is required to maintain proper control device temperature and destruction efficiency. The process conditions for the LP Vent Header are such that the routine vent streams routed to the FTOs contain sufficient heating value to maintain proper operating temperature, therefore supplemental fuel is not required for operation, other than at times of exceptionally low flow rates, and as such, the control application works to utilize supplemental fuel only when required due to the absence of heating value in the incoming feed stream. An air blower with flow controls will be utilized to provide optimization of the excess oxygen present and bed temperature profile in the reactor. However, it must be noted that higher excess oxygen at stack does not necessarily indicate lower energy efficiency (unlike boilers) of the equipment when the feed stream has more than adequate heat content and no supplemental fuel firing is required.
The patented technology of the proposed FTO system consists of a packed-bed, refractory-lined reactor filled with porous, inert ceramic media. Organic compounds are oxidized into CO2 and water vapor. At startup, the ceramic packing in the oxidizer vessel is heated to the required operating temperature with a natural gas fired burner.
Unlike other packed-bed technologies, the reaction zone is stationary and continuous. This feature eliminates channeling or bypassing, allowing complete and efficient combustion while generating very low concentrations of NOX and carbon monoxide (CO).
The nature of the reactor is to establish a reaction zone. The reaction zone is maintained at proper operating temperature. All the gases fed to the system must pass through this reaction zone, i.e., there are no bypasses or shortcuts. As such, all the gases along with combustion air pass slowly through this zone, fully oxidizing the organic materials. This assures that the FTO meets and exceeds 99.99% destruction efficiency.
High level of destruction is applicable to CO as well. A typical indicator for incomplete combustion is the presence of CO; however,
Sage Environmental Consulting, L.P. 2-7 ExxonMobil Mont Belvieu Plastics Plant Revised March 2013 New Polyethylene Plant Permit Application
with mixing not being a problem in the FTOs, the only time CO may be present is when there is insufficient air in the system. In this instance the stack oxygen measurement would adjust the system (increase air and/or reduce feed stream flow), therefore, temperature and oxygen concentration are the parameters that demonstrate good combustion and control equipment operation to its optimum performance.
2.2.2.2.2 Elevated Flare
The elevated flare (EPN: 3UFLARE62) provides the additional capability necessary to control all vent streams during normal operation of the LP Vent Header and is the control device of least priority within the vent collection system due to: (1) the comparatively lower destruction efficiency (DRE of 99% for hydrocarbons with three or less carbon atoms and 98% for hydrocarbons with more than three carbon atoms) and (2) this device requires supplemental natural gas, during periods of low heating value content. Air blowers or steam assist will be provided as part of the elevated flare system.
The elevated flare (EPN: 3UFLARE62) will be designed to achieve a DRE of 99% for hydrocarbons with three or less carbon atoms and 98% for hydrocarbons with more than three carbon atoms with smokeless operation, however, for the purposes of estimating GHG emissions, an assumed flare combustion efficiency of 98% was applied since the total carbon content was the basis for emissions estimating, which does not segregate hydrocarbons.
The design of the elevated flare will be completed by an industry leader in flare technology and will incorporate industry-leading technology, including online flow and composition measurement and computer control. A flow measurement system will also be installed on the header to the elevated flare. The pilots will be fired by natural gas and will be monitored for presence of flame.
2.2.3 Boilers
Two new boilers each with a design firing capacity of 98 million British thermal units (MMBtu) per hour (hr) (HHV basis) will be used to produce steam for the proposed project (EPNs: RUPK31 and RUPK32).
2.2.4 Equipment Fugitive Components
The project proposes to install equipment fugitive components such as valves, flanges, pump seals, agitators, compressor seals, relief valves, open-ended lines, sampling connections, etc.

Sage Environmental Consulting, L.P. 2-8 ExxonMobil Mont Belvieu Plastics Plant Revised March 2013 New Polyethylene Plant Permit Application
2.2.5 Analyzers
Emissions from the analyzer vents (EPN: PEXANALZ) are based on the estimated gas flow through each analyzer, vapor density, and vapor speciation. The proposed project design currently contains 35 analyzers distributed throughout the process equipment. Where applicable, analyzer vent streams are either returned to process or vented to the Vent Collection System. Other analyzer streams with very low hydrocarbon content will be vented directly to atmosphere. Remaining analyzers that cannot be returned to process or vented to the Vent Collection System or atmosphere will contain TRACErase™ technology or similar technology to destroy the VOC emissions prior to release to the atmosphere. The focus of TRACErase™ technology is the use of a catalytic combustion process to oxidize vented samples while maintaining an atmospheric pressure reference.
2.2.6 Hexene Storage Tank
One new floating roof tank will be constructed for storage of hexene. No increase in GHG emissions are being requested from the normal operation of the proposed tank.
2.2.7 Cooling Tower
A new cooling tower (EPN: RUCT01) will be constructed to provide process heat removal and supply cooling water to the proposed project. This cooling tower will be a multi-cell, induced draft, counter-flow type cooling tower. No increase in GHG emissions are being requested from the proposed cooling tower.
2.2.8 Wastewater A new wastewater stream was evaluated for GHG emissions. The oily water separator is an existing unit at the polyethylene base plant. A new waste water stream will be generated from the proposed project and will be routed to the existing waste water treatment system via the oily water separator. This new stream will not contain GHG constituents and will not be a source of GHG emissions for the project.
2.2.9 Miscellaneous Vents The types of vent sources included in the proposed project are discussed below. No increase in GHG emissions are being requested from the proposed miscellaneous vents.
2.2.9.1 Additive System
To improve stability and weathering resistance of the polymer, a variety of bins, vessels and other equipment are used to store and mix additives into the material between the purgers and the extruders.
Sage Environmental Consulting, L.P. 2-9 ExxonMobil Mont Belvieu Plastics Plant Revised March 2013 New Polyethylene Plant Permit Application
2.2.9.2 Catalyst Manufacturing Proprietary catalyst material is conveyed from the existing polyethylene plant’s manufacturing system to the reactors with a system of bins/vessels and filters.
2.2.9.3 Pellet Sources Granular product polyethylene is extruded and pelletized. A variety of bins, vessels, and other equipment are used to convey, store, package, and load product for shipment off-site.


Revised: March 2013 Drawn: BC
Vent Collection System Flare Headers Simplified Schematic
ExxonMobil Mont Belvieu Plastics Plant
Multi-Point Ground Flare
ATM
ATM
ATM
ATM
Flameless Thermal Oxidizers
High Pressure to Low Pressure Spill-Over
ATM
Elevated Flare
Low Pressure Vent Header
Assist
FTO1
FTO3
NC
FTO2
High Pressure Vent Header
Blower
Val
ve M
anifo
ldD
Supplemental NG
Water Seal
Drum
Heat content online analyzer or gas chromatograph(to be determined)
A
A1 PI FI
PI A2
WaterInlet
A3
FI
FIRatio
Contro-ller
AIR
EPN:3UFLARE63
EPN:3UF61A
EPN:3UF61B
EPN:3UF61C
EPN:3UFLARE62
Sage Environmental Consulting, L.P. 3-1 ExxonMobil Mont Belvieu Plastics Plant Revised March 2013 New Polyethylene Plant Permit Application
SECTION 3 GHG EMISSION CALCULATION METHODOLOGY
This section describes the emission calculation methodologies used to calculate annual GHG emission rates for the emission sources associated with the proposed project. Detailed emission calculations are provided in Appendix A of this application. The calculation tables in this appendix are intended to be self-explanatory; therefore, the following discussion is limited to a general description of calculation methodologies and a summary of key assumptions and calculation basis data.
The pollutants associated with the project include CO2, CH4, and N2O. The proposed project emission sources that contribute to these emissions include:
Regenerative Thermal Oxidizer
Vent Collection System
Boilers
Equipment Fugitive Components
Analyzers
Storage Tank
Cooling Tower
Wastewater
Miscellaneous Vents
The specific calculation methodology for each emission source type is described in detail below. Note that all heating values used in each equation for the following sections are the higher heating values (HHV). Table 3-2 at the end of this section contains an emission point summary for these sources.
3.1 CO2e Emissions
CO2e emissions are defined as the sum of the mass emissions of each individual GHG adjusted for its global warming potential (GWP). The GWP values in Table A-1 of the Green House Gas Mandatory Reporting Rule (GHG MRR) (40 CFR Part 98, Subpart A, Table A-1) were used to calculate CO2e emissions from estimated emissions of CO2, CH4, and N2O by multiplying the individual GHG pollutant rates by their applicable GWP provided in Table 3-1 below.

Sage Environmental Consulting, L.P. 3-2 ExxonMobil Mont Belvieu Plastics Plant Revised March 2013 New Polyethylene Plant Permit Application
Table 3-1 GWP Table
GHG POLLUTANT
GWP (ton pollutant / ton CO2e)
CO2 1
CH4 21
N2O 310
3.2 Regenerative Thermal Oxidizer
Supplemental fuel is added to the stream during start-up to ensure sufficient heating value. Annual emissions are based on 97% on-line reliability. When the RTO is off-line, the vents will emit to atmosphere without GHG emissions. The RTO as a VOC control device achieves better than federal BACT emission reductions for VOC and is utilized due to the dilute nature of the vent stream. The emissions for the RTO are based on the anticipated gas flow, higher heating value, and carbon content of the fuel streams to the unit according to 40 CFR 98 Subchapter C using Tier 3 calculation methodology. CH4 and N2O emissions from the RTO were calculated based on the emission factor of 1 x 10⁻³ kg-CH4 / MMBtu and 1 x 10⁻⁴ kg-N2O / MMBtu (40 CFR 98 Subpart C Table C-2), respectively. The CO2e emissions are calculated as described in Section 3.1.
Detailed calculations for this determination are provided in Appendix A to this application. The proposed allowable emissions of CO2, CH4, and N2O expressed as CO2e for the RTO associated with the proposed project are presented in Table 3-2 at the end of this section.
3.3 Vent Collection System
The emissions for the Vent Collection System are based on the anticipated gas flow, higher heating value, and carbon content of the vent streams. FTO CO2 emissions were calculated with Equation C-5 from 40 CFR 98 Subchapter C using Tier 3 calculation methodology. CH4 and N2O emissions from the FTOs were calculated based on the emission factor of 1 x 10⁻³ kg-CH4 / MMBtu and 1 x 10⁻⁴ kg-N2O / MMBtu (40 CFR 98 Subpart C Table C-2), respectively. Note that it is not feasible to adhere to a numerical emission limit for burner firing during FTO startup, because it is an intermittent emission source. GHG emissions generated during this intermittent operation are accounted for in the total FTO emissions.
Elevated flare CO2 emissions were estimated according to Equation Y-1a from the Federal GHG MRR 40 CFR 98 Subpart Y. Elevated flare CH4 and N2O were calculated according to Equations Y-4 and Y-5, respectively, from the Federal GHG MRR 40 CFR 98 Subpart Y.

Sage Environmental Consulting, L.P. 3-3 ExxonMobil Mont Belvieu Plastics Plant Revised March 2013 New Polyethylene Plant Permit Application
The emissions for the multi-point ground flare are estimated from representative off gas mass flow, stream speciation, and higher heating value of the vent streams to the HP Vent Header. CO2 emissions from the multi-point ground flare were estimated according to Equation Y-1a from the Federal GHG MRR 40 CFR 98 Subpart Y. CH4 and N2O emissions from the multi-point ground flare were calculated according to Equations Y-4 and Y-5, respectively, from the Federal GHG MRR 40 CFR 98 Subpart Y.
The representative case for annual emissions was derived using engineering analysis based on the annual vent gas composition. The flows expected to be routed to the multi-point ground flare are considered high volume, high pressure (HVHP) flows. Although the HVHP flows differ for the typical operating scenarios anticipated for the multi-point ground flare, the flows during each scenario do not vary excessively. HVHP vent streams anticipated to be controlled by the multi-point ground flare can be categorized as ‘start-ups’ (after shutdown, cleaning, and/or maintenance) and ‘shutdowns’ (operational transitions, catalyst change outs, grade changes, process safety releases, etc.).
The GWP values in Table A-1 of the GHG MRR (40 CFR Part 98, Subpart A) were used to calculate CO2e emissions from estimated emissions of CO2, CH4, and N2O by multiplying the individual GHG pollutant rates by their applicable GWP.
Detailed calculations for this determination are provided in Appendix A. The proposed allowable emissions of CO2, CH4, and N2O expressed as CO2e for the Vent Collection System associated with the proposed project are presented in Table 3-2 at the end of this section.
3.4 Boilers
The CO2 emissions for the boilers are based on the anticipated gas flow, higher heating value, and carbon content of the fuel streams to the unit according to 40 CFR 98 Subchapter C using Tier 3 calculation methodology. CH4 and N2O emissions from the boilers were calculated based on the emission factor of 1 x 10⁻³ kg-CH4 / MMBtu and 1 x 10⁻⁴ kg-N2O / MMBtu (40 CFR 98 Subpart C Table C-2), respectively. The CO2e emissions are calculated as described in Section 3.1.
Detailed calculations for this determination are provided in Appendix A to this application. The proposed allowable emissions of CO2, CH4, and N2O expressed as CO2e for the boilers associated with the proposed project are presented in Table 3-2 at the end of this section.
3.5 Equipment Fugitive Emissions
Fugitive emission rates of VOC from the piping components and ancillary equipment may be estimated using the methods outlined in the TCEQ’s Air Permit Technical Guidance for Chemical Sources: Equipment Leak Fugitives, October 2000. However, the fugitive emissions are estimates only, since they are based on factors derived for a statistical sample, and are not specific to any single piping component or specifically for natural gas service.

Sage Environmental Consulting, L.P. 3-4 ExxonMobil Mont Belvieu Plastics Plant Revised March 2013 New Polyethylene Plant Permit Application
To estimate fugitive emissions, each fugitive component was classified first by equipment type (valve, pump, relief valve, etc.) and then by material type (gas/vapor, light liquid, heavy liquid). An estimated, uncontrolled emission rate was obtained by multiplying the number of estimated fugitive components of a particular equipment/material type by the appropriate emission factor per the TCEQ guidance document. To obtain estimated, controlled fugitive emission rates, the estimated, uncontrolled emission rates were multiplied by a control factor, which was determined by the LDAR program employed for that source type. For the estimated CH4 emissions from added fugitive components, emissions were calculated using the appropriate SOCMI emissions factors and based on the representative stream speciation.
The estimated CH4 emissions, which are also expressed as CO2e according to the methodology described in Section 3.1, for the new fugitive components from the proposed project are summarized in Appendix A of this application. However, the fugitive emission limits are not included Table 3-2 Emission Point Summary since fugitive emissions are estimates only as discussed above.
3.6 Analyzers
CO2 emissions from the analyzer vents are based on the estimated gas flow through each analyzer, vapor density, vapor speciation, and a 98% destruction efficiency. The CO2e emissions are calculated as described in Section 3.1. The destruction efficiency applies to the destruction efficiency of the analyzer devices equipped with TRACErase™ technology, as previously described in Section 2.2.5. Detailed calculations for this determination are provided in Appendix A to this application. The proposed allowable emissions of CO2, CH4, and N2O expressed as CO2e for the analyzers associated with the proposed project are presented in Table 3-2 at the end of this section, and assume that all 35 analyzers contain TRACErase™ technology.
3.7 Hexene Storage Tank
The proposed new Hexene storage tank is not a source of GHG emissions. Detailed calculations for this determination are provided in Appendix A to this application.
3.8 Cooling Tower
The proposed new cooling tower is not a source of GHG emissions. Detailed calculations for this determination are provided in Appendix A to this application.
3.9 Wastewater
The proposed new wastewater stream is not a source of GHG emissions. Detailed calculations for this determination are provided in Appendix A to this application.

Sage Environmental Consulting, L.P. 3-5 ExxonMobil Mont Belvieu Plastics Plant Revised March 2013 New Polyethylene Plant Permit Application
3.10 Miscellaneous Vents
The proposed new miscellaneous vents are not a source of GHG emissions. Detailed calculations for this determination are provided in Appendix A to this application.

Table 3-2Emission Point Summary
Permit No.: TBD Site Name: Mont Belvieu Plastics PlantProject: Polyethylene Unit
EPN FIN
CO2 2,221 2,221
N2O 1 310
CH4 1 21
CO2 97,582 97,582
N2O 5 1,550
CH4 11 231
CO2 30,512 30,512
N2O 1 310
CH4 2 42
CO2 (B) (B)
CH4 (B) (B)
PEXANALZ PEXANALZ CO2 28 28
CO2 130,343 130,343
N2O 7 2,170CH4 14 294
Total 130,364 132,807
A Air contaminant emission rates are contributions to the project CO2e compliance total.
Emission Point Component or Air Contaminant Name GHG Emission Rate (tons/yr) CO2e Emission Rate (ton/yr) AName
Date: Revised March 2013Company Name: ExxonMobil Chemical Company
Air Contaminant Data
Vent Collection System
RUPK71 RUPK71 Regenerative Thermal Oxidizer
PEXVCS3UF61A/B/C3UFLARE623UFLARE63
3UF61A/B/C3UFLARE623UFLARE63
RUPK31RUPK32
RUPK31RUPK32
Boiler 31Boiler 32
PEXFUGEM PEXFUGEM Fugitives
Proposed Project Compliance Total
B Air contaminant emission rates are estimates only for fugitive sources.
Analyzers
EPN = Emission Point NumberFIN = Facility Identification Number 3-6 Revised March 2013

Sage Environmental Consulting, L.P. 4-1 ExxonMobil Mont Belvieu Plastics Plant Revised March 2013 New Polyethylene Plant Permit Application
SECTION 4 GHG BEST AVAILABLE CONTROL TECHNOLOGY
ANALYSIS
The increase in GHG emissions associated with the proposed project is above the PSD threshold for GHG. As such, any new or modified emissions unit with a net increase in CO2, CH4, and N2O emissions is subject to BACT review. The sources subject to BACT review in the proposed project are the, new RTO, new Vent Collection System, new boilers, new fugitive components, and analyzers.
CO2 emissions account for approximately 99 percent of the total CO2e emissions for the proposed project. As a result, the GHG BACT analyses are focused on CO2.
4.1 BACT Analysis Methodology
BACT is defined in 40 CFR §52.21(b) (12) as “...an emission limitation based on the maximum degree of reduction for each pollutant subject to regulation under the Act which would be emitted from a source which on a case-by-case basis is determined to be achievable taking into account energy, environmental and economic impacts and other costs”. In the USEPA guidance documents titled the 1990 Draft New Source Review Workshop Manual and the PSD and Title V Permitting Guidance for Greenhouse Gases, USEPA recommends the use of the Agency's five-step "top-down" BACT process to determine BACT for PSD permit applications in general, and GHG permit applications specifically. In brief, the top-down process calls for all available control technologies for a given pollutant to be identified and ranked in descending order of control effectiveness. The permit applicant should first examine the highest-ranked ("top") option. The top-ranked options should be established as BACT unless the permit applicant demonstrates to the satisfaction of the permitting authority that technical considerations, or energy, environmental, or economic impacts justify a conclusion that the top ranked technology is not "achievable" in that case. If the most effective control strategy is eliminated in this fashion, then the next most effective alternative should be evaluated, and so on, until an option is selected as BACT. The five basic steps of a top-down BACT analysis are listed below:
Step 1: Identify potential control technologies.
Step 2: Eliminate technically infeasible options.
Step 3: Rank remaining control technologies.
Step 4: Evaluate the most effective controls and document results.
Step 5: Select the BACT.
The first step is to identify potentially “available” control options for each emission unit subject to BACT review, for each pollutant under review. Available options should consist of a comprehensive list of those technologies with a potentially practical application to the

Sage Environmental Consulting, L.P. 4-2 ExxonMobil Mont Belvieu Plastics Plant Revised March 2013 New Polyethylene Plant Permit Application
emission unit in question. For this analysis, the following sources are typically consulted when identifying potential technologies:
• USEPA’s New Source Review Website,
• USEPA’s RACT/BACT/LAER Clearinghouse (RBLC) Database,
• Engineering experience with similar control applications,
• Various state air quality regulations and websites, and
• Guidance Documents and Reports including: o “Available And Emerging Technologies For Reducing Greenhouse Gas
Emissions From The Petroleum Refining Industry” published by USEPA Office of Air and Radiation; and
o “Report of the Interagency Task Force on Carbon Capture and Storage” obtained from http://www.epa.gov/climatechange/policy/ccs_task_force.html.
The results of a RBLC Database search are included in Appendix B to this application. Applicable technologies are included in this BACT analysis.
After identifying potential technologies, the second step is to eliminate technically infeasible options from further consideration. To be considered feasible, a technology must be both available and applicable. A control technology or process is only considered available if it has reached the licensing and commercial sales phase of development and is "commercially available".
The third step is to rank the technologies not eliminated in Step 2 in order of descending control effectiveness for each pollutant of concern.
The fourth step entails an evaluation of energy, environmental, and economic impacts for determining a final level of control. The evaluation begins with the most stringent control option and continues until a technology under consideration cannot be eliminated based on adverse energy, environmental, or economic impacts.
The fifth and final step is to select as BACT the most effective of the remaining technologies under consideration for each pollutant of concern.
4.2 Regenerative Thermal Oxidizer
The RTO is a control device that will be installed to meet BACT for another PSD pollutant - residual VOC emissions from the powder hopper bag filter, conveying air vents and extruder feed vents. Control devices installed to meet BACT for an emission source are typically not subject to an additional BACT evaluation for the control device itself. Rather the ancillary emissions generated by the control device are addressed in the environmental impacts evaluation for the source being controlled (in this case the powder hopper bag filter). Even though it is not appropriate to conduct a BACT evaluation on equipment installed to meet BACT, a redundant evaluation is included in the interest of expediting GHG permit issuance.

Sage Environmental Consulting, L.P. 4-3 ExxonMobil Mont Belvieu Plastics Plant Revised March 2013 New Polyethylene Plant Permit Application
The RTO will emit three GHG: CH4, CO2, and N2O. CO2 will be emitted from the RTO because it is a combustion product of any carbon-containing gas. CH4 will be emitted as a result of any incomplete combustion. N2O will be emitted from in trace quantities due to partial oxidation of nitrogen in the air which is used as the oxygen source for the combustion process. CO2 emissions account for approximately 99% of the total CO2e emissions. As a result, the GHG BACT analysis is focused on CO2.
4.2.1 Step 1 – Identification of Potential Control Technologies
The following technologies were identified as potential control options for the RTO based on available information and data sources:
• Use of low carbon assist gas;
• Use of good operating and maintenance practices;
• Energy efficient design; and
• Carbon Capture and Sequestration (CCS)
4.2.1.1 Low Carbon Assist Gas
Fuels containing lower concentrations of carbon generate less CO2 emissions than higher carbon fuels. Natural gas is among the lowest-carbon fuels commercially available. As contained in 40 CFR 98, Subpart C, Table C-1, there are 56 other fuels with larger CO2 emission factors than the factors for natural gas.
4.2.1.2 Good Operating and Maintenance Practices
Good operating and maintenance practices for the RTO are common techniques and are similar to those outlined for the boiler in Section 4.4.1.2. The burners installed for the RTO operate to provide supplemental heat necessary for the RTO to maintain operating temperature. Although the RTO efficiently recovers heat required for oxidation, the heat content of the incoming feed is not sufficient to provide the heat required to maintain required temperature. The manufacturer uses a burner design that provides complete combustion of the natural gas fuel, in order to minimize assist gas consumption. This is standard industry practice and the highest efficiency level that can be achieved for a burner.
The burners will be visually inspected prior to startup (and during planned boiler maintenance shutdowns) to ensure proper performance per current practices at MBPP. On-site personnel will be alerted to problems through a low temperature alarm if the RTO reaches minimum operating temperature that was demonstrated during the performance test to establish DRE. Upon notification of an alarm, Operations will employ troubleshooting practices to identify and resolve the issue with appropriate support as needed.

Sage Environmental Consulting, L.P. 4-4 ExxonMobil Mont Belvieu Plastics Plant Revised March 2013 New Polyethylene Plant Permit Application
The RTO will ensure operation at adequately elevated temperature so that the DRE demonstrated through performance testing is achieved. As previously discussed, the RTO is utilized for vents containing residual levels of hydrocarbons from the powder hopper bag filter, conveying air vents and extruder feed vents due to the dilute VOC content, i.e. extremely low heat content, therefore supplemental fuel is utilized to achieve proper temperature. It is temperature and not excess oxygen that indicates proper operation, therefore temperature is the operating parameter that is monitored and integrated into the control application for the RTO since the largest cost of operating a RTO is the supplemental fuel.
The fuel burned in the RTO burner for oxidation of vent gas is pipeline natural gas, and the flow rate is monitored. The feed stream to RTO is a very low concentration stream and is monitored for flow rate.
Temperature is the key operating parameter that is monitored to indicate the performance of the RTO. A minimum operating temperature will be specified by vendor and/or by demonstration. The temperature will be measured within the reactor and recorded. A computer control application will manage the operation of the RTO to ensure it operates within its performance targets. The control application optimizes the amount of supplemental fuel per the reaction zone temperature. It is not economical or environmentally beneficial to operate the RTO at a higher temperature than required; therefore the control application optimizes the amount of supplemental fuel per the reaction zone temperature and maintains the temperature at the lowest temperature possible that ensures proper operation. In other words, the lower the temperature, the lower the supplemental fuel requirement and this is principle is that makes the RTO GHG efficient.
Refer to Appendix C for a summary of the proposed work practice standards, operating limits, and/or monitoring to ensure good combustion efficiency for the RTO.
4.2.1.3 Energy Efficient Design
Energy efficiency is inherent in the operation of a RTO. Specific technologies include the following:
• Feed Preheat – Hot purified air releases thermal energy as it passes through a media bed (typically ceramic) in the outlet flow direction. The media bed is then used to preheat inlet gases. Altering airflow direction into the media beds maximizes energy recovery.
• Insulation of the RTO to retain heat within the unit, thereby reducing firing demand.
• Improved Process Control – installation of oxygen monitors and intake air flow monitors to optimize the fuel/air mixture and limit excess air.

Sage Environmental Consulting, L.P. 4-5 ExxonMobil Mont Belvieu Plastics Plant Revised March 2013 New Polyethylene Plant Permit Application
RTO is employed to ensure an absolute reduction in VOC released is achieved even in a low hydrocarbon content polyethylene unit product stream (~ 130 ppmv in residual hydrocarbon) as the resin is conveyed to the silos, after completing hydrocarbon purging in the process. The RTO was chosen to control this very lean hydrocarbon stream efficiently (achieve ~ 2 ppmv total hydrocarbon level in the exhaust from RTO). A regenerative thermal process is utilized whereby a cyclic heat recovery step is integrated into heating incoming feed gas with excess air to ensure complete and high efficiency combustion of the low hydrocarbon stream. This stream, in a typical Polymers plant would be vented to atmosphere without treatment. Thus, deploying an RTO exceeds federal-level BACT for control of VOC.
The thermodynamic principle driving operation of the RTO is efficient heat transfer. As described in EPA’s Air Pollution Control Technology Fact Sheet1:
RTOs use a high-density media such as a ceramic-packed bed still hot from a previous cycle to preheat an incoming VOC-laden waste gas stream. The preheated, partially oxidized gases then enter a combustion chamber where they are heated by auxiliary fuel (natural gas) combustion to a final oxidation temperature typically between 1,400 and 1,500 °F, and maintained at this temperature to achieve maximum destruction efficiency. The purified, hot gases exit this chamber and are directed to one or more different ceramic-packed beds cooled by an earlier cycle. Heat from the purified gases is absorbed by these beds before the gases are exhausted to the atmosphere. The reheated packed bed then begins a new cycle by heating a new incoming waste gas stream.
The RTO designed for the proposed project includes the technologies described above by EPA:
The heat exchanger bed is comprised of separate sections, where alternately one part functions as cooling stage and the other as heating stage. The exhaust air passes vertically upward through the heat exchanger mass taking on the heat and raising the air temperature close to the oxidation of the pollutants at approximately 800 °C (1,472 °F). The hot purified gases pass downward through the other part of the heat exchanger mass transferring its energy back to the exchanger. This cools down the purified gases.
1 EPA website: http://www.epa.gov/ttn/catc/dir1/fregen.pdf accessed on October 24, 2012.

Sage Environmental Consulting, L.P. 4-6 ExxonMobil Mont Belvieu Plastics Plant Revised March 2013 New Polyethylene Plant Permit Application
Furthermore, the proposed RTO will be designed with a sophisticated air distribution system that will control the alternating airflow through the individual heat exchanger sections. This replaces complicated damper mechanisms and eliminates difficulties with conventional design duct dampers. The benefits of the proposed RTO over other conventional RTOs include constant air distribution instead of damper mechanisms, eliminates the need for compressed air, low wear and tear, and no pressure variations caused by switching operations. Although it cannot be quantified, a less complicated design with less moving parts and improved automation provides for a higher reliability and consistent operation of the RTO which results in improved energy efficiency. Also of note is that the alternative to this technology is incineration in order to achieve the high destruction efficiency for the low hydrocarbon content stream. Incineration is far more energy intensive than RTO, thereby generating more GHG emissions.
As described above, the proposed RTO will be designed with a sophisticated air distribution system that uses a rotating distributor to control the alternating airflow through the individual heat exchanger sections. A computer control application manages the rotating distributor to ensure consistent operation. The operating parameter that will be monitored to ensure optimal heat transfer is temperature at the stack. Since supplemental fuel is required to maintain temperature at the reaction zone, the RTO will be managed such that temperature is maintained near its minimum during operation in order to minimize the amount of supplemental fuel required. In addition, exit temperature at stack shall be monitored that shows the extent of heat recovery from exhaust gas. This optimization strategy will be integrated into the control application since supplemental fuel has an economic penalty associated with it.
Refer to Appendix C for a summary of the proposed work practice standards, operating limits, and/or monitoring to ensure high energy efficiency for the RTO.
4.2.1.4 Carbon Capture and Sequestration (CCS)
Refer to Section 4.3.2.5 for a detailed description of these practices.
4.2.2 Step 2 - Eliminate Technically Infeasible Options
This step of the top-down BACT analysis eliminates any control technology that is not considered technically feasible unless it is both available and applicable.
4.2.2.1 Low Carbon Assist Gas
Use of natural gas as a low carbon assist gas is technically feasible.
Sage Environmental Consulting, L.P. 4-7 ExxonMobil Mont Belvieu Plastics Plant Revised March 2013 New Polyethylene Plant Permit Application
4.2.2.2 Good Operating and Maintenance Practice
Use of good operating and maintenance practice is considered technically feasible.
4.2.2.3 Energy Efficiency
Use of the energy efficiency measures described in Section 4.3.1.4 is considered technically feasible.
4.2.2.4 Carbon Capture and Storage
CCS is considered technically, environmentally, and economically infeasible for sources with much larger emissions (two orders of magnitude) than the RTO; refer to section 4.3.2.5 for detailed discussion.
4.2.3 Step 3 - Rank Remaining Control Technologies
The following technologies and control efficiencies were identified as technically feasible for CO2 control options for the RTO based on available information and data sources:
Use of low carbon assist gas;
Use of good operating and maintenance practices; and
Energy efficient design.
4.2.4 Step 4 - Evaluate the Most Effective Controls and Document Results
Although all fossil fuels contain carbon, the natural gas fired in the proposed RTO is a low carbon assist gas. In the combustion of a fossil fuel, the fuel carbon is oxidized into CO and CO2. Full oxidation of fuel carbon to CO2 is desirable because CO has long been a regulated pollutant with established adverse environmental impacts and because full combustion releases more useful energy within the process. In addition, emitted CO gradually oxidizes to CO2 in the atmosphere.
The use of low carbon assist gas and good operating and maintenance practices are inherent in the design and operation of the RTO at MBPP. Energy efficient designs will be incorporated, specifically, feed preheat, insulation, and improved process control.
4.2.5 Step 5 - Selection of BACT
As a result of this analysis, the use of low carbon assist gas, good operating and maintenance practices, and energy efficient design is selected as BACT for the proposed RTO. This finding is consistent with the proposed rule Standards of Performance for Greenhouse Gas Emissions for New Stationary Sources: Electric

Sage Environmental Consulting, L.P. 4-8 ExxonMobil Mont Belvieu Plastics Plant Revised March 2013 New Polyethylene Plant Permit Application
Generating Units, which states2:
Second, all newly constructed sources have options in selecting their design (although it is true that natural gas-fired plants are inherently lower emitting with regard to CO2 than coal-fired plants). As a result, prospective owners and operators of new sources could readily comply with the proposed emission standards by choosing to construct a NGCC3 unit.
The proposed emission standard referenced above is:
The proposed requirements, which are strictly limited to new sources, would require new fossil fuel-fired EGU’s greater than 25 megawatt electric (MWe) to meet an output-based standard of 1,000 lb of CO2 per megawatt-hour (MWh), based on the performance of widely used natural gas combined cycle (NGCC) technology4.
This proposed rule is currently the only NSPS for GHG, and although it is applicable to electric generating units rather than RTOs, it based the emission limitation on sources firing natural gas, without further controls for GHG. Therefore, the controls selected in the top-down BACT analysis for the proposed RTO, specifically firing of natural gas as assist gas, meet or exceed the controls required in the proposed NSPS for Greenhouse Gases.
Appendix C of this application contains a summary of work practice standards, operational requirements, and/or monitoring for the proposed RTO.
4.3 Vent Collection System
The purpose of the Vent Collection System is to segregate and control VOC-containing vent streams from the process to the appropriate control device to maximize VOC destruction achieving better than BACT-levels (voluntarily achieving LAER-levels) of control in an ozone non-attainment area. Due to the integration of the computer control applications that manage the three control devices and operation of the Vent Collection System, this BACT analysis focuses on the combined Vent Collection System as a collective emission source resulting from the control of another PSD pollutant (VOC). Control devices installed to meet BACT for an emission source are typically not subject to an additional BACT evaluation for the control device itself. Rather the ancillary emissions generated by the control device are addressed in the environmental impacts evaluation for the source being controlled (in this case the Reactors, Purger, etc.). Even though it is not appropriate to conduct a BACT evaluation on equipment installed to meet BACT, a redundant evaluation is included in the interest of expediting GHG permit issuance.
2 77 FedReg 22410, April 13, 2012. 3 Natural Gas Combined Cycle 4 77 FedReg 22392, April 13, 2012.
Sage Environmental Consulting, L.P. 4-9 ExxonMobil Mont Belvieu Plastics Plant Revised March 2013 New Polyethylene Plant Permit Application
Additionally, since CO2 accounts for over 99% of the total CO2e emissions from these emission sources, this GHG BACT analysis is focused on controlling CO2 emissions.
4.3.1 Step 1 – Identification of Potential Control Technologies
The following technologies were identified as potential control options for the Vent Collection System based on review of available information and data sources:
• Use of low carbon assist gas;
• Use of good operating and maintenance practices;
• Staged operation;
• Energy efficient design;
• Vent gas recovery (VGR); and
• Carbon Capture and Sequestration (CCS).
4.3.1.1 Low Carbon Assist Gas
A discussed in section 4.2.1.1, the use of natural gas as assist gas is the lowest-carbon fuel available for the proposed project.
4.3.1.2 Good Operating and Maintenance Practices
o Appropriate maintenance of equipment (analyzers, flow measurement systems),
o Operation at the designed temperature and oxygen concentration in the FTOs,
o Operation based on recommended design velocity and heating value for the elevated flare, and
o Operation based on recommended design pressure and heating value for the multi-point ground flare.
4.3.1.3 Staged Operation
The proposed project will install a Vent Collection System with staged operation. By segregating these low and high pressure streams into different control device dispositions, the proposed project will optimize the amount of assist gas and air to hydrocarbon ratio required for good combustion. This will minimize the amount of CO2 generated by destruction of vent streams.

Sage Environmental Consulting, L.P. 4-10 ExxonMobil Mont Belvieu Plastics Plant Revised March 2013 New Polyethylene Plant Permit Application
4.3.1.4 Energy Efficient Design
The FTOs do not require supplemental fuel or heat to maintain optimum operation, unless the FTOs are operated at high turndown, i.e., essentially no flow is routed to the LP Vent Header, or the incoming feed stream does not have adequate heat content. The FTOs are designed to maintain operating temperature through control applications that balance the excess oxygen levels based on feed forward control of the incoming feed stream. This feed stream, consisting of low volume, low pressure vents routed to the LP vent header, contains sufficient heat value such that supplemental fuel is not expected to be required during normal operation. FTOs are able to “burn” waste gasses at lower heating values than would be required with direct fire burners. The device uses a thermal ceramic bed to allow oxidation to occur at much lower heat contents reducing supplemental fuel requirements. The vent stream therefore ensures the reactor is energy efficient by providing sufficient heat to maintain proper operating temperature. Additionally, the use of variable flow air blower with a computer control application to control the excess oxygen based on the incoming feed to the FTOs improves energy efficiency.
4.3.1.5 Vent Gas Recovery (VGR);
Recover routine continuous vent streams prior to combustion in a control device and utilize the heat content to reduce natural gas consumption at the boilers thereby avoiding GHG emissions.
4.3.1.6 Carbon Capture and Sequestration (CCS)
Refer to Section 4.3.2.5 for a detailed description of these practices
4.3.2 Step 2 - Eliminate Technically Infeasible Options
This step of the top-down BACT analysis eliminates any control technology that is not considered technically feasible unless it is both available and applicable.
4.3.2.1 Low Carbon Assist Gas
Use of a low carbon fuel is technically feasible. Pipeline quality natural gas is the lowest carbon fuel commercially available at MBPP. Natural gas will be selected by the proposed project since it is the only fuel commercially available at MBPP.
4.3.2.2 Good Operating and Maintenance Practices
Use of good operating and maintenance practices is considered technically feasible. The use of good operating and maintenance practices results in longer life of the equipment and more efficient operation. Therefore, such practices indirectly reduce GHG emissions by supporting operation as
Sage Environmental Consulting, L.P. 4-11 ExxonMobil Mont Belvieu Plastics Plant Revised March 2013 New Polyethylene Plant Permit Application
designed by the manufacturer. Use of good operating and maintenance practices as described in Section 4.3.1.2 is technically feasible and will be incorporated into the proposed project.
4.3.2.3 Staged Operation
The staged operation is integral to the design of the Vent Collection System, with three separate control devices for the various vent streams.
4.3.2.4 Energy Efficiency
Use of the energy efficiency design described in Section 4.3.1.4 is considered technically feasible and will be incorporated into the proposed project.
4.3.2.5 Vent Gas Recovery (VGR);
A compression system was specified with a total capacity to recover up to 1,800 pounds per hour of vent gas, which is equivalent to 1,000 pounds per hour of natural gas. This flow rate is based on the estimated amount of vent gas the boilers could reliably fire in place of natural gas. Since vent gas recovery is technically feasible, an economic analysis was performed to evaluate the economic feasibility of this control technology. Table 4-1 summarizes the economic analysis of vent gas recovery for the proposed project, which is estimated to avoid 11,541 tons of CO2e per year. As shown in the table, vent gas recovery is estimated at a cost of $123.2 per ton of CO2e avoided, which is an excessive cost to mitigate GHG emissions and renders flare gas recovery an economically infeasible control technology. Therefore, it is eliminated from consideration as a control technology for flare GHG emissions.

Sage Environmental Consulting, L.P. 4-12 ExxonMobil Mont Belvieu Plastics Plant Revised March 2013 New Polyethylene Plant Permit Application
Table 4-1 Economic Analysis for Vent Gas Recovery
Item Units Value5 Comments Vent Gas Recovery System Cost
Capital Cost of VGR $ (millions) 7.0 Site-specific design Amortized Capital Cost $ (millions) 1.46 See Footnote
Operating and Maintenance Expenses $ (millions) 0.05
Site-specific design incorporating natural gas consumption reduction
Total Annual VGR Cost $ (millions) / yr 1.4 Vent Gas Recovered
Total Vent Gas Recovered MMscf/yr 311.4 Based on estimate of 1,000 lb/hr of NG reduction
MMBtu/yr 196,812 Higher heating value of 639 Btu/scf
Economics of Avoided CO2e Annual Emissions from FTO
Control of Vent Gas tons CO2e / yr 14,607 Oxidation emissions from unrecovered vent gas
Annual Emissions from Recovered Vent Gas to
Boilers tons CO2e / yr 14,607 Firing recovered vent gas at the boilers
Annual Emissions from Natural Gas to Boilers tons CO2e / yr 11,541 Firing natural gas at the boilers
Tons of CO2e Avoided tpy 11,5417 Cost per ton of CO2e
Avoided $ / ton CO2e 123.2
4.3.2.6 Carbon Capture and Sequestration
ExxonMobil is a leader in the research, development and application of CCS and related technologies, with over 30 years of extensive experience in technology that could be transferable to CCS operations. ExxonMobil recognizes CCS is a promising technology for mitigating GHG emissions, but through our experience we also recognize that significant challenges must be overcome for wide-spread deployment across various industries. Challenges include high capture cost; first-of-a-kind (FOAK) technology deployments in new industrial sectors with unknown technology and process safety risks; and insufficient regulatory frameworks, including management of long-term responsibility, lack of transport infrastructure networks, long-term storage
5 All monetary estimations have been calculated in 2016 dollars. 6 A capital charge rate of 19% was assumed with an expected equipment life of 20 years. 7 Tons of CO2e avoided = Annual Emissions from FTO control of Vent Gas + Annual Emissions from Boiler
Firing Natural Gas - Annual Emissions from Boiler Firing Recovered Vent Gas = 14,607 tpy + 11,541 tpy – 14,607 tpy = 11,541 tpy

Sage Environmental Consulting, L.P. 4-13 ExxonMobil Mont Belvieu Plastics Plant Revised March 2013 New Polyethylene Plant Permit Application
integrity confidence, and uncertain public acceptance of CCS projects. A number of large scale integrated projects have been cancelled over the past several years, both in the US and other parts of the world, generally citing all or a combination of the aforementioned challenges as barriers to the CCS project.
CCS has been evaluated for the proposed project based on technological, environmental, and economic feasibility. In the guidance documents for GHG permitting, USEPA states8:
For the purpose of the BACT analysis for GHGs, EPA classifies CCS as an add-on pollution control technology that is “available” for facilities emitting CO2 in large amounts, including fossil fuel-fired power plants, and for industrial facilities with high-purity CO2 streams (e.g., hydrogen production, ammonia production, natural gas processing, ethanol production, ethylene oxide production, cement production, and iron and steel manufacturing). For these types of facilities, CCS should be listed in Step 1 of the top-down BACT Analysis for GHGs.
ExxonMobil does not consider CCS as “available” for any application other than processing produced natural gas. There are no global examples where capture of CO2 from a low pressure, low CO2 concentration flue gas has been demonstrated at a scale and level of reliability necessary for application in a compliance-based scenario. The proposed project, with its numerous emission points and low CO2 concentration, does not meet the criteria established in the above paragraph, nor does it meet any reasonable definition of BACT because CCS has not been demonstrated as an “available” and “applicable” technology for thermal oxidizers or a polyethylene unit or any similar applications. The proposed project is not analogous to a fossil fuel-fired power plant due to exhaust gas flow rate differences occurring from firing a power plant’s turbine compared to controlling VOC emissions in the proposed Vent Collection System. A fossil fuel-fired power plant stack volumetric flow rate is several orders of magnitude greater than the Vent Collection System represented in this permit application.
Nor does the proposed project compare to an industrial facility with high-purity CO2 streams since the proposed project will construct several separate sources that will emit very low-purity CO2 streams. The industrial facilities cited in the above USEPA example are similar to each other in that each has a limited number of stacks and the purity of the CO2 for most is in the range of 65% (versus ~ 8 % for a boiler). A polyethylene unit is not a comparable process to hydrogen production, ammonia production, natural gas processing, ethanol production, ethylene oxide production, cement production, and iron

Sage Environmental Consulting, L.P. 4-14 ExxonMobil Mont Belvieu Plastics Plant Revised March 2013 New Polyethylene Plant Permit Application
and steel manufacturing by any measure, especially regarding the purity of the CO2 in the stack, which is less than 8%. USEPA specifically cited CCS technology as “available” for the power plant and high-purity industrial facility streams simply because these are the applications that are either most impactful to reduce total US GHG emissions (in the case of fossil fuel-fired power plants) or may be best suited for CCS technology applications (in the case of hydrogen production, ammonia production, natural gas processing, ethanol production, ethylene oxide production, cement production, and iron and steel manufacturing) when only CO2 source gas characteristics are evaluated. CCS is not applicable to polyethylene units because of the low purity CO2-containing streams emitted from multiple stacks across the facility.
While specific component CCS technologies exist and have been in use for decades, integrated CCS facilities at the necessary scale for a polyethylene unit have not been demonstrated and do not currently exist at any scale. The following subsections describe the specific technologies comprising CCS and detail the specific barriers each pose to the proposed project and highlight why CCS is not an available or applicable technology for the proposed project.
Capture
While several technologies for the post-combustion capture of low-pressure, low-concentration CO2 may be in development, none have been demonstrated at the scale of the proposed project nor for sources at natural gas fired facilities. Carbon capture for the proposed project would require FOAK technology application that is further complicated by the numerous emission points within the polyethylene unit. Any CCS technology will result in additional equipment, operating complexity, and increased energy consumption to operate the add-on equipment. Additional equipment would increase the energy and fuel demand and significantly increase the size of the power generation system, which would lead to more air pollution and wastewater generation at the site.
Further, as stated in the August 2010 Report of the Interagency Task Force on Carbon Capture and Storage9:
Current technologies could be used to capture CO2 from new and existing fossil energy power plants; however, they are not ready for widespread implementation primarily because they have not been demonstrated at the scale necessary to establish confidence for power plant application. Since the CO2 capture capacities used in current industrial processes are generally much smaller than the capacity required for the purposes of GHG
9 President Obama’s Interagency Task Force on Carbon Capture and Storage, Report of the Interagency
Task Force on Carbon Capture and Storage, August 2010, p. 50.

Sage Environmental Consulting, L.P. 4-15 ExxonMobil Mont Belvieu Plastics Plant Revised March 2013 New Polyethylene Plant Permit Application
emissions mitigation at a typical power plant, there is considerable uncertainty associated with capacities at volumes necessary for commercial deployment.
Recovery and purification of CO2 from the FTOs’ and boilers’ flue gas would require significant additional processing to achieve the necessary CO2 concentration for effective storage. The proposed project’s exhaust streams are not high‐purity streams, as recommended in USEPA’s guidance. Instead, the exhausts contain less than eight (8) vol% CO2 in the stack gas on an average annual basis, and would have to be purified and dried to a purity of over 98%. The stream would also require complex cooling systems prior to separation, compression, and transport. Therefore, the recovery and purification of CO2 from the stack gases would necessitate significant additional processing, including energy and cooling water, and environmental/air quality penalties, to achieve the necessary CO2 concentration for effective storage.
Once separated, the CO2 must be compressed, requiring significant additional inputs of energy to accomplish compression of the low pressure CO2 gas to a supercritical fluid, which is equivalent to a pressure increase of approximately 2,200 psia. This is a complicated process that requires complex equipment with numerous stages of compression integrated with heat removal. Transport
Once the CO2 is supercritical, it must be transported to a suitable site for storage or sequestration. Transport via pipeline is the only feasible transportation method for CO2 recovered from MBPP due to the volumes involved. There is only one CO2 pipeline located within a reasonable proximity to MBPP and it is owned and operated by Denbury Resources. The Denbury Green Pipeline is located approximately 20 miles from MBPP; however, there is no existing or planned pipeline that would connect the Denbury Green Pipeline to MBPP.
It is unknown at this time whether Denbury could or would accept CO2 from the proposed project, if a pipeline were to be constructed, however, for the purposes of the economic analysis, it has been assumed that a contract would be secured from Denbury Resources and all recovered CO2 from the proposed project would be accepted into the Green Pipeline.
Storage
Once the CO2 is captured, it must be stored in a stable and secure reservoir or geologic formation that is not susceptible to acidic erosion. While a case specific evaluation has not been conducted, it is likely suitable storage reservoirs could be found within a reasonable proximity to MBPP. There are multiple mature oil and gas fields that could be suitable targets for enhanced oil recovery projects or that could have suitable brine formations either below

Sage Environmental Consulting, L.P. 4-16 ExxonMobil Mont Belvieu Plastics Plant Revised March 2013 New Polyethylene Plant Permit Application
or above know productions zones, that could serve as storage reservoirs. These sites however would require intensive evaluation and would very likely require substantial remedial work to provide the high degree of site and formation integrity necessary for secure storage. One of the biggest challenges that can be expected is the necessity of identifying old wells and ensuring they are securely plugged. Since a specific site has not been identified, estimating the technical feasibility and costs of this option is difficult and highly uncertain since a well that meets Class VI requirements under the UIC regulations would have to be identified and secured for the proposed project. Other potential storage sites that may be available are located in the Permian Basin, but are more than 470 miles from the proposed project site and there are no existing connecting CO2 pipelines to this location from MBPP.
Economic Analysis
Although CCS is not technically or environmentally feasible for the proposed project, a site-specific CCS economic analysis was completed at the request of USEPA. A carbon capture and compression plant was specified with cost estimates by an ExxonMobil Research and Engineering Team specializing in CCS technologies. The Team determined that an amine absorber system with regeneration facilities and CO2 compression would need to be located in a central location to the proposed project’s sources and to the required utility plan, which would be required to meet the steam and power requirements for the CO2 Capture Plant. This utility plant would generate its own GHG emissions. The CCS design therefore includes capture of CO2 from the FTOs and boilers exhaust stacks as well as the additional CO2 emissions generated by the utility plant. The system would be designed to achieve ~90% recovery of CO2 from the exhaust gas. The CO2 Capture Plant was specified to accept 226 tons of total FTO and boiler exhaust gas per hour to remove 20 total tons of CO2 per hour due to the proposed project and 16 tons of total exhaust gas per hour to remove 2 tons of CO2 per hour due to the dedicated utility plant. The additional power generated by this utility plant is exported as a credit to the operating cost of the utility plant.
The carbon capture and compression cost estimate represents the capital and operating expenses associated with the site-specific carbon capture plant. For purposes of the economic analysis below, it is assumed that a contract would be secured from Denbury Resources to accept CO2 from MBPP, therefore, the transport costs are based on construction and operation and maintenance of a 20-mile pipeline that is eight inches in diameter. This represents an oversimplification of the complexities of the process that would be necessary to secure a long-term disposition for the captured CO2. The cost estimates for transport and the liability estimate associated with storage were based on the Department of Energy’s National Energy Technology Laboratory study “Estimating Carbon Dioxide Transport and Storage Costs”, which was recently completed in 2010.

Sage Environmental Consulting, L.P. 4-17 ExxonMobil Mont Belvieu Plastics Plant Revised March 2013 New Polyethylene Plant Permit Application
Note that the basis for the cost estimate for storage reflects an oversimplification of since it is a simple transfer of the recovered CO2 to Denbury and does not estimate costs for items such as site screening and evaluation, injection well construction and equipment, pore space acquisition, and operating and maintenance costs, therefore this cost estimate is at the lowest possible level and may in fact be significantly underestimating the actual cost for storage if this technology were to be pursued. The cost represented for storage relates to liability, which was estimated at $5,000,000 per the DOE/NETL 2010 report.
As shown in Table 4-2, carbon capture for the proposed project is estimated to cost $366 per ton of CO2 avoided or $50,800,000 annually to avoid ~90% of the CO2 emissions from the sources and required utility plant. This cost includes operating and capital costs. The total cost for carbon capture is $208,300,000. This is an extraordinarily high cost and would render the proposed project economically unviable if selected.
Table 4-2 Economic Analysis for Carbon Capture and Compression
Cost Type Units10 Cost
(millions $) Carbon Capture Plants - Capital and Operating Expense Estimation
CO2 Compressor and Intercoolers $ (millions) 32.9
Amine Absorber System $ (millions) 61.3
CO2 Regeneration/Purification System $ (millions) 21.5
Blower, Piping, and Ducting $ (millions) 14.8
Utility Plant - Capital and Operating Expense Estimation
New Utility Plant – Boiler, Boiler Feed Water Treatment and Blower $ (millions) 27.7
Cooling Tower, Utilities Header and Piping $ (millions) 50.1
Fuel, Utilities, Amine $ (millions) / yr 11.2
Total Expense Estimation
Operating Expense $ / Ton CO2 Avoided 81
Capital Expense $ / Ton CO2 Avoided 285.1
Total $ / Ton CO2 Avoided 366.1
10 All monetary estimations have been calculated in 2016 dollars.
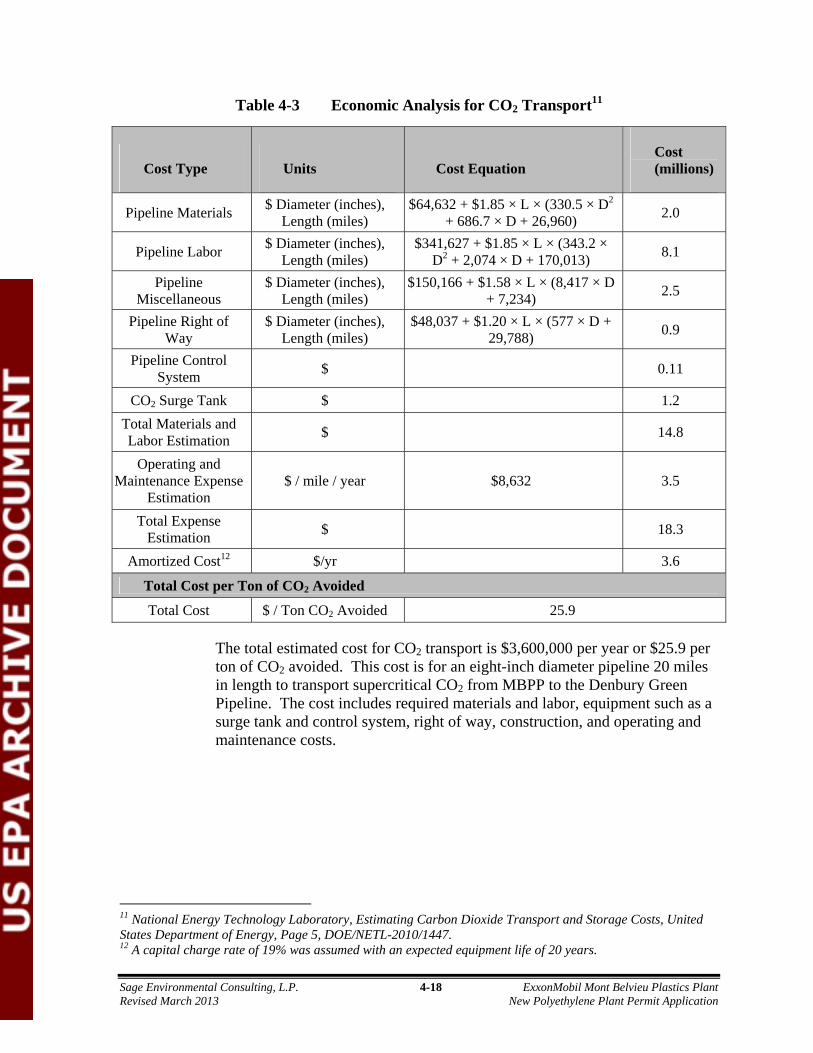
Sage Environmental Consulting, L.P. 4-18 ExxonMobil Mont Belvieu Plastics Plant Revised March 2013 New Polyethylene Plant Permit Application
Table 4-3 Economic Analysis for CO2 Transport11
Cost Type Units Cost Equation Cost (millions)
Pipeline Materials $ Diameter (inches), Length (miles)
$64,632 + $1.85 × L × (330.5 × D2 + 686.7 × D + 26,960) 2.0
Pipeline Labor $ Diameter (inches), Length (miles)
$341,627 + $1.85 × L × (343.2 × D2 + 2,074 × D + 170,013) 8.1
Pipeline Miscellaneous
$ Diameter (inches), Length (miles)
$150,166 + $1.58 × L × (8,417 × D + 7,234) 2.5
Pipeline Right of Way
$ Diameter (inches), Length (miles)
$48,037 + $1.20 × L × (577 × D + 29,788) 0.9
Pipeline Control System $ 0.11
CO2 Surge Tank $ 1.2 Total Materials and Labor Estimation $ 14.8
Operating and Maintenance Expense
Estimation $ / mile / year $8,632 3.5
Total Expense Estimation $ 18.3
Amortized Cost12 $/yr 3.6
Total Cost per Ton of CO2 Avoided
Total Cost $ / Ton CO2 Avoided 25.9
The total estimated cost for CO2 transport is $3,600,000 per year or $25.9 per ton of CO2 avoided. This cost is for an eight-inch diameter pipeline 20 miles in length to transport supercritical CO2 from MBPP to the Denbury Green Pipeline. The cost includes required materials and labor, equipment such as a surge tank and control system, right of way, construction, and operating and maintenance costs.
11 National Energy Technology Laboratory, Estimating Carbon Dioxide Transport and Storage Costs, United States Department of Energy, Page 5, DOE/NETL-2010/1447. 12 A capital charge rate of 19% was assumed with an expected equipment life of 20 years.

Sage Environmental Consulting, L.P. 4-19 ExxonMobil Mont Belvieu Plastics Plant Revised March 2013 New Polyethylene Plant Permit Application
Table 4-4 Economic Analysis for CCS
CCS Technology for CO2 Emissions
Cost ($ per ton of CO2
Avoided) Tons of CO2 Avoided
per Year13 Total Annualized Cost14
(Million $ per year)
Capture and Compression
$366.1 138,812 $50.8
Transport $25.9 138,812 $3.6
Storage $7.115 138,812 $1.0
Total CCS Cost $399.1 138,812 $55.4
The total cost for capturing and compressing CO2 generated by the proposed project, capturing and compressing CO2 generated by the CO2 capture equipment, transporting supercritical CO2 20 miles, and providing liability coverage for storage of the project’s CO2 is estimated at $399.1 per ton of CO2 avoided which equates to an annualized cost of $55,400,000 per year. An annualized CCS cost of $55.4 million dollars would render the proposed project unviable, even for this multi-million dollar investment proposed by ExxonMobil.
While CCS is a viable technology to mitigate CO2 emissions within applicable industries, it is not an available or applicable technology for polyethylene units due to the low pressure, low CO2 concentration streams that are distributed across multiple sources and the relatively small scale in comparison to a power plant. Based on the aforementioned technological and environmental challenges and the extraordinarily high annualized cost for capture, transport, and storage of CO2, CCS as a combined technology is not considered technically, environmentally, or economically feasible for reducing GHG emissions from the proposed project. CCS is eliminated as a potential control option in the BACT analysis for CO2 emissions from the proposed project.
13 This represents ~90% of the total CO2 emissions from the proposed sources and utility plant. 14 Total Annual Cost represents an amortized cost for the capital expenditure and operating and maintenance
costs. A capital charge rate of 19% was assumed with an expected equipment life of 20 years. 15 It is assumed that Denbury Resources will receive CO2 from the proposed project and will incorporate the
entire flow into its operations. Storage costs are therefore estimated to consist of liability, which is $5,000,000 per the DOE/NETL 2010 report.
Sage Environmental Consulting, L.P. 4-20 ExxonMobil Mont Belvieu Plastics Plant Revised March 2013 New Polyethylene Plant Permit Application
4.3.3 Step 3 - Rank Remaining Control Technologies
The remaining feasible control technologies, as listed below, will be selected for the proposed project, therefore ranking is not required.
• Use of low carbon assist gas;
• Use of good operating and maintenance practices;
• Staged operation; and
• Energy efficient design.
4.3.4 Step 4 - Evaluate the Most Effective Controls and Document Results
Step 4 is not applicable since all remaining control technologies will be selected.
4.3.5 Step 5 - Selection of BACT
As a result of these analyses, the use of a low carbon fuel, good operating and maintenance practices, staged operation, and energy efficient design are selected as BACT for the proposed Vent Collection System. The following work practice standards and operating limits are proposed to demonstrate BACT is met:
• Use a low carbon fuel
o Consume pipeline quality natural gas, or a fuel with a lower carbon content than pipeline quality natural gas, as supplemental fuel to the FTOs and Vent Headers.
• Use of good operating and maintenance practices;
o LP Vent Header
Monitor the composition of the vent gas contained in the LP Vent Header through an online analyzer and record the heating value.
o FTOs
Monitor and record the vent gas flow to FTO through a flow monitoring system.
Monitor the excess oxygen at the exhaust stack of the FTOs and maintain excess oxygen above the minimum demonstrated for the designated DRE during the performance test.
Monitor the temperature of the FTOs and maintain the temperature above the minimum demonstrated temperature or manufacturer recommended temperature.
Sage Environmental Consulting, L.P. 4-21 ExxonMobil Mont Belvieu Plastics Plant Revised March 2013 New Polyethylene Plant Permit Application
Visually inspect burners during routine preventative maintenance outages and prior to start-up to ensure proper
Refer to Appendix C for a summary of the proposed work practice standards, operating limits, and/or monitoring to ensure good combustion efficiency for the FTOs.
o Elevated Flare
Monitor and record the following parameters to demonstrate compliance with flare systems’ operating specifications required to achieve the stated DREs:
1. Monitor and record the vent gas flow to the elevated flare through a flow monitoring system;
2. Maintain a minimum heating value and maximum exit velocity that meets 40 CFR § 60.18 requirements for the routine streams routed to the elevated flare;
3. Monitor and record the composition and heating value of the vent gas within the LP Vent Header;
4. Monitor pilots for presence of flame.
Refer to Appendix C for a summary of the proposed work practice standards, operating limits, and/or monitoring to ensure good combustion efficiency for the elevated flare.
o Multi-point ground Flare
Monitor and record the following parameters to demonstrate compliance with flare systems’ operating specifications required to achieve the stated DREs:
1. Monitor and record the composition of the vent gas within the HP Vent Header;
2. Monitor and record the pressure of the HP Vent Header;
3. Monitor the pressure to the multi-point ground flare to demonstrate that flow routed to the multi-point ground flare system exceeds 4 psig; however, if a lower pressure can be demonstrated to achieve the same level of combustion efficiency, then this lower limit will be implemented;
4. Monitor and maintain a minimum heating value of 800 Btu/scf of the waste gas (adjusted for hydrogen) routed to the multi-

Sage Environmental Consulting, L.P. 4-22 ExxonMobil Mont Belvieu Plastics Plant Revised March 2013 New Polyethylene Plant Permit Application
point ground flare system to ensure the intermittent stream is combustible; however, if a lower heating value limit can be demonstrated to achieve the same level of combustion efficiency, then this lower limit will be implemented; and,
5. Monitor pilots for presence of flame.
Refer to Appendix C for a summary of the proposed work practice standards, operating limits, and/or monitoring to ensure good combustion efficiency for the multi-point ground flare.
• Energy Efficient Design
o Use FTO variable flow air blowers with computer control application to control the excess oxygen based on the incoming feed.
o Use computer control application to minimize assist gas firing in to the FTO.
o Use variable assist at elevated flare with computer control application.
Refer to Appendix C for a summary of the proposed work practice standards, operating limits, and/or monitoring to ensure high combustion efficiency for the vent control system.
• Staged Operation
o Operation of the control applications to manage the disposition of the vent streams among the Vent Collection System and the control devices.
o Manual overrides and/or manual bypasses will be employed only during unexpected and unplanned failure of the computer control system to properly operate.
Appendix C of this application contains a summary of work practice standards, operational requirements, and/or monitoring for the proposed Vent Control System.
4.4 Boilers
The proposed boilers (EPN’s: RUPK31 and RUPK32) will only burn pipeline quality sweet natural gas. Each boiler will emit three GHG: CH4, CO2, and N2O. CO2 will be emitted from the boiler because it is a combustion product of any carbon-containing fuel. CH4 will be emitted from the boiler as a result of any incomplete combustion. N2O will be emitted from the boiler in trace quantities due to partial oxidation of nitrogen in the air which is used as the oxygen source for the combustion process. CO2 emissions account for approximately 99 percent of the total CO2e emissions. As a result, the GHG BACT analysis is focused on CO2.

Sage Environmental Consulting, L.P. 4-23 ExxonMobil Mont Belvieu Plastics Plant Revised March 2013 New Polyethylene Plant Permit Application
4.4.1 Step 1 – Identification of Potential Control Technologies
The following technologies were identified as potential control options for process boilers on available information and data sources:
• Use of low carbon fuels;
• Use of good operating and maintenance practices;
• Energy efficient design; and
• Carbon Capture and Sequestration (CCS)
4.4.1.1 Low Carbon Fuels
A discussed in section 4.2.1.1, the use of natural gas as assist gas is the lowest-carbon fuel available for the proposed project.
4.4.1.2 Good Operating and Maintenance Practices
Good operating and maintenance practices for the boilers are common techniques and are similar to those for the FTOs and RTO.
The boilers will be equipped with SCR for NOX control; therefore the focus for the burner design will be on combustion efficiency. The burner will be designed to maintain flame stabilization over a range of firing rates since the boilers will be required to operate at reduced firing rates during normal operation.
Good design principles proposed for this project include:
• Manufacturer burner technology maximizes burner stability and performance over a large operating window of fuel gas pressure and composition. The burners for the proposed project will be designed to accommodate the fuel gas composition range and optimize the burner performance for the design operating window.
• The source of fuel gas is pipeline natural gas, which is free of liquids. This will mitigate the risk of burner fouling or damage, which reduces combustion efficiency resulting in increased CO emissions. The fuel will be sampled monthly per requirements set forth in 40 CFR 98 Subpart C.
Operation and maintenance practices will be consistent with the current MBPP practices. Burner inspection and maintenance is typically performed on a planned basis during equipment maintenance down times to allow for entry requiring physical access to inspect/work on the individual components. Boiler inspections typically occur at least every 5 years but may be on a
Sage Environmental Consulting, L.P. 4-24 ExxonMobil Mont Belvieu Plastics Plant Revised March 2013 New Polyethylene Plant Permit Application
shorter frequency depending upon boiler performance. Inspection records are kept in the boiler equipment filing system. Key inspection steps include:
Check integrity of burner components (tips, tiles, surrounds), Inspect burner spuds for potential fouling, Inspect burner air doors and lubrication, Inspect all burners before closing main door to check for potential
debris, Inspect combustion air ducting and dampers, and Check burner spud/orifice sizes.
A record will be maintained for any maintenance activity completed on the burner. The burners are inspected during routine scheduled maintenance periods and corrective measures are taken to ensure the highest quality of combustion and flame stability. Tip replacement is conducted, if required.
Proper combustion can be commercially achieved at low excess oxygen levels as measured by online analyzers during normal operation, which results in high boiler thermal efficiency (≥77%) (HHV basis) and low GHG emissions. The excess oxygen at the burners is controlled and minimized via an application resetting the combustion air supply during normal operation. This application minimizes excess air to the extent complete combustion and maximum thermal efficiency is achieved yet safe operation is maintained. Air to fuel ratio control and low excess oxygen alarm in the DCS mitigate the risk of incomplete combustion due to lack of air. This alarm alerts the Operator that minimum excess oxygen has be detected so he/she may monitor the application controlling excess oxygen and correct the situation as necessary.
There may be times when the boiler will operate at higher excess oxygen than the minimum required level to achieve complete combustion. These times may include but are not limited to boiler turndown when extra air is necessary to achieve necessary mixing energy between combustion air and fuel gas.
Good combustion practices for the boilers include appropriate maintenance of equipment (such as periodic burner tune‐ups when required) and operating within the recommended combustion air and fuel ranges of the equipment as specified by its design, with the assistance of oxygen trim control. Refer to Appendix C for a summary of the proposed work practice standards, operating limits, and/or monitoring to ensure good combustion efficiency for the boilers.
4.4.1.3 Energy Efficient Design
Each boiler is sized to individually meet the steam demand of the proposed project for redundancy to ensure the plant is provided with adequate steam in the event of planned outages and unexpected shutdown of one boiler. In the event of an unexpected shutdown of one boiler, the operational boiler must

Sage Environmental Consulting, L.P. 4-25 ExxonMobil Mont Belvieu Plastics Plant Revised March 2013 New Polyethylene Plant Permit Application
event of an unexpected shutdown of one boiler, the operational boiler must rapidly increase its steam production, therefore both boilers must be operating at all times during normal plant operation. The boilers therefore operate in a reduced capacity mode where each boiler produces half of the normal steam demand. This is the typical operating mode for boilers. The service factor represents the estimated shared load of both boilers and accounts for the fact that each boiler operates during normal plant operation (with the exception of planned boiler maintenance), albeit at a reduced rate.
Based on ExxonMobil’s operating history and the sizing of utilities including boilers, the design basis of the proposed boilers is to ensure an unexpected boiler shutdown will not cause a disruptive plant wide shut down. The actual sizing for the proposed project takes into account historical boiler reliability and provides redundant capacity to ensure availability of boiler generated steam does not restrict plant operation. Excess boiler capacity comes with an additional capital cost to the proposed project. The design of the boiler, however, ensures that even while operating at a reduced capacity (29% of capacity), there is a nominal impact on combustion efficiency (estimated at 3%) at the normal reduced rates that the boilers will operate.
To maximize thermal efficiency at MBPP, the boilers will be equipped with heat recovery systems to produce steam from waste heat for use throughout the plant.
Specific technologies include the following:
• Economizer – Use of heat exchanger to recover heat from the exhaust gas to preheat incoming feedwater to attain thermal efficiency.
• Steam Generation from Process Waste Heat – Use of heat exchangers to recover heat from the process effluent to generate high pressure steam. The high pressure steam is then superheated by heat exchange with the exhaust gas, thus improving thermal efficiency.
• Feed Preheat – Use of heat exchangers to increase the incoming temperature of the feed, thereby reducing boiler firing demand.
Good design principles to ensure high boiler thermal efficiency proposed for this project include:
o As a result, the boilers will achieve a thermal efficiency of no less than 77% on a 12-month rolling average basis. Efficiency will be demonstrated by the following equation:
𝐵𝑜𝑖𝑙𝑒𝑟 𝐸𝑓𝑓𝑖𝑐𝑖𝑒𝑛𝑐𝑦 =(𝑠𝑡𝑒𝑎𝑚 𝑓𝑙𝑜𝑤 𝑟𝑎𝑡𝑒 𝑥 𝑠𝑡𝑒𝑎𝑚 𝑒𝑛𝑡ℎ𝑎𝑙𝑝𝑦) − (𝑓𝑒𝑒𝑑𝑤𝑎𝑡𝑒𝑟 𝑓𝑙𝑜𝑤𝑟𝑎𝑡𝑒 𝑥 𝑓𝑒𝑒𝑑𝑤𝑎𝑡𝑒𝑟 𝑒𝑛𝑡ℎ𝑎𝑙𝑝𝑦)
𝐹𝑢𝑒𝑙 𝑓𝑖𝑟𝑖𝑛𝑔 𝑟𝑎𝑡𝑒 𝑥 𝐺𝑟𝑜𝑠𝑠 𝐶𝑎𝑙𝑜𝑟𝑖𝑓𝑖𝑐 𝑉𝑎𝑙𝑢𝑒 (𝐺𝐶𝑉)∗ 100

Sage Environmental Consulting, L.P. 4-26 ExxonMobil Mont Belvieu Plastics Plant Revised March 2013 New Polyethylene Plant Permit Application
4.4.1.4 Carbon Capture and Sequestration (CCS)
Refer to Section 4.3.2.6 for a detailed description of these practices.
4.4.2 Step 2 - Eliminate Technically Infeasible Options
This step of the top-down BACT analysis eliminates any control technology that is not considered technically feasible unless it is both available and applicable.
4.4.2.1 Low Carbon Fuels
Use of natural gas as a low carbon fuel is technically feasible.
4.4.2.2 Good Operating and Maintenance Practice
Use of good operating and maintenance practice is considered technically feasible.
4.4.2.3 Energy Efficiency
Incorporating use of an economizer, steam generation from process waste heat, and feed preheat into the design of the boilers for energy efficiency is considered technically feasible.
4.4.2.4 Carbon Capture and Sequestration
CCS is an emerging technology that has no successful application at this scale and it is considered a technically, environmentally, and economically infeasible control option for this project. Refer to section 4.3.2.6 for more details of why CCS is not considered further in the BACT analysis.
4.4.3 Step 3 - Rank Remaining Control Technologies
The following technologies and control efficiencies were identified as technically feasible for CO2 control options for the boilers based on available information and data sources:
Use of low carbon fuels;
Use of good operating and maintenance practices; and
Energy efficient design.
4.4.4 Step 4 - Evaluate the Most Effective Controls and Document Results
Although all fossil fuels contain carbon, the natural gas combusted in this boiler is a low carbon fuel. In the combustion of a fossil fuel, the fuel carbon is oxidized into CO and CO2. Full oxidation of fuel carbon to CO2 is desirable because CO has long been a regulated pollutant with established adverse environmental impacts, and
Sage Environmental Consulting, L.P. 4-27 ExxonMobil Mont Belvieu Plastics Plant Revised March 2013 New Polyethylene Plant Permit Application
because full combustion releases more useful energy within the process. In addition, emitted CO gradually oxidized to CO2 in the atmosphere.
The use of low carbon fuels and good operating and maintenance practices are inherent in the design and operation of the boilers at MBPP. The boilers will be designed and operated such that thermal efficiency is achieved.
4.4.5 Step 5 - Selection of BACT
As a result of this analysis, the use of natural gas as a low carbon fuel, good operating and maintenance practices, use of an economizer, steam generation from process waste heat, and feed preheat is selected as BACT for the proposed boilers. This finding is consistent with the proposed rule Standards of Performance for Greenhouse Gas Emissions for New Stationary Sources: Electric Generating Units, which states16:
Second, all newly constructed sources have options in selecting their design (although it is true that natural gas-fired plants are inherently lower emitting with regard to CO2 than coal-fired plants). As a result, prospective owners and operators of new sources could readily comply with the proposed emission standards by choosing to construct a NGCC17 unit.
The proposed emission standard referenced above is:
The proposed requirements, which are strictly limited to new sources, would require new fossil fuel-fired EGU’s greater than 25 megawatt electric (MWe) to meet an output-based standard of 1,000 lb of CO2 per megawatt-hour (MWh), based on the performance of widely used natural gas combined cycle (NGCC) technology18.
This proposed rule is currently the only NSPS for GHG, and although it is applicable to electric generating units rather than boilers, it based the emission limitation on sources firing natural gas, without further controls for GHG. Therefore, the controls selected in the top-down BACT analysis for the proposed boilers, specifically firing of natural gas as fuel gas, meet or exceed the controls required in the proposed NSPS for Greenhouse Gases.
4.5 Equipment Component Fugitives
The proposed project will include new piping components for movement of gas and liquid raw materials, intermediates, and feedstocks. These components are potential sources of GHG emissions due to emissions from rotary shaft seals, connection interfaces, valves stems, and similar points. GHGs from piping component fugitives are mainly generated from fuel 16 77 FedReg 22410, April 13, 2012. 17 Natural Gas Combined Cycle 18 77 FedReg 22392, April 13, 2012.

Sage Environmental Consulting, L.P. 4-28 ExxonMobil Mont Belvieu Plastics Plant Revised March 2013 New Polyethylene Plant Permit Application
gas and natural gas lines for the proposed project, but may be emitted from other process lines that are “in-VOC-service”.
4.5.1 Step 1 – Identify Potential Control Technologies Piping fugitives may be controlled by various techniques, including:
• Installation of leakless technology components to eliminate fugitive emissions sources;
• Implementation of leak detection and repair (LDAR) programs in accordance with applicable state and federal regulations;
• Implementation of alternative monitoring using a remote sensing technology such as infrared cameras; and
• Implementation of audio/visual/olfactory (AVO) leak detection methods.
4.5.2 Step 2 - Eliminate Technically Infeasible Options
4.5.2.1 Leakless Technology
Leakless technology valves are used in situations where highly toxic or otherwise hazardous materials are used. These technologies cannot be repaired without a unit shutdown that often generates additional emissions. Fuel gas and natural gas are not considered highly toxic or hazardous materials and do not warrant the risk of unit shut down for repair. Thus, leakless valves for fuel lines are considered technically impracticable.
4.5.2.2 Instrument LDAR Programs
Use of instrument LDAR is considered technically feasible.
4.5.2.3 Remote Sensing
Use of remote sensing measures is considered technically feasible.
4.5.2.4 AVO Monitoring
Emissions from leaking components can be identified through AVO methods. Natural gas and some process fluids are odorous, making them detectable by olfactory means. Highly odorous compounds are detectable by AVO methods in lower concentrations than would be detected by instrument LDAR and/or remote sensing. Use of as-observed AVO monitoring is considered technically feasible.
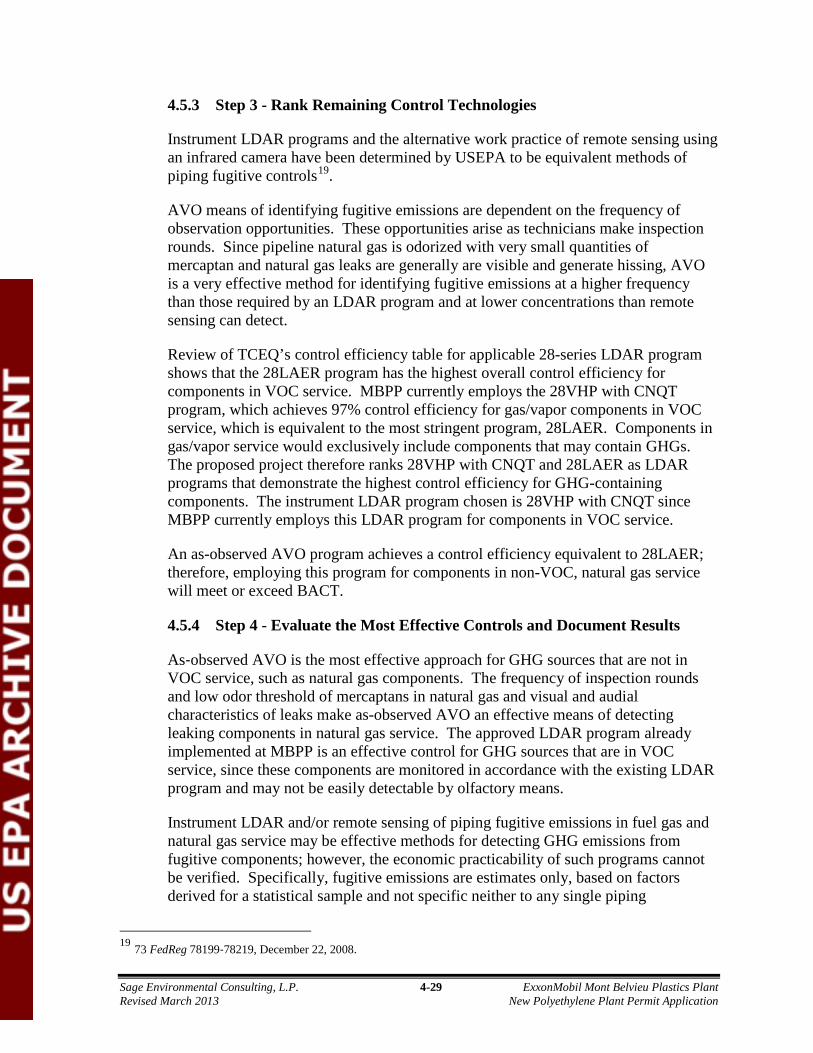
Sage Environmental Consulting, L.P. 4-29 ExxonMobil Mont Belvieu Plastics Plant Revised March 2013 New Polyethylene Plant Permit Application
4.5.3 Step 3 - Rank Remaining Control Technologies
Instrument LDAR programs and the alternative work practice of remote sensing using an infrared camera have been determined by USEPA to be equivalent methods of piping fugitive controls19.
AVO means of identifying fugitive emissions are dependent on the frequency of observation opportunities. These opportunities arise as technicians make inspection rounds. Since pipeline natural gas is odorized with very small quantities of mercaptan and natural gas leaks are generally are visible and generate hissing, AVO is a very effective method for identifying fugitive emissions at a higher frequency than those required by an LDAR program and at lower concentrations than remote sensing can detect.
Review of TCEQ’s control efficiency table for applicable 28-series LDAR program shows that the 28LAER program has the highest overall control efficiency for components in VOC service. MBPP currently employs the 28VHP with CNQT program, which achieves 97% control efficiency for gas/vapor components in VOC service, which is equivalent to the most stringent program, 28LAER. Components in gas/vapor service would exclusively include components that may contain GHGs. The proposed project therefore ranks 28VHP with CNQT and 28LAER as LDAR programs that demonstrate the highest control efficiency for GHG-containing components. The instrument LDAR program chosen is 28VHP with CNQT since MBPP currently employs this LDAR program for components in VOC service.
An as-observed AVO program achieves a control efficiency equivalent to 28LAER; therefore, employing this program for components in non-VOC, natural gas service will meet or exceed BACT.
4.5.4 Step 4 - Evaluate the Most Effective Controls and Document Results
As‐observed AVO is the most effective approach for GHG sources that are not in VOC service, such as natural gas components. The frequency of inspection rounds and low odor threshold of mercaptans in natural gas and visual and audial characteristics of leaks make as-observed AVO an effective means of detecting leaking components in natural gas service. The approved LDAR program already implemented at MBPP is an effective control for GHG sources that are in VOC service, since these components are monitored in accordance with the existing LDAR program and may not be easily detectable by olfactory means.
Instrument LDAR and/or remote sensing of piping fugitive emissions in fuel gas and natural gas service may be effective methods for detecting GHG emissions from fugitive components; however, the economic practicability of such programs cannot be verified. Specifically, fugitive emissions are estimates only, based on factors derived for a statistical sample and not specific neither to any single piping
19 73 FedReg 78199‐78219, December 22, 2008.

Sage Environmental Consulting, L.P. 4-30 ExxonMobil Mont Belvieu Plastics Plant Revised March 2013 New Polyethylene Plant Permit Application
component nor specifically for natural gas service. Therefore, since the total contribution to the proposed project’s CO2e PTE from piping fugitives is less than 0.2%, which is much less than the statistical accuracy of the development of the factors themselves20, instrument LDAR programs or their equivalent alternative method, remote sensing, are not economically practicable for controlling the piping fugitive GHGs emissions for this project’s natural gas components.
4.5.5 Step 5 - Selection of BACT The proposed project selects as-observed AVO as BACT for piping components in natural gas service and instrument LDAR (28VHP with CNQT) for piping components in VOC service.
Refer to Appendix C for a summary of the proposed work practice standards and operating limits for fugitive equipment components.
4.6 Analyzers
The only practical option for control of GHG emissions from the analyzers is the proposed technology of catalytic oxidation powered by electricity. Due to the presence of oxygen in some of the analyzer vent streams, these vent streams cannot be recovered to process or controlled in the Vent Collection System. Thermal oxidation was evaluated as an alternative method of control, however, this option was eliminated as BACT because of the net increase in GHG emissions which would result from the use of natural gas fueled burners to supply sufficient oxidization temperature in the reaction zone.
The TRACErase™ Hydrocarbon Emission Eliminator utilizes a constant heat source to allow effective oxidation of intermittent fugitive emission streams as well as continuous source streams. Temperatures in excess of 100 oF indicate functioning of cartridge heater and in excess of 185º F indicate functioning of catalyst cartridge.
The proposed project will use a temperature sensor to alert personnel when the operating temperature is off target and the unit requires maintenance. Annual preventive maintenance to replace the catalyst cartridge will be performed, which is consistent with current MBPP practices. Refer to Appendix C for a summary of the proposed work practice standards and operating limits for the analyzers proposed to be controlled by TRACErase™ .
20 In Appendix B, Table B‐2‐2, of EPA’s Protocol for Equipment Leak Emissions Estimates (EPA 453/R‐95‐017), November 1995, the Agency considered only the upper and lower 95% confidence limits in developing revised SOCMI emission factors.

Sage Environmental Consulting, L.P. 5-1 ExxonMobil Mont Belvieu Plastics Plant Revised March 2013 New Polyethylene Plant Permit Application
SECTION 5 OTHER PSD REQUIREMENTS
5.1 Impacts Analysis
An impacts analysis is not being provided with this application in accordance with USEPA’s recommendations:
“Since there are no NAAQS or PSD increments for GHGs, the requirements in sections 52.21(k) and 51.166(k) of USEPA’s regulations to demonstrate that a source does not cause or contribute to a violation of the NAAQS is not applicable to GHGs. Thus, we do not recommend that PSD applicants be required to model or conduct ambient monitoring for CO2 or GHGs.21”
5.2 GHG Preconstruction Monitoring
A pre-construction monitoring analysis for GHG is not being provided with this application in accordance with USEPA’s recommendations:
“EPA does not consider it necessary for applications to gather monitoring data to assess ambient air quality for GHGs under section 52.21(m)(1)(ii), section 51.166(m)(1)(ii), or similar provision that may be contained in state rules based on EPA’s rules. GHGs do not affect “ambient air quality” in the sense that EPA intended when these parts of EPA’s rules were initially drafted. Considering the nature of GHG emissions and their global impacts, EPA does not believe it is practical or appropriate to expect permitting authorities to collect monitoring data for purpose of assessing ambient air impacts of GHGs22.”
5.3 Additional Impacts Analysis
A PSD additional impacts analysis is not being provided with this application in accordance with USEPA’s recommendations:
“Furthermore, consistent with EPA’s statement in the Tailoring Rule, EPA believes it is not necessary for applications or permitting authorities to assess impacts for GHGs in the context of the additional impacts analysis or Class I area provisions of the PSD regulations for the following policy reasons. Although it is clear that GHG emissions contribute to global warming and other climate changes that result in impacts on the environment, including impacts on Class I areas and soils and vegetation due to the global scope of the problem, climate change modeling and evaluations of risks and impacts of GHG emissions is typically conducted for changes in emissions order of magnitude larger than the emissions for individual projects that might be analyzed in
21 See footnote 1, Page 47. 22 See footnote 1, Page 48.

Sage Environmental Consulting, L.P. 5-2 ExxonMobil Mont Belvieu Plastics Plant Revised March 2013 New Polyethylene Plant Permit Application
PSD permit reviews. Quantifying the exact impacts attributable to a specific GHG source obtaining a permit in specific places and points would not be possible with current climate change modeling. Given these considerations, GHG emissions would serve as the more appropriate and credible proxy for assessing the impact of a given facility. Thus, EPA believes that the most practical way to address the considerations reflected in the Class I area and additional impacts analysis is to focus on reducing GHG emissions to the maximum extent. In light of these analytical challenges, compliance with the BACT analysis is the best technique that can be employed at present to satisfy the additional impacts analysis and Class I area requirements of the rules related to GHG6.”
The Class I area that is located closest to the proposed project is Caney Creek Wilderness Area, which is located over 100 kilometers away.
5.4 Endangered Species
USEPA’s issuance of a GHG permit for the proposed project is not anticipated to trigger Section 7 of the federal Endangered Species Act (ESA). Section 7 of the ESA requires that, through consultation (or conferencing for proposed species) with the U.S. Fish and Wildlife Service (USFWS) and/or the National Marine Fisheries Service (NMFS), federal actions do not jeopardize the continued existence of any threatened, endangered, or proposed species or result in the destruction or adverse modification of designated critical habitat.
A Biological Assessment (BA) of the potential effects of the proposed project on species that are protected under the ESA will be completed as necessary. The assessment will include a review of the USFWS and Texas Parks and Wildlife Department’s current lists of threatened and endangered species, and determine whether the proposed project has any effect on any of the federally listed threatened or endangered species.
The BA will evaluate threatened and endangered species within the defined “action area”, which is defined as “all areas to be affected directly or indirectly by the Federal action (in this case the Federal Action is USEPA issuing the permit) and not merely the immediate area involved in the action.”
5.5 Environmental Justice
USEPA is required to implement Executive Order 12898, entitled “Federal Actions To Address Environmental Justice in Minority Populations and Low-Income Populations,” which states in relevant part that “each Federal agency shall make achieving environmental justice part of its mission by identifying and addressing, as appropriate, disproportionately high and adverse human health or environmental effects of its programs, policies, and activities on minority populations and low-income populations.” Based on this Executive Order, the USEPA’s Environmental Appeals Board (EAB) has held that environmental justice issues must be considered in connection with the issuance of federal PSD permits issued by USEPA Regional Offices and states acting under delegations of Federal authority.
A demographic analysis will be conducted to determine whether communities surrounding the proposed project contain minority, low income, or linguistically isolated populations that

Sage Environmental Consulting, L.P. 5-3 ExxonMobil Mont Belvieu Plastics Plant Revised March 2013 New Polyethylene Plant Permit Application
significantly deviate from county and statewide averages. Public involvement will be facilitated as requested by USEPA.
5.6 Historical Preservation
Section 106 of the National Historic Preservation Act requires that “a federal agency must identify historic properties, consider the effect its proposed action will have on any identified sites, and then consult with the State Historic Preservation Officer on ways to avoid or mitigate any adverse effects. The law does not mandate a particular result. However, it does provide a meaningful opportunity to resolve potential conflicts.”
For the proposed project, an assessment of the potential for historic period sites at the project area will be conducted and include the following:
• Review of old USGS topographic maps, and other previously recorded cultural resource sites within the project areas to identifying historic properties;
• Assessing effects on identified historic properties within the project area;
• Resolving adverse effects, including consultation with the State Historic Preservation Officer (SHPO) and adoption of a Memorandum of Agreement; and
• The submission of a formal request for the federal Advisory Council on Historic Preservation’s comments in the event that adverse effects are not resolved.
The aforementioned documentation will be submitted subsequent to this application and upon finalization of the project area. The area of potential effects (APE) includes the entire area within which historic properties could be affected by the project. This includes all areas of construction, demolition, and ground disturbance (direct effects) and the broader surrounding area that might experience visual or other effects from the project (indirect effects).

Sage Environmental Consulting, L.P. 6-1 ExxonMobil Mont Belvieu Plastics Plant Revised March 2013 New Polyethylene Plant Permit Application
SECTION 6 CONSIDERATIONS FOR GRANTING A PERMIT
Increased North American shale gas production is positive news for the U.S. economy and, in particular, U.S. petrochemical manufacturers who have benefited not only from lower energy costs, but also from the increased availability of advantaged light feedstock such as ethane – both of which lower overall chemical production costs. This has resulted in numerous announcements of North American ethane cracking studies. ExxonMobil’s U.S. Gulf Coast manufacturing facilities are well-positioned to capitalize on the growing U.S. ethane infrastructure, to expand our domestic capability to produce ethylene and polyethylene, and to supply our high quality commodity and specialty products to customers around the world. The proposed investment reflects ExxonMobil’s continued confidence in the natural gas-driven revitalization of the U.S. chemical industry. If ExxonMobil elects to proceed with this project, it could greatly benefit local economies by creating new jobs and economic growth in the U.S. Gulf Coast region. The project is expected to create about 350 full-time jobs and about 10,000 temporary construction jobs; and would be constructed in and integrated into existing ExxonMobil facilities, taking advantage of existing energy infrastructure. It is also estimated that an additional 3,700 permanent jobs would be created in the local community through multiplier effects.

Sage Environmental Consulting, L.P. 7-1 ExxonMobil Mont Belvieu Plastics Plant Revised March 2013 New Polyethylene Plant Permit Application
SECTION 7 OTHER ADMINISTRATIVE REQUIREMENTS
The following administrative information related to this permit application is provided on the following Table 7-1. This information includes:
• Company name;
• Company official and associated contact information;
• Technical contact and associated contact information;
• Project location, Standard Industrial Code (SIC), and North American Industry Classification System (NAICS) code;
• Projected start of construction and start of operation dates; and
• Company official signature transmitting the application.

Sage Environmental Consulting, L.P. 7-2 ExxonMobil Mont Belvieu Plastics Plant Revised March 2013 New Polyethylene Plant Permit Application
Table 7-1 Administrative Information
I. Applicant Information
A. Company or Other Legal Name: ExxonMobil Chemical Company (Mont Belvieu Plastics Plant)
B. Company Official Contact Name: Joe Wolf
Title: Plant Manager
Mailing Address: P.O. Box 1653 City: Mont Belvieu State: Texas ZIP Code: 77580-1653
Telephone No.: 281-834-9411 E-mail Address: [email protected]
C. Technical Contact Name: Benjamin M. Hurst
Title: Air Permits Advisor
Company Name: ExxonMobil Chemical Company
Mailing Address: P.O. Box 4004 City: Baytown State: Texas ZIP Code: 77522-4004
Telephone No.: 281-834-1992 E-mail Address: [email protected]
D. Site Name: Mont Belvieu Plastics Plant
E. Area Name/Type of Facility: Polyethylene Unit Permanent Portable
F. Principal Company Product or Business: Plastics Material Manufacturing
Principal Standard Industrial Classification Code (SIC): 2821
Principal North American Industry Classification System (NAICS): 325211
G. Projected Start of Construction Date: 03/01/2013
Projected Start of Operation Date: 2Q2016
Hours of Operation: 24 hours/day, 7 days/week, 52 weeks/year
H. Facility and Site Location Information (If no street address, provide clear driving directions to the site in writing.):
Street Address: 13330 Hatcherville Rd
City/Town: Mont Belvieu County: Chambers ZIP Code: 77580
Latitude (nearest second): 29° 52’ 43” N Longitude (nearest second): 94° 55’ 12” W
II. Signature
The signature below confirms that I have knowledge of the facts included in this application and that these facts are true and correct to the best of my knowledge and belief. I further state that I understand my signature indicates that this application meets all applicable prevention of significant deterioration permitting application requirements.
Name: Signature: Original Signature Required Date:
Sage Environmental Consulting, L.P. A-1 Mont Belvieu Plastics Plant Revised March 2013 New Polyethylene Plant Permit Application
APPENDIX A GHG EMISSION CALCULATIONS
The following tables are included in this appendix in the following order:
GHG Emissions Summary
Fuel Gas Composition and Heating Value
o Table A-1 Representative Vent Gas to FTO
o Table A-2 Representative Vent Gas to Elevated Flare
o Table A-3 Representative Vent Gas to RTO
o Table A-4 Representative Vent Gas to Multi-Point Ground Flare
o Table A-5 Representative Natural Gas
RTO Emissions Calculations
Vent Control System Emissions Calculations
o Flameless Thermal Oxidizers Emissions Calculations
o Flaring Emissions Calculations
o Pilot Gas Emissions Calculations
Boilers Emissions Calculations
Fugitive Emissions Calculations
Analyzers Emissions Calculations
Hexene Tank Emissions Calculations
Cooling Tower Emissions Calculations
Wastewater Emissions Calculations
Miscellaneous Vents Emissions Calculations

ExxonMobil Chemical CompanyMont Belvieu Plastics PlantGHG Emissions Summary
CO2 130,343 2,221 97,582 30,512 (A) 28 - - - -N2O 7 1 5 1 - - - - - -CH4 14 1 11 2 (A) - - - - -
Total GHG mass 130,364 2,223 97,598 30,515 (A) 28 0 0 0 0
CO2 130,343 2,221 97,582 30,512 (A) 28 - - - -N2O 2,170 310 1,550 310 - - - - - -CH4 294 21 231 42 (A) - - - - -
Total GHG CO2e 132,807 2,552 99,363 30,864 (A) 28 0 0 0 0
A Air contaminant emission rates are estimates only for fugitive sources.
GHG Pollutant
Annual Emissions: Tons per year CO2e
GHG CO2e
Oil Water Separator
Cooling Tower
Miscellaneous Vents Hexene TankFugitives
Total Annual Emissions Boilers Anazlyers
Regenerative Thermal Oxidizer
Vent Collection System
Sage Environmental Consulting, L.P.Revised - March 2013 1 of 1
MBPP GHG Calcs_March 2013Emissions Summary
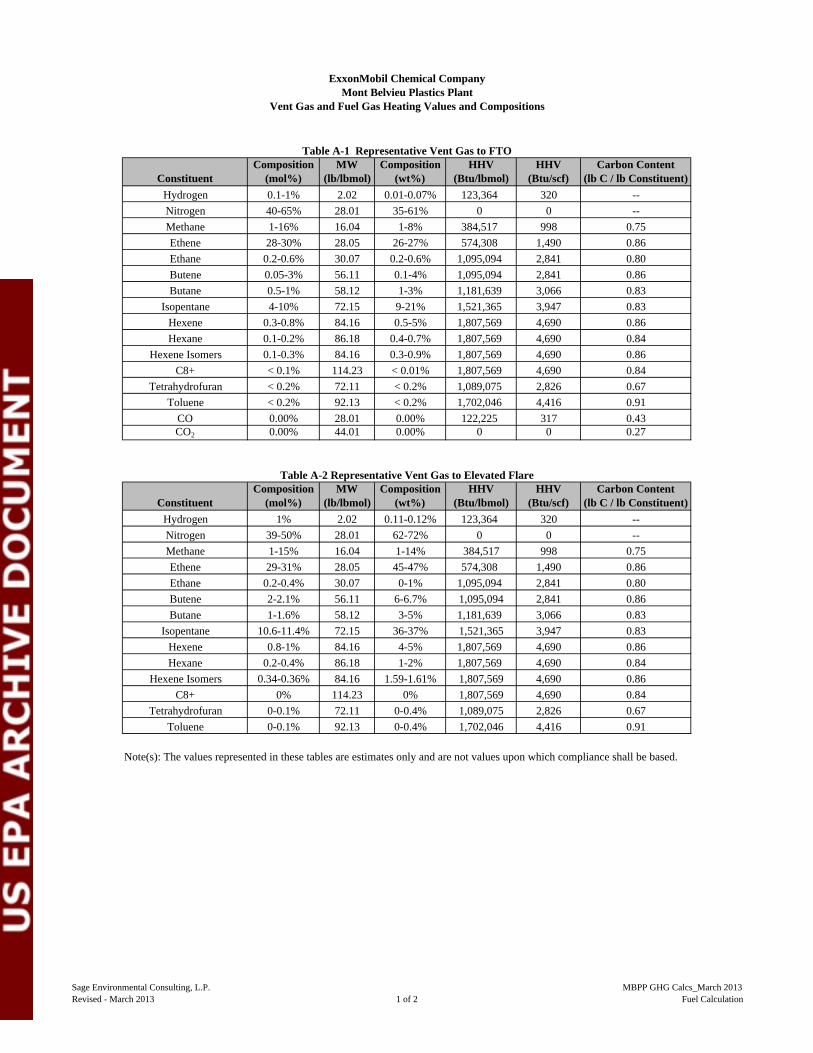
ExxonMobil Chemical CompanyMont Belvieu Plastics Plant
Vent Gas and Fuel Gas Heating Values and Compositions
ConstituentComposition
(mol%)MW
(lb/lbmol)Composition
(wt%)HHV
(Btu/lbmol)HHV
(Btu/scf)Carbon Content
(lb C / lb Constituent)Hydrogen 0.1-1% 2.02 0.01-0.07% 123,364 320 --Nitrogen 40-65% 28.01 35-61% 0 0 --Methane 1-16% 16.04 1-8% 384,517 998 0.75Ethene 28-30% 28.05 26-27% 574,308 1,490 0.86Ethane 0.2-0.6% 30.07 0.2-0.6% 1,095,094 2,841 0.80Butene 0.05-3% 56.11 0.1-4% 1,095,094 2,841 0.86Butane 0.5-1% 58.12 1-3% 1,181,639 3,066 0.83
Isopentane 4-10% 72.15 9-21% 1,521,365 3,947 0.83Hexene 0.3-0.8% 84.16 0.5-5% 1,807,569 4,690 0.86Hexane 0.1-0.2% 86.18 0.4-0.7% 1,807,569 4,690 0.84
Hexene Isomers 0.1-0.3% 84.16 0.3-0.9% 1,807,569 4,690 0.86C8+ < 0.1% 114.23 < 0.01% 1,807,569 4,690 0.84
Tetrahydrofuran < 0.2% 72.11 < 0.2% 1,089,075 2,826 0.67Toluene < 0.2% 92.13 < 0.2% 1,702,046 4,416 0.91
CO 0.00% 28.01 0.00% 122,225 317 0.43CO2 0.00% 44.01 0.00% 0 0 0.27
ConstituentComposition
(mol%)MW
(lb/lbmol)Composition
(wt%)HHV
(Btu/lbmol)HHV
(Btu/scf)Carbon Content
(lb C / lb Constituent)Hydrogen 1% 2.02 0.11-0.12% 123,364 320 --Nitrogen 39-50% 28.01 62-72% 0 0 --Methane 1-15% 16.04 1-14% 384,517 998 0.75Ethene 29-31% 28.05 45-47% 574,308 1,490 0.86Ethane 0.2-0.4% 30.07 0-1% 1,095,094 2,841 0.80Butene 2-2.1% 56.11 6-6.7% 1,095,094 2,841 0.86Butane 1-1.6% 58.12 3-5% 1,181,639 3,066 0.83
Isopentane 10.6-11.4% 72.15 36-37% 1,521,365 3,947 0.83Hexene 0.8-1% 84.16 4-5% 1,807,569 4,690 0.86Hexane 0.2-0.4% 86.18 1-2% 1,807,569 4,690 0.84
Hexene Isomers 0.34-0.36% 84.16 1.59-1.61% 1,807,569 4,690 0.86C8+ 0% 114.23 0% 1,807,569 4,690 0.84
Tetrahydrofuran 0-0.1% 72.11 0-0.4% 1,089,075 2,826 0.67Toluene 0-0.1% 92.13 0-0.4% 1,702,046 4,416 0.91
Note(s): The values represented in these tables are estimates only and are not values upon which compliance shall be based.
Table A-1 Representative Vent Gas to FTO
Table A-2 Representative Vent Gas to Elevated Flare
Sage Environmental Consulting, L.P.Revised - March 2013 1 of 2
MBPP GHG Calcs_March 2013Fuel Calculation

ExxonMobil Chemical CompanyMont Belvieu Plastics Plant
Vent Gas and Fuel Gas Heating Values and Compositions
ConstituentComposition
(mol%)MW
(lb/lbmol)Composition
(wt%)HHV
(Btu/lbmol)HHV
(Btu/scf)Carbon Content
(lb C / lb Constituent)Butene < 0.01% 56.11 < 0.02% 1,170,631 3,037 0.86Hexene < 0.02% 84.16 < 0.1% 1,807,569 4,690 0.86Toluene < 0.001% 92.13 < 0.01% 1,702,046 4,416 0.91
THF < 0.002% 72.11 < 0.01% 1,164,557 3,021 0.67Oxygen 0-21% 32.00 0-23% 0 0 --Nitrogen 0.3-79% 28.01 1-76% 0 0 --Methane 0.5-96% 16.04 0.3-90% 384,517 998 0.75
C5+ (as Hexane) 0.001-0.1% 86.18 0.002-1% 1,807,569 4,690 0.84Ethane 0.01-2% 30.07 0.01-3% 680,211 1,765 0.80
Ethylene 0% 28.05 0% 612,645 1,590 0.86Propane 0.002-0.3% 44.10 0.003-1% 983,117 2,551 0.82Butane 0.001-0.2% 58.12 0.002-1% 1,279,191 3,319 0.83
CO 0% 28.01 0% 122,225 317 0.43CO2 0.01-2% 44.01 0.01-4% 0 0 0.27
ConstituentComposition
(mol%)MW
(lb/lbmol)Composition
(wt%)HHV
(Btu/lbmol)HHV
(Btu/scf)Carbon Content
(lb C / lb Constituent)Hydrogen 0-0.3% 2.02 0-5% 123,364 320 --Nitrogen 12-26% 28.01 17-29% 0 0 --Ethene 25-34% 28.05 30-47% 574,308 1,490 0.86Ethane 0-0.3% 30.07 0-0.3% 1,095,094 2,841 0.80Butene 0-26% 56.11 0-15% 1,095,094 2,841 0.86Butane 6-12% 58.12 5-6% 1,181,639 3,066 0.83
Isopentane 31-43% 72.15 15-23% 1,521,365 3,947 0.83Hexene 0-8% 84.16 0-4% 1,807,569 4,690 0.86Hexane 0-3% 86.18 0-2% 1,807,569 4,690 0.84
Other C6+ 0-3% 84.16 0-2% 1,807,569 4,690 0.86C8+ 0% 114.23 0% 1,807,569 4,690 0.84
Tetrahydrofuran 0-0.1% 72.11 0-0.03% 1,089,075 2,826 0.67Toluene 0-0.1% 92.13 0-0.03% 1,702,046 4,416 0.91
ConstituentComposition
(mol%)MW
(lb/lbmol)Composition
(wt%)HHV
(Btu/lbmol)HHV
(Btu/scf)Carbon Content
(lb C / lb Constituent)Hydrogen 0.0% 2.02 0.0% 123,364 320 --Methane 96% 16.04 90% 384,517 998 0.75Ethane 1.8% 30.07 3.2% 680,211 1,765 0.80
Ethylene 0.0% 28.05 0.0% 612,645 1,590 0.86Propane 0.3% 44.10 0.9% 983,117 2,551 0.82n-Butane 0.2% 58.12 0.6% 1,279,191 3,319 0.83
C5+ (as Hexane) 0.1% 86.18 0.7% 1,807,569 4,690 0.84Nitrogen 0.3% 28.01 0.5% 0 0 0.00
CO 0.0% 28.01 0.0% 122,225 317 0.43CO2 1.6% 44.01 4.2% 0 0 0.27
Note(s): The values represented in these tables are estimates only and are not values upon which compliance shall be based.
Table A-3 Representative Vent Gas to RTO
Table A-4 Representative Vent Gas to Multi-Point Ground Flare
Table A-5 Representative Natural Gas
Sage Environmental Consulting, L.P.Revised - March 2013 2 of 2
MBPP GHG Calcs_March 2013Fuel Calculation

ExxonMobil Chemical CompanyMont Belvieu Plastics Plant
Regenerative Thermal OxidizerGreenhouse Gas Emissions Calculations
Parameter Name & Variable Value & Units Basis/Calculation/Notes1. General Values and Calculations
Standard Molar Volume VMS 385 scf/lb-mol Based on ideal gas law
Avg. Heat Value of Vent Gas HVAVG 5.7 Btu/scf Calculated from representative stream speciation
Total Vent Gas Heat Input to Regenerative Thermal Oxidizer H 37,048.5 MMBtu/yr = QV * HVAVG
Total Regenerative Thermal Oxidizer Vent Gas Volume Flow QV 6,516 MMscf/yr Based on expected firing rate
Avg. Molecular Weight of Vent Gas MV 28.8 lb/lb-mol Calculated from representative stream speciation
Carbon Content of Vent Gas Fcc 0.002 lbC/lbGas Calculated from representative stream speciation
2. CO2 Emission Rate Calculations
CO2 Annual Emission Rate = 2,221 TPY = MWCO2/MWCarbon * QV * 106 * FCC * MV / VMS / 2000 lb/tonEquation C-5
3. N2O Emission Rate Calculations
N2O Emission Factor FN2O 6.0E-04 kg/MMBtu 40 CFR 98, Table C-2
N2O Annual Emission Rate = 1 TPY= H * FN2O * 2.205 lb/kg / 2000 lb/tonEquation C-8b
4. CH4 Emission Rate Calculations
CH4 Emission Factor FCH4 3.0E-03 kg/MMBtu 40 CFR 98, Table C-2
CH4 Annual Emission Rate = 1 TPY= H * FCH4 * 2.205 lb/kg / 2000 lb/tonEquation C-8b
5. CO2e Emission Rate Calculations
CO2 CO2e Factor FeCO2 1 tonCO2/tonCO2e 40 CFR 98, Table A-1
N2O CO2e Factor FeN2O 310 tonN2O/tonCO2e 40 CFR 98, Table A-1
CH4 CO2e Factor FeCH4 21 tonCH4/tonCO2e 40 CFR 98, Table A-1
CO2e Annual Emission Rate = 2,552 TPY = Σ (TPY * Fex)
Note(s): The operational parameters are estimated variables that result in the worst case maximum allowable emission rates.
Sage Environmental Consulting, L.P.Revised - March 2013 1 of 1
MBPP GHG Calcs_March 2013Reg. Thermal Oxidizer Submittal

ExxonMobil Chemical CompanyMont Belvieu Plastics Plant
Vent Collection SystemGreenhouse Gas Emissions Summary
Parameter Name & Variable Value & Units Basis/Calculation/Notes1. CO2 Emission Rate Calculations
CO2 Combustion Annual Emission Rate = 95,849 TPY
CO2 Pilot Gas Annual Emission Rate = 1,733 TPY
CO2 Annual Emission Rate = 97,582 TPY Sum of annual CO2 emissions from all streams
2. N2O Emission Rate Calculations
N2O Combustion Annual Emission Rate = 3 TPY
N2O Pilot Gas Annual Emission Rate = 2 TPY
N2O Annual Emission Rate = 5 TPY Sum of annual N2O emissions from all streams
3. CH4 Emission Rate Calculations
CH4 Combustion Annual Emission Rate = 6 TPY
CH4 Pilot Gas Annual Emission Rate = 5 TPY
CH4 Annual Emission Rate = 11 TPY Sum of annual CH4 emissions from all streams
4. CO2e Emission Rate Calculations
CO2 CO2e Factor FeCO2 1 tonCO2/tonCO2e 40 CFR 98, Table A-1
N2O CO2e Factor FeN2O 310 tonN2O/tonCO2e 40 CFR 98, Table A-1
CH4 CO2e Factor FeCH4 21 tonCH4/tonCO2e 40 CFR 98, Table A-1
CO2e Annual Emission Rate = 99,363 TPY = Σ (TPY * Fex)
Note(s): The operational parameters are estimated variables that result in the worst case maximum allowable emission rates.
Sage Environmental Consulting, L.P.New - March 2013 1 of 1
MBPP GHG Calcs_March 2013VCS Submittal

ExxonMobil Chemical CompanyMont Belvieu Plastics PlantFlameless Thermal Oxidizer
Greenhouse Gas Emissions Calculations
Parameter Name & Variable Value & Units Basis/Calculation/Notes1. General Values and Calculations
Standard Molar Volume VMS 385 scf/lb-mol Based on ideal gas law
Avg. Heat Value of Vent Gas HVAVG 639 Btu/scf Calculated from representative stream speciation
Total Vent Gas Heat Input to Flameless Thermal Oxidizer H 1,167,325 MMBtu/yr = QV * HVAVG
Total Flameless Thermal Oxidizer Vent Gas Volume Flow QV 1,826 MMscf/yr Based on expected firing rate
Avg. Molecular Weight of Vent Gas MV 29.98 lb/lb-mol Calculated from representative stream speciation
Carbon Content of Vent Gas Fcc 0.33 lbC/lbGas Calculated from representative stream speciation
2. CO2 Emission Rate Calculations
CO2 Annual Emission Rate = 86,631 TPY = MWCO2/MWCarbon * QV * 106 * FCC * MV / VMS / 2000 lb/tonEquation C-5
3. N2O Emission Rate Calculations
N2O Emission Factor FN2O 6.0E-04 kg/MMBtu 40 CFR 98, Table C-2
N2O Annual Emission Rate = 1 TPY= H * FN2O * 2.205 lb/kg / 2000 lb/tonEquation C-8b
4. CH4 Emission Rate Calculations
CH4 Emission Factor FCH4 3.0E-03 kg/MMBtu 40 CFR 98, Table C-2
CH4 Annual Emission Rate = 4 TPY= H * FCH4 * 2.205 lb/kg / 2000 lb/tonEquation C-8b
5. CO2e Emission Rate Calculations
CO2 CO2e Factor FeCO2 1 tonCO2/tonCO2e 40 CFR 98, Table A-1
N2O CO2e Factor FeN2O 310 tonN2O/tonCO2e 40 CFR 98, Table A-1
CH4 CO2e Factor FeCH4 21 tonCH4/tonCO2e 40 CFR 98, Table A-1
CO2e Annual Emission Rate = 87,025 TPY = Σ (TPY * Fex)
Note(s): The operational parameters are estimated variables that result in the worst case maximum allowable emission rates.
Sage Environmental Consulting, L.P.Revised - March 2013 1 of 1
MBPP GHG Calcs_March 2013FTO Submittal

ExxonMobil Chemical CompanyMont Belvieu Plastics Plant
Total Elevated FlareGreenhouse Gas Emissions Summary
Parameter Name & Variable Value & Units Basis/Calculation/Notes1. CO2 Emission Rate Calculations
CO2 Flaring Annual Emission Rate = 3,608 TPY
CO2 Pilot Gas Annual Emission Rate = 169 TPY
CO2 Annual Emission Rate = 3,777 TPY Sum of annual CO2 emissions from all streams
2. N2O Emission Rate Calculations
N2O Flaring Annual Emission Rate = 1 TPY
N2O Pilot Gas Annual Emission Rate = 1 TPY
N2O Annual Emission Rate = 2 TPY Sum of annual N2O emissions from all streams
3. CH4 Emission Rate Calculations
CH4 Flaring Annual Emission Rate = 1 TPY
CH4 Pilot Gas Annual Emission Rate = 2 TPY
CH4 Annual Emission Rate = 3 TPY Sum of annual CH4 emissions from all streams
4. CO2e Emission Rate Calculations
CO2 CO2e Factor FeCO2 1 tonCO2/tonCO2e 40 CFR 98, Table A-1
N2O CO2e Factor FeN2O 310 tonN2O/tonCO2e 40 CFR 98, Table A-1
CH4 CO2e Factor FeCH4 21 tonCH4/tonCO2e 40 CFR 98, Table A-1
CO2e Annual Emission Rate = 4,460 TPY = Σ (TPY * Fex)
Note(s): The operational parameters are estimated variables that result in the worst case maximum allowable emission rates.
Sage Environmental Consulting, L.P.Revised - March 2013 1 of 1
MBPP GHG Calcs_March 2013Total Elevated Flare Submittal
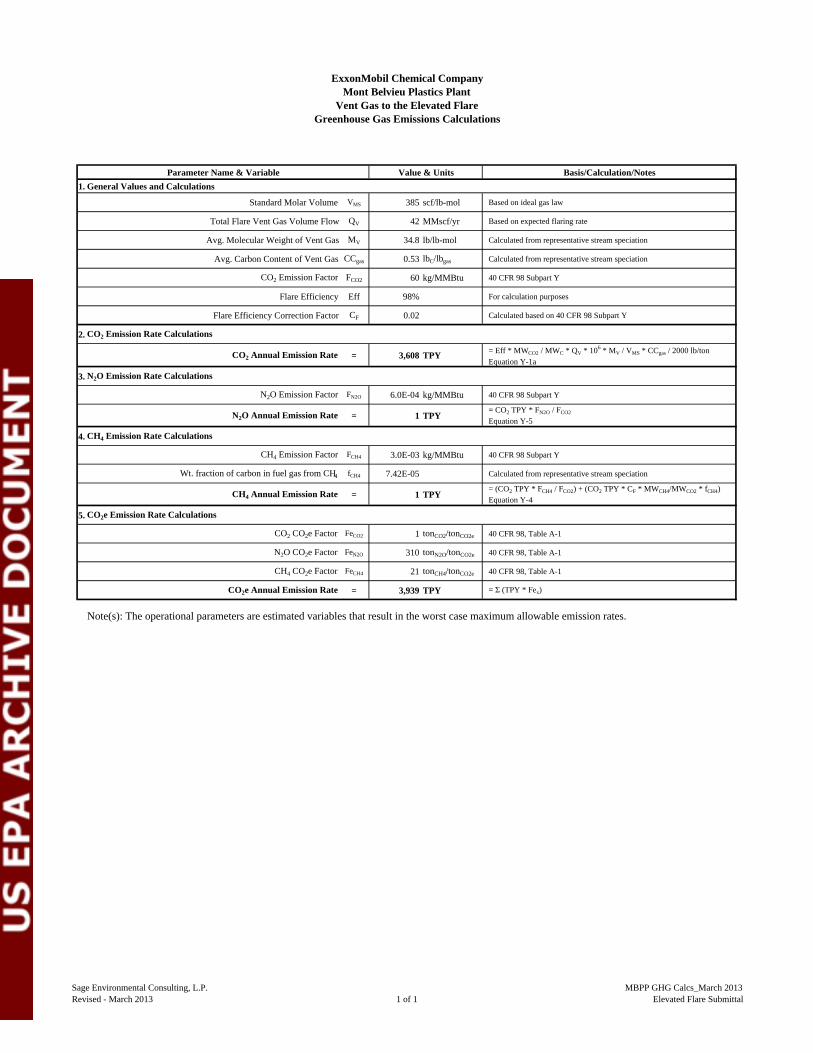
ExxonMobil Chemical CompanyMont Belvieu Plastics Plant
Vent Gas to the Elevated FlareGreenhouse Gas Emissions Calculations
Parameter Name & Variable Value & Units Basis/Calculation/Notes1. General Values and Calculations
Standard Molar Volume VMS 385 scf/lb-mol Based on ideal gas law
Total Flare Vent Gas Volume Flow QV 42 MMscf/yr Based on expected flaring rate
Avg. Molecular Weight of Vent Gas MV 34.8 lb/lb-mol Calculated from representative stream speciation
Avg. Carbon Content of Vent Gas CCgas 0.53 lbC/lbgas Calculated from representative stream speciation
CO2 Emission Factor FCO2 60 kg/MMBtu 40 CFR 98 Subpart Y
Flare Efficiency Eff 98% For calculation purposes
Flare Efficiency Correction Factor CF 0.02 Calculated based on 40 CFR 98 Subpart Y
2. CO2 Emission Rate Calculations
CO2 Annual Emission Rate = 3,608 TPY = Eff * MWCO2 / MWC * QV * 106 * MV / VMS * CCgas / 2000 lb/tonEquation Y-1a
3. N2O Emission Rate Calculations
N2O Emission Factor FN2O 6.0E-04 kg/MMBtu 40 CFR 98 Subpart Y
N2O Annual Emission Rate = 1 TPY= CO2 TPY * FN2O / FCO2
Equation Y-5
4. CH4 Emission Rate Calculations
CH4 Emission Factor FCH4 3.0E-03 kg/MMBtu 40 CFR 98 Subpart Y
Wt. fraction of carbon in fuel gas from CH4 fCH4 7.42E-05 Calculated from representative stream speciation
CH4 Annual Emission Rate = 1 TPY= (CO2 TPY * FCH4 / FCO2) + (CO2 TPY * CF * MWCH4/MWCO2 * fCH4)Equation Y-4
5. CO2e Emission Rate Calculations
CO2 CO2e Factor FeCO2 1 tonCO2/tonCO2e 40 CFR 98, Table A-1
N2O CO2e Factor FeN2O 310 tonN2O/tonCO2e 40 CFR 98, Table A-1
CH4 CO2e Factor FeCH4 21 tonCH4/tonCO2e 40 CFR 98, Table A-1
CO2e Annual Emission Rate = 3,939 TPY = Σ (TPY * Fex)
Note(s): The operational parameters are estimated variables that result in the worst case maximum allowable emission rates.
Sage Environmental Consulting, L.P.Revised - March 2013 1 of 1
MBPP GHG Calcs_March 2013Elevated Flare Submittal

ExxonMobil Chemical CompanyMont Belvieu Plastics Plant
Pilot Gas to the Elevated FlareGreenhouse Gas Emissions Calculations
Parameter Name & Variable Value & Units Basis/Calculation/Notes1. General Values and Calculations
Standard Molar Volume VMS 385 scf/lb-mol Based on ideal gas law
Total Flare Natural Gas Volume Flow QV 333 scf/hr Design rate
Avg. Molecular Weight of Pilot Gas MV 17.0 lb/lb-mol Calculated from representative stream speciation
Avg. Carbon Content of Pilot Gas CCgas 0.73 lbC/lbgas Calculated from representative stream speciation
CO2 Emission Factor FCO2 60 kg/MMBtu 40 CFR 98 Subpart Y
Flare Efficiency Eff 98% Based on process knowledge
Flare Efficiency Correction Factor CF 0.02 Calculated based on 40 CFR 98 Subpart Y
Annual Period of Pilot Gas Flaring t 8,760 hr/yr Based on expected normal firing hours
2. CO2 Emission Rate Calculations
CO2 Annual Emission Rate = 169 TPY= Eff * MWCO2 / MWC * QV * t * MV / VMS * CCgas / 2000 lb/tonEquation Y-1a
3. N2O Emission Rate Calculations
N2O Emission Factor FN2O 1.0E-04 kg/MMBtu 40 CFR 98 Subpart Y
N2O Annual Emission Rate = 1 TPY= CO2 TPY * FN2O / FCO2
Equation Y-5
4. CH4 Emission Rate Calculations
CH4 Emission Factor FCH4 1.0E-03 kg/MMBtu 40 CFR 98 Subpart Y
Wt. fraction of carbon in fuel gas from CH4 fCH4 0.93 Calculated from representative stream speciation
CH4 Annual Emission Rate = 2 TPY= (CO2 TPY * FCH4 / FCO2) + (CO2 TPY * CF * MWCH4/MWCO2 * fCH4)Equation Y-4
5. CO2e Emission Rate Calculations
CO2 CO2e Factor FeCO2 1 tonCO2/tonCO2e 40 CFR 98, Table A-1
N2O CO2e Factor FeN2O 310 tonN2O/tonCO2e 40 CFR 98, Table A-1
CH4 CO2e Factor FeCH4 21 tonCH4/tonCO2e 40 CFR 98, Table A-1
CO2e Annual Emission Rate = 521 TPY = Σ (TPY * Fex)
Note(s): The operational parameters are estimated variables that result in the worst case maximum allowable emission rates.
Sage Environmental Consulting, L.P.Revised - November 2012 1 of 1
MBPP GHG Calcs_March 2013Elevated Flare Pilot Submittal

ExxonMobil Chemical CompanyMont Belvieu Plastics Plant
Total Multi-Point Ground FlareGreenhouse Gas Emissions Summary
Parameter Name & Variable Value & Units Basis/Calculation/Notes1. CO2 Emission Rate Calculations
CO2 Flaring Annual Emission Rate = 5,610 TPY
CO2 Pilot Gas Annual Emission Rate = 1,564 TPY
CO2 Annual Emission Rate = 7,174 TPY Sum of annual CO2 emissions from all streams
2. N2O Emission Rate Calculations
N2O Flaring Annual Emission Rate = 1 TPY
N2O Pilot Gas Annual Emission Rate = 1 TPY
N2O Annual Emission Rate = 2 TPY Sum of annual N2O emissions from all streams
3. CH4 Emission Rate Calculations
CH4 Flaring Annual Emission Rate = 1 TPY
CH4 Pilot Gas Annual Emission Rate = 3 TPY
CH4 Annual Emission Rate = 4 TPY Sum of annual CH4 emissions from all streams
4. CO2e Emission Rate Calculations
CO2 CO2e Factor FeCO2 1 tonCO2/tonCO2e 40 CFR 98, Table A-1
N2O CO2e Factor FeN2O 310 tonN2O/tonCO2e 40 CFR 98, Table A-1
CH4 CO2e Factor FeCH4 21 tonCH4/tonCO2e 40 CFR 98, Table A-1
CO2e Annual Emission Rate = 7,878 TPY = Σ (TPY * Fex)
Note(s): The operational parameters are estimated variables that result in the worst case maximum allowable emission rates.
Sage Environmental Consulting, L.P.Revised - March 2013 1 of 1
MBPP GHG Calcs_March 2013Total Ground Flare Submittal

ExxonMobil Chemical CompanyMont Belvieu Plastics Plant
Vent Gas to the Multi-Point Ground FlareGreenhouse Gas Emissions Calculations
Parameter Name & Variable Value & Units Basis/Calculation/Notes1. General Values and Calculations
Standard Molar Volume VMS 385 scf/lb-mol Based on ideal gas law
Total Flare Vent Gas Volume Flow QV 38 MMscf/yr Based on expected flaring rate
Avg. Molecular Weight of Vent Gas MV 42.6 lb/lb-mol Calculated from representative stream speciation
Avg. Carbon Content of Vent Gas CCgas 0.73 lbC/lbgas Calculated from representative stream speciation
CO2 Emission Factor FCO2 60 kg/MMBtu 40 CFR 98 Subpart Y
Flare Efficiency Eff 99.5% Based on process knowledge
Flare Efficiency Correction Factor CF 0.005 Calculated based on 40 CFR 98 Subpart Y
2. CO2 Emission Rate Calculations
CO2 Annual Emission Rate = 5,610 TPY = Eff * MWCO2 / MWC * QV * 106 * MV / VMS * CCgas / 2000 lb/tonEquation Y-1a
3. N2O Emission Rate Calculations
N2O Emission Factor FN2O 6.0E-04 kg/MMBtu 40 CFR 98 Subpart Y
N2O Annual Emission Rate = 1 TPY= CO2 TPY * FN2O / FCO2
Equation Y-5
4. CH4 Emission Rate Calculations
CH4 Emission Factor FCH4 3.0E-03 kg/MMBtu 40 CFR 98 Subpart Y
Wt. fraction of carbon in fuel gas from CH4 fCH4 0 Calculated from representative stream speciation
CH4 Annual Emission Rate = 1 TPY= (CO2 TPY * FCH4 / FCO2) + (CO2 TPY * CF * MWCH4/MWCO2 * fCH4)Equation Y-4
5. CO2e Emission Rate Calculations
CO2 CO2e Factor FeCO2 1 tonCO2/tonCO2e 40 CFR 98, Table A-1
N2O CO2e Factor FeN2O 310 tonN2O/tonCO2e 40 CFR 98, Table A-1
CH4 CO2e Factor FeCH4 21 tonCH4/tonCO2e 40 CFR 98, Table A-1
CO2e Annual Emission Rate = 5,941 TPY = Σ (TPY * Fex)
Note(s): The operational parameters are estimated variables that result in the worst case maximum allowable emission rates.
Sage Environmental Consulting, L.P.Revised - March 2013 1 of 1
MBPP GHG Calcs_March 2013Ground Flare Submittal

ExxonMobil Chemical CompanyMont Belvieu Plastics Plant
Pilot Gas to the Multi-Point Ground FlareGreenhouse Gas Emissions Calculations
Parameter Name & Variable Value & Units Basis/Calculation/Notes1. General Values and Calculations
Standard Molar Volume VMS 385 scf/lb-mol Based on ideal gas law
Total Flare Natural Gas Volume Flow QV 3,041 scf/hr Design rate
Avg. Molecular Weight of Pilot Gas MV 17.0 lb/lb-mol Calculated from representative stream speciation
Avg. Carbon Content of Pilot Gas CCgas 0.73 lbC/lbgas Calculated from representative stream speciation
CO2 Emission Factor FCO2 60 kg/MMBtu 40 CFR 98 Subpart Y
Flare Efficiency Eff 99.5% Based on process knowledge
Flare Efficiency Correction Factor CF 0.005 Calculated based on 40 CFR 98 Subpart Y
Annual Period of Pilot Gas Flaring t 8,760 hr/yr Based on expected normal firing hours
2. CO2 Emission Rate Calculations
CO2 Annual Emission Rate = 1,564 TPY= Eff * MWCO2 / MWC * QV * t * MV / VMS * CCgas / 2000 lb/tonEquation Y-1a
3. N2O Emission Rate Calculations
N2O Emission Factor FN2O 1.0E-04 kg/MMBtu 40 CFR 98 Subpart Y
N2O Annual Emission Rate = 1 TPY= CO2 TPY * FN2O / FCO2
Equation Y-5
4. CH4 Emission Rate Calculations
CH4 Emission Factor FCH4 1.0E-03 kg/MMBtu 40 CFR 98 Subpart Y
Wt. fraction of carbon in fuel gas from CH4 fCH4 0.93 Calculated from representative stream speciation
CH4 Annual Emission Rate = 3 TPY= (CO2 TPY * FCH4 / FCO2) + (CO2 TPY * CF * MWCH4/MWCO2 * fCH4)Equation Y-4
5. CO2e Emission Rate Calculations
CO2 CO2e Factor FeCO2 1 tonCO2/tonCO2e 40 CFR 98, Table A-1
N2O CO2e Factor FeN2O 310 tonN2O/tonCO2e 40 CFR 98, Table A-1
CH4 CO2e Factor FeCH4 21 tonCH4/tonCO2e 40 CFR 98, Table A-1
CO2e Annual Emission Rate = 1,937 TPY = Σ (TPY * Fex)
Note(s): The operational parameters are estimated variables that result in the worst case maximum allowable emission rates.
Sage Environmental Consulting, L.P.Revised - March 2013 1 of 1
MBPP GHG Calcs_March 2013Ground Flare Pilot Submittal

ExxonMobil Chemical CompanyMont Belvieu Plastics Plant
Boiler FiringGreenhouse Gas Emissions Calculations
Parameter Name & Variable Value & Units Basis/Calculation/Notes1. General Values and Calculations
Standard Molar Volume VMS 385 scf/lb-mol Based on ideal gas law
Avg. Heat Value of Fuel Gas HVAVG 1,006 Btu/scf Calculated from representative stream speciation
Total Fuel Gas Heat Input to Boilers H 520,344 MMBtu/yr Based on expected firing rate
Total Boilers Fuel Gas Volume Flow QV 517 MMscf/yr Based on expected firing rate
Avg. Molecular Weight of Fuel Gas MV 17.0 lb/lb-mol Calculated from representative stream speciation
Carbon Content of Fuel Gas Fcc 0.727 lbC/lbGas Calculated from representative stream speciation
2. CO2 Emission Rate Calculations
CO2 Annual Emission Rate = 30,512 TPY= MWCO2/MWCarbon * QV * FCC * MV / VMS / 2000 lb/tonEquation C-5
3. N2O Emission Rate Calculations
N2O Emission Factor FN2O 6.0E-04 kg/MMBtu 40 CFR 98, Table C-2
N2O Annual Emission Rate = 1 TPY= H * FN2O * 2.205 lb/kg / 2000 lb/tonEquation C-8b
4. CH4 Emission Rate Calculations
CH4 Emission Factor FCH4 3.0E-03 kg/MMBtu 40 CFR 98, Table C-2
CH4 Annual Emission Rate = 2 TPY= H * FCH4 * 2.205 lb/kg / 2000 lb/tonEquation C-8b
5. CO2e Emission Rate Calculations
CO2 CO2e Factor FeCO2 1 tonCO2/tonCO2e 40 CFR 98, Table A-1
N2O CO2e Factor FeN2O 310 tonN2O/tonCO2e 40 CFR 98, Table A-1
CH4 CO2e Factor FeCH4 21 tonCH4/tonCO2e 40 CFR 98, Table A-1
CO2e Annual Emission Rate = 30,864 TPY = Σ (TPY * Fex)
Note(s): The operational parameters are estimated variables that result in the worst case maximum allowable emission rates.
Sage Environmental Consulting, L.P.Revised - March 2013 1 of 1
MBPP GHG Calcs_March 2013Boilers Submittal

ExxonMobil Chemical CompanyMont Belvieu Plastics PlantEstimated Fugitive Sources
Greenhouse Gas Emissions Calculations
1. General Values and Calculations
Annual Period of Usage t 8,760 hr/yr
2. CO2 Emission Rate Calculations
CO2 Annual Emission Rate = 2 TPY
3. CH4 Emission Rate Calculations
CH4 Annual Emission Rate = 17 TPY
4. CO2e Emission Rate Calculations
CO2 CO2e Factor FeCO2 1 tonCO2/tonCO2e 40 CFR 98, Table A-1
CH4 CO2e Factor FeCH4 21 tonCH4/tonCO2e 40 CFR 98, Table A-1
CO2e Annual Emission Rate = 359 TPY = Σ (TPY * Fex)
Emission FactorsCH4 Control
EfficiencyCO2 Control
EfficiencyCH4
EmissionsCO2
Emissions(lb/hr-count) (%) (%) (tpy) (tpy)
Gas/Vapor with Ethylene 0 0.0258 97 0 0.00 0.00w/o Ethylene 443 0.0089 97 0 0.52 0.00
Average 0 0.0132 97 0 0.00 0.00LL with Ethylene 0 0.0459 97 0 0.00 0.00
w/o Ethylene 0 0.0035 97 0 0.00 0.00Average 0 0.0089 97 0 0.00 0.00
HL w/o Ethylene - 0.0007 0 0 - -Gas/Vapor with Ethylene 0 0.0053 30 0 0.00 0.00
w/o Ethylene 1798 0.0029 30 0 15.99 1.02Average 0 0.0039 30 0 0.00 0.00
LL with Ethylene 0 0.0052 30 0 0.00 0.00w/o Ethylene 0 0.0005 30 0 0.00 0.00
Average 0 0.0005 30 0 0.00 0.00HL w/o Ethylene - 0.00007 30 0 - -LL with Ethylene 0 0.1440 100 0 0.00 0.00
w/o Ethylene 0 0.0386 100 0 0.00 0.00Average 0 0.0439 100 0 0.00 0.00
HL with Ethylene - 0.0046 100 0 - -w/o Ethylene - 0.0161 100 0 - -
Average - 0.0190 100 0 - -LL w/o Ethylene 0 0.0386 100 0 0.00 0.00All All 0 0.5027 100 0 0.00 0.00All All 5 0.2293 100 0 0.09 0.09All with Ethylene - 0.0075 97 0 - -
w/o Ethylene - 0.0040 97 0 - -Average - 0.0038 97 0 - -
All All 0 0.0330 97 0 0.00 0.002246 16.60 1.11
Relief Valve 0Open-ended Lines -
Totals 80
--
Sampling Connections 0
-Agitator 0
Compressor Seals 0
0--
-Pump Seals 0
0
000
Non-Insulated Flanges 0800
00-
= lb/hr rate * t / 2,000 lb/ton
00
Note(s): The operational parameters are estimated variables that result in the worst case maximum allowable emission rates.
Parameter Name & Variable Value & Units Basis/Calculation/Notes
Based on expected operating hours
= lb/hr rate * t / 2,000 lb/ton
Valve 00
Component Name Stream TypeCH4
Component Count
CO2
Component Count
Sage Environmental Consulting, L.P.Revised - November 2012 1 of 1
MBPP GHG Calcs_March 2013Fugitive Submittal

ExxonMobil Chemical CompanyMont Belvieu Plastics Plant
AnalyzersGreenhouse Gas Emissions Calculations
Parameter Name & Variable Value & Units Basis/Calculation/Notes1. General Values and Calculations
Vent Flow Rate FV 0.012 ft3/min Based on process knowledge
No. of Analyzers A 35
Vapor Density dV 0.08 lb/ft3 Based on ideal gas law
Total Analyzer Gas Volume Flow QV 2.02 lb/hr = FV * A * dV * 60 min/hr
Molecular Weight of Gas MV 28 lb/lbmol Based on process knowledge
Destruction Efficiency of Analyzers DRE 98% Based on process knowledge
Annual Period of Operation t 8,760 hr/yr Based on expected operating hours
2. CO2 Emission Rate Calculations
CO2 Annual Emission Rate = 28 TPY= QV /MV * DRE * 2 * MWCO2 * t / 2000 lb/ton; conservatively assumes gas is 100% VOC, and all VOC = ethylene
3. CO2e Emission Rate Calculations
CO2 CO2e Factor FeCO2 1 tonCO2/tonCO2e 40 CFR 98, Table A-1
CO2e Annual Emission Rate = 28 TPY = Σ (TPY * Fex)
Note(s): The operational parameters are estimated variables that result in the worst case maximum allowable emission rates.
Sage Environmental Consulting, L.P.Revised - March 2013 1 of 1
MBPP GHG Calcs_March 2013Analyzers Submittal

ExxonMobil Chemical CompanyMont Belvieu Plastics Plant
Hexene TankGreenhouse Gas Emissions Calculations
1. General Values and Calculations
Annual Throughput Rate AEm 55,000,000 gal/yr Estimate based on process knowledge
2. CO2 Emission Rate Calculations
CO2 Vapor Space Concentration CONCCO2 0 ppmv Calculated based on site-specific speciation
CO2 Annual Emission Rate = 0 TPY = AEm * CONCCO2 / 106 / 2000 lb/ton
3. N2O Emission Rate Calculations
N2O Vapor Space Concentration CONCN2O 0 ppmv Calculated based on site-specific speciation
N2O Annual Emission Rate = 0 TPY = AEm * 106 * CONCN2O / 106 / 2000 lb/ton
3. CH4 Emission Rate Calculations
CH4 Vapor Space Concentration CONCCH4 0 ppmv Calculated based on site-specific speciation
CH4 Annual Emission Rate = 0 TPY = AEm * 106 * CONCCH4 / 106 / 2000 lb/ton
4. CO2e Emission Rate Calculations
CO2 CO2e Factor FeCO2 1 tonCO2/tonCO2e 40 CFR 98, Table A-1
N2O CO2e Factor FeN2O 310 tonN2O/tonCO2e 40 CFR 98, Table A-1
CH4 CO2e Factor FeCH4 21 tonCH4/tonCO2e 40 CFR 98, Table A-1
CO2e Annual Emission Rate = 0 TPY = Σ (TPY * Fex)
Parameter Name & Variable Value & Units Calculation Notes
Note(s): The values represented in this table are estimates only and are not values upon which compliance shall be based.
Sage Environmental Consulting, L.P.New - March 2013 1 of 1
MBPP GHG Calcs_March 2013Tab: Hexene Tank Submittal
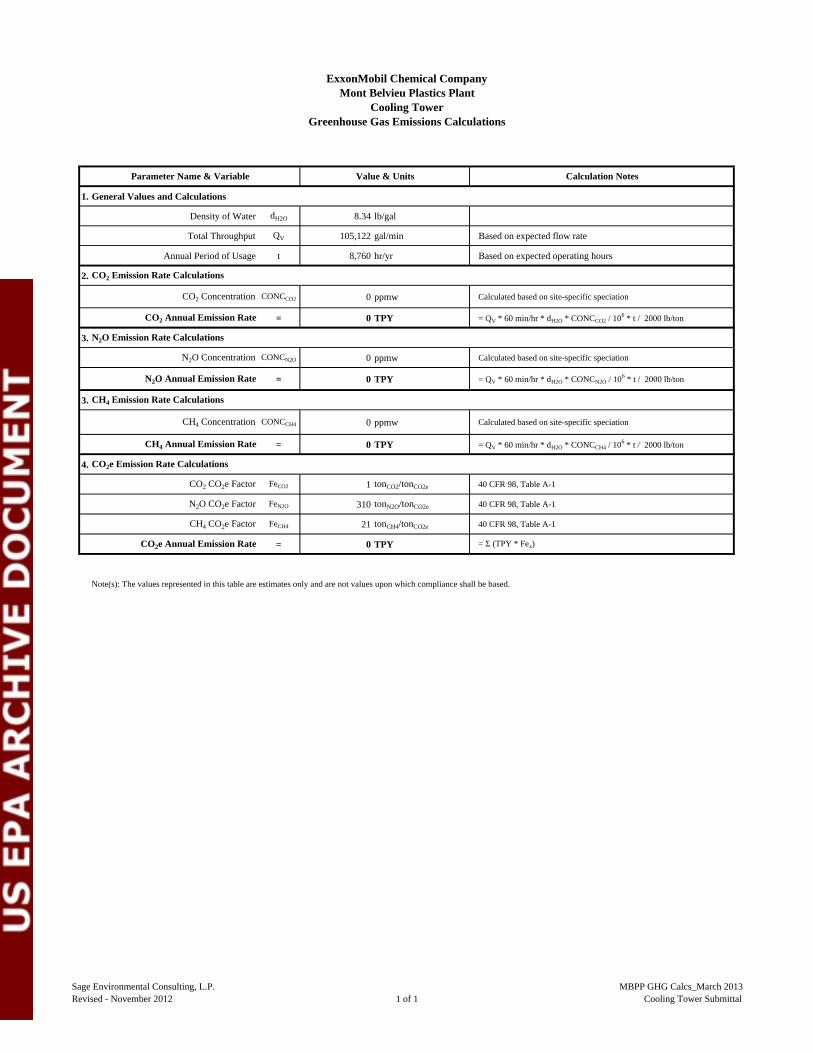
ExxonMobil Chemical CompanyMont Belvieu Plastics Plant
Cooling TowerGreenhouse Gas Emissions Calculations
1. General Values and Calculations
Density of Water dH2O 8.34 lb/gal
Total Throughput QV 105,122 gal/min Based on expected flow rate
Annual Period of Usage t 8,760 hr/yr Based on expected operating hours
2. CO2 Emission Rate Calculations
CO2 Concentration CONCCO2 0 ppmw Calculated based on site-specific speciation
CO2 Annual Emission Rate = 0 TPY = QV * 60 min/hr * dH2O * CONCCO2 / 106 * t / 2000 lb/ton
3. N2O Emission Rate Calculations
N2O Concentration CONCN2O 0 ppmw Calculated based on site-specific speciation
N2O Annual Emission Rate = 0 TPY = QV * 60 min/hr * dH2O * CONCN2O / 106 * t / 2000 lb/ton
3. CH4 Emission Rate Calculations
CH4 Concentration CONCCH4 0 ppmw Calculated based on site-specific speciation
CH4 Annual Emission Rate = 0 TPY = QV * 60 min/hr * dH2O * CONCCH4 / 106 * t / 2000 lb/ton
4. CO2e Emission Rate Calculations
CO2 CO2e Factor FeCO2 1 tonCO2/tonCO2e 40 CFR 98, Table A-1
N2O CO2e Factor FeN2O 310 tonN2O/tonCO2e 40 CFR 98, Table A-1
CH4 CO2e Factor FeCH4 21 tonCH4/tonCO2e 40 CFR 98, Table A-1
CO2e Annual Emission Rate = 0 TPY = Σ (TPY * Fex)
Note(s): The values represented in this table are estimates only and are not values upon which compliance shall be based.
Parameter Name & Variable Value & Units Calculation Notes
Sage Environmental Consulting, L.P.Revised - November 2012 1 of 1
MBPP GHG Calcs_March 2013Cooling Tower Submittal

ExxonMobil Chemical CompanyMont Belvieu Plastics Plant
Oil Water SeparatorGreenhouse Gas Emissions Calculations
1. General Values and Calculations
Density of Water dH2O 8.34 lb/gal
Total Throughput QV 5 gal/min Based on expected flow rate
Annual Period of Usage t 8,760 hr/yr Based on expected operating hours
2. CO2 Emission Rate Calculations
CO2 Concentration CONCCO2 0 ppmw Calculated based on site-specific speciation
CO2 Annual Emission Rate = 0 TPY = QV * 60 min/hr * dH2O * CONCCO2 / 106 * t / 2000 lb/ton
3. N2O Emission Rate Calculations
N2O Concentration CONCN2O 0 ppmw Calculated based on site-specific speciation
N2O Annual Emission Rate = 0 TPY = QV * 60 min/hr * dH2O * CONCN2O / 106 * t / 2000 lb/ton
3. CH4 Emission Rate Calculations
CH4 Concentration CONCCH4 0 ppmw Calculated based on site-specific speciation
CH4 Annual Emission Rate = 0 TPY = QV * 60 min/hr * dH2O * CONCCH4 / 106 * t / 2000 lb/ton
4. CO2e Emission Rate Calculations
CO2 CO2e Factor FeCO2 1 tonCO2/tonCO2e 40 CFR 98, Table A-1
N2O CO2e Factor FeN2O 310 tonN2O/tonCO2e 40 CFR 98, Table A-1
CH4 CO2e Factor FeCH4 21 tonCH4/tonCO2e 40 CFR 98, Table A-1
CO2e Annual Emission Rate = 0 TPY = Σ (TPY * Fex)
Parameter Name & Variable Value & Units Calculation Notes
Note(s): The values represented in this table are estimates only and are not values upon which compliance shall be based.
Sage Environmental Consulting, L.P.Revised - November 2012 1 of 1
MBPP GHG Calcs_March 2013Wastewater Submittal

ExxonMobil Chemical CompanyMont Belvieu Plastics Plant
Miscellaneous VentsGreenhouse Gas Emissions Calculations
1. General Values and Calculations
Process Flow Rate (Convey Air) Q 41,000 MMscf/yr Based on 60 miscellaneous vents from Additive System, Catalyst Manufacturing, and Pellet Sources.
2. CO2 Emission Rate Calculations
CO2 Vapor Space Concentration CONCCO2 0 ppmv Calculated based on site-specific speciation
CO2 Annual Emission Rate = 0 TPY = AEm * CONCCO2 / 106 / 2000 lb/ton
3. N2O Emission Rate Calculations
N2O Vapor Space Concentration CONCN2O 0 ppmv Calculated based on site-specific speciation
N2O Annual Emission Rate = 0 TPY = AEm * 106 * CONCN2O / 106 / 2000 lb/ton
3. CH4 Emission Rate Calculations
CH4 Vapor Space Concentration CONCCH4 0 ppmv Calculated based on site-specific speciation
CH4 Annual Emission Rate = 0 TPY = AEm * 106 * CONCCH4 / 106 / 2000 lb/ton
4. CO2e Emission Rate Calculations
CO2 CO2e Factor FeCO2 1 tonCO2/tonCO2e 40 CFR 98, Table A-1
N2O CO2e Factor FeN2O 310 tonN2O/tonCO2e 40 CFR 98, Table A-1
CH4 CO2e Factor FeCH4 21 tonCH4/tonCO2e 40 CFR 98, Table A-1
CO2e Annual Emission Rate = 0 TPY = Σ (TPY * Fex)
Parameter Name & Variable Value & Units Calculation Notes
Note(s): The values represented in this table are estimates only and are not values upon which compliance shall be based.
Sage Environmental Consulting, L.P.New - March 2013 1 of 1
MBPP GHG Calcs_March 2013MISC Vents Submittal

Sage Environmental Consulting, L.P. B-1 Mont Belvieu Plastics Plant Revised March 2013 New Polyethylene Plant Permit Application
APPENDIX B RACT/BACT/LAER CLEARINGHOUSE

ExxonMobil Chemical CompanyMt. Belvieu Plastics Plant
Combustion Sources ‐ Greenhouse Gas PollutantsRBLC Search Results
Units Limit UnitAvg. Time Condition Limit Unit
Avg. Time Condition Limit Unit
Avg. Time Condition
LA‐0248DIRECT REDUCTION IRON PLANT LA 1/27/2011
DRI‐108 ‐ DRI Unit #1 Reformer Main Flue Stack 12168 Billion Btu/yr Carbon Dioxide
the best available technology for controlling CO2e emissions from the DRI Reformer is good combustion practices, the Acid gas separation system, and Energy integration. BACT shall be good combustion practices, which will be adhered to maintain low levels of fuel consumption by the LNB burners. 11.79
MMBTU/ TON OF DRI 0 11.79
MMBTU/ TON OF DRI
LA‐0248DIRECT REDUCTION IRON PLANT LA 1/27/2011
DRI‐208 ‐ DRI Unit #2 Reformer Main Flue Stack 12168 Billion Btu/yr Carbon Dioxide
the best available technology for controlling CO2e emissions from the DRI Reformer is good combustion practices, the Acid gas separation system, and Energy integration. BACT shall be good combustion practices, which will be adhered to maintain low levels of fuel consumption by the LNB burners. 11.79
MMBTU/ TON OF DRI 0 11.79
MMBTU/ TON OF DRI
LA‐0254NINEMILE POINT ELECTRIC GENERATING PLANT LA 8/16/2011
AUXILIARY BOILER (AUX‐1) 338 MMBTU/H Carbon Dioxide
PROPER OPERATION AND GOOD COMBUSTION PRACTICES 117
LB/ MMBTU 0 117
LB/ MMBTU
LA‐0254NINEMILE POINT ELECTRIC GENERATING PLANT LA 8/16/2011
AUXILIARY BOILER (AUX‐1) 338 MMBTU/H Methane
PROPER OPERATION AND GOOD COMBUSTION PRACTICES 0.0022
LB/ MMBTU 0 0.0022
LB/ MMBTU
LA‐0254NINEMILE POINT ELECTRIC GENERATING PLANT LA 8/16/2011
AUXILIARY BOILER (AUX‐1) 338 MMBTU/H N2O
PROPER OPERATION AND GOOD COMBUSTION PRACTICES 0.0002
LB/ MMBTU 0 0.0002
LB/ MMBTU
Throughput Standard LimitLimit 2Limit 1
Control DescriptionPollutantProcess NamePermit DateStateFacility NameRBLC ID
Sage Environmental Consulting, L.P.May 2012
1 of 1 MBPP RBLC GHG Results by Unit.xlsxTab: Boiler Results

ExxonMobil Chemical CompanyMt. Belvieu Plastics Plant
Combustion Sources ‐ Greenhouse Gas PollutantsRBLC Search Results
Units Limit UnitAvg. Time Condition Limit Unit
Avg. Time Condition Limit Unit
Avg. Time Condition
*LA‐0257 SABINE PASS LNG TERMINAL LA 12/6/2011 Marine Flare 1590 MM BTU/hr Carbon Dioxide
proper plant operations and maintain the presence of the flame when the gas is routed to the flare 2909 TONS/YR
ANNUAL MAXIMUM 0 0
*LA‐0257 SABINE PASS LNG TERMINAL LA 12/6/2011 Wet/Dry Gas Flares (4) 0.26 mm btu/hr Carbon Dioxide
proper plant operations and maintain the presence of the flame when the gas is routed to the flare 133 TONS/YR
ANNUAL MAXIMUM 0 0
OH‐0330RUMPKE SANITARY LANDFILL OH ######### CANDLESTICK FLARE (5) Methane FLARE IS CONTROL 25 LB/H 109.45 T/YR 0
OH‐0330RUMPKE SANITARY LANDFILL OH ######### OPEN FLARE Methane FLARE IS CONTROL 25 LB/H 109.45 T/YR 0
Throughput Standard LimitLimit 2Limit 1
Control DescriptionPollutantProcess NamePermit DateStateFacility NameRBLC ID
Sage Environmental Consulting, L.P.May 2012
1 of 1 MBPP RBLC GHG Results by Unit.xlsxTab: Flare Results
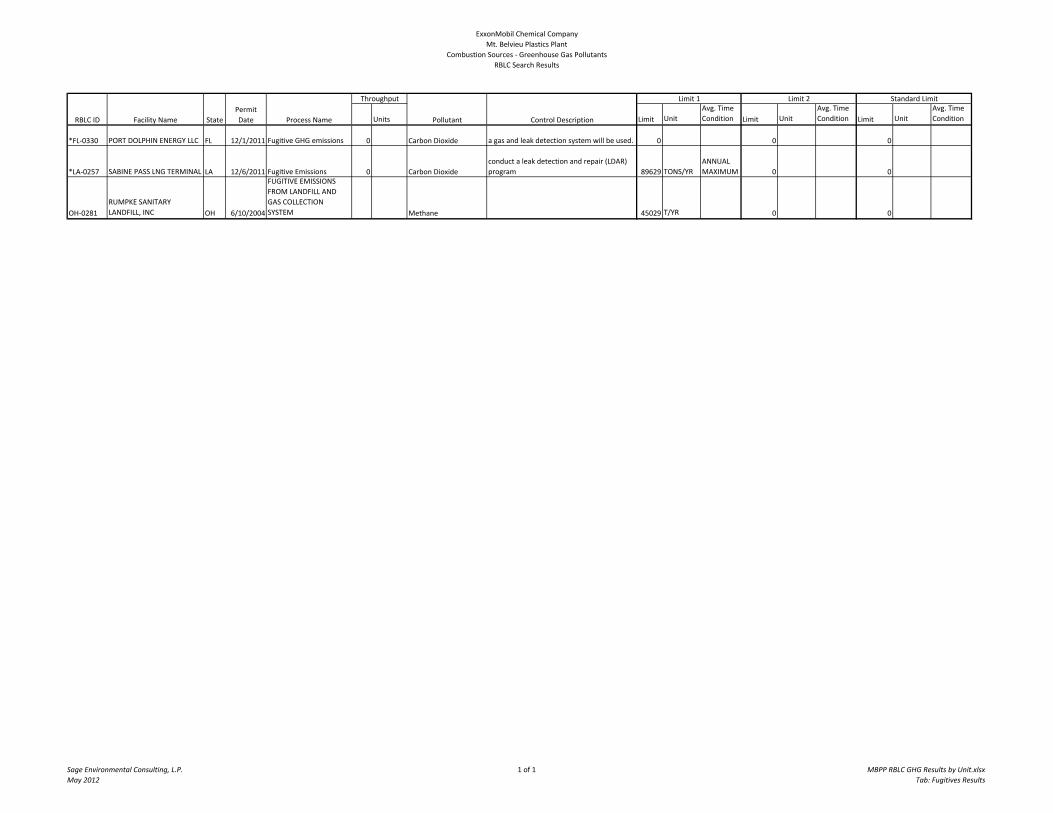
ExxonMobil Chemical CompanyMt. Belvieu Plastics Plant
Combustion Sources ‐ Greenhouse Gas PollutantsRBLC Search Results
Units Limit UnitAvg. Time Condition Limit Unit
Avg. Time Condition Limit Unit
Avg. Time Condition
*FL‐0330 PORT DOLPHIN ENERGY LLC FL 12/1/2011 Fugitive GHG emissions 0 Carbon Dioxide a gas and leak detection system will be used. 0 0 0
*LA‐0257 SABINE PASS LNG TERMINAL LA 12/6/2011 Fugitive Emissions 0 Carbon Dioxideconduct a leak detection and repair (LDAR) program 89629 TONS/YR
ANNUAL MAXIMUM 0 0
OH‐0281RUMPKE SANITARY LANDFILL, INC OH 6/10/2004
FUGITIVE EMISSIONS FROM LANDFILL AND GAS COLLECTION SYSTEM Methane 45029 T/YR 0 0
Throughput Standard LimitLimit 2Limit 1
Control DescriptionPollutantProcess NamePermit DateStateFacility NameRBLC ID
Sage Environmental Consulting, L.P.May 2012
1 of 1 MBPP RBLC GHG Results by Unit.xlsxTab: Fugitives Results

Sage Environmental Consulting, L.P. C-1 Mont Belvieu Plastics Plant Revised March 2013 New Polyethylene Plant Permit Application
APPENDIX C WORK PRACTICE STANDARDS AND OPERATIONAL
LIMITATIONS TABLE
Table C-1 Work Practice Standards and Operational Limitations Table
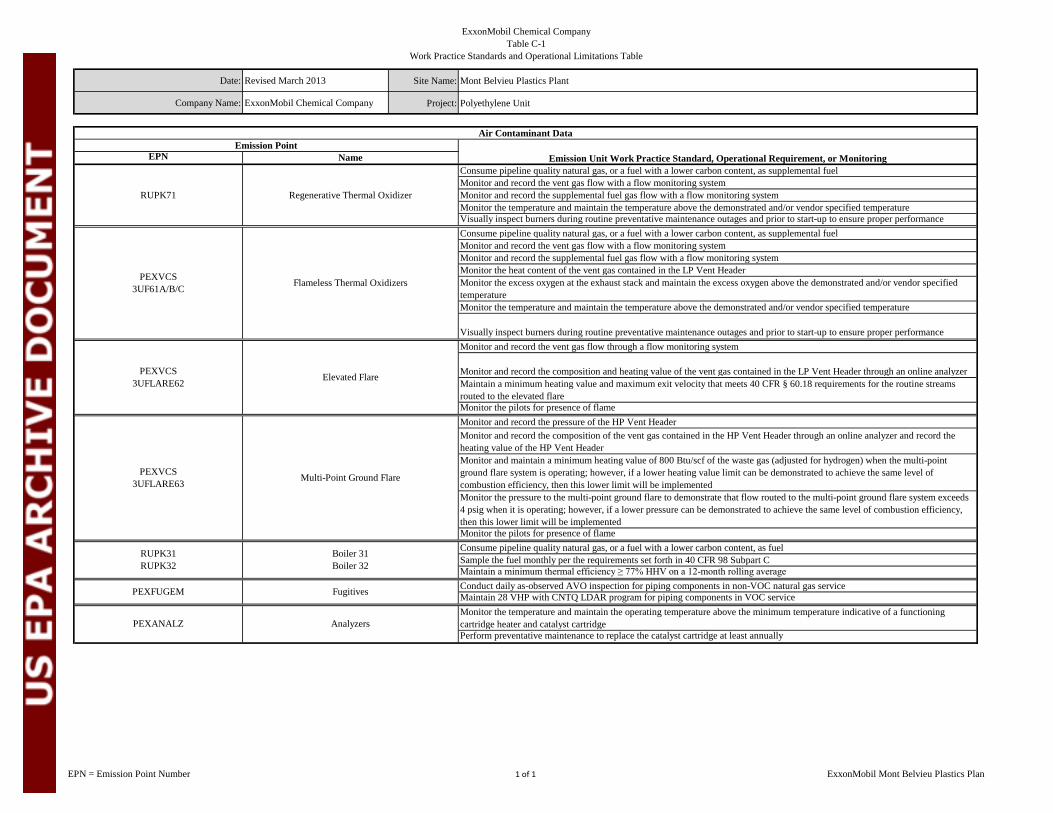
ExxonMobil Chemical CompanyTable C-1
Work Practice Standards and Operational Limitations Table
EPN = Emission Point Number 1 of 1 ExxonMobil Mont Belvieu Plastics Plan
Date: Revised March 2013 Site Name: Mont Belvieu Plastics Plant
Company Name: ExxonMobil Chemical Company Project: Polyethylene Unit
EPNConsume pipeline quality natural gas, or a fuel with a lower carbon content, as supplemental fuelMonitor and record the vent gas flow with a flow monitoring systemMonitor and record the supplemental fuel gas flow with a flow monitoring systemMonitor the temperature and maintain the temperature above the demonstrated and/or vendor specified temperatureVisually inspect burners during routine preventative maintenance outages and prior to start-up to ensure proper performanceConsume pipeline quality natural gas, or a fuel with a lower carbon content, as supplemental fuelMonitor and record the vent gas flow with a flow monitoring systemMonitor and record the supplemental fuel gas flow with a flow monitoring systemMonitor the heat content of the vent gas contained in the LP Vent Header Monitor the excess oxygen at the exhaust stack and maintain the excess oxygen above the demonstrated and/or vendor specified temperatureMonitor the temperature and maintain the temperature above the demonstrated and/or vendor specified temperature
Visually inspect burners during routine preventative maintenance outages and prior to start-up to ensure proper performanceMonitor and record the vent gas flow through a flow monitoring system
Monitor and record the composition and heating value of the vent gas contained in the LP Vent Header through an online analyzer Maintain a minimum heating value and maximum exit velocity that meets 40 CFR § 60.18 requirements for the routine streams routed to the elevated flareMonitor the pilots for presence of flameMonitor and record the pressure of the HP Vent HeaderMonitor and record the composition of the vent gas contained in the HP Vent Header through an online analyzer and record the heating value of the HP Vent HeaderMonitor and maintain a minimum heating value of 800 Btu/scf of the waste gas (adjusted for hydrogen) when the multi-point ground flare system is operating; however, if a lower heating value limit can be demonstrated to achieve the same level of combustion efficiency, then this lower limit will be implementedMonitor the pressure to the multi-point ground flare to demonstrate that flow routed to the multi-point ground flare system exceeds 4 psig when it is operating; however, if a lower pressure can be demonstrated to achieve the same level of combustion efficiency, then this lower limit will be implementedMonitor the pilots for presence of flameConsume pipeline quality natural gas, or a fuel with a lower carbon content, as fuelSample the fuel monthly per the requirements set forth in 40 CFR 98 Subpart CMaintain a minimum thermal efficiency ≥ 77% HHV on a 12-month rolling averageConduct daily as-observed AVO inspection for piping components in non-VOC natural gas serviceMaintain 28 VHP with CNTQ LDAR program for piping components in VOC serviceMonitor the temperature and maintain the operating temperature above the minimum temperature indicative of a functioning cartridge heater and catalyst cartridge Perform preventative maintenance to replace the catalyst cartridge at least annually
FugitivesPEXFUGEM
Name
Boiler 31Boiler 32
RUPK31RUPK32
AnalyzersPEXANALZ
Air Contaminant Data
PEXVCS3UFLARE63 Multi-Point Ground Flare
PEXVCS3UF61A/B/C Flameless Thermal Oxidizers
RUPK71 Regenerative Thermal Oxidizer
PEXVCS3UFLARE62 Elevated Flare
Emission Unit Work Practice Standard, Operational Requirement, or MonitoringEmission Point