
Extreme discharge events in the Parana´ River and...
13
Extreme discharge events in the Parana ´ River and their climate forcing Ine ´s A. Camilloni a, * , Vicente R. Barros b a Departamento de Ciencias de la Atmo ´sfera y los Oce ´anos, Centro de Investigaciones del Mar y la Atmo ´sfera (CIMA/CONICET-UBA), Universidad de Buenos Aires, Buenos Aires, Argentina b Departamento de Ciencias de la Atmo ´sfera y los Oce ´anos. Universidad de Buenos Aires, Consejo Nacional de Investigaciones Cientı ´ficas y Te ´cnicas (CONICET), Buenos Aires, Argentina Received 22 April 2002; accepted 21 March 2003 Abstract The largest discharge anomalies of the Parana ´ River were examined focusing on the contribution from the sub-basins and on the climate forcing of these events. Major discharge anomalies at Corrientes originated in the central and southern Upper Parana ´ basin with relatively small contributions from the Paraguay river and the northern Upper Parana ´ basin. About two thirds of the major discharge anomalies in Corrientes occurred during El Nin ˜o events while none was registered during La Nin ˜ a events. Major discharge anomalies related to El Nin ˜ o occurred either in the spring of the year of El Nin ˜ o onset or in autumn of the following year (autumn (þ )) accompanying the precipitation signal of El Nin ˜o in eastern subtropical South America. The signal during autumn (þ ) is the most relevant as five out the six top discharges of the Parana ´ River at Corrientes occurred in this season. The remaining third of the major discharges not related to El Nin ˜ o took place during the austral spring or austral summer of neutral periods. In each of these seasons, they share a common sea surface temperature anomaly pattern in the proximity of the South American coasts. q 2003 Elsevier Science B.V. All rights reserved. Keywords: Flood; El Nin ˜o; Parana ´; River discharge 1. Introduction The Parana ´ River, the most important tributary of the Rı ´o de la Plata, has a drainage basin of 2.6 £ 10 6 km 2 and contributes with more than 80% to Rı ´o de la Plata streamflow. It begins at the confluence of the Grande and Paranaı ´ba rivers and its main tributaries are the Parana ´panema, Iguazu ´, and Para- guay rivers (Fig. 1). Upstream from the confluence with the Paraguay at Corrientes, the river is known as Upper Parana ´, and from this city down to 328S as Middle Parana ´. Downstream this point, it is called Lower Parana ´. The Upper Parana ´ flows mostly in areas with steep terrain that favors runoff (Tossini 1959) while the Middle and Lower Parana ´ flows in a gently sloping plain. The last river stretch becomes a delta and Journal of Hydrology 278 (2003) 94–106 www.elsevier.com/locate/jhydrol 0022-1694/03/$ - see front matter q 2003 Elsevier Science B.V. All rights reserved. doi:10.1016/S0022-1694(03)00133-1 * Corresponding author. Ciudad Universitaria, Pabellon 2, Piso 2, (1428) Buenos Aires, Argentina, Tel.: þ 54-11-4576-3398; fax: þ 54-11-4576-3356/3364 ext.12. E-mail addresses: [email protected] (I.A. Camilloni), [email protected] (V.R. Barros).
Transcript of Extreme discharge events in the Parana´ River and...

Extreme discharge events in the Parana River and their
climate forcing
Ines A. Camillonia,*, Vicente R. Barrosb
aDepartamento de Ciencias de la Atmosfera y los Oceanos, Centro de Investigaciones del Mar y la Atmosfera (CIMA/CONICET-UBA),
Universidad de Buenos Aires, Buenos Aires, ArgentinabDepartamento de Ciencias de la Atmosfera y los Oceanos. Universidad de Buenos Aires, Consejo Nacional de Investigaciones Cientıficas y
Tecnicas (CONICET), Buenos Aires, Argentina
Received 22 April 2002; accepted 21 March 2003
Abstract
The largest discharge anomalies of the Parana River were examined focusing on the contribution from the sub-basins and on
the climate forcing of these events. Major discharge anomalies at Corrientes originated in the central and southern Upper Parana
basin with relatively small contributions from the Paraguay river and the northern Upper Parana basin.
About two thirds of the major discharge anomalies in Corrientes occurred during El Nino events while none was registered
during La Nina events. Major discharge anomalies related to El Nino occurred either in the spring of the year of El Nino onset or
in autumn of the following year (autumn (þ )) accompanying the precipitation signal of El Nino in eastern subtropical South
America. The signal during autumn (þ ) is the most relevant as five out the six top discharges of the Parana River at Corrientes
occurred in this season. The remaining third of the major discharges not related to El Nino took place during the austral spring
or austral summer of neutral periods. In each of these seasons, they share a common sea surface temperature anomaly pattern in
the proximity of the South American coasts.
q 2003 Elsevier Science B.V. All rights reserved.
Keywords: Flood; El Nino; Parana; River discharge
1. Introduction
The Parana River, the most important tributary of
the Rıo de la Plata, has a drainage basin of 2.6 £ 106
km2 and contributes with more than 80% to Rıo de la
Plata streamflow. It begins at the confluence of
the Grande and Paranaıba rivers and its main
tributaries are the Paranapanema, Iguazu, and Para-
guay rivers (Fig. 1). Upstream from the confluence
with the Paraguay at Corrientes, the river is known as
Upper Parana, and from this city down to 328S as
Middle Parana. Downstream this point, it is called
Lower Parana.
The Upper Parana flows mostly in areas with steep
terrain that favors runoff (Tossini 1959) while the
Middle and Lower Parana flows in a gently sloping
plain. The last river stretch becomes a delta and
Journal of Hydrology 278 (2003) 94–106
www.elsevier.com/locate/jhydrol
0022-1694/03/$ - see front matter q 2003 Elsevier Science B.V. All rights reserved.
doi:10.1016/S0022-1694(03)00133-1
* Corresponding author. Ciudad Universitaria, Pabellon 2, Piso 2,
(1428) Buenos Aires, Argentina, Tel.: þ 54-11-4576-3398; fax:
þ54-11-4576-3356/3364 ext.12.
E-mail addresses: [email protected] (I.A. Camilloni),
[email protected] (V.R. Barros).

together with the Uruguay River forms the Rıo de la
Plata. Large areas of land along the Middle and Lower
Parana margins are frequently subject to extended
floods, which cause considerable damage. For
instance, during the 1983 flood more than 100,000
people had to be evacuated (Anderson, 1993), with
losses that amounted more than one billion American
dollars.
The mean discharge of the Upper Parana is about
16,000 m3/s and only increases less than 1,000 m3/s
downstream from Corrientes (Secretarıa de Energıa,
1994). During the highest floods, monthly discharges
at Corrientes exceed twice, and even three times, the
mean discharge while, as shown by monthly data
(http://www.mecon.gov.ar/hidricos/mapashidricos/
mapageneral.htm), contributions from the Middle and
Lower Parana basins to extreme discharges are
relatively small. The only important exception to
this fact occurred during the 1998 autumn flood when
the Middle Parana had an important contribution due
to extraordinary rainfalls.
Literature about the Parana streamflows has
mainly dealt with the statistical analyses of
discharges, remote climate forcing, or descriptions
of individual events. For instance, Garcıa and
Vargas, (1996,1998); Genta et al., (1998) have
identified a positive trend in the Parana discharges
and its tributaries since 1976, and Robertson and
Mechoso (1998) analyzed decadal teleconnections
between sea surface temperature (SST) and the
Paraguay and Parana streamflows.
Consistent evidences of the link between the
Parana discharge and the El Nino-Southern Oscil-
lation (ENSO) have been found as well. For
example, Aceituno (1988) found a weak negative
correlation between discharges at Corrientes and
the southern oscillation index (SOI) during Novem-
ber–April, and Amarasekera et al., (1997) reported
a positive correlation between the annual discharge
at Corrientes and the equatorial Pacific SST
averaged on quarters lagging ahead of the dis-
charge year. Depetris et al., 1996 reported a
significant coherence-square between SST at the
equatorial Pacific and discharge at Corrientes in the
neighborhood of the 2.5 years period. They
reported the extraordinary magnitude of the 1982/
Fig. 1. Gauging stations and rivers, 1: Jupia, 2: Itaipu, 3: Corrientes, 4: Salto Caxias and 5: Puerto Bermejo.
I.A. Camilloni, V.R. Barros / Journal of Hydrology 278 (2003) 94–106 95

1983 flood, which coincided with the strong El
Nino event of 1982, and commented that four other
large floods also occurred in coincidence with El
Nino events. Camilloni and Barros (2000) studied
the river discharges resulting from the 1982–1983
and 1997–1998 El Nino events. Robertson et al.,
(2001) analyzed the interannual to decadal predict-
ability of the Parana River extracting near-cycling
components of the summer river streamflow. They
found that the ENSO oscillatory component was
associated to changes in the probability distribution
of monthly flows and that the decadal modulation
of ENSO may be important although the predict-
ability due to ENSO at interannual lead times is
small. Berri et al. (2002) showed that averaged
flows observed during El Nino events are always
larger than those observed during La Nina events.
More details on the variability of the Rıo de la
Plata basin climate and hydrology can be found in
a recent report of the Climate Variability Program
(CLIVAR) (Mechoso et al., 2001) and the refer-
ences therein.
Despite the aforementioned contributions, a
complete description of the highest floods and
their causes is still lacking. Therefore, this article
focuses on the contribution from the sub-basins
upstream from Corrientes to the major discharges
of the Parana, and on the possible climate forcings
of such events. Major discharges at the Middle and
Lower Parana themselves are not part of this study
due to the lack of long-term series at stations
downstream from Corrientes. However, since the
Middle and Lower Parana discharges are
mostly determined, with a certain lag, by the
Upper Parana discharge, the conclusions are also
useful for the understanding of floods in these
sectors of the river.
2. Data
The study is based on monthly discharges at
five gauging stations. This allows the estimate of
some sub-basins contributions to the Upper Parana
River discharge (Fig. 1). Table 1 shows their record
periods and average annual discharges.
Natural discharges at the Brazilian gauging
stations of Jupia, Itaipu, and Salto Caxias were
obtained from the Operador Nacional do Sistema
Eletrico (ONS). Data from the Argentine stations,
namely Corrientes and Puerto Bermejo, were taken
from the Subsecretarıa de Recursos Hıdricos
(SRH). Puerto Bermejo discharges do not require
corrections because there are no dams on the
Paraguay River. On the other hand, dams upstream
from Itaipu affect Corrientes streamflow. Compari-
son between regulated and natural monthly flows at
Itaipu indicates that the regulation upstream from
this location has ranged from 27,000 to
þ4,600 m3/s, being negative in summer and
positive in winter and spring. However, in the
case of large positive discharge anomalies, these
differences were smaller, about 5%—or even less—
of the Corrientes discharge anomalies, with only
one exception that rose close to 10%. Downstream
from Itaipu, the large dams of Itaipu and Yacireta
do not introduce important alterations in the river
flow.
Monthly rainfall series were taken from a data
set assembled by Willmott and Matsura (2001).
These data are available in a 0.500 0.58 grid for the
period 1950–1999. The relation between SST and
river discharges was studied using the monthly
SST data set GISST version 2.3b obtained from
the British Atmospheric Data Centre, 2002. The
starting and end months of El Nino and La Nina
Table 1
Gauging stations shown in Fig. 1. ONS: Operador Nacional do Sistema Eletrico, SRH: Subsecretarıa de Recursos Hıdricos
River Station Source Data period Annual mean discharge
1931–1980 (103 m3/s)
Parana Jupia ONS 1931–1998 5.9
Parana Itaipu ONS 1931–1998 9.1
Parana Corrientes SRH 1904–1998 15.9
Iguazu Salto Caxias ONS 1931–1998 1.2
Paraguay Puerto Bermejo SRH 1910–1998 3.5
I.A. Camilloni, V.R. Barros / Journal of Hydrology 278 (2003) 94–10696

events that occurred after 1950 were taken
from Trenberth (1997) and ENSO events before
1950 from Kiladis and Diaz (1989).
3. Major discharge events
Table 2 shows the largest discharge anomalies at
Corrientes calculated with respect to the 1931–1980
monthly mean. The sixteen events listed correspond to
the 1904–2000 period, and were selected based on the
criterion that their discharge anomalies were at least
three times the standard deviation of the respective
month. If two consecutive months met this require-
ment, only the one with the largest anomaly was
retained. Hereinafter, these discharge anomalies will
be referred to as the major discharge anomalies. The
magnitude of these extraordinary discharges at
Corrientes minimizes the possible impact of water
management by the upstream dams.
The cases listed in Table 2 constitute events that
were necessarily caused by considerable monthly
precipitation anomalies over a large area of the
upstream basin. Because of their size and time scale,
these precipitation anomalies could be likely linked to
a common large-scale climate forcing. To facilitate
the discussion of this aspect, Table 2 includes a
classification of the events according to the season and
the phase of ENSO.
The monthly discharge anomalies at the gauging
stations of Jupia and Puerto Bermejo represent,
respectively the northern Upper Parana, and the
Paraguay discharges. In the case of Jupia, the
discharge anomalies corresponding to the month
before the event in Corrientes were also included
due to the possibility of a zero to one-month lag in the
streamflows between these stations (Camilloni and
Barros 2000). Table 2 also shows the contribution
from the basin corresponding to the central sector of
Upper Parana and of the Iguazu rivers, calculated by
subtracting the discharges at Jupia from the sum of the
discharges at the gauging stations of Salto Caxias and
Itaipu. This basin will hereinafter be referred to as the
central Upper Parana basin. Similarly, the difference
between the Corrientes discharges and streamflows at
Itaipu, Puerto Caxias, and Puerto Bermejo represents
the contribution from the Upper Parana basin between
the confluence of the Iguazu and Paraguay rivers
with the Parana. Its respective basin will be addressed
in this paper as the southern Upper Parana basin.
Table 2
Maximum discharge anomalies at Corrientes and the corresponding discharge anomalies at Jupia and Puerto Bermejo and discharge
contribution anomalies of two sectors of the Upper Parana. Previous month discharge or contribution anomaly is indicated in brackets. Values in
103 m3/s.
Corrientes Discharge
peak date
Jupia (Northern
Upper Parana)
Central Upper
Parana contribution
Southern Upper
Parana contribution
Puerto Bermejo
(Paraguay)
Jun 1983 (Autumn-N(þ)) 38.3 8.5 (5.4) 18.1 (13.3) 6.1 5.6
Jun 1992 (Autumn-N(þ) 26.8 0.5 (2.5) 10.5 (13.3) 11.3 4.4
Dec 1982 (Spring/Summer-N(0)) 26.1 4.4 (2.3) 9.4 (9.5) 7.6 4.6
Mar 1983 (Autumn-N(þ )) 24.2 8.4 (13.2) 8.8 (3.6) 3.8 3.4
Jun 1905 (Autumn-N(þ)) 24.2 N/A (N/A) N/A (N/A) N/A N/A
May 1998 (Autumn-N(þ)) 23.0 0.4 (21.0) 9.4 (16.3) 8.6 4.6a
Oct 1998 (Spring-neutral) 21.0 0.8 (20.4) 15.2 (12.2) 1.0 4.1a
Oct 1983 (Spring-neutral) 20.5 5.9 (5.4) 6.4 (7.0) 6.0 2.2
Jul 1982 (Winter-N(0)) 18.8 2.9 (3.7) 9.2 (2.9) 3.6 3.1
Feb 1997 (Summer-neutral) 17.7 0.9 (7.4) 12.8 (22.0) 2.2 1.8
Sep 1989 (Spring-neutral) 16.7 1.0 (1.1) 8.5 (4.5) 3.8 3.4
Sep 1990 (Spring-neutral) 16.4 0.9 (0.7) 7.9 (5.2) 5.7 1.9
Jan 1912 (Summer-N(þ)) 15.9 N/A (N/A) N/A (N/A) N/A N/A
Nov 1997 (Spring-N(0)) 15.6 1.1 (0.3) 9.8 (9.2) 1.6 3.1
Jan 1966 (Summer-N(þ)) 15.4 3.3 (2.4) 2.6 (3.8) 6.5 3.0
Sep 1957 (Spring-N(0)) 15.0 1.3 (0.9) 10.3 (8.4) 1.3 2.0
a Discharge data for 1995–98 were estimated considering river level data
I.A. Camilloni, V.R. Barros / Journal of Hydrology 278 (2003) 94–106 97

Regulated discharges at Itaipu were utilized in this
latter case because dams upstream from Itaipu
regulate Corrientes discharges.
An accurate quantitative balance between the
monthly discharges at Corrientes and upstream
contributions shown in Table 2 cannot be expected
since the discharge propagation cannot be correctly
captured with one-month time resolution. In addition,
the lag time between rainfall in the different sub-
basins and the discharge response at the gauging
stations at their outlet ranges from less than a month to
one or more months (Camilloni and Barros 2000).
Therefore, Table 2 allows to assess only the bulk
magnitude from the sub-basin contributions to every
major discharge event in Corrientes.
The largest contributions to the major discharge
anomalies at Corrientes came from the central and
southern Upper Parana basins, especially from the
first one. In general, these contributions constituted
about two thirds or more of the discharge anomaly at
Corrientes. Though always positive, discharge
anomalies at Puerto Bermejo were considerably
smaller than those of the Upper Parana. Thus, the
contribution from the Paraguay River to the major
discharge anomalies at Corrientes adds to the
contribution from the Upper Parana, although in a
relatively low proportion. The only cases with
important contributions from the northern Upper
Parana occurred during the extraordinary El Nino
1982/1983 or a few months after its end. The small
contribution from the northern Upper Parana to the
major discharges at Corrientes is peculiar, considering
that this basin contributes with almost 40% of the
annual mean discharge at Corrientes, and with little
less than 50% of the Upper Parana discharge.
Since with few exceptions, the major discharge
events in Corrientes originate in the central and
southern Upper Parana basin, and especially in the
first one, Table 3 presents the major anomaly
contributions corresponding to this part of the basin
[Itaipu þ Salto Caxias 2 Jupia] for the period 1931–
1998. The table includes a classification of these
events according to the season and the phase of the
ENSO. The 18 events listed are those whose
anomalies were higher than three times the standard
deviation for the respective month. As in the case of
the Corrientes discharges, the largest anomaly was
registered in June 1983, but the rest of the events are
not equally ranked as in the Corrientes case (Tables 2
and 3). However, there is a good correspondence
between the highest discharge anomalies at Corrientes
and those shown in Table 3.
Contributions from the northern Upper Parana to
the major discharge anomalies in the central Upper
Parana are generally small—less than 25%—or even
negative, except for a few cases during 1982 and 1983
(Table 3). Actually, the correlation between the
contributions of monthly discharge anomalies from
the northern and central Upper Parana is only 0.25,
which, though significant at the 95% level, indicates a
weak relation between the precipitation variability
over these two neighboring basins.
4. Climatic forcing of the major discharge
anomalies
4.1. The annual cycle
The rainfall regime in the Upper Parana basin
changes from a pronounced annual cycle in the north
Table 3
Maximum discharge contribution anomalies of the central Upper
Parana and the corresponding discharge anomalies at Jupia and
discharge contribution anomalies at Itaipu þ Salto Caixas. Values
in 103 m3/s
Discharge peak date Central Upper
Parana
contribution
Jupia Itaipu þ
Salto Caxias
Jun 1983 (Autumn N(þ)) 18.1 8.5 26.6
Apr 1998 (Autumn N(þ )) 16.3 21.0 15.3
Oct 1998 (Spring-neutral) 15.2 0.8 16.0
May 1992 (Autumn N(þ)) 13.3 2.5 15.8
Feb 1997 (Summer-neutral) 12.8 0.9 13.7
Jan 1995 (Summer-N) 11.5 21.3 10.1
Oct 1935 (Spring- neutral) 11.2 1.4 12.6
Jan 1990 (Summer-neutral) 10.8 3.9 14.7
Sep 1957 (Spring-N (0)) 10.3 1.3 11.7
May 1987 (Autumn N(þ)) 10.2 1.4 11.6
Nov 1997 (Spring-N(0)) 9.8 1.1 10.9
Oct 1972 (Spring-N(0)) 9.6 2.6 12.2
Nov 1982 (Spring-N(0)) 9.5 2.3 11.8
Jul 1982 (Winter-N(0)) 9.2 2.9 12.1
Mar 1983 (Autumn N(þ )) 8.8 8.4 17.1
Sep 1989 (Spring- neutral) 8.5 1.0 9.5
Sep 1990 (Spring- neutral) 7.9 0.9 8.8
Oct 1993 (Spring-N(0)) 7.8 0.9 8.8
I.A. Camilloni, V.R. Barros / Journal of Hydrology 278 (2003) 94–10698

to a less defined cycle over the Iguazu, southern Upper
Parana and Lower Paraguay basins (Camilloni and
Barros 2000; Grimm et al. 2000). Over these regions,
the impact of the South Atlantic Convergence Zone
(SACZ) in summer is smaller than it is in the northern
Parana basin, and there is an important frequency of
cyclogenesis during winter and spring (Gan and Rao
1991; Rao et al., 1996). In the Pantanal, rainfall
presents a very pronounced annual cycle with a
summer maximum. However, due to the extreme
flatness of this region and the small runoff associated
thereto, the maximum in the streamflow at Puerto
Bermejo occurs with a lag of 5–8 months (Camilloni
and Barros 2000). Because of these features, the river
discharge at Corrientes has an attenuated mean annual
cycle as compared with upstream discharges, but even
so, during the 1931–1980 period, the mean discharge
ranged from 12,000 m3/s during August and Septem-
ber to around 21,000 m3/s during February and
March.
In spite of this well-marked annual cycle in the
streamflow, the frequency of occurrence of major
discharge anomalies at Corrientes was higher in
autumn and spring (Table 2). This is a consequence
of the seasonal variation of the precipitation response
to El Nino in the Parana basin (Grimm et al., 2000)
and the link between most of these anomalies and El
Nino. This was also observed in the central Upper
Parana, where only three of the 18 major contributions
to discharge anomalies correspond to the December–
February period (Table 3).
4.2. ENSO relationship
There is a clear relationship between ENSO phases
and the major discharge anomalies in the Parana
River. In Corrientes, 11 out of 16 occurred during El
Nino events (Table 2) and none of them occurred
during La Nina phase. In the case of the major
contributions from the central Upper Parana, the
proportion during El Nino phase was about the same,
namely, two thirds (Table 3). In the northern Upper
Parana, this proportion was lower, as only 6 of the 13
major discharge anomalies occurred during El Nino
phase and, as in the other two sub basins, there were
no major discharge anomalies during La Nina phase.
The hydrological response to ENSO is consistent
with the precipitation behavior, as the Upper Parana
basin is part of a region that has a strong precipitation
signal from ENSO events (Kousky et al., 1984;
Ropelewski and Halpert 1987,1996; Kiladis and Diaz,
1989). Nevertheless, the monthly and seasonal
correlation between the SOI and the Upper Parana
discharge is relatively weak (Aceituno 1988). How-
ever, the link with ENSO is more explicit in the major
discharges.
4.2.1. El Nino austral autumn
The top discharges of the Parana River at
Corrientes occurred during the austral autumn
(March–June) of the year following the onset of
El Nino event (autumn (þ )). In five of the top-six
major discharge anomalies that were simultaneous
with the El Nino events of 1904–1905, 1982–
1983, 1991–1992 and 1997–1998, El Nino SST
anomaly in El Nino 3 region (greater than 0.5 8C)
continued until May. In the other three El Nino
events of the twentieth century in which El Nino
SST anomalies continued until autumn (þ ) in El
Nino 3 region, there were also important positive
discharge anomalies at Corrientes, which occurred
in March 1926 with 10,500 m3/s; in May 1930,
with 11,600 m3/s; and in June 1987, with
10,900 m3/s. Summarizing, during the twentieth
century whenever El Nino 3 SST anomalies
remained greater than 0.5 8C until the autumn (þ )
there were always important positive discharge
anomalies at the Upper Parana outlet. Actually,
there is a quantitative relationship during autumn
(þ ) between El Nino 3 SST and Corrientes
discharge, as they have a significant (95% level)
Spearman rank correlation (0.69) (Camilloni and
Barros 2000).
The winter anomalous circulation of ENSO events
over the western Southern Hemisphere was attributed
to stationary Rossby wave propagation forced by the
anomalous equatorial warming in the Central Pacific
(Karoly 1989). An analogous wave propagation was
described by Barros and Silvestri (2002) for the
spring, and it could possibly be similar in autumn (þ ).
During this season, the anomalous circulation
increases the advection of cyclonic vorticity in the
upper troposphere and the advection of warm and
humid air at low levels, enhancing the precipitation
over the central and southern Upper Parana (Grimm
et al. 2000).
I.A. Camilloni, V.R. Barros / Journal of Hydrology 278 (2003) 94–106 99
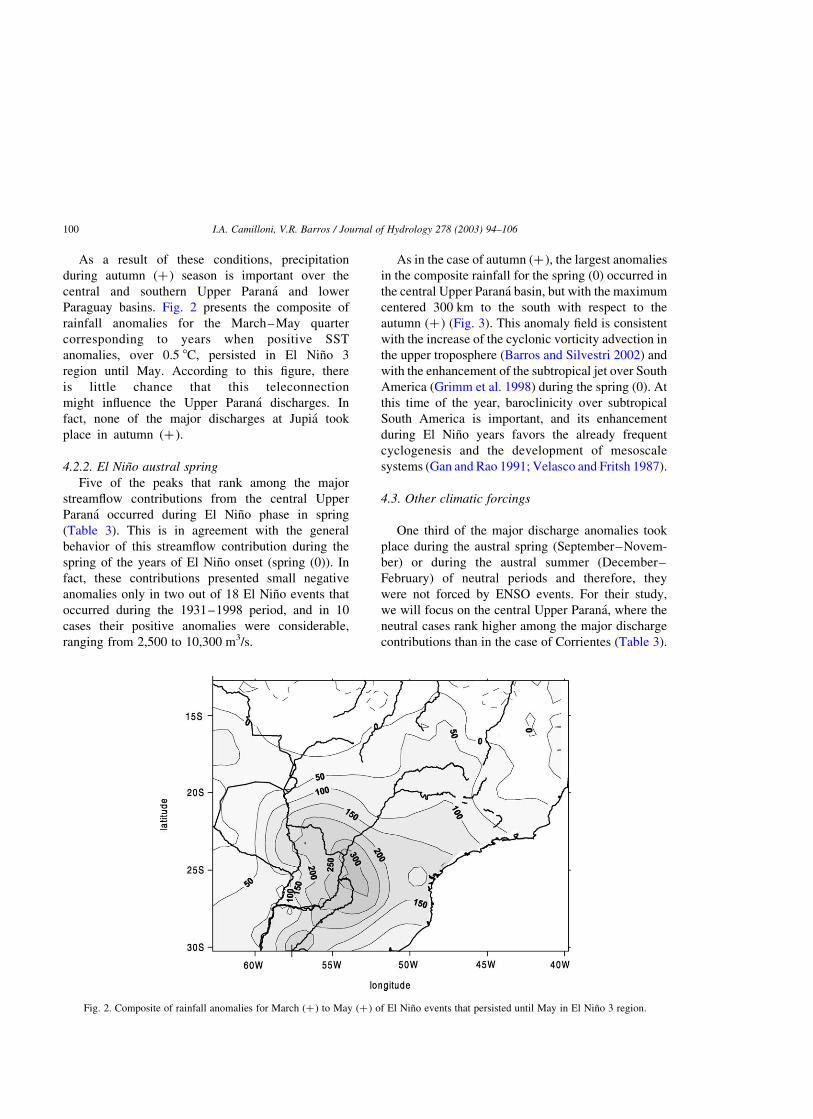
As a result of these conditions, precipitation
during autumn (þ ) season is important over the
central and southern Upper Parana and lower
Paraguay basins. Fig. 2 presents the composite of
rainfall anomalies for the March–May quarter
corresponding to years when positive SST
anomalies, over 0.5 8C, persisted in El Nino 3
region until May. According to this figure, there
is little chance that this teleconnection
might influence the Upper Parana discharges. In
fact, none of the major discharges at Jupia took
place in autumn (þ ).
4.2.2. El Nino austral spring
Five of the peaks that rank among the major
streamflow contributions from the central Upper
Parana occurred during El Nino phase in spring
(Table 3). This is in agreement with the general
behavior of this streamflow contribution during the
spring of the years of El Nino onset (spring (0)). In
fact, these contributions presented small negative
anomalies only in two out of 18 El Nino events that
occurred during the 1931–1998 period, and in 10
cases their positive anomalies were considerable,
ranging from 2,500 to 10,300 m3/s.
As in the case of autumn (þ ), the largest anomalies
in the composite rainfall for the spring (0) occurred in
the central Upper Parana basin, but with the maximum
centered 300 km to the south with respect to the
autumn (þ ) (Fig. 3). This anomaly field is consistent
with the increase of the cyclonic vorticity advection in
the upper troposphere (Barros and Silvestri 2002) and
with the enhancement of the subtropical jet over South
America (Grimm et al. 1998) during the spring (0). At
this time of the year, baroclinicity over subtropical
South America is important, and its enhancement
during El Nino years favors the already frequent
cyclogenesis and the development of mesoscale
systems (Gan and Rao 1991; Velasco and Fritsh 1987).
4.3. Other climatic forcings
One third of the major discharge anomalies took
place during the austral spring (September–Novem-
ber) or during the austral summer (December–
February) of neutral periods and therefore, they
were not forced by ENSO events. For their study,
we will focus on the central Upper Parana, where the
neutral cases rank higher among the major discharge
contributions than in the case of Corrientes (Table 3).
Fig. 2. Composite of rainfall anomalies for March (þ) to May (þ) of El Nino events that persisted until May in El Nino 3 region.
I.A. Camilloni, V.R. Barros / Journal of Hydrology 278 (2003) 94–106100

4.3.1. Neutral austral summer
The discharge contribution of the central Upper
Parana is significantly correlated at a 90% level with
January–February SST over most of the subtropical
South Atlantic (Fig. 4). This is particularly true west
of 208W, a region where SST is related to low-level
circulation and precipitation over subtropical South
America during midsummer (Doyle and Barros 2002).
Another area of significant positive correlation is that
of El Nino 1 þ 2. However, there is no significant
correlation with SST in the rest of El Nino regions,
what is consistent with the lack of ENSO signal during
midsummer. Actually, while precipitation has a strong
ENSO signal in eastern subtropical South America
during spring (0) and autumn (þ ), this signal vanishes
during January–February (Grimm et al., 2000).
In view of the lack of El Nino signal in the
midsummer precipitation in subtropical South Amer-
ica, other climate forcing could have caused the peak
discharge of January 1995 (El Nino month). Therefore,
this case is discussed together with the two neutral
cases. Actually, SST anomalies in the three summers
Fig. 3. As in Fig. 2, but for September to November of El Nino (0) years.
Fig. 4. January–February field of the linear correlation between the central Upper Parana discharge and SST. Significant correlation coefficients
at the 90% level are shaded.
I.A. Camilloni, V.R. Barros / Journal of Hydrology 278 (2003) 94–106 101

with major discharge contributions in the central
Upper Parana share common features. They have
positive anomalies along the Pacific coast of South
America from the Equator to 308S, as well as in the
subtropical Atlantic west of 208W. These features are
consistent with the correlation pattern shown in Fig. 4.
4.3.2. Neutral austral spring
When only neutral springs are considered, the
discharge contribution from the central Upper Parana
is negatively and significantly correlated at a 90%
level with September – October SSTs in both
oceans near the coasts of South America, south of
208S (Fig. 5). Over the eastern tropical Pacific,
positive significant correlations predominate to the
south of the Equator.
The SST anomalies corresponding to the four
neutral spring cases of the major discharge contri-
bution in the central Upper Parana are shown in Fig. 6.
October 1935 and September 1990 present cold
anomalies off the coast of South America in both
oceans, in accordance with the correlation pattern (Fig
6a and c). In the case of September 1989, the pattern
in these regions is similar, although the anomalies are
Fig. 5. As in Fig. 4, but for September-October of neutral years.
Fig. 6. SST anomalies for (a) October 1935, (b) September 1989, (c) September 1990 and (d) October 1998.
I.A. Camilloni, V.R. Barros / Journal of Hydrology 278 (2003) 94–106102

smaller (Fig 6b). Thus, these features, which accord-
ing to the correlation pattern (Fig. 5) favor positive
discharge anomalies, were observed during the
months of the neutral spring cases of major anomalies
in the central Upper Parana contribution. The anomaly
pattern over the eastern tropical and subtropical
Pacific of October 1998 (Fig. 6d) was consistent
with the correlation pattern that indicates that warm
anomalies in the tropical eastern Pacific south of the
equator are predominantly associated with greater
than normal precipitation over the Upper Parana
basin.
5. The extraordinary 1982–1983 event
The impact of the strong El Nino 1982–1983 event
in the Parana streamflow was the greatest recorded.
The river anomaly discharge in Corrientes exceeded
10,000 m3/s from July 1982 to December 1983
(Camilloni and Barros 2000). In that period occurred
five out of the 16 major discharge anomalies, i.e. in
July and December 1982 and in March, June and
October 1983 (Table 2). In June 1983 was registered
the largest monthly discharge of the record started in
1904. The spatial extension of this impact was also
exceptional, reaching the northern Upper Parana,
where three out of the 13 major discharges occurred
during 1982–1983 including the top one registered in
February 1983.
The peaks of March and June 1983 occurred during
the autumn (þ ) of El Nino phase. During June 1983,
the magnitude of the SST positive anomaly at El Nino
3 region was the highest of the entire record, and it
was considerably higher than the average for El Nino
events (Fig. 7). Therefore, according to the positive
Spearman rank correlation mentioned earlier, this
peak should be expected to be the highest among
autumn (þ ) discharges at Corrientes (Table 2).
The peak of December 1982 originated in Novem-
ber 1982 in the upper Middle Parana basin, but it
received contributions from the other basins, includ-
ing the central Upper Parana basin. This case fits into
the category of the spring (0) events that were
associated with large positive discharge anomalies.
Other factors must have influenced the extraordi-
nary precipitation during the austral winter of 1982,
because in other El Nino cases with greater SST
anomalies during the winter(0) the discharge response
was smaller. Considering only the months when El
Nino had already started, the rainfall anomalies during
winter (0) were considerably large and positive over
the central Upper Parana basin (Fig. 8). This feature
was also observed during the 1982 winter as can be
inferred from Table 2. On the other hand, half of El
Nino cases that took place during the 1951–1998
period had a SST positive anomaly in El Nino 3 region
during the austral winter (0) that was equal to or
greater than that observed in the 1982 event. For
instance, in the case of the 1997 event, the positive
Fig. 7. SST anomalies in El Nino 3 region for the 1982–83 event and for the average of the twentieth century El Nino events.
I.A. Camilloni, V.R. Barros / Journal of Hydrology 278 (2003) 94–106 103

anomaly in the discharge contribution from the central
Upper Parana was only of 6,300 m3/s in July,
contrasting with 9,200 m3/s in 1982, although the
respective SST at El Nino 3 region was almost 2 8C
higher than in 1982.
In the case of the October 1983 peak, the
anomalous SST at El Nino 1 þ 2 region was still
extremely high (1.5 8C) after the end of the El
Nino episode (Fig. 9). For neutral springs, the
correlation between the central Upper Parana
discharge contribution and SST at El Nino 1 þ 2
region is significant and positive (Fig. 5). However,
in October 1983, the contribution to the major
discharge at Corrientes came also from the northern
and the southern Upper Parana basin indicating
that, as in winter (0), other climatic factors could
Fig. 8. As Fig. 2, but for June to August of El Nino (0) years.
Fig. 9. As in Fig. 7, but for SST anomalies in El Nino 1 þ 2 region.
I.A. Camilloni, V.R. Barros / Journal of Hydrology 278 (2003) 94–106104
be responsible for the extreme hydrological
response of the Parana River.
Although the conjunction of different factors could
have contributed to the anomalous precipitation in the
Parana basin during the 1982–1983 period, the
exceptional magnitude of these anomalies, and particu-
larly their spatial extension and persistence before,
during, and after El Nino event could need an additional
and more comprehensive explanation.
6. Conclusions
Although the contribution from the central and
southern Upper Parana is only about 40% of the
Corrientes mean discharge, the major discharges at
Corrientes usually originated in these basins, especially
in the central Upper Parana. The contribution from the
Paraguay River enhances the Upper Parana major
discharges, but in a relatively small proportion. On the
other hand, the anomaly contribution from the northern
Upper Parana to the major discharge anomalies in
Corrientes is,notonlygenerallysmall,butalsonegative
in some cases.
There is a clear relationship between the phases of
ENSO and the major discharge anomalies in the
Upper Parana. About two thirds of the major
discharge anomalies in Corrientes and of the major
anomalous contributions from the central Upper
Parana occurred during El Nino events. In addition,
none of these major anomalies occurred during La
Nina phase. This contrasts with the weak monthly or
seasonal correlation between the SOI and discharges
at Corrientes, indicating that the major discharge
anomalies were more related to El Nino phase than the
rest of the discharge anomalies.
The major discharge anomalies in Corrientes and
major discharge contributions from the central Upper
Parana that were related to El Nino occurred either in
spring (0) or inautumn (þ ), accompanying the seasonal
variation of El Nino precipitation signal in eastern
subtropical South America. During the twentieth
century, the top discharges of the Parana River at
Corrientes occurred in the autumn (þ ). In all of these
events, SST anomalies in El Nino 3 region persisted
until May (þ ) and also, whenever El Nino 3 SST
anomalies continued until the autumn (þ ), there was an
important positive discharge anomaly in the Upper
Parana.
The remaining third of the major discharge
contributions from the Upper Parana took place
during the austral spring or the austral summer of
neutral periods. During the summer cases, there were
positive anomalies along the Pacific coast of South
America from the Equator to 308S, as well as
predominant positive anomalies in the subtropical
Atlantic west of 208W. During neutral springs, the
discharge contributions from the upper part of the
Upper Parana have significant negative correlation
with the September–October SSTs south of 208S in
the proximity of both South American coasts, as well
as significant positive correlation over the eastern
tropical Pacific. The SST patterns for the neutral
spring months with major discharge contributions
from the central Upper Parana were consistent with
this correlation pattern, both in the eastern Pacific and
near the South American continent, south of 208S.
However, as in the case of summer, there is no
indication that these SST patterns were always
accompanied by large anomalies in the discharge
contribution from the central Upper Parana. Thus,
other atmospheric features not modulated by SST may
have influence over the precipitation associated with
some of the major discharge anomalies.
The extraordinary El Nino 1982–1983 event was
accompanied by the highest monthly discharge
registered in Corrientes and by a persistent anomalous
high streamflow that went on from July 1982 to
December 1983. Although the combination of differ-
ent factors could have contributed to this long
persistence during a year and a half, the exceptional
magnitude of these anomalies and their spatial
extension require a better understanding.
Acknowledgements
The authors are grateful to the British Atmospheric
Data Centre (BADC) for providing access to the
GISST dataset. This paper was funded by the
University of Buenos Aires under its Program of
Strategic Projects and by the AIACC, a Project of the
GEF implemented by the UNEP and co-executed by
START and the TWAS.
I.A. Camilloni, V.R. Barros / Journal of Hydrology 278 (2003) 94–106 105
References
Aceituno, P., 1988. On the functioning of the Southern Oscillation
in the South American sector. Part I: Surface climate. Mon.
Wea. Rev. 116, 505–524.
Amarasekera, K.N., Lee, R.F., Williams, E.R., Eltahir, E.A.B.,
1997. ENSO and the natural variability in the flow of tropical
rivers. J. Hydrology 200, 24–39.
Anderson, R.J., Ribeiro dos Santos, N.D., Diaz, H.F., 1993. An
analysis of flooding in the Parana/Paraguay River basin.
LATEN Dissemination Note #5, World Bank
Barros, V., Silvestri, G.E., 2002. The relation between sea surface
temperature at the subtropical south-central Pacific and precipi-
tation in southeastern South America. J.Climate 15, 251–267.
Berri, G.S., Ghietto, M.A., Garcıa, N.O., 2002. The influence of
ENSO in the flows of the Upper Parana River of South America
over the past 100 years. J Hydrometeorology 3, 57–65.
British Atmospheric Data Centre, 2002. Global ocean surface
temperature (GISST) version 2.3b, British Atmospheric Data
Centre, Available with restrictions from http://www.badc.rl.ac.
uk/data/gisst/.
Camilloni, I., Barros, V., 2000. The Parana River response to El
Nino 1982–83 and 1997–98 events. J Hydrometeorology 1,
412–430.
Depetris, P.J., Kempe, S., Latif, M., Mook, W.G., 1996. ENSO-
controlled flooding in the Parana River (1904–1901). Natur-
wissenschaften 83, 127–129.
Doyle, M.E., Barros, V., 2002. Midsummer low-level circulation
and precipitation in subtropical South America and related sea
surface temperatures anomalies in the South Atlantic. J. Climate
15, 3394–3410.
Gan, M.A., Rao, V.B., 1991. Surface cyclogenesis over South
America. Mon.Wea.Rev. 119, 1293–1302.
Garcıa, N.O., Vargas, W.M., 1996. The spatial variability of runoff
and precipitation in the Rıo de la Plata basin. J. Hydro. Sci. 41,
279–299.
Garcıa, N.O., Vargas, W.M., 1998. The temporal climatic
variability in the Rıo de la Plata basin displayed by the river
discharges. Climatic Change 38, 359–379.
Genta, J.L., Perez-Iribarren, G., Mechoso, C.R., 1998. A recent
increasing trend in the streamflow of rivers in Southeastern
South America. J. Climate 11, 2858–2862.
Grimm, A.M., Barros, V., Doyle, M.E., 2000. Climate variability in
southern South America associated with El Nino and La Nina
events. J. Climate 13, 35–58.
Grimm, A.M., Ferraz, S.E.T., Gomes, J., 1998. Precipitation
anomalies in Southern Brazil associated with El Nino and La
Nina events. J. Climate 11, 2863–2880.
Karoly, D.J., 1989. Southern Hemisphere circulation features
associated with El Nino-Southern Oscillation events.
J. Climate 2, 1239–1252.
Kiladis, G.N., Diaz, H.F., 1989. Global climatic anomalies
associated with extremes in the Southern Oscillation.
J. Climate 2, 1069–1090.
Kousky, V.E., Kayano, M.T., Cavalcanti, I.F.A., 1984. A
review of the Southern Oscillation: oceanic-atmospheric
circulation change and related rainfall anomalies. Tellus
36A, 490–504.
Mechoso, C.R., Dıas, P.S., Baetghen, W., Barros, V., Berbery, E.H.,
Clarke, R., Cullen, H., Ereno, C., Grassi, B., Lettenmaier, D.,
2001. Climatology and Hydrology of the La Plata Basin.
Document of VAMOS/CLIVAR document, 55http://www.
clivar.org/organization/vamos/index.htm.
Rao, V.B., Cavalcanti, I.F.A., Hada, K., 1996. Annual variation of
rainfall over Brazil and water vapor characteristics over South
America. J. Geophys.Res. 101 (D21), 26539–26551.
Robertson, A.W., Mechoso, C.R., 1998. Interannual and decadal
cycles in river flows of southeastern South America. J. Climate
11, 2570–2581.
Robertson, A.W., Mechoso, C.R., Garcıa, N.O., 2001. Interannual
prediction of the Parana river. Geophys.Res.Lett. 28,
4235–4238.
Ropelewski, C.F., Halpert, M.S., 1987. Global and regional scale
precipitation patterns associated with El Nino/Southern Oscil-
lation. Mon. Wea. Rev. 115, 1606–1626.
Ropelewski, C.F., Halpert, M.S., 1996. Quantifying Southern
Oscillation-precipitation relationships. J. Climate 9,
1043–1059.
Secretarıa de Energıa, 1994. Estadıstica Hidrologica (Hydrological
Statistics). Secretarıa de Energıa, Buenos Aires, p. 651.
Tossini, L., 1959. Sistema hidrografico y Cuenca del Rıo de la Plata.
Contribucion al estudio de su regimen hidrologico. Anales de la
Sociedad Cientıfica Argentina, Marzo-abril 1959, III y IV,
Tomo, CLXVII., pp. 41–64, (The hydrographic system and the
La Plata River basin. A contribution to the study of its
hydrological regime. Proceedings of the Argentine Scientific
Society, Mar-Apr 1959, III and IV, Vol CLXVII, 41–64).
Trenberth, K.E., 1997. The definition of El Nino. Bull. Amer.
Meteor. Soc. 78, 2771–2777.
Velasco, I., Fritsh, J.M., 1987. Mesoscale convective complexes in
the Americas. J. Geophys. Res. 92 (D8), 9591–9613.
Willmott, C.J., Matsura, K., 2001. Terrestrial air
temperature and precipitation: monthly and annual time series
(1950–99) Version 1.02. (Available from http://climate.geog.
udel.edu/~climate/)
I.A. Camilloni, V.R. Barros / Journal of Hydrology 278 (2003) 94–106106