Extraction of Plant DNA by Microneedle Patch for Rapid ... · 1 Extraction of Plant DNA by...
35
Subscriber access provided by NORTH CAROLINA STATE UNIV is published by the American Chemical Society. 1155 Sixteenth Street N.W., Washington, DC 20036 Published by American Chemical Society. Copyright © American Chemical Society. However, no copyright claim is made to original U.S. Government works, or works produced by employees of any Commonwealth realm Crown government in the course of their duties. Article Extraction of Plant DNA by Microneedle Patch for Rapid Detection of Plant Diseases Rajesh Paul, Amanda C. Saville, Jeana C. Hansel, Yanqi Ye, Carmin Ball, Alyssa Williams, Xinyuan Chang, Guojun Chen, Zhen Gu, Jean B. Ristaino, and Qingshan Wei ACS Nano, Just Accepted Manuscript • DOI: 10.1021/acsnano.9b00193 • Publication Date (Web): 09 Jun 2019 Downloaded from http://pubs.acs.org on June 10, 2019 Just Accepted “Just Accepted” manuscripts have been peer-reviewed and accepted for publication. They are posted online prior to technical editing, formatting for publication and author proofing. The American Chemical Society provides “Just Accepted” as a service to the research community to expedite the dissemination of scientific material as soon as possible after acceptance. “Just Accepted” manuscripts appear in full in PDF format accompanied by an HTML abstract. “Just Accepted” manuscripts have been fully peer reviewed, but should not be considered the official version of record. They are citable by the Digital Object Identifier (DOI®). “Just Accepted” is an optional service offered to authors. Therefore, the “Just Accepted” Web site may not include all articles that will be published in the journal. After a manuscript is technically edited and formatted, it will be removed from the “Just Accepted” Web site and published as an ASAP article. Note that technical editing may introduce minor changes to the manuscript text and/or graphics which could affect content, and all legal disclaimers and ethical guidelines that apply to the journal pertain. ACS cannot be held responsible for errors or consequences arising from the use of information contained in these “Just Accepted” manuscripts.
Transcript of Extraction of Plant DNA by Microneedle Patch for Rapid ... · 1 Extraction of Plant DNA by...
Subscriber access provided by NORTH CAROLINA STATE UNIV
is published by the American Chemical Society. 1155 Sixteenth Street N.W.,Washington, DC 20036Published by American Chemical Society. Copyright © American Chemical Society.However, no copyright claim is made to original U.S. Government works, or worksproduced by employees of any Commonwealth realm Crown government in the courseof their duties.
Article
Extraction of Plant DNA by MicroneedlePatch for Rapid Detection of Plant Diseases
Rajesh Paul, Amanda C. Saville, Jeana C. Hansel, Yanqi Ye, Carmin Ball, AlyssaWilliams, Xinyuan Chang, Guojun Chen, Zhen Gu, Jean B. Ristaino, and Qingshan Wei
ACS Nano, Just Accepted Manuscript • DOI: 10.1021/acsnano.9b00193 • Publication Date (Web): 09 Jun 2019
Downloaded from http://pubs.acs.org on June 10, 2019
Just Accepted
“Just Accepted” manuscripts have been peer-reviewed and accepted for publication. They are postedonline prior to technical editing, formatting for publication and author proofing. The American ChemicalSociety provides “Just Accepted” as a service to the research community to expedite the disseminationof scientific material as soon as possible after acceptance. “Just Accepted” manuscripts appear infull in PDF format accompanied by an HTML abstract. “Just Accepted” manuscripts have been fullypeer reviewed, but should not be considered the official version of record. They are citable by theDigital Object Identifier (DOI®). “Just Accepted” is an optional service offered to authors. Therefore,the “Just Accepted” Web site may not include all articles that will be published in the journal. Aftera manuscript is technically edited and formatted, it will be removed from the “Just Accepted” Website and published as an ASAP article. Note that technical editing may introduce minor changesto the manuscript text and/or graphics which could affect content, and all legal disclaimers andethical guidelines that apply to the journal pertain. ACS cannot be held responsible for errors orconsequences arising from the use of information contained in these “Just Accepted” manuscripts.
1
Extraction of Plant DNA by Microneedle Patch for
Rapid Detection of Plant Diseases
Rajesh Paul,1 Amanda C. Saville,2 Jeana C. Hansel,2 Yanqi Ye,3 Carmin Ball,1 Alyssa Williams,1
Xinyuan Chang,4 Guojun Chen 3,5,6, Zhen Gu,3,5,6* Jean B. Ristaino,2,7* Qingshan Wei 1,7*
1. Department of Chemical and Biomolecular Engineering, North Carolina State University, Raleigh, NC 27696, USA
2. Department of Entomology and Plant Pathology, North Carolina State University, Raleigh, NC 27696, USA
3. Joint Department of Biomedical Engineering, University of North Carolina at Chapel Hill, North Carolina State University, Raleigh, NC 27696, USA
4. School of Chemical Engineering and Technology, Tianjin University, Tianjin 300350, P.R. China
5. Bioengineering Department, University of California, Los Angeles, Los Angeles, CA 90095, USA
6. Jonsson Comprehensive Cancer Center, California NanoSystems Institute, and Center for Minimally Invasive Therapeutics, University of California, Los Angeles, Los Angeles, CA 90095, USA
7. Emerging Plant Disease and Global Food Security Cluster, North Carolina State University, Raleigh, NC 27696, USA
* Correspondence: Z.G. ([email protected]), J.B.R. ([email protected]), and Q.W.
Page 1 of 34
ACS Paragon Plus Environment
ACS Nano
123456789101112131415161718192021222324252627282930313233343536373839404142434445464748495051525354555657585960

2
TABLE OF CONTENT (TOC)
A microneedle patch-based rapid plant DNA extraction method is reported. This minimally
invasive approach allows isolation of PCR amplifiable genomic DNA from hard-to-lyse plant
tissues in around 1 minute without the need of bulky laboratory equipment. This method has been
applied to detect low abundant P. infestans pathogens in both lab-inoculated and field-collected
tomato leaves.
Page 2 of 34
ACS Paragon Plus Environment
ACS Nano
123456789101112131415161718192021222324252627282930313233343536373839404142434445464748495051525354555657585960
3
ABSTRACT: In-field molecular diagnosis of plant diseases via nucleic acid amplification (NAA)
is currently limited by cumbersome protocols for extracting and isolating pathogenic DNA from
plant tissues. To address this challenge, a rapid plant DNA extraction method has been developed
using a disposable polymeric microneedle (MN) patch. By applying MN patches on plant leaves,
amplification-assay-ready DNA can be extracted within a minute from different plant species.
MN-extracted DNA has been used for direct polymerase chain reaction (PCR) amplification of
plant plastid DNA without purification. Furthermore, using this patch device, extraction of plant
pathogen DNA (Phytophthora infestans) from both laboratory-inoculated and field-infected leaf
samples was performed for detection of late blight disease in tomato. MN extraction achieved
100% detection rate of late blight infections for samples after 3 days of inoculation when compared
to the conventional cetyltrimethylammonium bromide (CTAB)-based DNA extraction method as
a gold standard, and 100% detection rate for all blind field samples tested. This simple, cell lysis-
free, and purification-free DNA extraction method could be a transformative approach to facilitate
rapid sample preparation for molecular diagnosis of various plant diseases directly in the field.
KEYWORDS: plant disease, DNA extraction, microneedle patch, Phytophthora infestans,
nucleic acid amplification, point-of-care diagnostics
Page 3 of 34
ACS Paragon Plus Environment
ACS Nano
123456789101112131415161718192021222324252627282930313233343536373839404142434445464748495051525354555657585960
4
Global food security has become a growing concern for the international community as it
directly affects our agricultural economy and sustainability.1 The demand of food is increasing
rapidly due to population growth. By 2050, the global food production needs to be increased by
100 % to fulfill the food demand of growing populations.2 Additionally, the total available
agricultural land area is decreasing with population growth. As a result, in the coming decades
increasing agricultural productivity will be key for global food security. Plant diseases
significantly affect agricultural productivity. Crop failure due to pathogen infection is a common
issue in agriculture. Every year, more than 30% of crop losses occur due to plant diseases.3,4
Current crop protection relies on several disease diagnosis technologies, such as DNA
amplification via the polymerase chain reaction (PCR), enzyme-linked immunosorbent assays
(ELISA), fluorescence in-situ hybridization (FISH), immunofluorescence (IF), and flow cytometry
(FCM).1,5,6 However, most of existing disease detection technologies are laboratory-based and
require skilled technicians for instrument operation. Moreover, field sites are often far from
centralized diagnostic laboratories or in resource-limited regions where diagnostic facilities are
not readily available. As such, development of field-portable and cost-effective disease detection
systems is essential for global crop protection.
Late blight is caused by the oomycete plant pathogen Phytophthora infestans,7 and is one
of the major threats to global food security as it adversely affects potato production, one of the
world’s staple food crops. This oomycete was responsible for the famous Irish potato famine
(1845-1849) 7–9 and most recently, the late blight pandemic of tomato in eastern USA in 2009. 10–
12 Late blight disease spreads rapidly under favorable conditions and can destroy a crop within a
few days if left untreated. Every year, the disease causes approximately 6.7 billion USD in crop
losses worldwide.13 Molecular approaches based on nucleic acid amplification (NAA) are
Page 4 of 34
ACS Paragon Plus Environment
ACS Nano
123456789101112131415161718192021222324252627282930313233343536373839404142434445464748495051525354555657585960
5
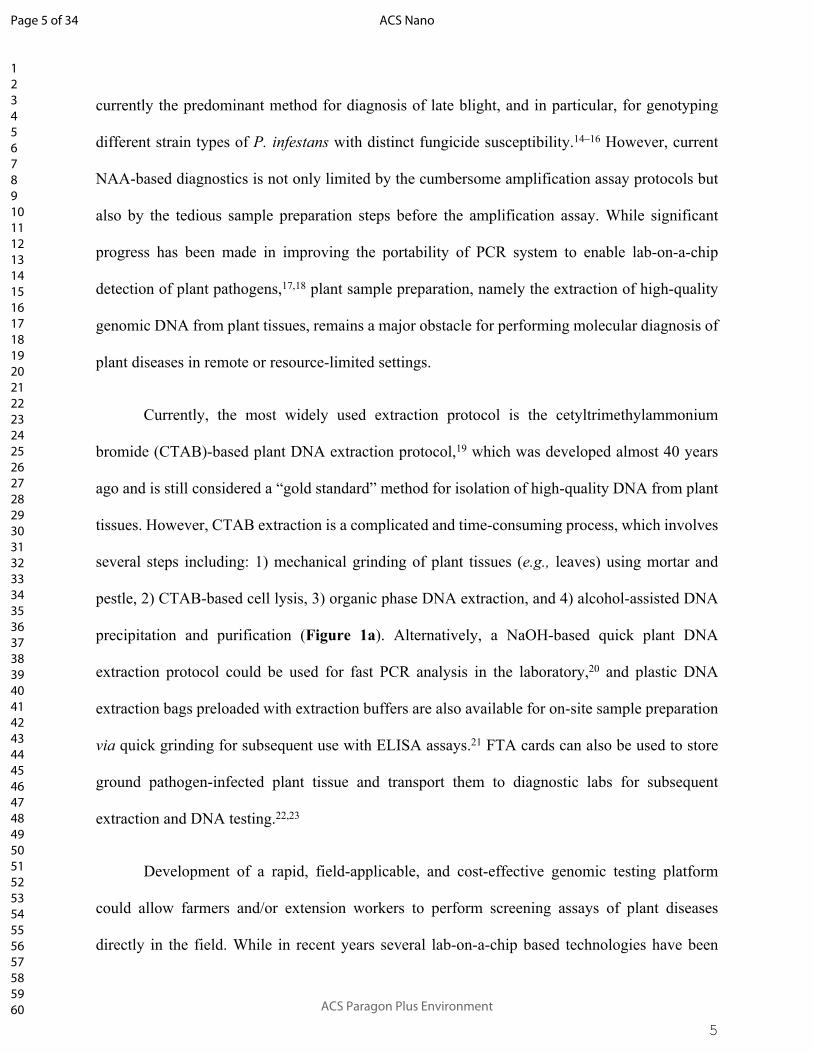
currently the predominant method for diagnosis of late blight, and in particular, for genotyping
different strain types of P. infestans with distinct fungicide susceptibility.14–16 However, current
NAA-based diagnostics is not only limited by the cumbersome amplification assay protocols but
also by the tedious sample preparation steps before the amplification assay. While significant
progress has been made in improving the portability of PCR system to enable lab-on-a-chip
detection of plant pathogens,17,18 plant sample preparation, namely the extraction of high-quality
genomic DNA from plant tissues, remains a major obstacle for performing molecular diagnosis of
plant diseases in remote or resource-limited settings.
Currently, the most widely used extraction protocol is the cetyltrimethylammonium
bromide (CTAB)-based plant DNA extraction protocol,19 which was developed almost 40 years
ago and is still considered a “gold standard” method for isolation of high-quality DNA from plant
tissues. However, CTAB extraction is a complicated and time-consuming process, which involves
several steps including: 1) mechanical grinding of plant tissues (e.g., leaves) using mortar and
pestle, 2) CTAB-based cell lysis, 3) organic phase DNA extraction, and 4) alcohol-assisted DNA
precipitation and purification (Figure 1a). Alternatively, a NaOH-based quick plant DNA
extraction protocol could be used for fast PCR analysis in the laboratory,20 and plastic DNA
extraction bags preloaded with extraction buffers are also available for on-site sample preparation
via quick grinding for subsequent use with ELISA assays.21 FTA cards can also be used to store
ground pathogen-infected plant tissue and transport them to diagnostic labs for subsequent
extraction and DNA testing.22,23
Development of a rapid, field-applicable, and cost-effective genomic testing platform
could allow farmers and/or extension workers to perform screening assays of plant diseases
directly in the field. While in recent years several lab-on-a-chip based technologies have been
Page 5 of 34
ACS Paragon Plus Environment
ACS Nano
123456789101112131415161718192021222324252627282930313233343536373839404142434445464748495051525354555657585960
6
developed for DNA extraction from mammalian cells or bacteria,24–27 these technologies are
difficult to apply to plant cell lysis and DNA isolation due to the presence of rigid plant cell walls.
Furthermore, plant leaves, one of the most common sample sources for plant disease screening,
consist of plant cells in highly organized sandwich structures, where infected cells are usually
protected by the epidermal cells and cuticle layers. Extraction of genomic DNA from infected
plant cells therefore requires breakage through several plant barriers, including cell walls,
epidermis, and the waxy cuticle outer layer. Despite the great progress in both laboratory- or chip-
based technologies in recent years, none of the existing methods provides assay-ready plant DNA
in a simple, instrument-free, and field applicable manner.
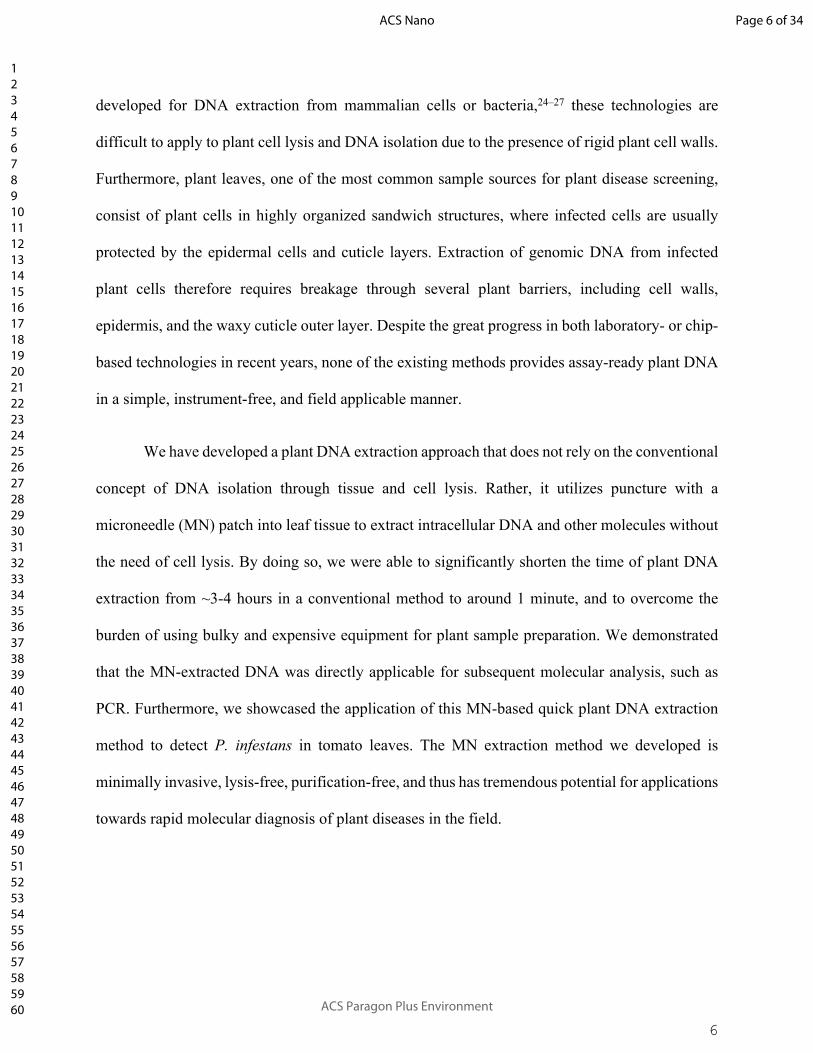
We have developed a plant DNA extraction approach that does not rely on the conventional
concept of DNA isolation through tissue and cell lysis. Rather, it utilizes puncture with a
microneedle (MN) patch into leaf tissue to extract intracellular DNA and other molecules without
the need of cell lysis. By doing so, we were able to significantly shorten the time of plant DNA
extraction from ~3-4 hours in a conventional method to around 1 minute, and to overcome the
burden of using bulky and expensive equipment for plant sample preparation. We demonstrated
that the MN-extracted DNA was directly applicable for subsequent molecular analysis, such as
PCR. Furthermore, we showcased the application of this MN-based quick plant DNA extraction
method to detect P. infestans in tomato leaves. The MN extraction method we developed is
minimally invasive, lysis-free, purification-free, and thus has tremendous potential for applications
towards rapid molecular diagnosis of plant diseases in the field.
Page 6 of 34
ACS Paragon Plus Environment
ACS Nano
123456789101112131415161718192021222324252627282930313233343536373839404142434445464748495051525354555657585960
7
RESULTS AND DISCUSSION
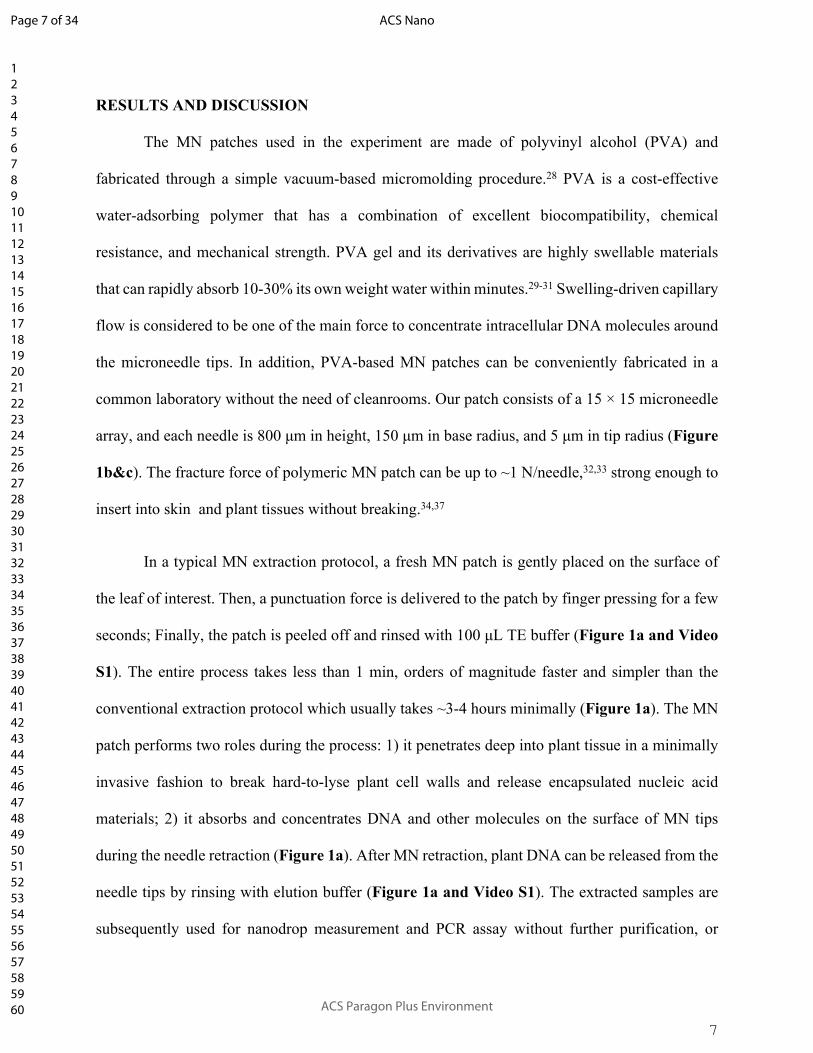
The MN patches used in the experiment are made of polyvinyl alcohol (PVA) and
fabricated through a simple vacuum-based micromolding procedure.28 PVA is a cost-effective
water-adsorbing polymer that has a combination of excellent biocompatibility, chemical
resistance, and mechanical strength. PVA gel and its derivatives are highly swellable materials
that can rapidly absorb 10-30% its own weight water within minutes.29-31 Swelling-driven capillary
flow is considered to be one of the main force to concentrate intracellular DNA molecules around
the microneedle tips. In addition, PVA-based MN patches can be conveniently fabricated in a
common laboratory without the need of cleanrooms. Our patch consists of a 15 × 15 microneedle
array, and each needle is 800 μm in height, 150 μm in base radius, and 5 μm in tip radius (Figure
1b&c). The fracture force of polymeric MN patch can be up to ~1 N/needle,32,33 strong enough to
insert into skin and plant tissues without breaking.34,37
In a typical MN extraction protocol, a fresh MN patch is gently placed on the surface of
the leaf of interest. Then, a punctuation force is delivered to the patch by finger pressing for a few
seconds; Finally, the patch is peeled off and rinsed with 100 μL TE buffer (Figure 1a and Video
S1). The entire process takes less than 1 min, orders of magnitude faster and simpler than the
conventional extraction protocol which usually takes ~3-4 hours minimally (Figure 1a). The MN
patch performs two roles during the process: 1) it penetrates deep into plant tissue in a minimally
invasive fashion to break hard-to-lyse plant cell walls and release encapsulated nucleic acid
materials; 2) it absorbs and concentrates DNA and other molecules on the surface of MN tips
during the needle retraction (Figure 1a). After MN retraction, plant DNA can be released from the
needle tips by rinsing with elution buffer (Figure 1a and Video S1). The extracted samples are
subsequently used for nanodrop measurement and PCR assay without further purification, or
Page 7 of 34
ACS Paragon Plus Environment
ACS Nano
123456789101112131415161718192021222324252627282930313233343536373839404142434445464748495051525354555657585960
8
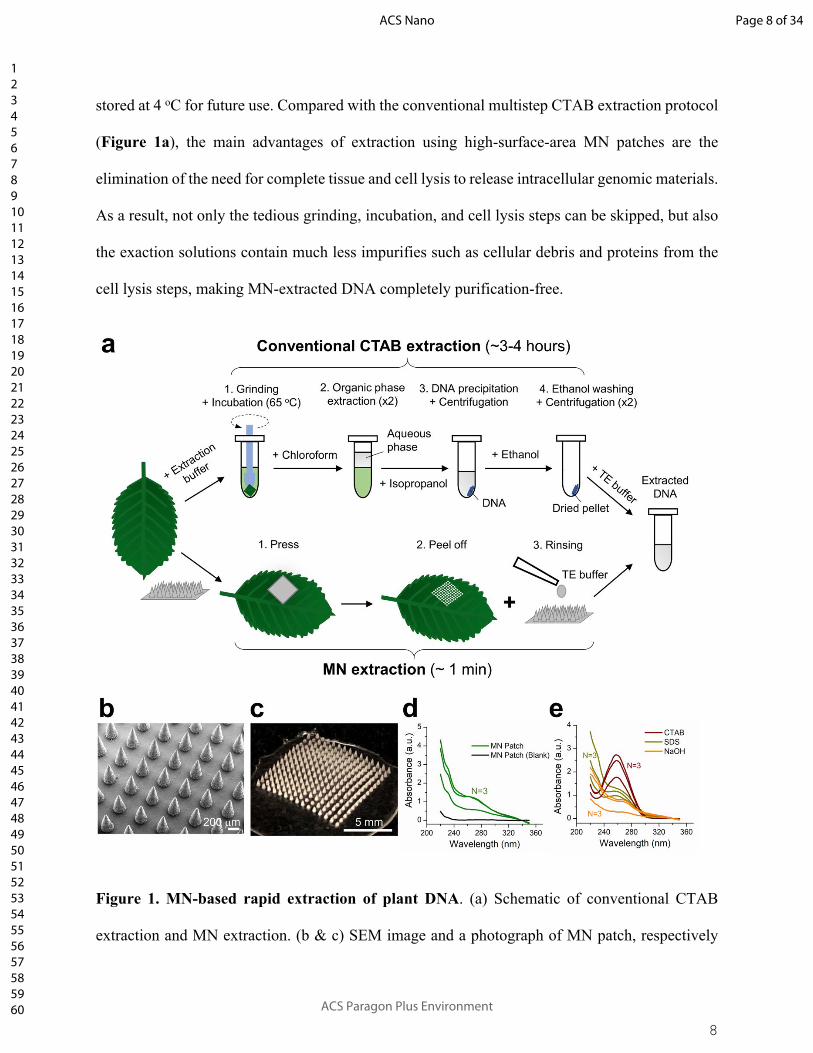
stored at 4 oC for future use. Compared with the conventional multistep CTAB extraction protocol
(Figure 1a), the main advantages of extraction using high-surface-area MN patches are the
elimination of the need for complete tissue and cell lysis to release intracellular genomic materials.
As a result, not only the tedious grinding, incubation, and cell lysis steps can be skipped, but also
the exaction solutions contain much less impurifies such as cellular debris and proteins from the
cell lysis steps, making MN-extracted DNA completely purification-free.
Figure 1. MN-based rapid extraction of plant DNA. (a) Schematic of conventional CTAB
extraction and MN extraction. (b & c) SEM image and a photograph of MN patch, respectively
Page 8 of 34
ACS Paragon Plus Environment
ACS Nano
123456789101112131415161718192021222324252627282930313233343536373839404142434445464748495051525354555657585960
9
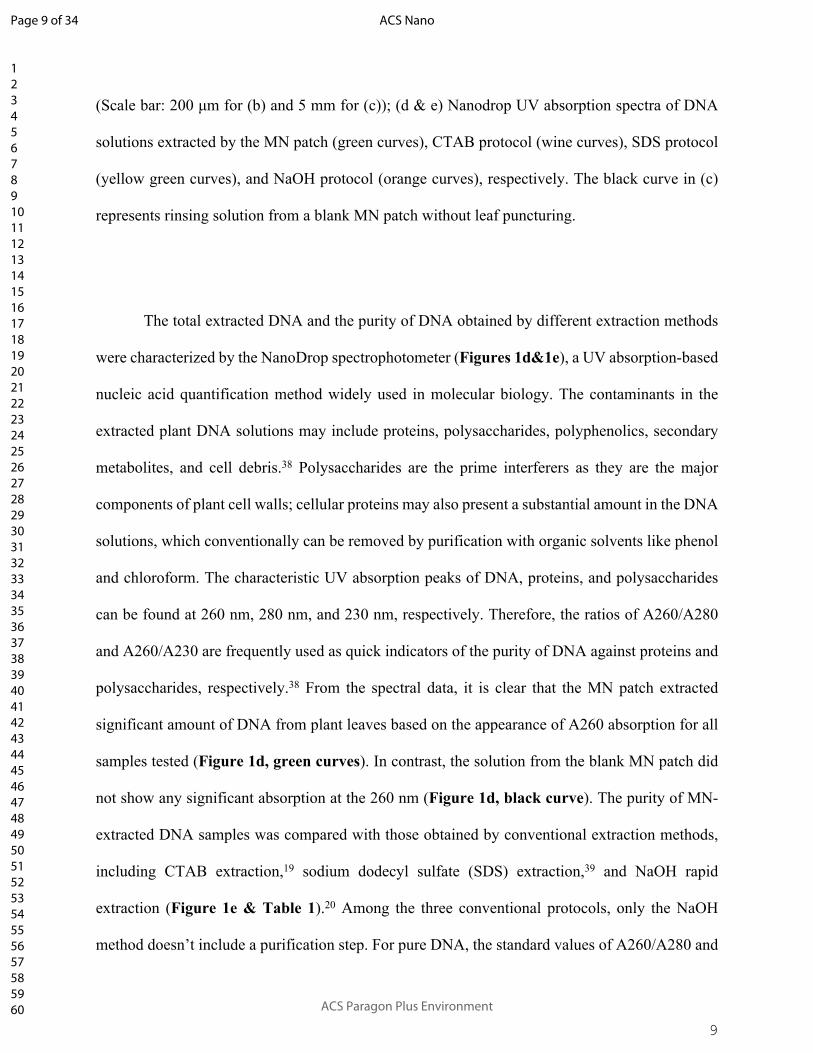
(Scale bar: 200 μm for (b) and 5 mm for (c)); (d & e) Nanodrop UV absorption spectra of DNA
solutions extracted by the MN patch (green curves), CTAB protocol (wine curves), SDS protocol
(yellow green curves), and NaOH protocol (orange curves), respectively. The black curve in (c)
represents rinsing solution from a blank MN patch without leaf puncturing.
The total extracted DNA and the purity of DNA obtained by different extraction methods
were characterized by the NanoDrop spectrophotometer (Figures 1d&1e), a UV absorption-based
nucleic acid quantification method widely used in molecular biology. The contaminants in the
extracted plant DNA solutions may include proteins, polysaccharides, polyphenolics, secondary
metabolites, and cell debris.38 Polysaccharides are the prime interferers as they are the major
components of plant cell walls; cellular proteins may also present a substantial amount in the DNA
solutions, which conventionally can be removed by purification with organic solvents like phenol
and chloroform. The characteristic UV absorption peaks of DNA, proteins, and polysaccharides
can be found at 260 nm, 280 nm, and 230 nm, respectively. Therefore, the ratios of A260/A280
and A260/A230 are frequently used as quick indicators of the purity of DNA against proteins and
polysaccharides, respectively.38 From the spectral data, it is clear that the MN patch extracted
significant amount of DNA from plant leaves based on the appearance of A260 absorption for all
samples tested (Figure 1d, green curves). In contrast, the solution from the blank MN patch did
not show any significant absorption at the 260 nm (Figure 1d, black curve). The purity of MN-
extracted DNA samples was compared with those obtained by conventional extraction methods,
including CTAB extraction,19 sodium dodecyl sulfate (SDS) extraction,39 and NaOH rapid
extraction (Figure 1e & Table 1).20 Among the three conventional protocols, only the NaOH
method doesn’t include a purification step. For pure DNA, the standard values of A260/A280 and
Page 9 of 34
ACS Paragon Plus Environment
ACS Nano
123456789101112131415161718192021222324252627282930313233343536373839404142434445464748495051525354555657585960
10
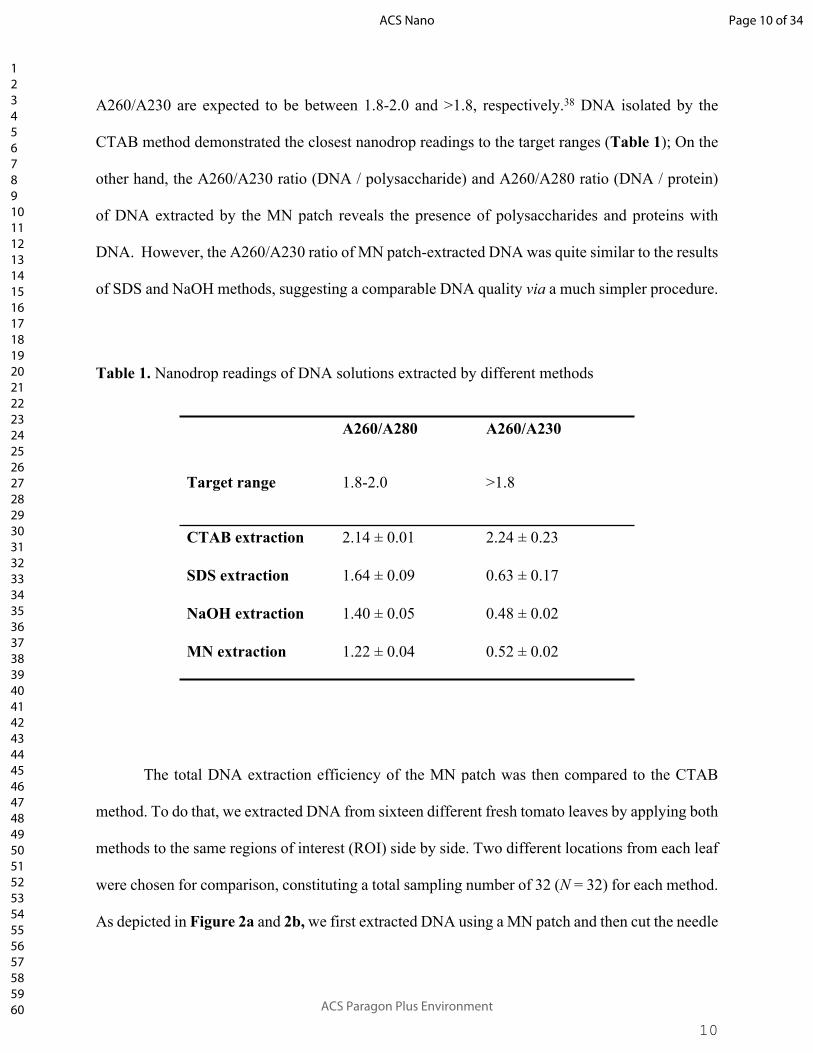
A260/A230 are expected to be between 1.8-2.0 and >1.8, respectively.38 DNA isolated by the
CTAB method demonstrated the closest nanodrop readings to the target ranges (Table 1); On the
other hand, the A260/A230 ratio (DNA / polysaccharide) and A260/A280 ratio (DNA / protein)
of DNA extracted by the MN patch reveals the presence of polysaccharides and proteins with
DNA. However, the A260/A230 ratio of MN patch-extracted DNA was quite similar to the results
of SDS and NaOH methods, suggesting a comparable DNA quality via a much simpler procedure.
Table 1. Nanodrop readings of DNA solutions extracted by different methods
A260/A280 A260/A230
Target range 1.8-2.0 >1.8
CTAB extraction 2.14 ± 0.01 2.24 ± 0.23
SDS extraction 1.64 ± 0.09 0.63 ± 0.17
NaOH extraction 1.40 ± 0.05 0.48 ± 0.02
MN extraction 1.22 ± 0.04 0.52 ± 0.02
The total DNA extraction efficiency of the MN patch was then compared to the CTAB
method. To do that, we extracted DNA from sixteen different fresh tomato leaves by applying both
methods to the same regions of interest (ROI) side by side. Two different locations from each leaf
were chosen for comparison, constituting a total sampling number of 32 (N = 32) for each method.
As depicted in Figure 2a and 2b, we first extracted DNA using a MN patch and then cut the needle
Page 10 of 34
ACS Paragon Plus Environment
ACS Nano
123456789101112131415161718192021222324252627282930313233343536373839404142434445464748495051525354555657585960

11
imprinted area (~10 mm × 10 mm) for subsequent CTAB extraction. The Nanodrop UV absorption
spectra from all 32 extraction locations were averaged for each method. The means of spectra were
shown in solid lines in Figure 2c (red for CTAB extraction and green for MN extraction), whereas
the 1st and 3rd quartile of the data are shown in dotted and dashed lines, respectively (Figure 2c).
The MN method apparently extracted much less DNA than that of CTAB method based on A260
absorption (Figure 2c). However, such comparison does not take the difference of sampling
volumes of the two methods into account. We estimated that the sample volumes for MN patch
and CTAB extraction methods were 1.08 mm3 and 48.92 mm3, respectively (Figure 2d, purple
bars). After normalization of the amount of extracted DNA by the sample volumes used in each
method, the MN extraction method demonstrated a higher yield than the conventional CTAB
approach (Figure 2d, blue bars).
Figure 2. Comparison of extraction efficiency between the MN and CTAB methods. Image
of a tomato leaf (a) after punctuation by a MN patch, and (b) after cutting off the needle-imprinted
areas for CTAB extraction. (c) Nanodrop UV absorption spectra of N = 32 samples for CTAB
extraction (red) and MN extraction (green). Solid lines: average absorption; dotted and dashed
lines: 1st and 3rd quartile of data, respectively. (d) Normalized amounts of total DNA extracted by
Page 11 of 34
ACS Paragon Plus Environment
ACS Nano
123456789101112131415161718192021222324252627282930313233343536373839404142434445464748495051525354555657585960

12
two extraction methods (Blue bars), revealing higher extraction efficiency of MN method. Purple
bars represent the difference in sampling volumes of the two methods.
In our MN extraction approach, DNA samples were extracted from fresh leaves without
using any chemicals, and as a result, the DNA was directly amplifiable without any purification.
To demonstrate that, we extracted DNA by MN patches from fresh tomato and pepper leaves
(Figure 3a). Five different leaves for each species were tested, and each time a new MN patch
was used. After extraction, PCR amplification reactions were performed using 1 μL of needle-
extracted samples to amplify the 5’ end of ribulose-bisphosphate carboxylase gene (rbcL) of
plant plastid DNA. Next, gel electrophoresis was performed to visualize the amplified DNA
bands. The MN-extracted samples were successfully amplified by the PCR reaction and the
characteristic bands at around 670 bp 40 were observed for all samples tested from both species
(Figure 3b&c). The results confirm that the MN-extracted DNA is directly applicable for PCR
amplification without the need of further purification.
Page 12 of 34
ACS Paragon Plus Environment
ACS Nano
123456789101112131415161718192021222324252627282930313233343536373839404142434445464748495051525354555657585960

13
Figure 3. Direct PCR amplification of MN-extracted DNA without purification. a) DNA
extraction by MN patches from tomato and pepper leaves (N = 5), indicating the applicability of
the MN extraction method for different plant species. (b & c) Gel electrophoresis images showing
amplified bands of rbcL gene using MN-extracted DNA from (b) tomato and (c) pepper leaves,
respectively. Lane 1-5 in (b&c) represent 5 replicates using different patches; L: 100 bp DNA
ladder; NC: negative control (no DNA: blank rinsing solutions).
Next, the MN patch-based DNA extraction method was tested to extract much less
abundant plant pathogen DNA from infected plant leaves. Fresh tomato leaves were collected from
P. infestans-inoculated tomato plants from the Department of Entomology and Plant Pathology
(isolate NC 14-1; clonal lineage US-23). Four days after inoculation, the infected leaves were
subjected to both MN and CTAB extraction. PCR amplifications were then performed using 1 μL
of extracted DNA samples and the results were characterized by gel electrophoresis (Figure
4a&b). To rule out the possibility that MN extraction only collects pathogen DNA from the surface
of leaf samples, all leaves used in MN extraction were pre-disinfected by rinsing with a 5% bleach
solution for a few seconds followed by rinsing with DI water twice. The gel electrophoresis results
show that the characteristic band at around 610 bp 41 was observed for all CTAB (Figure 4a) and
MN -extracted samples (Figure 4b), suggesting a successful detection of P. infestans in both
methods.
Page 13 of 34
ACS Paragon Plus Environment
ACS Nano
123456789101112131415161718192021222324252627282930313233343536373839404142434445464748495051525354555657585960

14
Figure 4. Detection of P. infestans via MN extraction. (a) Schematic and gel electrophoresis
showing the amplified bands of P. infestans from CTAB-extracted DNA. (b) Schematic and gel
electrophoresis showing the amplified bands of P. infestans from MN-extracted DNA. The surface
of the leaves was disinfested using 5% bleach solution for a few seconds before extraction. (c)
Schematic and gel electrophoresis showing the amplified bands of P. infestans from extraction
solutions obtained by flat PVA patches (no microneedles). Lane 1-6 in (a&b): 6 replicates
extracted by the CTAB and MN patch methods, respectively; Lane 1-2 in (c): flat PVA patch
extraction after surface disinfestation using a 5% bleach solution; Lane 3-4 in (c): flat PVA patch
extraction without bleach disinfesting; L:100 bp ladder; NC: negative control (no DNA: blank
rinsing solutions); PC: positive control (purified P. infestans DNA). All leaves were tested 4 days
after inoculation.
We further validated that MN patches indeed extract inplanta pathogen DNA by using flat
PVA patches (no sharp microneedles) as a control (Figure 4c). When a similar surface
Page 14 of 34
ACS Paragon Plus Environment
ACS Nano
123456789101112131415161718192021222324252627282930313233343536373839404142434445464748495051525354555657585960

15
disinfestation procedure was applied to the flat patch extraction, no P. infestans bands were
detected by flat patches as indicated by the gel electrophoresis (Figure 4c, lane 1-2); In contrast,
without performing surface disinfestation, flat patches also detected the presence of P. infestans
from the surface of infected samples (Figure 4c, lane 3-4). These results suggest that in order to
probe pathogen DNA inside plant tissues, microneedle structures are required in order to break the
leaf surface and penetrate into deep tissues.
For quantitative comparison of extracted pathogenic DNA in different methods, a real-time
PCR (or quantitative PCR, qPCR) assay was developed using EvaGreen dye. Previously, several
quantitative assays have been reported for P. infestans, based on either TaqMan probe 42 or SYBR
Green dye.43,44 However, TaqMan probe-based assays are very expensive, and SYBR Green dye
suffers several disadvantages compared to EvaGreen.45 For instance, EvaGreen dye shows lower
background fluorescence and less inhibitory effect in PCR reaction than SYBR Green.46 Moreover,
EvaGreen is more cost-effective, environmentally friendly,47 and stable both during amplification
and during storage.48 The sensitivity of the developed qPCR assay was tested using serial dilutions
of purified P. infestans DNA for concentrations ranging from 12 ng/μL to 1.2 pg/μL (Figure S1a).
This assay was capable of successfully amplifying at levels as low as 1.2 pg/μL target DNA. The
melt curve analysis after amplification confirmed the presence of a single amplicon (melt peak at
~82.5oC) in different samples (Figure S1b). A linear relationship between logarithmic values of
P. infestans DNA concentration and threshold cycles was obtained as the calibration curve for the
assay (Figure S1c). The threshold cycle for the amplification of 12 ng/µL target DNA was 18.7,
and increased by ~3.6 cycles for each 10-fold dilution of target DNA (Figure S1c).
Using this qPCR assay, more quantitative analyses were carried out for comparing the MN
extraction method and CTAB method in the detection of late blight disease from inoculated tomato
Page 15 of 34
ACS Paragon Plus Environment
ACS Nano
123456789101112131415161718192021222324252627282930313233343536373839404142434445464748495051525354555657585960

16
leaves (Figure 5). Fresh tomato leaves were inoculated by spraying 1 mL of sporangia solution
(20,000 sporangia/mL) of P. infestans (isolate NC 14-1; clonal lineage US-23) on abaxial side of
leaves (Figure S2). The detection sensitivity for each extraction method was quantified by using
sixteen leaves at four different timepoints, which varied from 1 to 4 days after pathogen
inoculation. Figure S3 shows the images of all inoculated leaves used in the analyses before
surface disinfestation. Figure 5a shows the images of inoculated leaves after surface disinfestation
and puncturing by the MN patches. For each day after inoculation, eight different locations from
four different leaves were chosen for DNA extraction using both methods. The analyses were
stopped after day 4, because infection symptom became very clear and visible afterwards.
Figure 5b depicts the average amount of total DNA extracted by the two methods for
different inoculation days. Although a few variations were observed for the CTAB methods, the
average amount of DNA extracted by the MN patches stayed steady, suggesting a consistent
extraction performance of all samples by the MN patch approach. All extracted DNA samples
from these inoculated leaves were diluted to a concentration approximately 10 ng/μL, and 1 μL of
the diluted DNA samples were used for real-time PCR (Figure S4) followed by melt curve
analyses (Figure S5). After amplification reactions, the cycle threshold (Ct) for DNA samples
extracted from the same locations using different methods were compared (Figure 5c), and the
difference of Ct values were calculated and shown in gray bars in Figure 5c.
During the first two days of infection, the pathogen DNA concentration was extremely low.
Even the CTAB method could not extract pathogenic DNA from all sampling locations, as
indicated by empty bars in Figure 5c. The detection rate of MN extraction was defined as follows:
Detection rate % = No. of MN detection / No. of CTAB detection. Compared with the CTAB
method, MN extraction showed a slightly lower detection rate for the first two days of post-
Page 16 of 34
ACS Paragon Plus Environment
ACS Nano
123456789101112131415161718192021222324252627282930313233343536373839404142434445464748495051525354555657585960
17
inoculation (50% and 66.7%, respectively, Figure 5d). However, for days 3 and 4 post-
inoculation, the detection efficiency of MN approach matches up with the CTAB method, showing
a 100% detection rate (Figure 5d). On the other side, the Ct values for both methods slightly
decrease with the increase of infection time, as the amount of pathogen DNA increases over time.
Moreover, the Ct values of the MN approach are about 7 cycles higher than those of CTAB
method, due to the smaller sampling volume of MN approach (Figure 5c). Although the MN-
extracted DNA samples take longer time (about 10 minutes) for PCR amplification due to the
smaller amount of DNA, the total assay time (including DNA extraction and amplification) of the
MN-PCR combination (~1 hour total = ~1 min extraction + ~60 min PCR) is still ~4 times faster
than the conventional CTAB-PCR procedure (4.3 hours total = ~3.5 hours extraction + 50 min
PCR), not to mention the eliminated sample transportation time (up to several days) associated
with the lab-centered diagnostics. The results suggest that by shortening the rate limiting step of
plant molecular diagnostics – the sample preparation and transportation – MN patch method has
the great potential to speed up plant pathogen detection in the field.
Page 17 of 34
ACS Paragon Plus Environment
ACS Nano
123456789101112131415161718192021222324252627282930313233343536373839404142434445464748495051525354555657585960

18
Page 18 of 34
ACS Paragon Plus Environment
ACS Nano
123456789101112131415161718192021222324252627282930313233343536373839404142434445464748495051525354555657585960
19
Figure 5. Application of MN extraction for detection of P. infestans from laboratory-
inoculated samples. (a) Images of all inoculated leaves used for analyses having four different
inoculation days (day 1-day 4); (b) Average amount of total DNA extracted by MN patch and
CTAB methods for different inoculation days; (c) Threshold cycles (Ct) for detection of P.
infestans from inoculated leaves for different methods; (d) Detection rate of MN extraction method
compared to the CTAB method.
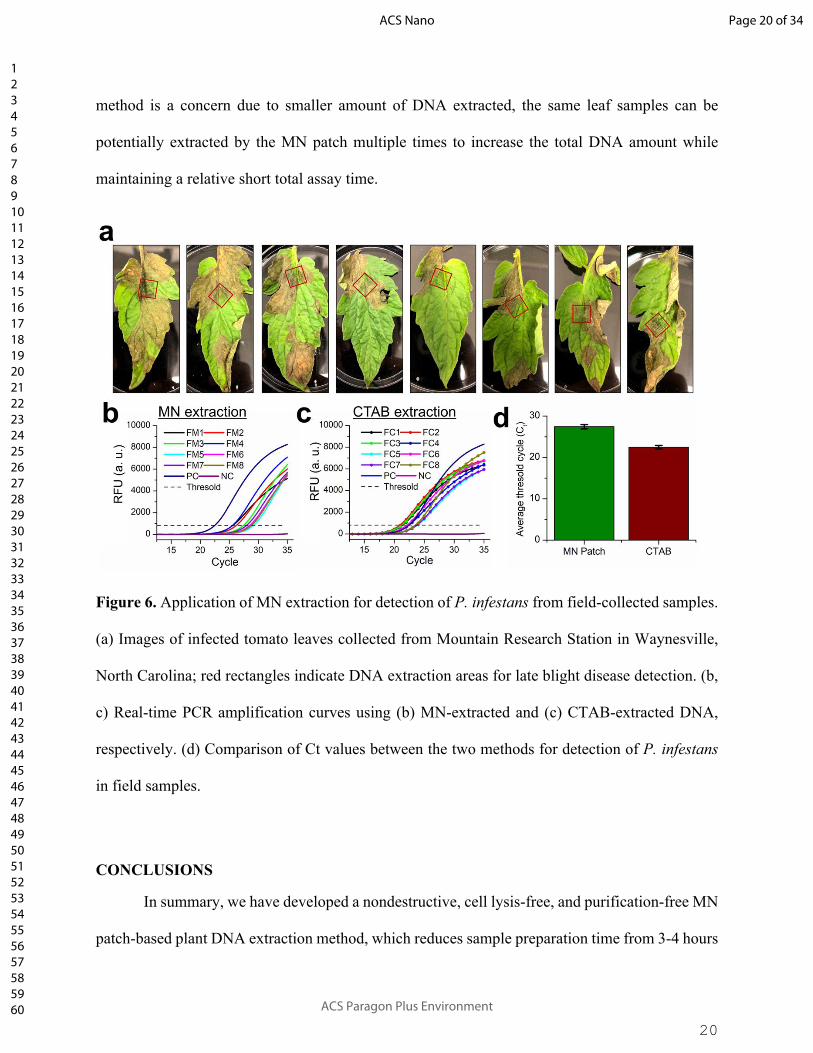
Finally, the MN extraction method was tested to detect late blight disease in field samples
(Figure 6). Eight infected tomato leaves (Figure 6a) were collected from Haywood County, North
Carolina (disease reported on August 21st, 2018). DNA was extracted from these samples first by
the MN patch and then the CTAB method as usual. After extraction, real-time PCR amplifications
were carried out for disease detection (Figure 6b, 6c & S6). The presence of P. infestans was
detected by both methods in all field samples (Figure 6b&c). Again, the extracted amount of P.
infestans DNA is much less by the MN patch method, as compared to the CTAB protocol (Table
S1). This leads to slightly longer amplification reaction of the MN-extracted DNA samples. The
threshold values of the MN method were ~5 cycles higher than the CTAB method for the field
samples (Figure 6d & Table S1). The difference was smaller than that of lab-inoculated samples.
This could be attributed to two possible reasons: First, the field samples have more visible
symptoms of infection (Figure 6a) than the laboratory-inoculated samples (Figure S2&S3),
indicating higher pathogen DNA, which diminishes the difference of MN and CTAB extraction;
Second, surface disinfestation was not performed for field samples before DNA extraction, which
also may increase the concentration of pathogen DNA. If the detection sensitivity of the MN
Page 19 of 34
ACS Paragon Plus Environment
ACS Nano
123456789101112131415161718192021222324252627282930313233343536373839404142434445464748495051525354555657585960
20
method is a concern due to smaller amount of DNA extracted, the same leaf samples can be
potentially extracted by the MN patch multiple times to increase the total DNA amount while
maintaining a relative short total assay time.
Figure 6. Application of MN extraction for detection of P. infestans from field-collected samples.
(a) Images of infected tomato leaves collected from Mountain Research Station in Waynesville,
North Carolina; red rectangles indicate DNA extraction areas for late blight disease detection. (b,
c) Real-time PCR amplification curves using (b) MN-extracted and (c) CTAB-extracted DNA,
respectively. (d) Comparison of Ct values between the two methods for detection of P. infestans
in field samples.
CONCLUSIONS
In summary, we have developed a nondestructive, cell lysis-free, and purification-free MN
patch-based plant DNA extraction method, which reduces sample preparation time from 3-4 hours
Page 20 of 34
ACS Paragon Plus Environment
ACS Nano
123456789101112131415161718192021222324252627282930313233343536373839404142434445464748495051525354555657585960

21
of a conventional extraction method to ~1 minute. We demonstrated that MN patches made of
PVA had sufficient stiffness to penetrate several different plant leaf tissues, and extracted DNA
was directly usable for amplification reactions without further purification. In proof-of-concept
applications, we demonstrated that MN extraction could be used to detect plant pathogen DNA by
diagnosing P. infestans in both inoculated and field-collected tomato leaf samples. For samples
collected 3 or more days after inoculation, the MN extraction approach exhibited a detection rate
of 100% when compared to the CTAB method. Moreover, we demonstrated 100% coincidence
between MN and CTAB methods, for detecting late blight infection in field-collected samples, and
the Ct values of the qPCR assay when using MN method were only about ~5 cycles higher than
the conventional CTAB method. Given its simplicity and cost-effectiveness, this rapid plant DNA
extraction method could be a valuable technology to eventually achieve “sample-to-answer”
nucleic acid amplification (NAA) based plant disease diagnosis in the field.
METHODS
Fabrication of Microneedle (MN) Patch. All MN patches used for DNA extraction were
fabricated using polydimethylsiloxane (PDMS) molds purchased from Blueacre Technology Ltd.,
Ireland. These molds were fabricated by laser ablation, and the dimension of each mold is
approximately 10 mm × 10 mm which has 15 × 15 arrays of microneedle conical cavities. The
height of each cavity is 800 μm and, the diameters of the tip and base are 10 μm and 300 μm,
respectively. To fabricate the microneedle patches, 0.5 mL polyvinyl alcohol (PVA, 30kDa-
70kDa, 10 wt%) solution was added to each silicone mold. After that, the molds are placed in a
Page 21 of 34
ACS Paragon Plus Environment
ACS Nano
123456789101112131415161718192021222324252627282930313233343536373839404142434445464748495051525354555657585960
22
vacuum (600 mmHg) chamber for 20 minutes to draw the PVA solution into the cavities and
achieve the desired viscosity. These molds were then kept overnight at 25°C in a chemical hood
vacuum. After drying, the microneedle patches were carefully separated from the molds and stored
at 25°C in a sealed petri dish.
MN Patch-based DNA extraction. There were two simple steps for MN patch-based DNA
extraction from a fresh plant leaf. First, a MN patch was pressed gently onto the leaf surface by
hand. The MN patch was then removed and rinsed using 100 μL TE buffer (10 mM Tris-HCl, 0.1
mM EDTA, pH 8.0) for collecting the adsorbed DNA from the needle tips (Video S1). For each
extraction, a new MN patch was used, and the concentrations of the extracted DNA in the 100 μL
solutions were measured using NanoDrop One Microvolume UV-Vis Spectrophotometer. For
PCR reactions, 1 μL of MN-extracted solutions were used each time without further purification.
CTAB-Based DNA Extraction. Leaf samples were placed in 1.5 mL microcentrifuge tubes and
homogenized using disposable pestles after addition of 150 µL extraction buffer (0.35 M sorbitol,
0.1 M Tris, 0.005 M EDTA,0.02 M sodium bisulfite, pH 7.5). Then, 150 µL of nuclei lysis buffer
(0.2 M Tris, 0.05 M EDTA, 2.0 M NaCl, and 2% hexadecyltrimethylammonium bromide (CTAB),
pH 7.5 and 60 µL of 5% N-lauryl sarcosine were added to the homogenized solution and vortexed
to mix. The microcentrifuge tubes were incubated in a water bath at 65°C for 30 min, and mixed
with one volume of chloroform:isoamyl alcohol (24:1). After chloroform extraction, the mixture
was centrifuged at 12000 rpm for 15 min. The aqueous phase containing DNA was transferred to
new centrifuge tubes and again mixed with one volume of chloroform:isoamyl alcohol (24:1) to
repeat the chloroform extraction process. After that, one volume of cold 100 % isopropanol and
0.1 volume 3M sodium acetate (pH 8.0) were mixed with the aqueous phases of each sample and
kept overnight at -20°C for DNA precipitation. The samples were then centrifuged at 13000 rpm
Page 22 of 34
ACS Paragon Plus Environment
ACS Nano
123456789101112131415161718192021222324252627282930313233343536373839404142434445464748495051525354555657585960
23
for 5 min for precipitating DNA. The supernatants were discarded, and the precipitated DNA
pellets were washed twice using 1 mL cold 70 % ethanol and air dried in a hood for 30 min. Finally,
dry pellets were resuspended in 50 µL TE buffer (10 mM Tris-HCl, 0.1 mM EDTA, pH 8.0), and
the concentrations of the extracted DNA were measured using a NanoDrop One Microvolume UV-
Vis Spectrophotometer and diluted to ~10 ng/ µL for PCR reactions.
Leaf Inoculation. P. infestans infected leaves were obtained from Dr. Jean Ristaino’s lab in the
Department of Entomology and Plant Pathology, North Carolina State University. These leaves
were inoculated using P. infestans a US 23 genotype; isolate NC 14-1. To collect P. infestans
sporangia, infected leaves were held vertically, and 1 mL of DI water was sprayed on the abaxial
side of leaves. The runoff liquid containing sporangia was collected in a beaker, and the number
of sporangia per mL in the collected solution was estimated using a hemocytometer (Hausser
Scientific, USA). Then, the solution was diluted to 10,000 sporangia per mL for inoculation onto
healthy leaves. For spraying, the diluted solution was transferred in a 15 mL Falcon tube with a
spray cap (Container & Packaging Supply Inc., USA). All healthy leaves were inoculated under
1.5% water agar plate. The water agar helps to maintain the humidity of the plate during
inoculation. Healthy leaves facing abaxial side up were placed on the non-agar side of the plate
and sprayed with 2 mL of sporangia solution on each leaf. The agar sides of the plate were then
placed on top of non-agar sides. The plates were sealed using parafilm and incubated at room
temperature. For negative controls, healthy leaves were sprayed with 2 mL of DI water and kept
under the same conditions as inoculated leaves in sealed water agar plates. After inoculation,
sporangia penetrate the plant leaf tissue to gain nutrition and spread hyphae throughout the leaf.49
After 3 to 4 days, hyphae usually come out on the surface and generate new sporangia. Figure S2
Page 23 of 34
ACS Paragon Plus Environment
ACS Nano
123456789101112131415161718192021222324252627282930313233343536373839404142434445464748495051525354555657585960
24
illustrates the progress of the disease in different days for an inoculated leaf after inoculation,
showing lesions (water soaked, dark spots) and white growth (hyphae) on the leaf surface.
Conventional PCR Amplification. All necessary reagents and primers for conventional PCR
amplification were purchased from Thermo Fisher Scientific, USA. All PCR reactions were run
on a Simpliamp Thermal Cycler (Thermo Fisher Scientific, USA). For rbcl gene amplification of
plant plastid DNA, Rbcla-F (5'-ATGTCACCACAAACAGAGACTAAAGC-3') and rbcLajf634R
(5'-GAAACGGTCTCTCCAACGCAT-3') 40 primers were used. In a PCR reaction, these primers
generate an amplicon of a length of 670 bp. The reaction master mix for rbcl gene detection
consists of 1x PCR buffer, 0.1 mM dTNPs, 0.4 µM of each primer, 1.8 mM magnesium chloride,
0.1 mg/mL BSA and 0.04 U/µL Taq DNA polymerase. The amplification reactions were
performed in 25 µL volumes, and for each PCR reaction, ~10 ng template DNA was used. For
negative controls, no DNA was used in the amplification reaction for testing the contamination of
the reagents. Cycling conditions were 94 oC for 2 min (initial denaturation) followed by 35 cycles
of 30 s at 94 oC (denaturation), 45s at 54 oC (annealing), 45s at 72 oC (extension). After that, the
temperature was set to 72 ˚C for 5 min for final extension followed by a hold at 4˚C. For late
blight disease detection, two P. infestans specific primers, PINF2 (5'-
CTCGCTACAATAGCAGCGTC-3') and ITS5 (5'-GGAAGTAAAAGTCGTAACAAGG-3')
were used for amplification reaction.16,41 The primer pair amplifies a region of ~610 bp in the
target amplicon. The reaction master mix consists of 1x PCR buffer, 0.1 mM dTNPs, 0.4 µM of
each primer, 1.8 mM magnesium chloride, 0.1 mg/mL BSA and 0.02 U/µL Taq DNA polymerase.
The amplification reactions were performed in 25 µL volumes by mixing 24 µL master mix and 1
µL template DNA (concentration ~10 ng/µL). Thermal cycling conditions were 94 0C for 2 min
(initial denaturation) followed by 35 cycles of 15 s at 94 oC (denaturation), 15s at 56 oC
Page 24 of 34
ACS Paragon Plus Environment
ACS Nano
123456789101112131415161718192021222324252627282930313233343536373839404142434445464748495051525354555657585960
25
(annealing), 15s at 72 oC (extension). After that, the temperature was set to 72 oC for 5 min for
final extension followed by a hold at 4˚C. Either DNA extracted from healthy leaves or no DNA
(sample collected from blank MN patch) were used as negative controls in PCR.
Gel Electrophoresis. After amplification, gel electrophoresis was performed to visualize the
amplified PCR products. For that, agarose, SYBR safe DNA gel stain (20000X), 10x Tris-Borate-
EDTA (TBE) buffer, DNA Gel loading dye, and 100 bp DNA ladder were purchased from Thermo
Fisher Scientific, USA. All PCR amplified products were visualized in 2 % agarose gel. For
making agarose gel, 1.2 g agarose and 6 µL SYBR safe DNA gel stain were mixed with 60 mL of
1x TBE buffer in a glass bottle and microwaved for 1.5 min. The microwave was stopped every
30 s for suspending the undissolved agarose by gentle swirling of the glass bottle. Later, the
dissolved agarose solution was kept at room temperature for cooling to 60oC before pouring to a
gel casting tray (7cm×10 cm). After solidification, the gel was transferred to Sub-Cell® GT
Agarose Gel Electrophoresis Systems (Bio-Rad) for gel electrophoresis. 1x TBE buffer was used
for running the agarose gel, and 5 µL PCR amplified product and 1 µL 6x DNA loading dye were
mixed for gel loading. After running the gel, the image was captured using E-Gel™ Imager System
with Blue Light Base (Thermo Fisher Scientific).
Quantitative PCR (qPCR) Amplification. For real-time assay of late blight disease detection,
EvaGreen (20,000x) dye was purchased from Biotium, USA, and the dye was diluted to 20x in DI
water before preparing the master mix. All other required reagents and primers were purchased
from Thermo Fisher Scientific, USA.
For real-time detection, two primers, PINF2 (5'-CTCGCTACAATAGCAGCGTC-3') and
HERB2 (5'-CGGACCGACTGCGAGTCC-3') were used, and these primers amplify a 100 bp
Page 25 of 34
ACS Paragon Plus Environment
ACS Nano
123456789101112131415161718192021222324252627282930313233343536373839404142434445464748495051525354555657585960

26
region of the internal transcribed spacer (ITS) region 2 of P. infestans in the amplification
reaction.42The amplification reactions were run in 25 µL volumes consisting of 1 µL template
DNA (concentration ~10 ng/µL), 2.5 µL of 10x PCR buffer, 1.25 µL of dNTPs (2mM each), 1
µL of 10 µM PINF2, 1 µL of 10 µM HERB2, 1.25 µL of 20x EvaGreen, 1.25 µL of 50 mM
magnesium chloride, 0.05 µL of 50 mg/ml BSA, 0.1 µL of 5 U/ µL Taq DNA polymerase and
15.6 µL of DI water. Quantitative PCR reactions were carried out on the CFX Connect™ Real-
Time System (Bio-Rad), and thermal cycling conditions were 94 oC for 2 min (initial denaturation)
followed by 35 cycles of 15 s at 94 oC (denaturation), 15s at 56 oC (annealing), 15s at 72oC
(extension) and, the fluoresce signal was captured for each cycle after the extension stage. After
thermal cycling, the temperature was maintained at 72oC for 5 min for the final extension of
products. Finally, melt curve analyses were performed by slowly raising the temperature to 95oC
for finding the melt temperatures of the amplified product.
ASSOCIATED CONTENT
Supporting Information
The Supporting Information is available free of charge on the ACS Publications website at DOI:
10.1021/
Quantification of P. infestans concentrations by a qPCR assay using
EvaGreen; images of laboratory-inoculated tomato leaves;
quantitative analyses of DNA extracted from laboratory-inoculated
leaves at different inoculation days; melt curve and threshold
cycle analyses for late blight disease detection from field
Page 26 of 34
ACS Paragon Plus Environment
ACS Nano
123456789101112131415161718192021222324252627282930313233343536373839404142434445464748495051525354555657585960
27
collected tomato leaves (PDF); movie of the procedure of MN patch-
based plant DNA extraction (mp4)
AUTHOR INFORMATION
Corresponding Author
*Email: [email protected]
*Email: [email protected]
*Email: [email protected]
ACKNOWLEDGMENTS
This work was supported by the Chancellor’s Faculty Excellence Program (Emerging Plant
Disease and Global Food Security Cluster), the Kenan Institute for Engineering, Technology &
Science (KIETS) at NC State, and USDA iPIPE funds (grant number 2015-0097). The authors
also acknowledge Inga Meadows at the Mountain Research Station (Waynesville, NC) for
providing tomato field samples.
Page 27 of 34
ACS Paragon Plus Environment
ACS Nano
123456789101112131415161718192021222324252627282930313233343536373839404142434445464748495051525354555657585960

28
REFERENCES
(1) Fang, Y.; Ramasamy, R.; Fang, Y.; Ramasamy, R. P. Current and Prospective Methods for
Plant Disease Detection. Biosensors 2015, 5, 537–561.
(2) Godfray, H. C. J.; Beddington, J. R.; Crute, I. R.; Haddad, L.; Lawrence, D.; Muir, J. F.;
Pretty, J.; Robinson, S.; Thomas, S. M.; Toulmin, C. Food Security: The Challenge of
Feeding 9 Billion People. Science 2010, 327, 812–818.
(3) Oerke, E.-C. Crop Losses to Pests. J. Agric. Sci. 2006, 144,
31−43.
(4) Savary, S.; Ficke, A.; Aubertot, J.-N.; Hollier, C. Crop Losses Due to Diseases and Their
Implications for Global Food Production Losses and Food Security. Food Secur. 2012, 4,
519–537.
(5) Sankaran, S.; Mishra, A.; Ehsani, R.; Davis, C. A Review of Advanced Techniques for
Detecting Plant Diseases. Comput. Electron. Agric. 2010, 72, 1–13.
(6) López, M. M.; Bertolini, E.; Olmos, A.; Caruso, P.; Gorris, M. T.; Llop, P.; Penyalver, R.;
Cambra, M. Innovative Tools for Detection of Plant Pathogenic Viruses and Bacteria. Int.
Microbiol. 2003, 6, 233–243.
(7) De Bary, A. Researches into the Nature of the Potato Fungus, Phytophthora Infestans.
J. R. Agric. Soc. Engl. 1876, 12,239-69.
(8) Berkele, M. J. Observations, Botanical and Physiological on the Potato Murrain. J. Hortic.
Soc. London 1846, 1, 9–34.
Page 28 of 34
ACS Paragon Plus Environment
ACS Nano
123456789101112131415161718192021222324252627282930313233343536373839404142434445464748495051525354555657585960
29
(9) Bourke, P. A. Emergence of Potato Blight, 1843-46. Nature 1964, 203, 805–808.
(10) Hu, C.-H.; Perez, F. G.; Donahoo, R.; McLeod, A.; Myers, K.; Ivors, K.; Secor, G.; Roberts,
P. D.; Deahl, K. L.; Fry, W. E.; Ristaino, J. B. Recent Genotypes of Phytophthora Infestans
in the Eastern United States Reveal Clonal Populations and Reappearance of Mefenoxam
Sensitivity. Plant Dis. 2012, 96, 1323–1330.
(11) Fry, W. E.; McGrath, M. T.; Seaman, A.; Zitter, T. A.; McLeod, A.; Danies, G.; Small, I.
M.; Myers, K.; Everts, K.; Gevens, A. J.; Gugino, B. K.; Johnson, S. B.; Judelson, H.;
Ristaino, J.; Roberts, P.; Secor, G.; Seebold, K.; Snover-Clift, K.; Wyenandt, A.; Grünwald,
N. J.; et al. The 2009 Late Blight Pandemic in the Eastern United States – Causes and
Results. Plant Dis. 2013, 97, 296–306.
(12) MOSKIN, J. Outbreak of Fungus Threatens Tomato Crop
https://www.nytimes.com/2009/07/18/nyregion/18tomatoes.html?_r=0 (accessed Aug 31,
2018).
(13) Haverkort, A. J.; Boonekamp, P. M.; Hutten, R.; Jacobsen, E.; Lotz, L. A. P.; Kessel, G. J.
T.; Visser, R. G. F.; Van Der Vossen, E. A. G.; Hutten, : R. Societal Costs of Late Blight in
Potato and Prospects of Durable Resistance Through Cisgenic Modification. Potato Res.
2008, 51, 47–57.
(14) Ristaino, J. B.; Groves, C. T.; Parra, G. R. PCR Amplification of the Irish Potato Famine
Pathogen from Historic Specimens. Nature 2001, 411, 695–697.
(15) Haas, B. J.; Kamoun, S.; Zody, M. C.; Jiang, R. H. Y.; Handsaker, R. E.; Cano, L. M.;
Grabherr, M.; Kodira, C. D.; Raffaele, S.; Torto-Alalibo, T.; Bozkurt, T. O.; Ah-Fong, A.
Page 29 of 34
ACS Paragon Plus Environment
ACS Nano
123456789101112131415161718192021222324252627282930313233343536373839404142434445464748495051525354555657585960
30
M. V.; Alvarado, L.; Anderson, V. L.; Armstrong, M. R.; Avrova, A.; Baxter, L.; Beynon,
J.; Boevink, P. C.; Bollmann, S. R.; et al. Genome Sequence and Analysis of the Irish Potato
Famine Pathogen Phytophthora Infestans. Nature 2009, 461, 393–398.
(16) Trout, C. L.; Ristaino, J. B.; Madritch, M.; Wangsomboondee, T. Rapid Detection of
Phytophthora Infestans in Late Blight-Infected Potato and Tomato Using PCR. Plant Dis.
1997, 81, 1042–1048.
(17) Koo, C.; Malapi-Wight, M.; Kim, H. S.; Cifci, O. S.; Vaughn-Diaz, V. L.; Ma, B.; Kim, S.;
Abdel-Raziq, H.; Ong, K.; Jo, Y. K.; Gross, D. C.; Shim, W.-B.; Han, A. Development of
a Real-Time Microchip PCR System for Portable Plant Disease Diagnosis. PLoS One 2013,
8, e82704.
(18) Julich, S.; Riedel, M.; Kielpinski, M.; Urban, M.; Kretschmer, R.; Wagner, S.; Fritzsche,
W.; Henkel, T.; Möller, R.; Werres, S. Development of a Lab-on-a-Chip Device for
Diagnosis of Plant Pathogens. Biosens. Bioelectron. 2011, 26, 4070–4075.
(19) Murray, M. G.; Thompson, W. F. Rapid Isolation of High Molecular Weight Plant DNA.
Nucleic Acids Res. 1980, 8, 4321–4325.
(20) Wang, H.; Qi, M.; Cutler, A. J. A Simple Method of Preparing Plant Samples for PCR.
Nucleic Acids Res. 1993, 21, 4153–4154.
(21) Agdia - Sample Extraction Bag, SEB https://orders.agdia.com/sample-bag-extract-acc-
00936 (accessed Jul 25, 2018).
(22) EuroBlight. Protocol for Sampling Phytophthora infestans DNA using FTA Cards 2018
Page 30 of 34
ACS Paragon Plus Environment
ACS Nano
123456789101112131415161718192021222324252627282930313233343536373839404142434445464748495051525354555657585960
31
http://euroblight.net/fileadmin/euroblight/Monitoring_2013_project/EuroBlight_sampling
_2018.pdf (accessed Jun 29, 2018).
(23) Ndunguru, J.; Taylor, N. J.; Yadav, J.; Aly, H.; Legg, J. P.; Aveling, T.; Thompson, G.;
Fauquet, C. M. Application of FTA Technology for Sampling, Recovery and Molecular
Characterization of Viral Pathogens and Virus-Derived Transgenes from Plant Tissues.
Virol. J. 2005, 2, 45.
(24) Brown, R. B.; Audet, J. Current Techniques for Single-Cell Lysis. J. R. Soc., Interface 2008,
5 (Suppl_2), S131–S138.
(25) Kim, J.; Johnson, M.; Hill, P.; Gale, B. K. Microfluidic Sample Preparation: Cell Lysis and
Nucleic Acid Purification. Integr. Biol. 2009, 1, 574.
(26) Nan, L.; Jiang, Z.; Wei, X. Emerging Microfluidic Devices for Cell Lysis: A Review. Lab
Chip 2014, 14, 1060.
(27) Wu, J.; Kodzius, R.; Cao, W.; Wen, W. Extraction, Amplification and Detection of DNA in
Microfluidic Chip-Based Assays. Microchim. Acta 2014, 181, 1611–1631.
(28) Ye, Y.; Wang, J.; Hu, Q.; Hochu, G. M.; Xin, H.; Wang, C.; Gu, Z. Synergistic
Transcutaneous Immunotherapy Enhances Antitumor Immune Responses through Delivery
of Checkpoint Inhibitors. ACS Nano 2016, 10, 8956–8963.
(29) Hassan, C. M.; Peppas, N. A. Structure and Morphology of Freeze/Thawed PVA Hydrogels.
Macromolecules 2000, 33, 2472–2479.
(30) Kim, S. J.; Lee, K. J.; Kim, I. Y.; Lee, Y. M.; Kim, S. I. Swelling Kinetics of Modified
Page 31 of 34
ACS Paragon Plus Environment
ACS Nano
123456789101112131415161718192021222324252627282930313233343536373839404142434445464748495051525354555657585960

32
Poly(Vinyl Alcohol) Hydrogels. J. Appl. Polym. Sci. 2003, 90, 3310–3313.
(31) Zhang, Y.; Ye, L. Improvement of Permeability of Poly(Vinyl Alcohol) Hydrogel by Using
Poly(Ethylene Glycol) as Porogen. Polym. - Plast. Technol. Eng. 2011, 50, 776–782.
(32) Larrañeta, E.; Lutton, R. E. M.; Woolfson, A. D.; Donnelly, R. F. Microneedle Arrays as
Transdermal and Intradermal Drug Delivery Systems: Materials Science, Manufacture and
Commercial Development. Mater. Sci. Eng., R 2016, 104, 1–32.
(33) Demir, Y. K.; Akan, Z.; Kerimoglu, O. Characterization of Polymeric Microneedle Arrays
for Transdermal Drug Delivery. PLoS One 2013, 8, e77289.
(34) Sullivan, S. P.; Koutsonanos, D. G.; del Pilar Martin, M.; Lee, J. W.; Zarnitsyn, V.; Choi,
S.-O.; Murthy, N.; Compans, R. W.; Skountzou, I.; Prausnitz, M. R. Dissolving Polymer
Microneedle Patches for Influenza Vaccination. Nat. Med. 2010, 16, 915–920.
(35) Yu, J.; Zhang, Y.; Ye, Y.; DiSanto, R.; Sun, W.; Ranson, D.; Ligler, F. S.; Buse, J. B.; Gu,
Z. Microneedle-Array Patches Loaded with Hypoxia-Sensitive Vesicles Provide Fast
Glucose-Responsive Insulin Delivery. Proc. Natl. Acad. Sci. U. S. A. 2015, 112, 8260–8265.
(36) Wang, C.; Ye, Y.; Hochu, G. M.; Sadeghifar, H.; Gu, Z. Enhanced Cancer Immunotherapy
by Microneedle Patch-Assisted Delivery of Anti-PD1 Antibody. Nano Lett. 2016, 16, 2334–
2340.
(37) Wang, J.; Ye, Y.; Yu, J.; Kahkoska, A. R.; Zhang, X.; Wang, C.; Sun, W.; Corder, R. D.;
Chen, Z.; Khan, S. A.; Buse, J. B.; Gu, Z. Core–Shell Microneedle Gel for Self-Regulated
Insulin Delivery. ACS Nano 2018, 12, 2466–2473.
Page 32 of 34
ACS Paragon Plus Environment
ACS Nano
123456789101112131415161718192021222324252627282930313233343536373839404142434445464748495051525354555657585960

33
(38) Varma, A.; Padh, H.; Shrivastava, N. Plant Genomic DNA Isolation: An Art or a Science.
Biotechnol. J. 2007, 2, 386–392.
(39) Edwards, K.; Johnstone, C.; Thompson, C. A Simple and Rapid Method for the Preparation
of Plant Genomic DNA for PCR Analysis. Nucleic Acids Res. 1991, 19, 1349.
(40) Fazekas, A. J.; Burgess, K. S.; Kesanakurti, P. R.; Graham, S. W.; Newmaster, S. G.
Multiple Multilocus DNA Barcodes from the Plastid Genome Discriminate Plant Species
Equally Well. PLoS One 2008, 3, 2802.
(41) Ristaino, J. B.; Ivors, K.; Bonants, P.; Gómez-Alpizar, L.; Blanco-Meneses, M. Rapid
Diagnostic Tools for Phytophthora on Horticultural Crops; Horticultural Crops. USAID
Hort CRSP Workshop, San Jose Costa Rica, June 28-July 5, 2010.
(42) Ristaino, J. B.; Hu, C. H.; Fitt, B. D. L. Evidence for Presence of the Founder la mtDNA
Haplotype of Phytophthora Infestans in 19th Century Potato Tubers from the Rothamsted
Archives. Plant Pathol. 2013, 62, 492–500.
(43) Llorente, B.; Bravo-Almonacid, F.; Cvitanich, C.; Orlowska, E.; Torres, H. N.; Flawiá, M.
M.; Alonso, G. D. A Quantitative Real-Time PCR Method for in Planta Monitoring of
Phytophthora Infestans Growth. Lett. Appl. Microbiol. 2010, 51, 603–610.
(44) Hussain, T.; Singh, B. P.; Anwar, F. A Quantative Real-Time PCR of Phytophthora
Infestans in Different Indian Potato Cultivars. IOSR J. Agric. Vet. Sci. 2017, 4, 2319–2372.
(45) Eischeid, A. C. SYTO Dyes and EvaGreen Outperform SYBR Green in Real-Time PCR.
BMC Res. Notes 2011, 4, 263.
Page 33 of 34
ACS Paragon Plus Environment
ACS Nano
123456789101112131415161718192021222324252627282930313233343536373839404142434445464748495051525354555657585960
34
(46) Mao, F.; Leung, W.-Y.; Xin, X. Characterization of EvaGreen and the Implication of Its
Physicochemical Properties for QPCR Applications. BMC Biotechnol. 2007, 7, 76.
(47) Biotium. Safety Report for EvaGreen® Dye https://biotium.com/wp-
content/uploads/2013/07/EvaGreen-safety-report.pdf (accessed Jun 16, 2018).
(48) Nowadly, C. D.; David, J. W.; Grogger, M. L. M.; Demkowicz, E. R.; Atchley, D. H.;
Veverka, D. V. Characterization of the Effects of Heat Stress on the DNA-Intercalating Dye
EvaGreen for Potential Use With the Joint Biological Agent Identification and Diagnostic
System. Mil. Med. 2014, 179, 626–632.
(49) Judelson, H. S.; Blanco, F. A. The Spores of Phytophthora: Weapons of the Plant Destroyer.
Nat. Rev. Microbiol. 2005, 3, 47–58.
Page 34 of 34
ACS Paragon Plus Environment
ACS Nano
123456789101112131415161718192021222324252627282930313233343536373839404142434445464748495051525354555657585960