Extracting depth information of 3-dimensional structures ...
12
Extracting depth information of 3-dimensional structures from a single-view X-ray Fourier-transform hologram Geilhufe, J.; Tieg, C.; Pfau, Bastian; Guenther, C. M.; Guehrs, E.; Schaffert, S.; Eisebitt, Stefan Published in: Optics Express DOI: 10.1364/OE.22.024959 2014 Link to publication Citation for published version (APA): Geilhufe, J., Tieg, C., Pfau, B., Guenther, C. M., Guehrs, E., Schaffert, S., & Eisebitt, S. (2014). Extracting depth information of 3-dimensional structures from a single-view X-ray Fourier-transform hologram. Optics Express, 22(21), 24959-24969. https://doi.org/10.1364/OE.22.024959 Total number of authors: 7 General rights Unless other specific re-use rights are stated the following general rights apply: Copyright and moral rights for the publications made accessible in the public portal are retained by the authors and/or other copyright owners and it is a condition of accessing publications that users recognise and abide by the legal requirements associated with these rights. • Users may download and print one copy of any publication from the public portal for the purpose of private study or research. • You may not further distribute the material or use it for any profit-making activity or commercial gain • You may freely distribute the URL identifying the publication in the public portal Read more about Creative commons licenses: https://creativecommons.org/licenses/ Take down policy If you believe that this document breaches copyright please contact us providing details, and we will remove access to the work immediately and investigate your claim.
Transcript of Extracting depth information of 3-dimensional structures ...
LUND UNIVERSITY
PO Box 117221 00 Lund+46 46-222 00 00
Extracting depth information of 3-dimensional structures from a single-view X-rayFourier-transform hologram
Geilhufe, J.; Tieg, C.; Pfau, Bastian; Guenther, C. M.; Guehrs, E.; Schaffert, S.; Eisebitt,StefanPublished in:Optics Express
DOI:10.1364/OE.22.024959
2014
Link to publication
Citation for published version (APA):Geilhufe, J., Tieg, C., Pfau, B., Guenther, C. M., Guehrs, E., Schaffert, S., & Eisebitt, S. (2014). Extracting depthinformation of 3-dimensional structures from a single-view X-ray Fourier-transform hologram. Optics Express,22(21), 24959-24969. https://doi.org/10.1364/OE.22.024959
Total number of authors:7
General rightsUnless other specific re-use rights are stated the following general rights apply:Copyright and moral rights for the publications made accessible in the public portal are retained by the authorsand/or other copyright owners and it is a condition of accessing publications that users recognise and abide by thelegal requirements associated with these rights. • Users may download and print one copy of any publication from the public portal for the purpose of private studyor research. • You may not further distribute the material or use it for any profit-making activity or commercial gain • You may freely distribute the URL identifying the publication in the public portal
Read more about Creative commons licenses: https://creativecommons.org/licenses/Take down policyIf you believe that this document breaches copyright please contact us providing details, and we will removeaccess to the work immediately and investigate your claim.
Extracting depth information of 3-dimensional structures from a single-view X-ray Fourier-
transform hologram
J. Geilhufe,1,2 C. Tieg,2,4 B. Pfau,3 C. M. Günther,1 E. Guehrs,1 S. Schaffert,1 and S. Eisebitt1,2,3*
1 Institut für Optik und Atomare Physik, Technische Universität Berlin, Straße des 17. Juni 135, 10623 Berlin, Germany
2 Helmholtz-Zentrum Berlin für Materialien und Energie GmbH, Hahn-Meitner-Platz 1, 14109 Berlin, Germany 3Division of Synchrotron Radiation Research, Lund University, Box 118, 22100 Lund, Sweden
4Present address: Bruker AXS GmbH, Östliche Rheinbrückenstr. 49, 76187 Karlsruhe, Germany *[email protected]
Abstract: We demonstrate how information about the three-dimensional structure of an object can be extracted from a single Fourier-transform X-ray hologram. In contrast to lens-based 3D imaging approaches that provide depth information of a specimen utilizing several images from different angles or via adjusting the focus to different depths, our method capitalizes on the use of the holographically encoded phase and amplitude information of the object’s wavefield. It enables single-shot measurements of 3D objects at coherent X-ray sources. As the ratio of longitudinal resolution over transverse resolution scales proportional to the diameter of the reference beam aperture over the X-ray wavelength, we expect the approach to be particularly useful in the extreme ultraviolet and soft-X-ray regime. ©2014 Optical Society of America OCIS codes: (090.1995) Digital holography; (070.7345) Wave propagation; (340.7440) X-ray imaging.
References and links
1. N. Streibl, “Three-dimensional imaging by a microscope,” J. Opt. Soc. Am. 2(2), 121–127 (1985). 2. F. Dubois, L. Joannes, and J. C. Legros, “Improved three-dimensional imaging with a digital holography
microscope with a source of partial spatial coherence,” Appl. Opt. 38(34), 7085–7094 (1999). 3. D. Weiss, G. Schneider, B. Niemann, P. Guttmann, D. Rudolph, and G. Schmahl, “Computed tomography of
cryogenic biological specimens based on X-ray microscopic images,” Ultramicroscopy 84(3-4), 185–197 (2000). 4. M. A. Pfeifer, G. J. Williams, I. A. Vartanyants, R. Harder, and I. K. Robinson, “Three-dimensional mapping of
a deformation field inside a nanocrystal,” Nature 442(7098), 63–66 (2006). 5. J. Miao, T. Ishikawa, B. Johnson, E. H. Anderson, B. Lai, and K. O. Hodgson, “High Resolution 3D X-Ray
Diffraction Microscopy,” Phys. Rev. Lett. 89(8), 088303 (2002). 6. M. Dierolf, A. Menzel, P. Thibault, P. Schneider, C. M. Kewish, R. Wepf, O. Bunk, and F. Pfeiffer,
“Ptychographic X-ray computed tomography at the nanoscale,” Nature 467(7314), 436–439 (2010). 7. E. Guehrs, A. M. Stadler, S. Flewett, S. Frömmel, J. Geilhufe, B. Pfau, T. Rander, S. Schaffert, G. Büldt, and S.
Eisebitt, “Soft x-ray tomoholography,” New J. Phys. 14(1), 013022 (2012). 8. H. N. Chapman, A. Barty, S. Marchesini, A. Noy, S. P. Hau-Riege, C. Cui, M. R. Howells, R. Rosen, H. He, J.
C. H. Spence, U. Weierstall, T. Beetz, C. Jacobsen, and D. Shapiro, “High-resolution ab initio three-dimensional x-ray diffraction microscopy,” J. Opt. Soc. Am. A 23(5), 1179–1200 (2006).
9. N. D. Loh, C. Y. Hampton, A. V. Martin, D. Starodub, R. G. Sierra, A. Barty, A. Aquila, J. Schulz, L. Lomb, J. Steinbrener, R. L. Shoeman, S. Kassemeyer, C. Bostedt, J. Bozek, S. W. Epp, B. Erk, R. Hartmann, D. Rolles, A. Rudenko, B. Rudek, L. Foucar, N. Kimmel, G. Weidenspointner, G. Hauser, P. Holl, E. Pedersoli, M. Liang, M. S. Hunter, L. Gumprecht, N. Coppola, C. Wunderer, H. Graafsma, F. R. N. C. Maia, T. Ekeberg, M. Hantke, H. Fleckenstein, H. Hirsemann, K. Nass, T. A. White, H. J. Tobias, G. R. Farquar, W. H. Benner, S. P. Hau-Riege, C. Reich, A. Hartmann, H. Soltau, S. Marchesini, S. Bajt, M. Barthelmess, P. Bucksbaum, K. O. Hodgson, L. Strüder, J. Ullrich, M. Frank, I. Schlichting, H. N. Chapman, and M. J. Bogan, “Fractal morphology, imaging and mass spectrometry of single aerosol particles in flight,” Nature 486(7404), 513–517 (2012).
10. H. N. Chapman, S. P. Hau-Riege, M. J. Bogan, S. Bajt, A. Barty, S. Boutet, S. Marchesini, M. Frank, B. W. Woods, W. H. Benner, R. A. London, U. Rohner, A. Szöke, E. Spiller, T. Möller, C. Bostedt, D. A. Shapiro, M.
#217184 - $15.00 USD Received 16 Jul 2014; revised 30 Aug 2014; accepted 31 Aug 2014; published 6 Oct 2014(C) 2014 OSA 20 October 2014 | Vol. 22, No. 21 | DOI:10.1364/OE.22.024959 | OPTICS EXPRESS 24959

Kuhlmann, R. Treusch, E. Plönjes, F. Burmeister, M. Bergh, C. Caleman, G. Huldt, M. M. Seibert, and J. Hajdu, “Femtosecond time-delay X-ray holography,” Nature 448(7154), 676–679 (2007).
11. M. M. Seibert, S. Boutet, M. Svenda, T. Ekeberg, F. R. N. C. Maia, M. J. Bogan, N. Tîmneanu, A. Barty, S. Hau-Riege, C. Caleman, M. Frank, H. Benner, J. Y. Lee, S. Marchesini, J. W. Shaevitz, D. A. Fletcher, S. Bajt, I. Andersson, H. N. Chapman, and J. Hajdu, “Femtosecond diffractive imaging of biological cells,” J. Phys. At. Mol. Opt. Phys. 43(19), 194015 (2010).
12. H. N. Chapman, A. Barty, M. J. Bogan, S. Boutet, M. Frank, S. P. Hau-Riege, S. Marchesini, B. W. Woods, S. Bajt, W. H. Benner, R. A. London, E. Plönjes, M. Kuhlmann, R. Treusch, S. Düsterer, T. Tschentscher, J. R. Schneider, E. Spiller, T. Möller, C. Bostedt, M. Hoener, D. A. Shapiro, K. O. Hodgson, D. Spoel, F. Burmeister, M. Bergh, C. Caleman, G. Huldt, M. M. Seibert, F. R. N. C. Maia, R. W. Lee, A. Szöke, N. Timneanu, and J. Hajdu, “Femtosecond diffractive imaging with a soft-X-ray free-electron laser,” Nat. Phys. 2(12), 839–843 (2006).
13. S. Marchesini, S. Boutet, A. E. Sakdinawat, M. J. Bogan, S. Bajt, A. Barty, H. N. Chapman, M. Frank, S. P. Hau-Riege, A. Szöke, C. Cui, D. A. Shapiro, M. R. Howells, J. C. H. Spence, J. W. Shaevitz, J. Y. Lee, J. Hajdu, and M. M. Seibert, “Massively parallel X-ray holography,” Nat. Photonics 2(9), 560–563 (2008).
14. B. Pfau, C. M. Günther, S. Schaffert, R. Mitzner, B. Siemer, S. Roling, H. Zacharias, O. Kutz, I. Rudolph, R. Treusch, and S. Eisebitt, “Femtosecond pulse x-ray imaging with a large field of view,” New J. Phys. 12(9), 095006 (2010).
15. C. M. Günther, B. Pfau, R. Mitzner, B. Siemer, S. Roling, H. Zacharias, O. Kutz, I. Rudolph, D. Schondelmaier, R. Treusch, and S. Eisebitt, “Sequential femtosecond X-ray imaging,” Nat. Photonics 5(2), 99–102 (2011).
16. I. McNulty, J. Kirz, C. Jacobsen, E. H. Anderson, M. R. Howells, and D. P. Kern, “High-Resolution Imaging by Fourier Transform X-ray Holography,” Science 256(5059), 1009–1012 (1992).
17. S. Eisebitt, J. Lüning, W. F. Schlotter, M. Lörgen, O. Hellwig, W. Eberhardt, and J. Stöhr, “Lensless imaging of magnetic nanostructures by X-ray spectro-holography,” Nature 432(7019), 885–888 (2004).
18. D. Paganin, Coherent X-Ray Optics (Oxford University Press, 2006), Chap. 1.3. 19. K. S. Raines, S. Salha, R. L. Sandberg, H. Jiang, J. A. Rodríguez, B. P. Fahimian, H. C. Kapteyn, J. Du, and J.
Miao, “Three-dimensional structure determination from a single view,” Nature 463(7278), 214–217 (2010). 20. J. Goodman, Introduction to Fourier Optics (Roberts and Company Publishers Greenwood Village, 2005), Chap.
3.10.2. 21. E. Guehrs, C. M. Günther, B. Pfau, T. Rander, S. Schaffert, W. F. Schlotter, and S. Eisebitt, “Wavefield back-
propagation in high-resolution X-ray holography with a movable field of view,” Opt. Express 18(18), 18922–18931 (2010).
22. N. C. Monserud, E. B. Malm, P. W. Wachulak, V. Putkaradze, G. Balakrishnan, W. Chao, E. Anderson, D. Carlton, and M. C. Marconi, “Recording oscillations of sub-micron size cantilevers by extreme ultraviolet Fourier transform holography,” Opt. Express 22(4), 4161–4167 (2014).
23. P. W. Wachulak, M. C. Marconi, R. A. Bartels, C. S. Menoni, and J. J. Rocca, “Holographic imaging with a nanometer resolution using compact table-top EUV laser,” Opto-Electron. Rev. 18(1), 80–90 (2010).
24. W. S. Haddad, D. Cullen, J. C. Solem, J. W. Longworth, A. McPherson, K. Boyer, and C. K. Rhodes, “Fourier-transform holographic microscope,” Appl. Opt. 31(24), 4973–4978 (1992)
25. J. Geilhufe, B. Pfau, M. Schneider, F. Büttner, C. M. Günther, S. Werner, S. Schaffert, E. Guehrs, S. Frömmel, M. Kläui, and S. Eisebitt, “Monolithic Focused Reference Beam X-ray Holography,” Nat. Commun. 5, 3008 (2014).
26. B. Pfau, C. M. Günther, E. Guehrs, T. Hauet, H. Yang, L. Vinh, X. Xu, D. Yaney, R. Rick, S. Eisebitt, and O. Hellwig, “Origin of magnetic switching field distribution in bit patterned media based on pre-patterned substrates,” Appl. Phys. Lett. 99(6), 062502 (2011).
27. F. Büttner, C. Moutafis, A. Bisig, P. Wohlhüter, C. M. Günther, J. Mohanty, J. Geilhufe, M. Schneider, C. V. Korff Schmising, S. Schaffert, B. Pfau, M. Hantschmann, M. Riemeier, M. Emmel, S. Finizio, G. Jakob, M. Weigand, J. Rhensius, J. H. Franken, R. Lavrijsen, H. J. M. Swagten, H. Stoll, S. Eisebitt, and M. Kläui, “Magnetic states in low-pinning high-anisotropy material nanostructures suitable for dynamic imaging,” Phys. Rev. B 87(13), 134422 (2013).
28. C. Von Korff Schmising, B. Pfau, M. Schneider, C. M. Günther, M. Giovannella, J. Perron, B. Vodungbo, L. Müller, F. Capotondi, E. Pedersoli, N. Mahne, J. Lüning, and S. Eisebitt, “Imaging Ultrafast Demagnetization Dynamics after a Spatially Localized Optical Excitation,” Phys. Rev. Lett. 112(21), 217203 (2014).
29. C. M. Günther, O. Hellwig, A. Menzel, B. Pfau, F. Radu, D. Makarov, M. Albrecht, A. Goncharov, T. Schrefl, W. F. Schlotter, R. Rick, J. Lüning, and S. Eisebitt, “Microscopic reversal behavior of magnetically capped nanospheres,” Phys. Rev. B 81(6), 064411 (2010).
30. T. Wang, D. Zhu, B. Wu, C. Graves, S. Schaffert, T. Rander, L. Müller, B. Vodungbo, C. Baumier, D. P. Bernstein, B. Bräuer, V. Cros, S. de Jong, R. Delaunay, A. Fognini, R. Kukreja, S. Lee, V. López-Flores, J. Mohanty, B. Pfau, H. Popescu, M. Sacchi, A. B. Sardinha, F. Sirotti, P. Zeitoun, M. Messerschmidt, J. J. Turner, W. F. Schlotter, O. Hellwig, R. Mattana, N. Jaouen, F. Fortuna, Y. Acremann, C. Gutt, H. A. Dürr, E. Beaurepaire, C. Boeglin, S. Eisebitt, G. Grübel, J. Lüning, J. Stöhr, and A. O. Scherz, “Femtosecond Single-Shot Imaging of Nanoscale Ferromagnetic Order in Co/Pd Multilayers Using Resonant X-Ray Holography,” Phys. Rev. Lett. 108(26), 267403 (2012).
#217184 - $15.00 USD Received 16 Jul 2014; revised 30 Aug 2014; accepted 31 Aug 2014; published 6 Oct 2014(C) 2014 OSA 20 October 2014 | Vol. 22, No. 21 | DOI:10.1364/OE.22.024959 | OPTICS EXPRESS 24960

31. C. Tieg, R. Frömter, D. Stickler, S. Hankemeier, A. Kobs, S. Streit-Nierobisch, C. Gutt, G. Grübel, and H. P. Oepen, “Imaging the in-plane magnetization in a Co microstructure by Fourier transform holography,” Opt. Express 18(26), 27251–27256 (2010).
32. D. Stickler, R. Frömter, H. Stillrich, C. Menk, H. P. Oepen, C. Gutt, S. Streit-Nierobisch, L. M. Stadler, G. Grübel, C. Tieg, and F. Yakhou-Harris, “Domain size in systems with canted magnetization,” Phys. Rev. B 84(10), 104412 (2011).
33. E. Guehrs, C. M. Günther, R. Könnecke, B. Pfau, and S. Eisebitt, “Holographic soft X-ray omni-microscopy of biological specimens,” Opt. Express 17(8), 6710–6720 (2009).
34. D. Attwood, Soft X-Rays and Extreme Ultraviolet Radiation: Principles and Applications, (Cambridge Univ. Press, 2000).
35. F. Dubois, C. Schockaert, N. Callens, and C. Yourassowsky, “Focus plane detection criteria in digital holography microscopy by amplitude analysis,” Opt. Express 14(13), 5895–5908 (2006).
36. J. Gillespie and R. A. King, “The use of self-entropy as a focus measure in digital holography,” Pattern Recognit. Lett. 9(1), 19–25 (1989).
37. W. Chen, C. Quan, and C. J. Tay, “Extended depth of focus in a particle field measurement using a single-shot digital hologram,” Appl. Phys. Lett. 95(20), 201103 (2009).
38. L. Ma, H. Wang, Y. Li, and H. Jin, “Numerical reconstruction of digital holograms for three-dimensional shape measurement,” J. Opt. A, Pure Appl. Opt. 6(4), 396–400 (2004).
39. W. Ackermann, G. Asova, V. Ayvazyan, A. Azima, N. Baboi, J. Bähr, V. Balandin, B. Beutner, A. Brandt, A. Bolzmann, R. Brinkmann, O. I. Brovko, M. Castellano, P. Castro, L. Catani, E. Chiadroni, S. Choroba, A. Cianchi, J. T. Costello, D. Cubaynes, J. Dardis, W. Decking, H. Delsim-Hashemi, A. Delserieys, G. Di Pirro, M. Dohlus, S. Düsterer, A. Eckhardt, H. T. Edwards, B. Faatz, J. Feldhaus, K. Flöttmann, J. Frisch, L. Fröhlich, T. Garvey, U. Gensch, C. Gerth, M. Görler, N. Golubeva, H.-J. Grabosch, M. Grecki, O. Grimm, K. Hacker, U. Hahn, J. H. Han, K. Honkavaara, T. Hott, M. Hüning, Y. Ivanisenko, E. Jaeschke, W. Jalmuzna, T. Jezynski, R. Kammering, V. Katalev, K. Kavanagh, E. T. Kennedy, S. Khodyachykh, K. Klose, V. Kocharyan, M. Körfer, M. Kollewe, W. Koprek, S. Korepanov, D. Kostin, M. Krassilnikov, G. Kube, M. Kuhlmann, C. L. S. Lewis, L. Lilje, T. Limberg, D. Lipka, F. Löh, H. Luna, M. Luong, M. Martins, M. Meyer, P. Michelato, V. Miltchev, W. D. Möller, L. Monaco, W. F. O. Müller, O. Napieralski, O. Napoly, P. Nicolosi, D. Nölle, T. Nuñez, A. Oppelt, C. Pagani, R. Paparella, N. Pchalek, J. Pedregosa-Gutierrez, B. Petersen, B. Petrosyan, G. Petrosyan, L. Petrosyan, J. Pflüger, E. Plönjes, L. Poletto, K. Pozniak, E. Prat, D. Proch, P. Pucyk, P. Radcliffe, H. Redlin, K. Rehlich, M. Richter, M. Roehrs, J. Roensch, R. Romaniuk, M. Ross, J. Rossbach, V. Rybnikov, M. Sachwitz, E. L. Saldin, W. Sandner, H. Schlarb, B. Schmidt, M. Schmitz, P. Schmüser, J. R. Schneider, E. A. Schneidmiller, S. Schnepp, S. Schreiber, M. Seidel, D. Sertore, A. V. Shabunov, C. Simon, S. Simrock, E. Sombrowski, A. A. Sorokin, P. Spanknebel, R. Spesyvtsev, L. Staykov, B. Steffen, F. Stephan, F. Stulle, H. Thom, K. Tiedtke, M. Tischer, S. Toleikis, R. Treusch, D. Trines, I. Tsakov, E. Vogel, T. Weiland, H. Weise, M. Wellhöfer, M. Wendt, I. Will, A. Winter, K. Wittenburg, W. Wurth, P. Yeates, M. V. Yurkov, I. Zagorodnov, and K. Zapfe, “Operation of a free-electron laser from the extreme ultraviolet to the water window,” Nat. Photonics 1(6), 336–342 (2007).
1. Introduction
In microscopy in general and nanoscience in particular, the extraction of depth information from three-dimensional (3D) objects of interest is often important. In optical microscopy, where numerical apertures are large, the depth-of-field can be of the same order as the lateral resolution limit and 3D objects are predominantly investigated by combining images from different focal depths [1,2]. On the other hand, when using an X-ray probe, the depth of field is typically orders of magnitude larger than the lateral resolution limit, allowing to obtain in good approximation a projection image of a sample. A 3D reconstruction of the object can then be retrieved in a tomographic approach by utilizing a set of projection images from different angular perspectives. These 2-dimensional (2D) projection images can be obtained by different imaging methods such as X-ray full-field microscopy [3], coherent diffraction imaging (CDI) [4,5], ptychography [6] or holography [7]. CDI alternatively allows reconstructing a 3D model of the specimen from a 3D reciprocal-space data set that again was composed out of many 2D diffraction patterns taken from different sample orientations [8,9].
Even though tomographic methods are powerful in that they can achieve a depth resolution as high as the lateral resolution, the requirement of several exposures can be a limitation. This can for example be the case in the study of non-triggerable or non-deterministic dynamical phenomena [10] such as fluctuations in thermal equilibrium or in general in situations when single-shot experiments are indicated, e.g. in order to follow a “diffract before destroy” approach for delicate samples via intense and ultrashort X-ray pulses [11,12].
#217184 - $15.00 USD Received 16 Jul 2014; revised 30 Aug 2014; accepted 31 Aug 2014; published 6 Oct 2014(C) 2014 OSA 20 October 2014 | Vol. 22, No. 21 | DOI:10.1364/OE.22.024959 | OPTICS EXPRESS 24961
Two techniques that have proven to be compatible with femtosecond snapshot imaging at the nanometer scale are X-ray holography [10,13–15] and CDI [11,12]. Both imaging methods record the specimen’s diffraction pattern in the far-field without any optical elements between sample and detector. When using holographic methods, the specimen’s exit wave is reconstructed using the phase information encoded in the diffraction pattern by the interference of object and reference wave [16–18]. In the case of CDI, a solution of the phase problem is iteratively retrieved from the sample’s diffraction pattern alone. In order to minimize the solution space, phase retrieval algorithms rely on certain constraint conditions which necessitate a priori information about the specimen [4,8,9]. For CDI experiments, it has already been suggested that 3D structures can be determined from a single view. The 2D diffraction pattern needs to be recorded with sufficiently fine sampling and projected on an Ewald sphere within a 3D coordinate space [19]. Therefore, the reconstruction algorithm is computationally intensive and requires many iterations involving 3D Fourier transformations.
In contrast, the non-iterative approach demonstrated here is based on a conventional X-ray Fourier-transform holography (FTH) experiment and determines an unambiguous reconstruction by exploiting the information contained in a single hologram recorded on a 2D pixel detector. The holographic reconstruction of the wave field in the plane of the reference source allows to propagate the angular spectrum of the reconstructed object wave along the beam axis [18,20] and thereby refocus specimen features outside the depth-of-field. The finite depth-of-field resulting from the scattering geometry can be used to measure the distance between features along the beam axis as has been demonstrated for holography experiments using soft X-rays [21] and extreme ultra-violet (EUV) radiation [22,23]. In this work, the depth information is used to reconstruct a complete 3D model of a specimen. The method can be seen as an analogue to digital holographic microscopy (DHM) [2,24] as the position of different features along the optical axis (i.e. the longitudinal position) is determined by bringing the feature into focus. Similar to DHM and contrary to non-holographic methods, this information is retrieved post-experimentally from a single Fourier-transform hologram, which can hence be recorded in a single exposure if required. As specimen we use an artificial, extended 3D test structure whose longitudinal dimension exceeds the optical setup’s depth-of-field. From the hologram reconstructions at different longitudinal coordinates, the displacements of the specimen features from the sample substrate are measured and transferred into a 3D model reconstruction. A suitable specimen feature is utilized to determine the transversal and longitudinal resolution. The results are compared to the theoretical prediction.
2. Theory
In soft-X-ray FTH, the hologram is recorded in the far-field as an interference pattern of the beam scattered by the object with an unperturbed reference beam [16–18]. The field of view is usually restricted by an aperture, fabricated into an X-ray-opaque metal-film mask that is produced in close proximity to the sample substrate. The reference beam allowing for phase-encoding typically originates from a small pinhole adjacent to the object fabricated into the same mask [17], while the use of more complex reference beams is also possible [13,25]. This integrated mask design monolithically couples the source of the reference wave to the object to be imaged and generates the remarkable stability of FTH against drift and vibration during exposure. Since no optical elements are blocking the space around the integrated mask, FTH provides flexibility to realize a variety of sample environments [26,27] and in particular the possibility to easily reach the sample with an optical pump [28]. In addition, the off-axis geometry of the reference wave source from the object effectively spatially separates the twin-images occurring in the hologram reconstruction. Due to these advantages and its simple experimental design, FTH with X-rays is routinely applied in numerous experiments such as relating to imaging nanomagnetic structures [26–32] or biological specimen [7,13,21,33].
#217184 - $15.00 USD Received 16 Jul 2014; revised 30 Aug 2014; accepted 31 Aug 2014; published 6 Oct 2014(C) 2014 OSA 20 October 2014 | Vol. 22, No. 21 | DOI:10.1364/OE.22.024959 | OPTICS EXPRESS 24962

In the single pinhole reference case further considered here, the image reconstruction is retrieved by a 2D spatial Fourier transformation of the recorded hologram and results in a 2D information of the amplitude and phase of the object’s exit wave, i.e. one obtains the 2D, complex wavefield leaving the object. The in-focus contribution of this wavefield is obtained from the plane parallel to the detector which includes the reference source. This 2D reconstruction shows optimally resolved features for the portion of the specimen that has a sufficiently small longitudinal separation from this plane of the reference source, i.e. features within the depth-of-field. However, the holographic reconstruction of the wave field in the plane of the reference source allows to propagate the angular spectrum of the reconstruction [18,20] along the beam axis and thereby refocus specimen features outside the depth-of-field. It has been shown that the plane of least confusion can be separated from the plane of the reference by numerically propagating the reconstructed specimen wave front according to the physical separation between both planes [21,25]. Similarly, a thoroughly focused reconstruction of an extended 3D object can be obtained by numerically propagating the reconstructed wave fronts of individual object features outside the depth-of-field into focus. Additionally, the finite depth-of-field can be used to measure the position of a particular feature along the optical axis by examining the feature’s reconstruction for different propagation lengths [22,23]. We thus consider the depth-of-field as the longitudinal resolution limit that allows a clear distinction between features that are closely displaced along the optical axis.
The application of the free-space propagator requires a homogeneous wavelength throughout the object, i.e. the refractive index is assumed to be constant. For large spatial deviations of the specimen refractive index within the propagation distance, the actual wave front is distorted and might deviate from the numerically retrieved reconstruction. Generally, in the X-ray regime, the refractive index is close to unity [34] and spatial distortions caused by an inhomogeneous refractive index within one attenuation length are expected to be much smaller than the longitudinal and lateral resolution limits.
In the following we assume that the geometry of the FTH experiment allows to record sufficiently large scattering angles such that the limit for the lateral spatial resolution is set by the lateral size of the reference aperture and not by the maximum momentum transfer. The phase information in the hologram is encoded by the object–reference interference and is accessible only up to scattering angles with sufficiently high fringe contrast, i.e. up to scattering angles with adequate reference and object beam intensity. For a circular reference pinhole of diameter d, illuminated by a plane wave, the intensity distribution of the reference beam in the mask plane is a circular disk with constant intensity. In the far-field, the reference beam intensity on the detector is given by the Airy pattern. Typically, image information is gathered predominantly for scattering angles within the radius of the central Airy disk, still containing sufficient intensity of the reference beam. Considering the Airy disk’s first minimum as the upper limit for the definition of the system’s effective numerical aperture (NAeff = 1.22 λ/d), both the lateral resolution Δr and depth-of-field are defined by the diameter of the reference pinhole. For illumination with radiation of wavelength λ, the modulus of the depth-of-field (Δz = ± λ / 2NA2) [34] can be assessed by substituting NA with NAeff:
21
2 1.22d
zλ Δ >
(1)
Remarkably, in the case of reference-limited FTH, the lateral resolution only depends on the size of the reference aperture (Δr ≅ d) while the depth-resolution additionally depends on the wavelength of the illumination and improves for larger wavelengths. This at first sight counterintuitive effect is the result of the increasing divergence of the reference beam with increasing wavelength.
#217184 - $15.00 USD Received 16 Jul 2014; revised 30 Aug 2014; accepted 31 Aug 2014; published 6 Oct 2014(C) 2014 OSA 20 October 2014 | Vol. 22, No. 21 | DOI:10.1364/OE.22.024959 | OPTICS EXPRESS 24963

Please note, that relation (1) represents the lower boundary of the depth-of-field given by the first minimum (with zero intensity) of the diverging reference beam. For real detection systems affected by noise and limited photon statistics, the maximum detected scattering angle with sufficient signal-to-noise ratio and the corresponding NAeff will be smaller resulting in a larger depth-of-field than the given boundary.
3. Experiment
The 3D test object was produced together with the holographic mask on a 350 nm thick silicon nitride membrane coated with a 1.3 µm gold film. In a first step, an object aperture of 4.4 µm in diameter was milled into the metal film utilizing a focused ion beam (FIB). Subsequently, the reference pinhole was produced at a distance of 10 µm from the centre of the object aperture with an exit diameter of 80 nm. The actual test structure was fabricated by FIB-assisted deposition of platinum (Fig. 1). The sample includes a diagonal ramp that extends over the object aperture and a group of five differently shaped bodies deposited within the object aperture on the silicon nitride substrate. The ramp is 1.1 µm wide and has an inclination angle of 45° relative to the substrate. Apertures of different shape were milled into the ramp corresponding to four different elevations above the substrate.
The mask-based FTH experiment was performed at the undulator beamline U41-PGM at the BESSY II synchrotron source, in a configuration as described in Ref [17]. The sample was placed 220 mm upstream of a back-illuminated charge-coupled device (CCD) with 2048 × 2048 pixels (pixel size 13.5 μm). Soft X-rays with a photon energy of 400 eV corresponding to a wavelength of λ = 3.1 nm were used to illuminate the sample. The hologram was recorded by accumulating 200 frames with 250 ms exposure time each. In this configuration we expect a lower boundary for the depth-of-field of |Δz| > 693 nm in the reconstruction.
Fig. 1. Scanning electron microscopy images of the test sample made of 3D platinum structures. The side view of the sample (a) shows the structured ramp which extends above the object hole. The ramp is deposited with 45° inclination on a gold mask. The small pinhole seen on the upper left represents the reference source, while the large circular aperture seen at the bottom right constitutes the object aperture. The top view (b) shows different platinum structures deposited on the silicon nitride membrane on a Si3N4 membrane at the bottom of the object aperture. Corresponding to four equidistant height levels, differently shaped marker apertures have been milled into the ramp. The width of the vertical slit in the centre of the white box is measured to 43 ± 7 nm.
The direct beam was blocked by a circular beamstop to reduce the dynamic range of the scattering signal to the technical capabilities of the CCD detector. The missing intensity at low scattering angles corresponds to high-pass filtering of the hologram. In addition to the first measurement, the centre of the diffraction pattern was recorded in a second exposure without beamstop, but using a 150 nm thick gold filter to attenuate the beam. In order to
#217184 - $15.00 USD Received 16 Jul 2014; revised 30 Aug 2014; accepted 31 Aug 2014; published 6 Oct 2014(C) 2014 OSA 20 October 2014 | Vol. 22, No. 21 | DOI:10.1364/OE.22.024959 | OPTICS EXPRESS 24964
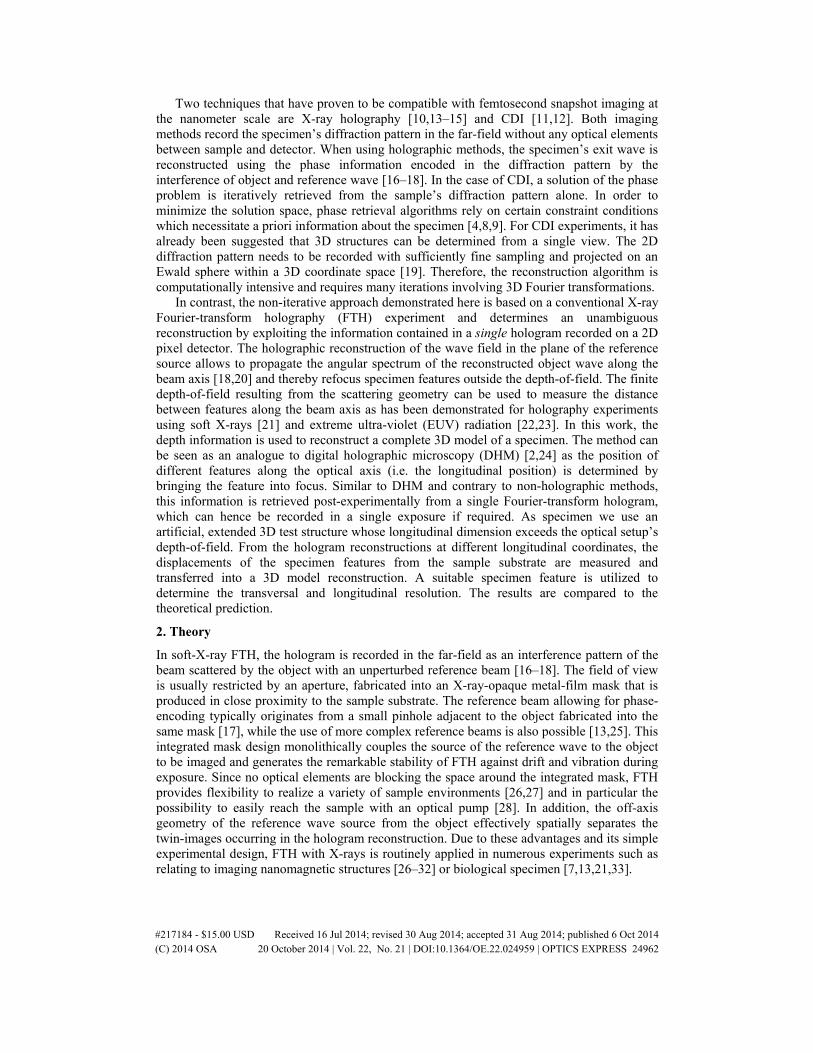
decrease the CCD readout time, the region of interest was limited to a 200 × 200 pixel matrix which was centred in the hologram. The centre was recorded by accumulating 1000 frames with 0.9 s exposure time each. In the final single-view hologram, both exposures where patched together after matching the intensities in the overlap region.
Fig. 2. Fourier-transform holography experiment. (a) Scheme of FTH setup. With a coherent X-ray beam incident from the left side, the holographic mask defines a reference wave and the object illumination. The blue curve on the right side corresponds to the far field as recorded on the detector and shows the normalized intensity (Inorm) profile of the phase encoding reference beam which originates from the small pinhole of diameter d in the mask plane. (b) Coherent diffraction pattern from the 3D test structure in Fig. 1 constituting a Fourier transform hologram, recorded with soft X-rays with λ = 3.1 nm. The intensity is plotted in logarithmic scale. The white circle has a radius of qzero = 96 µm−1 momentum transfer and corresponds to the first minimum of Airy pattern of the reference pinhole. The evaluation of depth-of-field and smallest resolved spot size in the reconstruction relies on a small real space feature that corresponds to a momentum transfer of qmax = 73 µm−1 indicated by the red circle.
The patched hologram shown in Fig. 2(b) was reconstructed by a 2D Fourier transformation after zero-padding the hologram to 4096 × 4096 pixels. The focus was shifted along the beam axis by applying the free-space propagator to the reconstruction as described in Refs [18,20].
4. Results
Figure 3(a) shows the reconstruction of the patched hologram without application of the free space propagator. By default, the focus is in the plane of the reference-wave source, i.e. in the mask plane. This initial reconstruction, hence, corresponds to a zero propagation length. As seen in Fig. 3(a), features on the bottom of the object hole (marked by arrows) are reproduced without defocus blurring while the ramp is out of focus. Depending on the longitudinal separation from mask plane, the ramp shows ever more pronounced diffraction fringes towards the top. At the photon energy utilized for illumination, the object shows strong absorption without significant phase shift. For a numeric identification of the refocus distance of a particular feature from the mask plane, suitable focus criteria thus rely on an analysis of the reconstructed amplitudes [35–38]. Numerically indentifying the optimal focus is especially promising for a single extended focal plane with many features [35,36], or for small objects that are well separated [37]. In our reconstruction a numerical focussing was hampered by two aspects: (i) For extended features that are permeating different focal planes (the platinum ramp), the common numeric approaches would rely only on a limited amount of pixels that can be brought into focus at a time. (ii) The in-focus part of the specimen is often superimposed by fringes of nearby features of a different focal plane. Additionally, Fourier transform holograms are often high-pass filtered via use of a central beam block (in contrast to this work). In these cases, edge ringing is amplified in the reconstruction of high-pass
#217184 - $15.00 USD Received 16 Jul 2014; revised 30 Aug 2014; accepted 31 Aug 2014; published 6 Oct 2014(C) 2014 OSA 20 October 2014 | Vol. 22, No. 21 | DOI:10.1364/OE.22.024959 | OPTICS EXPRESS 24965
filtered holograms and a numeric evaluation is even more challenging. On the other hand, the optimal propagation length can conveniently be determined by a visual inspection of the reconstruction. By observing the reconstruction for different propagation lengths, fringes of defocused edges are seen to converge for the propagation distance approaching the separation between the particular feature and the mask plane. It is thus possible to reliably find the optimal propagation length of sharp features without any a priori knowledge. For the evaluation of the recorded hologram data, the visual approach delivered results that were superior over numeric methods relying on an analysis of the variance [38], modulus [35] or entropy [36] of the reconstructed amplitude.
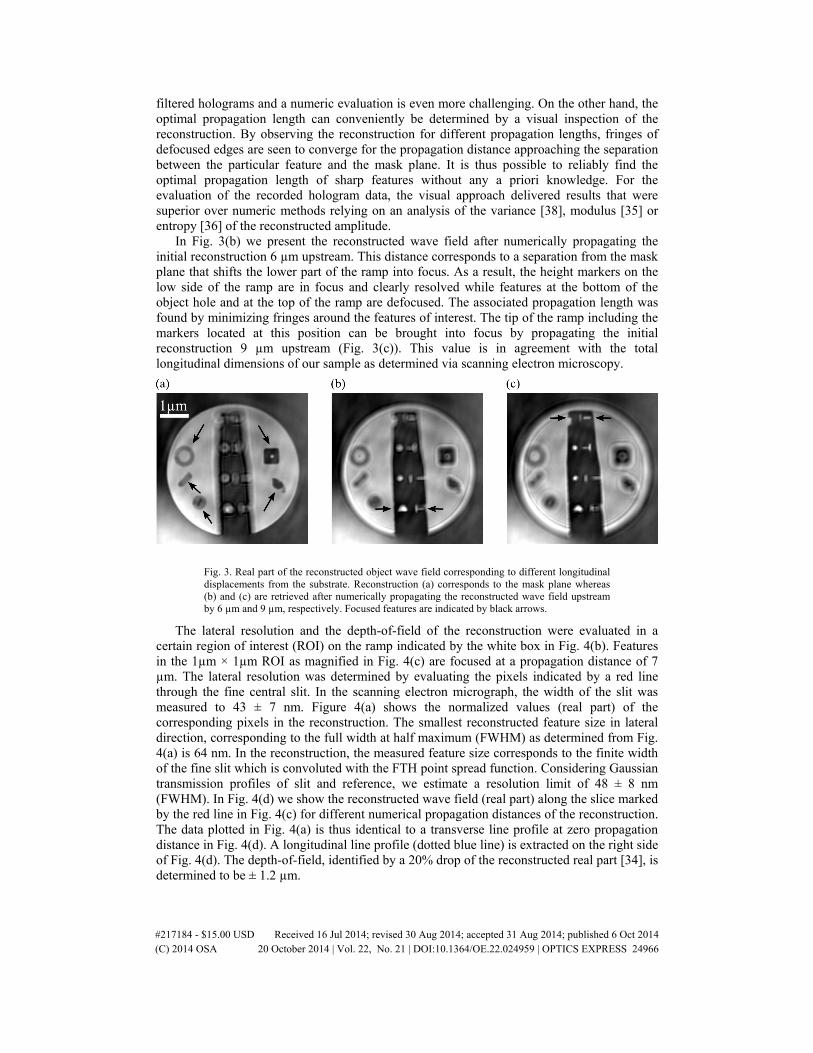
In Fig. 3(b) we present the reconstructed wave field after numerically propagating the initial reconstruction 6 µm upstream. This distance corresponds to a separation from the mask plane that shifts the lower part of the ramp into focus. As a result, the height markers on the low side of the ramp are in focus and clearly resolved while features at the bottom of the object hole and at the top of the ramp are defocused. The associated propagation length was found by minimizing fringes around the features of interest. The tip of the ramp including the markers located at this position can be brought into focus by propagating the initial reconstruction 9 µm upstream (Fig. 3(c)). This value is in agreement with the total longitudinal dimensions of our sample as determined via scanning electron microscopy.
Fig. 3. Real part of the reconstructed object wave field corresponding to different longitudinal displacements from the substrate. Reconstruction (a) corresponds to the mask plane whereas (b) and (c) are retrieved after numerically propagating the reconstructed wave field upstream by 6 µm and 9 µm, respectively. Focused features are indicated by black arrows.
The lateral resolution and the depth-of-field of the reconstruction were evaluated in a certain region of interest (ROI) on the ramp indicated by the white box in Fig. 4(b). Features in the 1µm × 1µm ROI as magnified in Fig. 4(c) are focused at a propagation distance of 7 µm. The lateral resolution was determined by evaluating the pixels indicated by a red line through the fine central slit. In the scanning electron micrograph, the width of the slit was measured to 43 ± 7 nm. Figure 4(a) shows the normalized values (real part) of the corresponding pixels in the reconstruction. The smallest reconstructed feature size in lateral direction, corresponding to the full width at half maximum (FWHM) as determined from Fig. 4(a) is 64 nm. In the reconstruction, the measured feature size corresponds to the finite width of the fine slit which is convoluted with the FTH point spread function. Considering Gaussian transmission profiles of slit and reference, we estimate a resolution limit of 48 ± 8 nm (FWHM). In Fig. 4(d) we show the reconstructed wave field (real part) along the slice marked by the red line in Fig. 4(c) for different numerical propagation distances of the reconstruction. The data plotted in Fig. 4(a) is thus identical to a transverse line profile at zero propagation distance in Fig. 4(d). A longitudinal line profile (dotted blue line) is extracted on the right side of Fig. 4(d). The depth-of-field, identified by a 20% drop of the reconstructed real part [34], is determined to be ± 1.2 µm.
#217184 - $15.00 USD Received 16 Jul 2014; revised 30 Aug 2014; accepted 31 Aug 2014; published 6 Oct 2014(C) 2014 OSA 20 October 2014 | Vol. 22, No. 21 | DOI:10.1364/OE.22.024959 | OPTICS EXPRESS 24966

Fig. 4. Determination of lateral and longitudinal resolution limits in the reconstruction. The line scan (a) is obtained in the region indicated by the white box in (b) and evaluates the reconstructed exit wave associated with the fine slit as marked in the close-up image (c). For the same line, this procedure was repeated as a function of longitudinal propagation distance to determine the depth-of-field, the result is compiled in (d) along the dashed blue line, the intensity of the real part decreases by 20% after propagating by 1.2 µm. For the resolution determination the sampling in the reconstruction was increased by a factor of 8 via zero-padding the original hologram prior to Fourier transformation.
From the quantitave assessment of the longitudinal position of the reconstructed features, we are able to compile a 3D model of our object. As in-focus features are distinguished visually by the appearance or disappearance of fringes at their edges, we aim to identify these edges at their respective longitudinal height in a second step. The edges were found by computing the variance of the real parts in a 9 × 9 pixel matrix (corresponding to 225µm × 225µm) that was shifted pixelwise across the whole reconstruction resulting in 2D variance map. These variance maps were calculated for different propagation lengths. The presence of edges within the depth-of-field results in a strong increase in variance [38] and corresponding pixels could be isolated by simply thresholding the variance map. The resulting wireframe-style 3D model maps the specimen edges at their respective longitudinal positions and is presented in Fig. 5(a). A visualisation of the 3D surface topography information in a 2D plot is illustrated in Fig. 5(b). Here, we have combined reconstructions for different propagation lengths into an entirely focused, color-coded reconstruction. The color overlay in this reconstruction corresponds to the longitudinal height of the particular feature while the local image brightness still corresponds to the reconstructed specimen wave field (real part). The longitudinal feature positions are taken from the model presented in Fig. 5(a) and were interpolated between feature boundaries. The longitudinal position of edges from strongly absorbing features as plotted in Fig. 5 corresponds to distance from the FTH mask where the respective edge first intercepts the beam. Once a strong absorber brings the beam to extinction, no information on objects shadowed in this way can be obtained. This is a principal limitation and fully analogous the situation encountered when recording focus series in microscopy, e.g. using visible light. For this reason, specimen that are best dedicated for this 3D imaging method show features that are well separated or semi-transparent.
As expected from the geometry of the experimental setup, the lateral resolution is far superior to the longitudinal resolution limit. The measured depth-of-field in the experiment deviates considerably from the predicted lower boundary of relation (1) for two reasons. Firstly, the feature used for the evaluation of the depth-of-field is not point-like but has a finite width of 43 ± 7 nm. In the reconstruction, the intensity profile through the slit is wider than the profile of the point spread function of the FTH imaging process. As a consequence, the depth-of-field of the FTH setup is overestimated. Secondly, the detection of the hologram is affected by noise of the CCD and the limited photon statistic, in particular, at high scattering angles (cf. Fig. 2(b)). The phase-encoding interference signal on the detector is not
#217184 - $15.00 USD Received 16 Jul 2014; revised 30 Aug 2014; accepted 31 Aug 2014; published 6 Oct 2014(C) 2014 OSA 20 October 2014 | Vol. 22, No. 21 | DOI:10.1364/OE.22.024959 | OPTICS EXPRESS 24967

recorded with sufficient signal-to-noise ratio up to the given zero-intensity boundary of the reference wave’s Airy disk at qzero = 96 µm−1 (white circle in Fig. 2(b)). Instead, the effective maximum scattering angle up to which the hologram is modulated will be smaller, resulting in a larger depth-of-field. The effective maximum momentum transfer of qmax = 73 µm−1 considering both the finite feature width and the detection limitations is shown as red circle in Fig. 2(b). It can be concluded that the true effective depth-of-field of the FTH setup considering hologram signal-to-noise (and not considering the limitations of the finite test feature) lies between 0.7 µm and 1.2 µm.
Relation (1) for Δz above also suggests that the longitudinal resolution can be improved by using lower photon energies while still maintaining sub-100 nm lateral resolution. For instance, the lower boundary for the longitudinal resolution reduces to Δz = ± 159 nm when the FTH mask in this experiment would have been illuminated with a wavelength of λ = 13.5 nm, i.e. a prominent wavelength for destructive single-shot experiments at the free-electron laser in Hamburg (FLASH) [11,39].
Fig. 5. 3D representations of the reconstructions at different longitudinal coordinate z (“height”). (a) Wireframe model only displaying feature boundaries at their respective in-focus propagation distance relative to the mask plane. (b) Color-coded representation of the longitudinal coordinate of the test sample surface. For object parts not placed close to sharp features (such as the non-structured parts in the center of the ramp) the height coordinate was obtained by interpolation.
5. Conclusion
We demonstrate the extraction of depth information from a single soft-X-ray Fourier-transform hologram. Our approach allows a precise and intuitive measurement of longitudinal displacements of object features, analogous to a focus series “through an object” in light microscopy. Using this information, we are able to reconstruct a 3D model of a test object. In the reconstruction, we estimate a lateral resolution of 50 nm and a longitudinal resolution of ± 1.2 µm. The depth resolution can significantly be improved by either increasing the wavelength of the X-ray illumination or by further reducing the size of the reference wave source, given that the coherent photon flux and the resulting signal-to-noise ratio in the hologram is not a limiting factor. As the method is compatible to FTH with more complex reference structures for increased efficiency [13,25], a reduction of the reference wave intensity when reducing the reference aperture diameter can be compensated to optimize the hologram fringe visibility.
#217184 - $15.00 USD Received 16 Jul 2014; revised 30 Aug 2014; accepted 31 Aug 2014; published 6 Oct 2014(C) 2014 OSA 20 October 2014 | Vol. 22, No. 21 | DOI:10.1364/OE.22.024959 | OPTICS EXPRESS 24968

Given the limitations of the approach demonstrated here as compared to obtaining 3D information via tomography [3,7], we anticipate the application of this 3D imaging method especially for weakly absorbing samples, e.g. for research in life science, in situations where the acquisition of many projection images is not possible. In particular, this is the case when the sample is structurally changing in time due to dynamic processes such as inherent or triggered dynamics or radiation damage. In this case, our approach allows to obtain 3D information on the sample from a single-view snapshot hologram in a diffract-before-destruct [11,12] approach.
Acknowledgments
Test samples were generated on the TU Berlin Nano-Werkbank, which was supported by EFRE under contract number 20072013 2/22. Support by BMBF Verbundforschung (05K10KTB) is gratefully acknowledged.
#217184 - $15.00 USD Received 16 Jul 2014; revised 30 Aug 2014; accepted 31 Aug 2014; published 6 Oct 2014(C) 2014 OSA 20 October 2014 | Vol. 22, No. 21 | DOI:10.1364/OE.22.024959 | OPTICS EXPRESS 24969
![RGB-D Face Recognition with Texture and Attribute Features · image and depth map using entropy, saliency, and HOG [7], (c) extracting geometric facial features from depth map, and](https://static.fdocuments.us/doc/165x107/5eb859dca72bf9193625a222/rgb-d-face-recognition-with-texture-and-attribute-image-and-depth-map-using-entropy.jpg)