


Extracellular Polymeric Substance Arch itecture...
33
1 Extracellular Polymeric Substance Architecture Influences Natural Genetic 1 Transformation of Acinetobacter baylyi in Biofilms 2 3 4 Robin T. Merod and Stefan Wuertz * 5 6 7 Department of Civil and Environmental Engineering, University of California, Davis, 8 One Shields Avenue, Davis, CA 95616, U.S.A. Phone: (530) 754 6407, Fax: (530) 752 9 7872 10 * Corresponding author, E-mail: [email protected] 11 12 13 Running title: EPS architecture influences natural genetic transformation 14 Keywords: Biofilm architecture; EPS; Transformation; Acinetobacter 15 16 17 AEM Accepts, published online ahead of print on 10 October 2014 Appl. Environ. Microbiol. doi:10.1128/AEM.01984-14 Copyright © 2014, American Society for Microbiology. All Rights Reserved. on June 3, 2018 by guest http://aem.asm.org/ Downloaded from
Transcript of Extracellular Polymeric Substance Arch itecture...
1
Extracellular Polymeric Substance Architecture Influences Natural Genetic 1
Transformation of Acinetobacter baylyi in Biofilms 2
3
4
Robin T. Merod and Stefan Wuertz* 5
6
7
Department of Civil and Environmental Engineering, University of California, Davis, 8
One Shields Avenue, Davis, CA 95616, U.S.A. Phone: (530) 754 6407, Fax: (530) 752 9
7872 10
* Corresponding author, E-mail: [email protected] 11
12
13
Running title: EPS architecture influences natural genetic transformation 14
Keywords: Biofilm architecture; EPS; Transformation; Acinetobacter 15
16
17
AEM Accepts, published online ahead of print on 10 October 2014Appl. Environ. Microbiol. doi:10.1128/AEM.01984-14Copyright © 2014, American Society for Microbiology. All Rights Reserved.
on June 3, 2018 by guesthttp://aem
.asm.org/
Dow
nloaded from

2
ABSTRACT 18
Genetic exchange by natural transformation is an important mechanism of 19
horizontal gene transfer in biofilms. Thirty-two biofilm metrics were quantified in a 20
Acinetobacter baylyi heavily encapsulated strain and a miniencapsulated mutant strain 21
accounting for cellular architecture, extracellular polymeric substances (EPS) architecture 22
and their combined biofilm architecture. In general, transformation location, abundance 23
and frequency were more correlated to EPS architecture than to cellular or their 24
combined architecture. Transformation frequency and transformant location had the 25
greatest correlation with the EPS metric surface area to biovolume ratio. Transformation 26
frequency peaked when EPS surface area to biovolume ratio was greater than 3 µm2/µm3 27
and less than 5 µm2/µm3. Transformant location shifted towards the biofilm-bulk fluid 28
interface as EPS surface area to biovolume ratio increased. Transformant biovolume was 29
most correlated with EPS biovolume and peaked when transformation occurred in close 30
proximity of the substratum. This study demonstrates that biofilm architecture influences 31
A. baylyi transformation frequency and transformant location. The major role of EPS may 32
be to facilitate the binding and stabilization of plasmid DNA for cellular uptake. 33
on June 3, 2018 by guesthttp://aem
.asm.org/
Dow
nloaded from

3
INTRODUCTION 34
35
Biofilms provide an optimal environment for the occurrence of horizontal gene 36
transfer such as natural genetic transformation, the active cellular uptake of free DNA. 37
Free DNA, naturally originating from cell lysis or active cellular secretion (7), is a central 38
component of biofilms (36) and has even been found in higher quantities than 39
intercellular genomic DNA (33). The capacity of biofilms to incorporate DNA into their 40
architecture prevents free DNA from escaping into the surrounding environment and 41
potentially protects free DNA from degradation. Subsequently, the high microbial density 42
of biofilms increases the probability that transformation competent cells come into 43
contact with free DNA. The microorganism Acinetobacter baylyi strain ADP1 is a good 44
experimental model for studying natural genetic transformation due to its naturally high 45
competence (5). Apposed to using planktonic cultures, its ability to form stable biofilms 46
makes it the organism of choice to investigate genetic transformation as it may occur in 47
the natural environment. 48
While nutrient conditions, biofilm maturity and mode of growth (10, 23, 26) have 49
been shown to effect natural genetic transformation in A. baylyi biofilms, the influence of 50
biofilm architecture (that is, the biofilm’s physical structure) has not been fully 51
established. Biofilm architecture is integral to microbial life and influences the functional 52
characteristics of the biofilm. For example, biofilm thickness, porosity, surface 53
roughness and cell cluster density contribute to mass transport limitations (16, 30), while 54
interconnecting channels facilitate mass transport throughout the biofilm’s depth (18, 25). 55
In turn, mass transport affects localized microbial diversity in multi-species biofilms (1, 56
on June 3, 2018 by guesthttp://aem
.asm.org/
Dow
nloaded from

4
34), which subsequently determines the extent of metabolic capabilities. We 57
hypothesized that biofilm architecture would also influence transformation frequency and 58
transformant location and abundance. 59
Many studies investigating biofilm architecture structure-function relationships 60
focus on the microbial distribution but ignore extracellular polymeric substances (EPS), 61
which exhibit a critical function in biofilms (2, 4). In this study, different architectures 62
were induced in monoculture A. baylyi biofilms by varying the number of biofilm 63
establishing cells and biofilm developmental nutrient conditions. Additionally, the 64
influence of EPS architecture was determined by using the heavily encapsulated strain 65
BD4 and the miniencapsulated mutant strain ADP1 (12). Various metrics of cellular, EPS 66
and overall biofilm architecture were quantified in situ to elucidate their effect on natural 67
genetic transformation. 68
69
70
MATERIALS AND METHODS 71
72
Bacterial strains, plasmids and media. Acinetobacter baylyi strain BD4 and A. 73
baylyi strain ADP1 (35), previously referenced as Acinetobacter sp. strain ADP1, were 74
used as model biofilm forming organisms. The plasmid pGAR38, a Mob+ Tra- 75
gentamicin and tetracycline resistant IncQ plasmid, was used as the model DNA element 76
for transformation. pGAR38 is pML10 (15) containing the wild-type gfp (green 77
fluorescent protein) gene (Clontech, Palo Alto, California) under regulation of a PpsbA 78
promoter (8). Induction of the promoter was not necessary. Brain and heart infusion 79
on June 3, 2018 by guesthttp://aem
.asm.org/
Dow
nloaded from

5
(BHI) medium, mineral medium M9 (31) and 0.01 M MgSO4 were used during 80
transformation experiments. 81
Biofilm growth and transformation. Biofilms were grown in stainless steel, 82
multi-lane flow cells previously described by Hendrickx et al. (9) under continuous flow 83
conditions. The entire system was autoclaved prior to experimentation. Prior to flow cell 84
inoculation, all cultures were washed three times in 1x PBS after having been grown 85
overnight in BHI at 30°C. A 250-μL volume of washed cells containing either 107 or 109 86
cells was inoculated into flow cell lanes and allowed to settle for 2 h before starting 87
continuous flow of the growth media indicated in TABLE 1. All biofilms were grown 88
with a flow rate of 2.5 ml/h in a constant temperature chamber at 30°C. 89
Each strain was subjected to four different growth conditions (see TABLE 1) in 90
order to manipulate the formation of architectural characteristics. For each growth 91
condition, two biofilms were grown in the same flow cell to obtain replicate biofilm 92
architectures prior to transformation (6). Biofilms were allowed to grow for 3 days prior 93
to being washed of growth media for 12 hrs with M9 containing no carbon source. 94
Following the wash step, one of the two biofilms underwent transformation with 95
2.5 μg/ml of pGAR38 in M9 containing 0.2% pyruvate. The remaining biofilm was 96
sacrificed to visualize the initial EPS and cellular architecture. For transformation, a 97
volume of 500 μl was pumped into flow channels equating to 1.25 μg pGAR38 applied 98
over the time course of 12 minutes. The plasmid containing medium was then switched to 99
M9 containing 0.2% pyruvate without DNA to allow GFP expression and maturation. 100
After 3 days, the biofilm was visualized for cells, EPS and transformants using confocal 101
laser scanning microscopy (CLSM). 102
on June 3, 2018 by guesthttp://aem
.asm.org/
Dow
nloaded from

6
Biofilm staining and CLSM observation and image acquisition. Biofilms were stained 103
under continuous flow for 1 hour and then washed with 0.01M MgSO4 for 30 minutes. 104
Cells were stained with 5 μM Syto60 (Molecular Probes, Eugene, Oregon) suspended in 105
0.01 M MgSO4. EPS was stained with 0.05% (by weight) SOLOPHENYL® flavine 106
(SPF; Huntsman Int. LLC, High Point, North Carolina) suspended in 0.01 M MgSO4 and 107
filtered using a 0.2 μm sterilization filter (11). 108
Flow cells were mounted on a Zeiss 510 META CLSM (Carl Zeiss, Jena, 109
Germany) motorized stage and visualized using a 63 x /1.2 NA (C-Apochromat) water 110
immersion objective lens. Syto60 stained cells were scanned using a 633 nm helium laser 111
with a 650 nm long pass filter. EPS stained with SPF and GFP expressing transformants 112
were scanned using a 488 nm argon laser with a 505 nm long pass filter. EPS was stained 113
and visualized after transformant detection. 114
Twenty-one CLSM image stacks were acquired from each biofilm to obtain a 115
representative sample of architectural variation (14). Automatic acquisition was 116
accomplished using the MultiTime Series (MTS) macro supplemental to Zeiss’s CLSM 117
interface software. Scanning locations were limited to the central 20 mm region of the 118
flow lane to exclude entrance and exiting flow effects on biofilm architecture occurring 119
10 mm from the inlet and outlet. Scanning was also limited to 1.5 mm from the channel 120
walls to exclude excessive biofilm accumulation. Z-stacks scanned from a single biofilm 121
contained the same number of images. The number of images was set to capture the 122
thickest part of the biofilm. Images had a pixel resolution of 0.2856 µm/pixel. The z-step 123
for images in a z-stack was 0.75 µm. In accordance with optimal settings described by 124
Sekar et al. (32), images were acquired utilizing a 1x digital magnification, a pinhole 125
on June 3, 2018 by guesthttp://aem
.asm.org/
Dow
nloaded from

7
setting of 1 airy unit and a scan average of 2; the detector gain (500 to 550 arbitrary 126
units), amplifier offset (0 to 0.05 arbitrary units) and laser intensity (10% to 25%) were 127
set to obtain adequately contrasted grey-scale images based on the brightest region of the 128
biofilm that was scanned. 129
Image analysis. Semi-automated image analysis was performed utilizing the 130
programs Auto PHLIP-ML (19) and PHLIP (22). Auto PHLIP-ML (available at 131
http://sourceforge.net/projects/auto-phlip-ml/) calculates an Otsu threshold for image 132
stacks not biased by extraneous images (images without pixels of biological 133
significance). Extraneous images are identified and removed based on their area coverage 134
of biomass as described by Merod et al. (19). The percent area coverage value used for 135
extraneous image removal (PACVEIR) identifying the substratum was set at 1%. The 136
bulk-media interface was defined by the limit of EPS and iteratively determined to be a 137
PACVEIR of either 0% or 0.005%. PHLIP version 0.7, a MatLab-based image analysis 138
toolbox freely available from the PHLIP Website 139
(http://www.itqb.unl.pt:1141/~webpages/phlip/), was used to quantify architectural 140
metrics for each z-stack. The Auto PHLIP-ML calculated Otsu threshold for transformant 141
images was overridden with manually set thresholds due to under thresholding. 142
The following biofilm architectural metrics are included in PHLIP v0.7 and 143
described by Mueller et al. (22): 144
• Biovolume - the volume of cellular biomass, transformant biomass, EPS 145
biomass, or cellular-and-EPS (overall) biomass; 146
• Surface area to biovolume ratio – the surface area of the biomass divided by 147
the biovolume; 148
on June 3, 2018 by guesthttp://aem
.asm.org/
Dow
nloaded from

8
• Mean thickness – the average thickness of the biomass; 149
• Roughness – a measure of how much the biomass thickness varies; and 150
• Horizontal, vertical, and total spatial spreading – a characterization of the 151
spreading of the biomass in space. 152
Scripts for the following architectural metrics were added to the single-channel and all-153
channel image processing operations of PHLIP: 154
• Porosity (μm3/ μm3) - calculated as the difference between total volume and 155
biovolume divided by the total volume, where total volume was calculated as 156
the biomass mean thickness multiplied by the z-stack x, y area; 157
• Maximum thickness (μm) - calculated as the number of images in the z-stack 158
multiplied by the z-step (the μm distance between each image); 159
• Surface area (μm2) - calculated as the product of biovolume and surface area 160
to biovolume ratio; and 161
• Normalized mean location (NML) of biomass - calculated as described by 162
Hendrickx et al. (10). Normalized mean location ranges from 0 (substratum) 163
to 1 (biofilm bulk-media interface) and provides a normalized z-location for 164
the majority of biomass. 165
( )
k
k
iiiii
zV
AzzzNML
×
×−×=
=+
01
166
where, 167
=iz distance from the substratum at image i (μm) 168
=kz maximum thickness of biomass (μm) 169
on June 3, 2018 by guesthttp://aem
.asm.org/
Dow
nloaded from

9
=iA area coverage of biomass at image i (μm2) 170
=V biovolume of biomass in z-stack (μm3) 171
Architectural metrics were calculated for both the cellular component and EPS 172
component of the biofilm using PHLIP’s single-channel processing. The overall 173
architecture for each metric was calculated using PHLIP’s all-channel image processing, 174
which superimposed the cellular channel and EPS channel. The 3D colocalization of 175
cells-and-transformants was defined to equal the transformation frequency (i.e., 176
biovolume of transformants per biovolume of cells). The biovolume of transformants was 177
calculated by multiplying the transformation frequency by the biovolume of cells. 178
Statistical analysis. The architecture of sacrificed biofilms was used to replicate 179
the initial architecture (i.e. the architecture prior to transformation) of the biofilm used for 180
transformation that developed under identical growth conditions. Three-way ANOVA 181
was used on the initial architecture characteristics to determine if biofilms displayed 182
significantly different architectures when grown under different media conditions. The 183
factors for the three-way ANOVA were biofilm-type (eight levels - two A. baylyi strains, 184
each with four treatments (Table 1)), architectural component (three levels - cellular, 185
EPS, and overall), and architecture metric (ten levels - biovolume, NML, porosity, mean 186
thickness, roughness, horizontal spreading, vertical spreading, total spreading, surface 187
area, and surface area to biovolume ratio). Each architectural metric had a sample number 188
of 21. Based on this design, each biofilm-type has three architectural components, and 189
each architectural component has 10 architecture metrics. Therefore, the architecture of 190
each biofilm-type was quantified by 30 levels of measurement. 191
on June 3, 2018 by guesthttp://aem
.asm.org/
Dow
nloaded from

10
Spearmen rank order analysis was used to determine which initial architecture 192
metrics correlated with transformation frequency, transformant biovolume, or 193
transformant NML. Each architectural metric had a sample number of 168, corresponding 194
to 8 biofilms each with 21 z-stacks. The Spearmen Rank Order Correlation coefficient 195
(rs) has a value range from +1 to -1. Coefficient values were defined to have the 196
following level of correlation: 0.75 ≤ rs < 1 and -0.75 ≥ rs > -1 were strong; 0.50 ≤ rs < 197
0.75 and -0.50 ≥ rs > -0.75 were intermediate; 0.25 ≤ rs < 0.50 and -0.25 ≥ rs > -0.50 were 198
weak; and -0.25 < rs < 0.25 had no correlation. Only correlations with a p-value less than 199
0.05 were considered to be significant. Positive values had a positive correlation and 200
negative values had a negative correlation. SigmaStat version 3.5 (Systat Software, Inc.) 201
was used for all statistical analyses. 202
203
204
RESULTS 205
206
Effect of growth conditions on biofilm architecture. To determine the role that 207
biofilm architecture plays in natural genetic transformation, different architectures were 208
induced. The wild-type strain A. baylyi strain BD4 and the miniencapsulated EPS mutant 209
A. baylyi strain ADP1 were used to investigate the effect of differences in EPS. 210
Additionally, different growth conditions were utilized during biofilm development to 211
promote architectural differences between biofilms (Table 1). Brain heart infusion 212
medium was chosen to provide a rich, unlimiting growth environment and promote a 213
on June 3, 2018 by guesthttp://aem
.asm.org/
Dow
nloaded from
11
“fluffy” architecture, while M9 medium with different concentrations of gluconate was 214
used to induce more dense biofilm architectures. 215
The architecture of each biofilm was quantified by 30 levels of measurement. 216
Three-way ANOVA allowed us evaluate if the eight biofilms had significant differences 217
in architecture. The Tukey test on three-way ANOVA results showed a significant 218
difference between all biofilm pairwise comparisons (P < 0.05) except for two: 219
ADP1_Gluc_109 vs. BD4_BHI_109 and ADP1_BHI_107 vs. BD4_Gluc_109 (biofilm 220
names have the notation of ‘strain_growth media_inoculation cell number.’). Based on 221
these results we concluded that sufficient architectural variation exists to evaluate the 222
effect of architecture on transformation frequency and location. 223
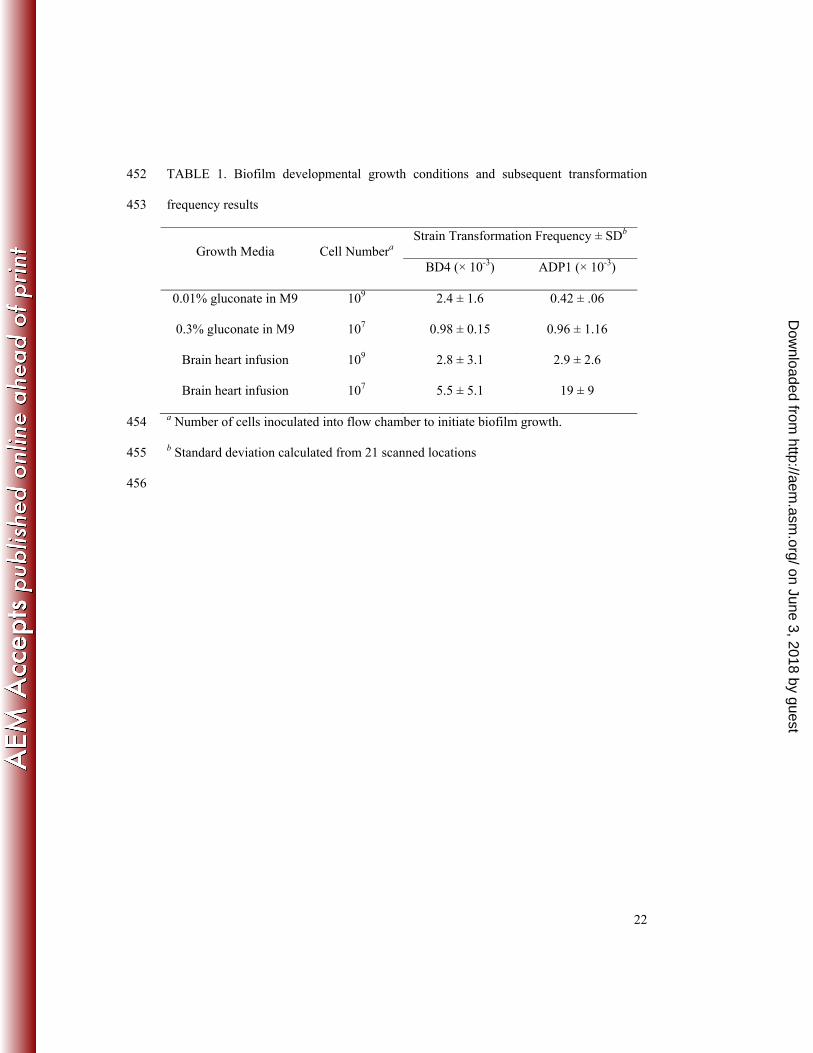
Effect of biofilm architecture on transformation frequency. The average 224
transformation frequency ranged from 0.019 to 0.00042 measured as transformant 225
biovolume per cellular biovolume (Table 1). As expected, the miniencapsulated mutant 226
strain ADP1, which is known to be highly competent, exhibited the greatest 227
transformation frequency. Cellular, EPS and overall biofilm architecture were 228
investigated to determine their influence on transformation frequency. Biofilm 229
architecture was measured using ten architectural metrics (see Materials and Methods – 230
Image Analysis). Additionally, 3D colocalization of cells-and-EPS and maximum 231
thickness were examined, totaling a comparison of thirty-two architectural metrics. Five 232
out of the thirty-two metrics correlated weakly with transformation frequency (Table 2). 233
No comparisons resulted in a strong or intermediate correlation. EPS surface area to 234
biovolume ratio was the most correlated, with an rs value of -0.42 and a p-value less than 235
on June 3, 2018 by guesthttp://aem
.asm.org/
Dow
nloaded from

12
0.001. Transformation frequency peaked when EPS surface area to biovolume ratio was 236
greater than 3 µm2/ µm3 but less than 5 µm2/ µm3 (Fig. 1). 237
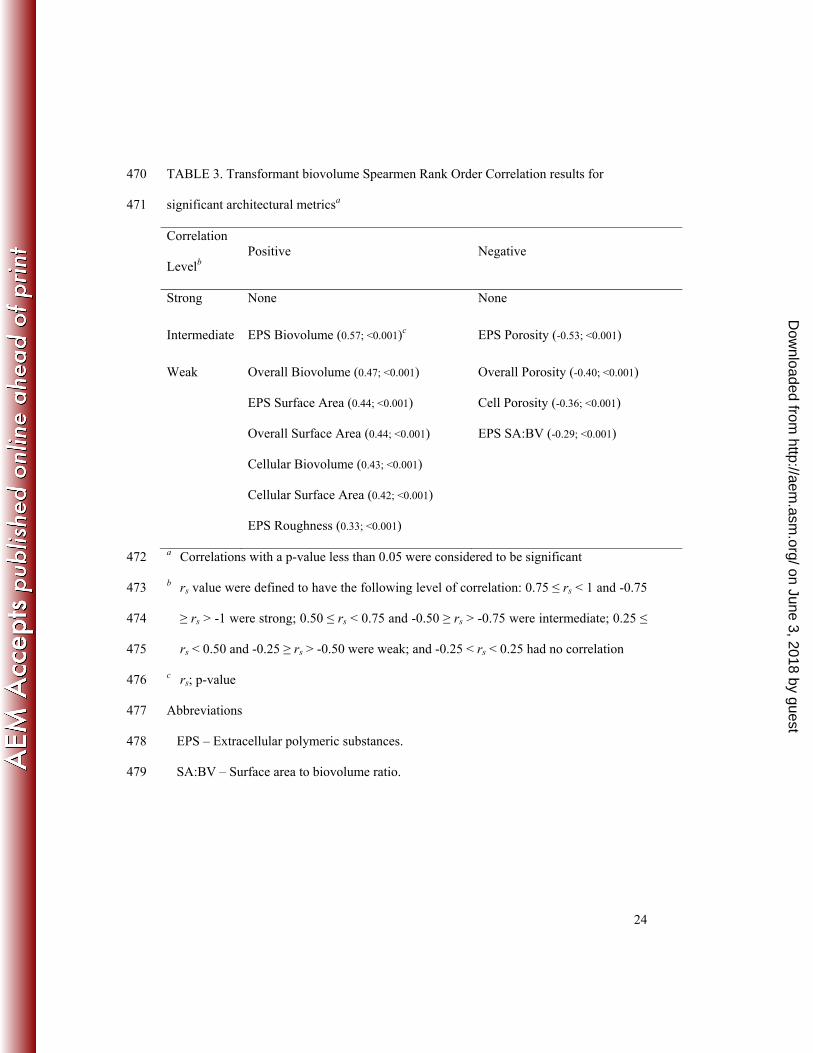
Effect of biofilm architecture on transformant biovolume. Transformant 238
biovolume underwent the same Spearman Rank Order correlation analysis performed on 239
transformation frequency. As with transformation frequency, transformant biovolume did 240
not strongly correlate with any of the thirty-two architectural metrics. However, 241
transformant biovolume had an intermediate correlation with EPS biovolume and EPS 242
porosity. Nine other architectural metrics had a weak correlation (Table 3). In general, the 243
metrics biovolume, porosity and surface area for each aspect of biofilm architecture (i.e., 244
cellular, EPS and overall) were correlated with transformant biovolume. Transformant 245
biovolume peaked when transformation occurred in close proximity of the substratum. 246
Effect of biofilm architecture on transformant location. Similar to 247
transformation frequency and transformant biovolume, the same biofilm architecture 248
metrics were investigated to determine their influence on transformant normalized mean 249
location (NML). Twenty-one out of thirty-two metrics correlated with transformant NML 250
(Table 4). The top five correlated metrics were all a measure of EPS architecture. The 251
metric EPS surface area to biovolume ratio was strongly positively correlated (Fig. 2), 252
while EPS NML (Fig. 3), porosity, total spreading and vertical spreading were 253
intermediately positively correlated. Of the remaining sixteen comparisons, fourteen 254
(five cellular, two EPS, six overall architectural metrics, and maximum thickness) were 255
weakly positively correlated to transformant NML and two were weakly negatively 256
correlated (EPS biovolume and 3D colocalization of cellular-and-EPS). 257
258
on June 3, 2018 by guesthttp://aem
.asm.org/
Dow
nloaded from
13
259
DISCUSSION 260
261
We investigated whether monoculture A. baylyi biofilm architecture – in terms of 262
cellular, EPS and their combined characteristics – influences the efficiency of gene 263
transfer by transformation. Previous studies have implicated the high cell density of 264
biofilms as a major influence on transformation efficiency (9, 17, 20). Li et al. (17) 265
showed that natural genetic transformation was 10 to 600 times more frequent in 266
Streptococcus mutans biofilms than in planktonic cultures. Additionally, Hendrickx et al. 267
(9) showed that transformation is detectable in A. baylyi biofilms with a concentration as 268
low as 1 fg of plasmid DNA per mL. The present study demonstrates that A. baylyi 269
biofilm architecture has a varying degree of influence on transformation frequency, 270
transformant volume and transformant location. 271
Because nutrient conditions are known to influence natural competence (23, 24, 272
27, 28), biofilms in this study were washed prior to transformation to avoid growth media 273
induced competence variability. Perumbakkam et al. (29) and Hendrickx et al. (9), 274
previously showed that transformants were most abundant in areas with high cellular 275
density. Corresponding with results from Hendrickx et al., transformation biovolume in 276
this study peaked near the biofilm substratum (Fig. 4), which typically had high cell 277
densities (Fig. 5). However, transformant biovolume had a greater positive correlation 278
with EPS and overall biovolume than with cellular biovolume (Table 3), suggesting that 279
cell density is not the major factor governing the occurrence of transformation and that 280
transformants may not be randomly distributed in the biofilm. Unlike in planktonic 281
on June 3, 2018 by guesthttp://aem
.asm.org/
Dow
nloaded from
14
cultures, development of competency will be affected by a cell’s location in a biofilm, 282
which may be at a different growth stage than other cells in the biofilm or may be 283
experiencing different substrate concentrations. Notably, EPS architecture was not 284
measured in the investigations performed by Perumbakkam et al. (29) and Hendrickx et 285
al. (9). Specifically, competency may not be uniform throughout the biofilm but may 286
develop in some subpopulations but not others leading to the phenomenon of bistability 287
(3). This phenomenon may have played a role in the biofilms that did not have 288
significantly different architectures but did have different transformation frequencies. 289
Of the three biovolume metrics, EPS biovolume had the greatest Spearman Rank 290
Order correlation with transformant biovolume (Table 3). Additionally, although 291
transformant biovolume was not strongly correlated with any architectural metrics, the 292
two metrics with the greatest Spearman Rank Order correlation were a measure of EPS 293
architecture. The importance of EPS architecture is also apparent in its influence on 294
transformant NML, where the top five correlated metrics were also measures of EPS 295
architecture (Table 4). In particular, EPS surface area to biovolume ratio had the greatest 296
Spearman Rank Order correlation to both transformation frequency (Table 2) and 297
transformation NML (Table 4). 298
While BD4 has been described as being highly competent (12), to our knowledge 299
the transformation efficiency of BD4 planktonic cultures or biofilms has not previously 300
been quantified. Historically, the miniencapsulated ADP1 has been used for 301
experimentation due to its ease of use in liquid cultures; the copiously capsulated BD4 302
can be problematic in protocols requiring centrifugation because it does not pellet 303
sufficiently. Although it has been shown that the capsule of BD4 does not prevent 304
on June 3, 2018 by guesthttp://aem
.asm.org/
Dow
nloaded from

15
transformation (12), we hypothesized that its capsulization would reduce transformation 305
frequency. Kaplan et al. (13) showed that BD4 produces four times the amount of the 306
primary capsular polysaccharide component, L-rhamnose, compared to ADP1. While 307
these results were obtained using liquid cultures, similar differences in EPS production 308
were also observed in biofilms of this study, where BD4 EPS biovolume was typically 309
twice that of ADP1 biofilms). However, despite increased EPS, a BD4 biofilm had the 310
second greatest average transformation frequency (Table 1). 311
The major role of EPS may be facilitating the binding and stabilization of plasmid 312
DNA for cellular uptake. Specifically, an optimized ratio of EPS surface area to 313
biovolume was necessary to enhance transformation frequency (Fig. 1). A high ratio 314
value increases interconnecting channels, which can facilitate transport to deeper biofilm 315
regions (18, 25). However, a high surface area also increases the chances of plasmid 316
DNA adhesion close to the bulk media interface before the DNA can penetrate into the 317
biofilm. As a result, when the ratio increases, transformants are found closer to the bulk 318
media interface (Fig. 2). The lower observed volume of transformants at the biofilm-bulk 319
liquid interface may be a result of cellular erosion (21). 320
In conclusion, the main effect of EPS on natural transformation in biofilms is due 321
to its architectural characteristics, and not the relative amount of EPS present. This effect 322
of EPS architecture on transformation may also be apparent in biofilms of other A. baylyi 323
strains, which have been characterized as being highly competent (35). Future research 324
quantifying the amount of retained DNA based on biofilm architecture would further 325
benefit this area of study. 326
327
on June 3, 2018 by guesthttp://aem
.asm.org/
Dow
nloaded from

16
328
ACKNOWLEDGEMENTS 329
330
The publication of this manuscript is dedicated to the memory of Larissa 331
Hendrickx. RM was partially funded by an industry-supported fellowship under the 332
Training Program in Biomolecular Technology at the University of California, Davis and 333
from the NEAT-IGERT program sponsored by the National Science Foundation (IGERT 334
Grant DGE-9972741). 335
336
337
REFERENCES 338
339
1. Bishop, P. L., and N. E. Kinner. 1986. Aerobic fixed-film processes, p. 113-176. 340
In W. Schoenborn (ed.), Biotechnology: a Comprehensive Treatise, vol. 8. VCH 341
Publishers, Inc., New York. 342
2. Czaczyk, K., and K. Myszka. 2007. Biosynthesis of extracellular polymeric 343
substances (EPS) and its role in microbial biofilm formation. Polish Journal of 344
Environmental Studies 16:799-806. 345
3. Dubnau, D., and R. Losick. 2006. Bistability in bacteria. Molecular 346
Microbiology 61:564-572. 347
4. Flemming, H. C., and J. Wingender. 2003. The crucial role of extracellular 348
polymeric substances in biofilms. In S. Wuertz, P. L. Bishop, and P. A. Wilderer 349
(ed.), Biofilms in Wastewater Treatment. IWA. 350
on June 3, 2018 by guesthttp://aem
.asm.org/
Dow
nloaded from

17
5. Gerischer, U. (ed.). 2008. Acinetobacter: Molecular Biology. Caister Academic 351
Press. 352
6. GrayMerod, R., L. Hendrickx, L. N. Mueller, J. B. Xavier, and S. Wuertz. 353
2005. Effect of nucleic acid stain Syto9 on nascent biofilm architecture of 354
Acinetobacter sp. BD413. Water Science and Technology 52:195-202. 355
7. Hara, T., and S. Ueda. 1981. A Study on the mechanism of DNA excretion from 356
P. aeruginosa KYU-1 - effect of mitomycin-C on extracellular DNA production. 357
Agricultural and Biological Chemistry 45:2457-2461. 358
8. Hendrickx, L. 2002. Natural genetic transformation in Acinetobacter sp. BD413 359
biofilms: Introducing natural genetic transformation as a tool for 360
bioenhancements of biofilm reactors. Thesis report. Technical University of 361
Munich. 362
9. Hendrickx, L., M. Hausner, and S. Wuertz. 2003. Natural genetic 363
transformation in monoculture Acinetobacter sp. strain BD413 biofilms. Applied 364
and Environmental Microbiology 69:1721-1727. 365
10. Hendrickx, L., and S. Wuertz. 2004. Investigating in situ natural genetic 366
transformation of Acinetobacter sp. BD413 in biofilms with confocal laser 367
scanning microscopy. In J. K. Setlow (ed.), Genetic Engineering: Principles and 368
Methods, vol. 26. Kluwer Academic/Plenum Publishers, New York. 369
11. Hoch, H. C., C. D. Galvani, D. H. Szarowski, and J. N. Turner. 2005. Two 370
new fluorescent dyes applicable for visualization of fungal cell walls. Mycologia 371
97:580-588. 372
on June 3, 2018 by guesthttp://aem
.asm.org/
Dow
nloaded from

18
12. Juni, E., and A. Janik. 1969. Transformation of Acinetobacter calco-aceticus 373
(Bacterium anitratum). Journal of Bacteriology 98:281-&. 374
13. Kaplan, N., and E. Rosenberg. 1982. Exopolysaccharide distribution of and 375
bioemulsifier production by Acinetobacter-calcoaceticus BD4 and BD413. 376
Applied and Environmental Microbiology 44:1335-1341. 377
14. Korber, D. R., J. R. Lawrence, M. J. Hendry, and D. E. Caldwell. 1992. 378
Programs for determining statistically representative areas of microbial biofilms. 379
Binary Computing in Microbiology 4:204-210. 380
15. Labes, M., A. Puhler, and R. Simon. 1990. A new family of RSF1010-derived 381
expression and lac-fusion broad-host-range vectors for gram-negative bacteria. 382
Gene 89:37-46. 383
16. Lewandowski, Z., and H. Beyenal. 2003. Mass transport in heterogeneous 384
biofilms. In S. Wuertz, P. L. Bishop, and P. A. Wilderer (ed.), Biofilms in 385
Wastewater Treatment. IWA. 386
17. Li, Y. H., P. C. Y. Lau, J. H. Lee, R. P. Ellen, and D. G. Cvitkovitch. 2001. 387
Natural genetic transformation of Streptococcus mutans growing in biofilms. 388
Journal of Bacteriology 183:897-908. 389
18. Massoldeya, A. A., J. Whallon, R. F. Hickey, and J. M. Tiedje. 1995. Channel 390
structures in aerobic biofilms of fixed-film reactors treating contaminated 391
groundwater. Applied and Environmental Microbiology 61:769-777. 392
19. Merod, R. T., J. E. Warren, H. McCaslin, and S. Wuertz. 2007. Toward 393
automated analysis of biofilm architecture: Bias caused by extraneous confocal 394
on June 3, 2018 by guesthttp://aem
.asm.org/
Dow
nloaded from
19
laser scanning microscopy images. Applied and Environmental Microbiology 395
73:4922-4930. 396
20. Molin, S., and T. Tolker-Nielsen. 2003. Gene transfer occurs with enhanced 397
efficiency in biofilms and induces enhanced stabilisation of the biofilm structure. 398
Current Opinion in Biotechnology 14:255-261. 399
21. Morgenroth, E. 2003. Detachment: an often-overlooked phenomenon in biofilm 400
research and modeling. In S. Wuertz, P. L. Bishop, and P. A. Wilderer (ed.), 401
Biofilms in Wastewater Treatment. IWA. 402
22. Mueller, L. N., J. F. de Brouwer, J. S. Almeida, L. J. Stal, and J. B. Xavier. 403
2006. Analysis of a marine phototrophic biofilm by confocal laser scanning 404
microscopy using the new image quantification software PHLIP. BMC Ecology 405
6:1. 406
23. Nielsen, K. M., A. M. Bones, and J. D. vanElsas. 1997. Induced natural 407
transformation of Acinetobacter calcoaceticus in soil microcosms. Applied and 408
Environmental Microbiology 63:3972-3977. 409
24. Nielsen, K. M., M. D. M. vanWeerelt, T. N. Berg, A. M. Bones, A. N. Hagler, 410
and J. D. vanElsas. 1997. Natural transformation and availability of transforming 411
DNA to Acinetobacter calcoaceticus in soil microcosms. Applied and 412
Environmental Microbiology 63:1945-1952. 413
25. Okabe, S., H. Kuroda, and Y. Watanabe. 1998. Significance of biofilm 414
structure on transport of inert particulates into biofilms. Water Science and 415
Technology 38:163-170. 416
on June 3, 2018 by guesthttp://aem
.asm.org/
Dow
nloaded from
20
26. Palmen, R., P. Buijsman, and K. J. Hellingwerf. 1994. Physiological regulation 417
of competence induction for natural transformation in Acinetobacter 418
calcoaceticus. Archives of Microbiology 162:344-351. 419
27. Palmen, R., B. Vosman, P. Buijsman, C. K. D. Breek, and K. J. Hellingwerf. 420
1993. Physiological characterization of natural transformation in Acinetobacter-421
calcoaceticus. Journal of General Microbiology 139:295-305. 422
28. Paul, J. H., M. E. Frischer, and J. M. Thurmond. 1991. Gene-transfer in 423
marine water column and sediment microcosms by natural plasmid 424
transformation. Applied and Environmental Microbiology 57:1509-1515. 425
29. Perumbakkam, S., T. F. Hess, and R. L. Crawford. 2006. A bioremediation 426
approach using natural transformation in pure-culture and mixed-population 427
biofilms. Biodegradation 17:545-57. 428
30. Picioreanu, C., M. C. M. van Loosdrecht, and J. J. Heijnen. 2000. A 429
theoretical study on the effect of surface roughness on mass transport and 430
transformation in biofilms. Biotechnology and Bioengineering 68:355-369. 431
31. Sambrook, J., E. F. Fritsch, and T. Maniatis. 1989. Molecular cloning: a 432
laboratory manual, 2nd ed. Cold Spring Harbor Laboratory, Cold Spring Harbor, 433
N.Y. 434
32. Sekar, R., T. Griebe, and H. C. Flemming. 2002. Influence of image acquisition 435
parameters on quantitative measurements of biofilms using confocal laser 436
scanning microscopy. Biofouling 18:47-56. 437
on June 3, 2018 by guesthttp://aem
.asm.org/
Dow
nloaded from

21
33. Steinberger, R. E., and P. A. Holden. 2005. Extracellular DNA in single- and 438
multiple-species unsaturated biofilms. Applied and Environmental Microbiology 439
71:5404-5410. 440
34. Stoodley, P., K. Sauer, D. G. Davies, and J. W. Costerton. 2002. Biofilms as 441
complex differentiated communities. Annual Review of Microbiology 56:187-442
209. 443
35. Vaneechoutte, M., D. M. Young, L. N. Ornston, T. De Baere, A. Nemec, T. 444
Van Der Reijden, E. Carr, I. Tjernberg, and L. Dijkshoorn. 2006. Naturally 445
transformable Acinetobacter sp strain ADP1 belongs to the newly described 446
species Acinetobacter baylyi. Applied and Environmental Microbiology 72:932-447
936. 448
36. Whitchurch, C. B., T. Tolker-Nielsen, P. C. Ragas, and J. S. Mattick. 2002. 449
Extracellular DNA required for bacterial biofilm formation. Science 295:1487-450
1487.451
on June 3, 2018 by guesthttp://aem
.asm.org/
Dow
nloaded from
22
TABLE 1. Biofilm developmental growth conditions and subsequent transformation 452
frequency results 453
Growth Media Cell Numbera Strain Transformation Frequency ± SDb
BD4 (× 10-3) ADP1 (× 10-3)
0.01% gluconate in M9 109 2.4 ± 1.6 0.42 ± .06
0.3% gluconate in M9 107 0.98 ± 0.15 0.96 ± 1.16
Brain heart infusion 109 2.8 ± 3.1 2.9 ± 2.6
Brain heart infusion 107 5.5 ± 5.1 19 ± 9
a Number of cells inoculated into flow chamber to initiate biofilm growth. 454
b Standard deviation calculated from 21 scanned locations 455
456
on June 3, 2018 by guesthttp://aem
.asm.org/
Dow
nloaded from

23
TABLE 2. Transformation frequency Spearmen Rank Order Correlation results for 457
significant architectural metricsa 458
Correlation
Levelb Positive Negative
Strong None None
Intermediate None None
Weak 3D Coloc Cellular-EPS (0.38; <0.001)c EPS SA:BVe (-0.42; <0.001)
EPS Biovolume (0.28; <0.001) EPS Porosity (-0.27; <0.001)
Overall NML (-0.25; 0.001)
a Correlations with a p-value less than 0.05 were considered to be significant. 459
b rs value were defined to have the following level of correlation: 0.75 ≤ rs < 1 and -0.75 460
≥ rs > -1 were strong; 0.50 ≤ rs < 0.75 and -0.50 ≥ rs > -0.75 were intermediate; 0.25 ≤ 461
rs < 0.50 and -0.25 ≥ rs > -0.50 were weak; and -0.25 < rs < 0.25 had no correlation. 462
c rs; p-value 463
Abbreviations: 464
3D Coloc Cellular-EPS – Three dimensional colocalization of cellular-and-EPS. 465
EPS – Extracellular polymeric substances. 466
NML – Normalized mean location. 467
SA:BV – Surface area to biovolume ratio. 468
469
on June 3, 2018 by guesthttp://aem
.asm.org/
Dow
nloaded from
24
TABLE 3. Transformant biovolume Spearmen Rank Order Correlation results for 470
significant architectural metricsa 471
Correlation
Levelb Positive Negative
Strong None None
Intermediate EPS Biovolume (0.57; <0.001)c EPS Porosity (-0.53; <0.001)
Weak Overall Biovolume (0.47; <0.001) Overall Porosity (-0.40; <0.001)
EPS Surface Area (0.44; <0.001) Cell Porosity (-0.36; <0.001)
Overall Surface Area (0.44; <0.001) EPS SA:BV (-0.29; <0.001)
Cellular Biovolume (0.43; <0.001)
Cellular Surface Area (0.42; <0.001)
EPS Roughness (0.33; <0.001)
a Correlations with a p-value less than 0.05 were considered to be significant 472
b rs value were defined to have the following level of correlation: 0.75 ≤ rs < 1 and -0.75 473
≥ rs > -1 were strong; 0.50 ≤ rs < 0.75 and -0.50 ≥ rs > -0.75 were intermediate; 0.25 ≤ 474
rs < 0.50 and -0.25 ≥ rs > -0.50 were weak; and -0.25 < rs < 0.25 had no correlation 475
c rs; p-value 476
Abbreviations 477
EPS – Extracellular polymeric substances. 478
SA:BV – Surface area to biovolume ratio. 479
on June 3, 2018 by guesthttp://aem
.asm.org/
Dow
nloaded from

25
TABLE 4. Transformant NML Spearmen Rank Order Correlation results for significant 480
architectural metrics 481
Correlation
Levela Positive Negative
Strong EPS SA:BV (0.75; <0.001)b None
Intermediate EPS Porosity (0.63; <0.001) None
EPS NML (0.55; <0.001)
EPS Total Spreading (0.54; <0.001)
EPS Vertical Spreading (0.50; <0.001)
Weak Overall Vertical Spreading (0.45; <0.001) EPS Biovolume (-0.40; <0.001)
Max Thickness (0.45; <0.001) 3D Coloc Cellular-EPS (-0.26; <0.001)
Cellular Vertical Spreading (0.44; <0.001)
Overall SA:BVa (0.43; <0.001)
Overall NML (0.43; <0.001)
Cellular Mean Thickness (0.41; <0.001)
Cellular NML (0.40; <0.001)
EPS Horizontal Spreading (0.39; <0.001)
Overall Mean Thickness (0.38; <0.001)
Overall Porosity (0.38; <0.001)
Overall Total Spreading (0.28; <0.001)
Cellular Porosity (0.28; <0.001)
EPS Mean Thickness (0.27; <0.001)
Cellular Total Spreading (0.26; <0.001)
on June 3, 2018 by guesthttp://aem
.asm.org/
Dow
nloaded from

26
a rs value were defined to have the following level of correlation: 0.75 ≤ rs < 1 and -0.75 482
≥ rs > -1 were strong; 0.50 ≤ rs < 0.75 and -0.50 ≥ rs > -0.75 were intermediate; 0.25 ≤ 483
rs < 0.50 and -0.25 ≥ rs > -0.50 were weak; and -0.25 < rs < 0.25 had no correlation 484
b rs;p-value 485
Abbreviations: 486
3D Coloc Cellular-EPS – Three dimensional colocalization of cellular-and-EPS. 487
EPS – Extracellular polymeric substances. 488
NML – Normalized mean location. 489
SA:BV – Surface area to biovolume ratio. 490
on June 3, 2018 by guesthttp://aem
.asm.org/
Dow
nloaded from

27
FIG. 1. Correlation of transformation frequency and EPS surface area to 491
biovolume ratio. The Spearman Rank Order correlation coefficient, rs, is -0.42 with a p-492
value of <0.001. The reference line at 0.01 shows that transformation frequency peaked 493
when EPS surface area to biovolume ratio was greater than 3 µm2/µm3 and less than 5 494
µm2/µm3. Each data point represents the result from one scanned location. 495
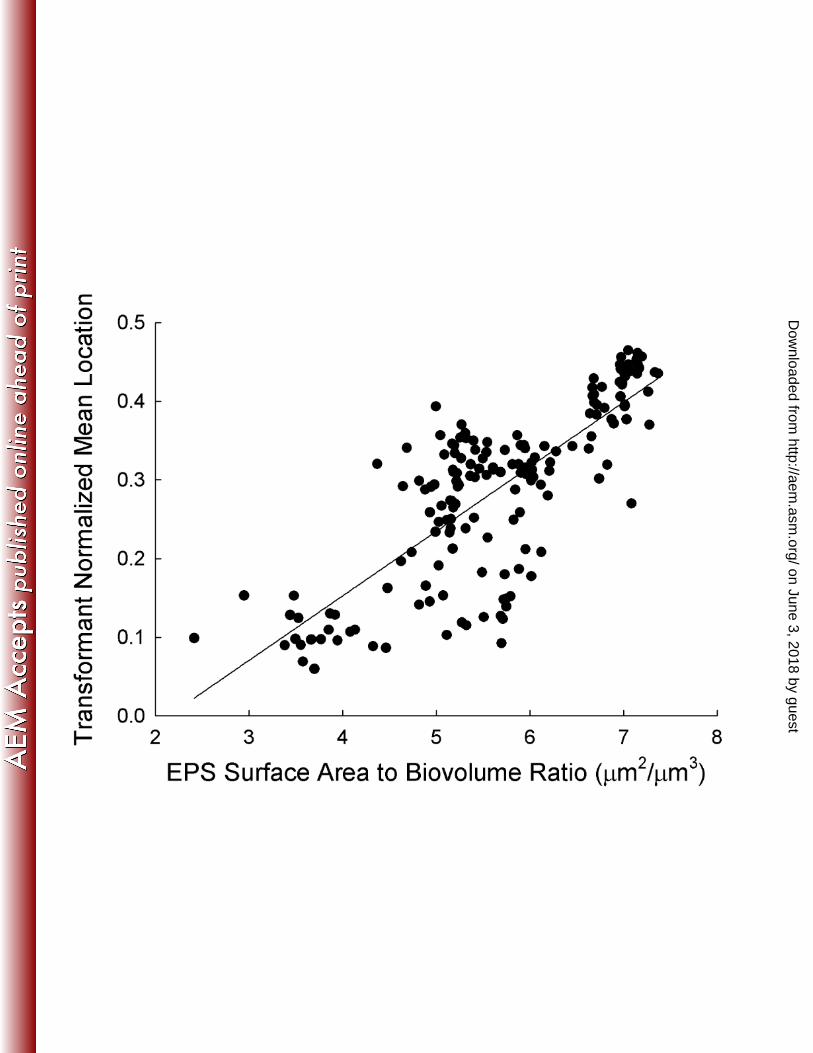
FIG. 2. The distribution of transformant normalized mean location as a function 496
of EPS surface area to biovolume ratio. The Spearman Rank Order correlation 497
coefficient, rs, is 0.75 with a p-value <0.001. Each data point represents the result from 498
one scanned location. The regression line has the equation xy 082.0176.0 +−= with a 499
R2 value of 0.62. NML values near zero indicate biomass near the substratum, while 500
values close to one indicate biomass close to the bulk-media interface. 501
FIG. 3. Correlation of transformant normalized mean location and EPS 502
normalized mean location. The Spearman Rank Order correlation coefficient, rs, is 0.55 503
with a p-value <0.001. Each point represents the result from one scanned location. NML 504
values near zero indicate biomass near the substratum, while values close to one indicate 505
biomass close to the bulk-media interface. 506
FIG. 4. The distribution of transformant biovolume as a function of transformant 507
normalized mean location. Most transformants were found close to the substratum. Each 508
point represents the result from one scanned location. The regression line has the 509
equation y = 1395.6e -10.4 with a R2 value of 0.59. The insert contains the same data but 510
on a linear scale to emphasize the peak in transfomant biovolume when the NML was 511
between 0.1 and 0.2. Normalized mean location values near zero indicate biomass near 512
on June 3, 2018 by guesthttp://aem
.asm.org/
Dow
nloaded from

28
the substratum, while values close to one indicate biomass close to the bulk-media 513
interface. 514
FIG. 5. A confocal laser scanning microscope image looking up from below the 515
substratum of an ADP1 strain biofilm grown in brain heart fusion medium. This image 516
shows that transformants (red) are primarily localized at the substratum of the biofilm. 517
Cellular biomass is shown in green. 518
on June 3, 2018 by guesthttp://aem
.asm.org/
Dow
nloaded from