Extinguishing smouldering fires in silos. BRANDFORSK ...
78
I 3 3 9 __________________________ VTT PUBLICATIONS Maarit Tbomisaari, Djebar Baroudi & Risto Latva Extinguishing smouldering fires in silos BRANDFORSK project 745-961 [' U r, I t i i DISTRIBUTION OF THIS DOCUMENT IS UNLIMITED FOREIGN SALES PROHIBITED OJL TECHNICAL RESEARCH CENTRE OF FINLAND ESPOO 1998
Transcript of Extinguishing smouldering fires in silos. BRANDFORSK ...

I 3 3 9 _ _ _ _ _ _ _ _ _ _ _ _ _ _ _ _ _ _ _ _ _ _ _ _ _ _ VTT PUBLICATIONS
Maarit Tbomisaari, Djebar Baroudi & Risto Latva
Extinguishing smouldering fires in silosBRANDFORSK project 745-961
[' U r, I
t
ii
DISTRIBUTION OF THIS DOCUMENT IS UNLIMITED FOREIGN SALES PROHIBITED
OJL
TECHNICAL RESEARCH CENTRE OF FINLAND ESPOO 1998

DISCLAIMER
Portions of this document may be illegible in electronic image products. Images are produced from the best available original document.
VTT PUBLICATIONS 339
Extinguishing smouldering firesin silos
BRANDFORSK project 745-961
Maarit Tuomisaari, Djebar Baroudi and Risto Latva VTT Building Technology
"^TTTECHNICAL RESEARCH CENTRE OF FINLAND
ESPO01998

ISBN 951-38-5219-9 (nid.)ISSN 1235-0621 (nid.)
ISBN 951-38-5220-2 (URL: http://www.inf.vtt.fi/pdO) ISSN 1455-0849 (URL: http://www.inf.vtt.fi/pdf/)
Copyright © Valtion teknillinen tutkimuskeskus (VTT) 1998
JULKAISUA - UTGIVARE - PUBLISHER
Valtion teknillinen tutkimuskeskus (VTT), Vuorimiehentie 5, PL 2000,02044 VTT puh. vaihde (09) 4561, telekopio 456 4374
Statens tekniska forskningscentral (VTT), Bergsmansvagen 5, PB 2000,02044 VTT tel. vaxel (09) 4561, telefax 456 4374
Technical Research Centre of Finland (VTT), Vuorimiehentie 5, P.O.Box 2000, FIN-02044 VTT, Finland phone intemat. + 358 9 4561, telefax + 358 9 456 4374
VTT Rakennustekniikka, Rakennusfysiikka, taloja palotekniikka, Kivimiehentie 4, PL 1803,02044 VTT puh. vaihde (09) 4561, telekopio 456 4815
VTT Byggnadsteknik, Byggnadsfysik, hus- och brandteknik, Stenkarlsvagen 4, PB 1803,02044 VTT tel. vaxel (09) 4561, telefax 456 4815
VTT Building Technology, Building Physics, Building Services and Fire Technology,Kivimiehentie 4, P.O-Box 1803, FIN-02044 VTT, Finland phone intemat +35894561, telefax + 358 9 456 4815
Technical editing Maini Manninen
LIBELLA PAINOPALVELU OY, ESPOO 1998
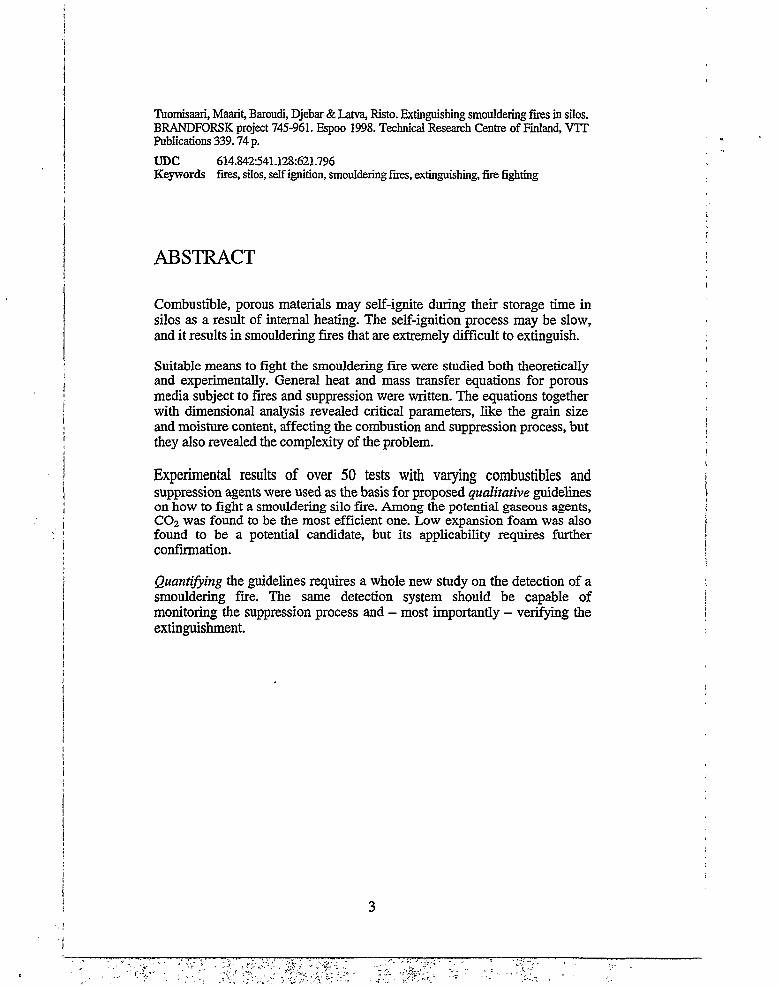
Tuomisaari, Maarit, Baroudi, Djebar & Latva, Risto. Extinguishing smouldering fires in silos. BRANDFORSK project 745-961. Espoo 1998. Technical Research Centre of Finland, VTT Publications 339.74 p.
UDC 614.842:541.128:621.796Keywords fires, silos, self ignition, smouldering fires, extinguishing, fire fighting
ABSTRACT
Combustible, porous materials may self-ignite during their storage time in silos as a result of internal heating. The self-ignition process may be slow, and it results in smouldering fires that are extremely difficult to extinguish.
Suitable means to fight the smouldering fire were studied both theoretically and experimentally. General heat and mass transfer equations for porous media subject to fires and suppression were written. The equations together with dimensional analysis revealed critical parameters, like the grain size and moisture content, affecting the combustion and suppression process, but they also revealed the complexity of the problem.
Experimental results of over 50 tests with varying combustibles and suppression agents were used as the basis for proposed qualitative guidelines on how to fight a smouldering silo fire. Among the potential gaseous agents, C02 was found to be the most efficient one. Low expansion foam was also found to be a potential candidate, but its applicability requires further confirmation.
Quantifying the guidelines requires a whole new study on the detection of a smouldering fire. The same detection system should be capable of monitoring the suppression process and - most importantly - verifying the extinguishment.
3

PREFACE
A literature review financed by Brandforsk (The Swedish Fire Research Board) on self-heating and smouldering fires in process and storage facilities for powders and granulate materials was completed at Christian Michelsen Research AS, Norway in 1994. The review was concluded by a proposal for a further study that would aim at a better understanding of the fires and ultimately at finding suitable procedures to fight them. The present project was based on the proposal, although the work was restricted exclusively to finding the best means for extinguishing the smouldering Fire.
The project was funded by Brandforsk to a major part (project 745-961), but also the Ministry of the Interior in Finland and the Finnish Fire Research Board (project number 59) participated in financing the project.
The reference group of the project consisted of the following people:
Mr. Hans Kind, Swedish Municipal Workers’ Union
Mr. Hannu Olamo, Ministry of the Interior in Finland
Mr. Lars-Erik Willberg, Sampo Industrial Mutual LtdDr. Birgit Ostman, Swedish Institute for Wood Technology Research
Many people at VTT have been involved in completing the project. Especially the contributions of Dr. Olavi Keski-Rahkonen (providing the material for the literature survey) and Mr. Henry Weckman (carrying out the preliminary tests) are acknowledged.
Maarit Tuomisaari, Djebar Baroudi and Risto Latva
4

CONTENTS
ABSTRACT..................................................................................................................3
PREFACE.....................................................................................................................4
LIST OF MAJOR SYMBOLS.................................................................................6
1 INTRODUCTION...................................................................................................7
2 INCIPIENT FIRES IN POROUS MATERIAL................................................92.1 GENERAL...................................................................................................... 92.2 THEORETICAL RESEARCH................................................................. 122.3 INERTING INCIPIENT FIRES............................................................... 132.4 PRACTICAL SUPPRESSION EFFORTS............................................. 15
2.4.1 Water.................................................................................................152.4.2 Gaseous agents................................................................................ 162.4.3 Liquefied gases................................................................................ 17
3 THEORETICAL...................................................................................................203.1 CONSERVATION EQUATIONS........................................................... 203.2 MASS TRANSPORT..................................................................................22
3.2.1 Conservation equation................................................................... 223.2.2 Jump condition................................................................................243.2.3 Dimensional analysis......................................................................25
3.3 ENERGY TRANSPORT........................................................................... 263.3.1 Conservation equation................................................................... 263.3.2 Jump condition................................................................................273.3.3 Dimensional analysis......................................................................28
4 EXPERIMENTAL................................................................................................304.1 TEST APPARATUS................................................................................... 30
4.1.1 Small scale........................................................................................304.1.2 Intermediate scale........................................................................... 334.1.3 Instrumentation................................................................................34
4.2 TEST MATERIALS................................................................................... 344.2.1 Combustibles................................................................................... 364.2.2 Suppression agents.........................................................................38
4.3 TEST RESULTS..........................................................................................394.3.1 Small-scale tests............................................................................. 394.3.2 Intermediate-scale tests.................................................................48
5 DISCUSSION........................................................................................................67
6 DRAFT GUIDELINES FOR SUPPRESSING SMOULDERING FIRESIN SILOS....................................................................................................................70
REFERENCES..........................................................................................................71
5

LIST OF MAJOR SYMBOLS
B external production ratec specific heatD diffusion coefficientEa activation energyH heat of combustionJ fluxk permeability coefficientL latent heatm massp pressurer source termR universal gas constantt timeT temperatureU velocityY mass fraction
Greek letters
{3 volume fractionk compressibilityX thermal conductivityy/ porosityp density© internal production ratev volume
Subscripts
o ambientc convection D diffusion, solid
Superscripts
J solids gas (fluid)
6

1 INTRODUCTION
Combustible solids may self-ignite during their storage time e.g. in silos and in the open as a result of internal heating. The heating arises spontaneously if there is an exothermic process liberating heat faster than itcan be lost to the surroundings. The self-ignition process may be slow, and there are several examples of accidents in industrial plants which were caused by unnoticed, slow self-heating phenomena. The self-ignition results in smouldering fires that are extremely difficult to extinguish.
The self-heating process is well understood. The geometrical and material properties are the two parameters that affect the process. For example, charcoal tends to be easily self-ignited. Hay, sawdust and other wood wastes also have a moderate tendency for self-ignition. Whether the material is stored in a silo or in the open also affects the process. The extinguishing of the resulting smouldering fire has been studied much less.
A literature review financed by Brandforsk on self-heating and smouldering fires in process and storage facilities for powders and granulate materials was completed at Christian Michelsen Research AS (CMR) in 1994 /!/. The following issues were treated to some extent:
• accidents involving smouldering fires• theories of self-heating and thermal runaway• experimental methods• detection of self-heating• instructions for fighting smouldering fires
The review concluded with a practical proposal for a further study that would aim at a better understanding on the fires and ultimately at finding suitable procedures to fight the fires. The present project was based on that proposal, although the work was restricted exclusively to finding the best means for extinguishing the smouldering fire.
The project was divided into a theoretical and experimental part. The original hope was to be able to formulate a theoretical model for inerting and maybe cooling of smouldering fires, which would allow for predicting correct ways of fighting the fire in different circumstances. This objective, however, was set too high considering the complexity of the problem and the financial limitations of the project. General heat and mass transfer equations for porous media subject to fires and suppression were written, though. These equations together with dimensional analysis revealed critical parameters affecting the suppression process, but a more detailed analysis was left for a possible future project.
Theoretical understanding of the problem is important, but in the present project with its practical objectives, the emphasis was put on the experimental part. It is well known that inert gases can extinguish a silo fire if the concentration is high enough and it is maintained for a long enough
7

time. Even foam and water suppress the fire if the amounts are sufficient. But what is a sufficient amount, what is a sufficient length of time, what are the possible disadvantages, how to confirm in practice that the fire is extinguished etc. were among the questions raised during the experimental part. Due to purely practical difficulties, answering the questions turned out to be far from straightforward, but the number of tests conducted (44 on small scale and 9 on intermediate scale) revealed lots of information of practical importance on how to extinguish smouldering fires in silos. This information was used in writing qualitative guidelines on attacking a silo fire.
The report is organized as follows. A literature review on basic knowledge and on-going research on incipient fires in silos as well as on suppressing them is given in Chapter 2. The theoretical part of the project is described in Chapter 3, and the experimental details and results are given in Chapter 4. Discussion and the guidelines complete the report in Chapters 5 and 6.
8

2 INCIPIENT FERES IN POROUS MATERIALIn the present project - with the objective of finding suitable means to fight a smouldering fire - the baseline case is an existing fire. In practice, major damage could have been avoided in many accidents if the self-heating had been detected at its early stage. Early detection is hence of vital importance - but out of the scope of this research. Also, the history before ignition, i.e. the reasons leading to the ignition, is excluded from a closer study, and the survey is very brief and qualitative regarding the research on initiation of incipient fires.
2.1 GENERAL
There are two principal types of incipient fires in stores of powders or granulate materials (see Figure 1). The material may ignite locally due to development of a hot spot within the mass of material. Provided that heat is produced at a higher rate than it is dissipated and that a sufficient supply of oxygen is available, the smouldering area around the ignition point gradually grows. Alternatively, the total volume of the material gets heated spontaneously by atmospheric oxidation (the rare occurrence of other exothermic reactions is excluded). With the increasing temperature, the process ‘self-accelerates’, and ultimately the whole volume participates in the self-ignition process - although the (smouldering) fire always starts in the centre of the material, where the temperature is the highest, and subsequently spreads over the whole volume.
Figure 1. Possible fire types: local smouldering surface (left) and volume smouldering, i.e. a runaway reaction in the whole volume (right).
9

Although the two above processes are quite different, they share many essential properties like the type of the burning material and certain fire spread characteristics. The combustion starts deep inside the material as a smouldering reaction which propagates outwards. The fire is initially deep- seated but it may lead to flaming combustion when it breaks through the surface. The smouldering phase may be vety long. In both cases of Figure 1, two main requirements have been identified for the material: it must be sufficiently porous to allow air to diffuse throughout the material, and secondly the material must yield a solid carbonaceous char when undergoing thermal decomposition.
Smouldering fire involves surface oxidation of the char on the surfaces. The oxidation provides the heat necessary to cause further thermal degradation of the neighbouring layer of combustible material. Successful propagation requires that volatiles are progressively driven out ahead of the zone of active combustion to expose fresh char which will then begin to bum.
The self-heating process is well understood. A general description of the phenomenon is found, e.g. in Ref. 2 and an extensive description in Ref. 3. The rate of development of self-heating which precedes the ignition is slow and will be significant only if the insulation provided by the surrounding mass of material is sufficient. The larger the mass, the lower the temperature which will lead to spontaneous ignition. The same material stored in large amounts may self-ignite whereas storing in smaller amounts may be quite safe.
Smouldering fires have been treated experimentally and theoretically for a long time, but because of the in complicated nature, it is understood only partially. Factors affecting the rate of propagation of smouldering include at least particle size, moisture content, and imposed air velocity. Propagation is more rapid in an upward direction as convection will contribute to the heat transfer.
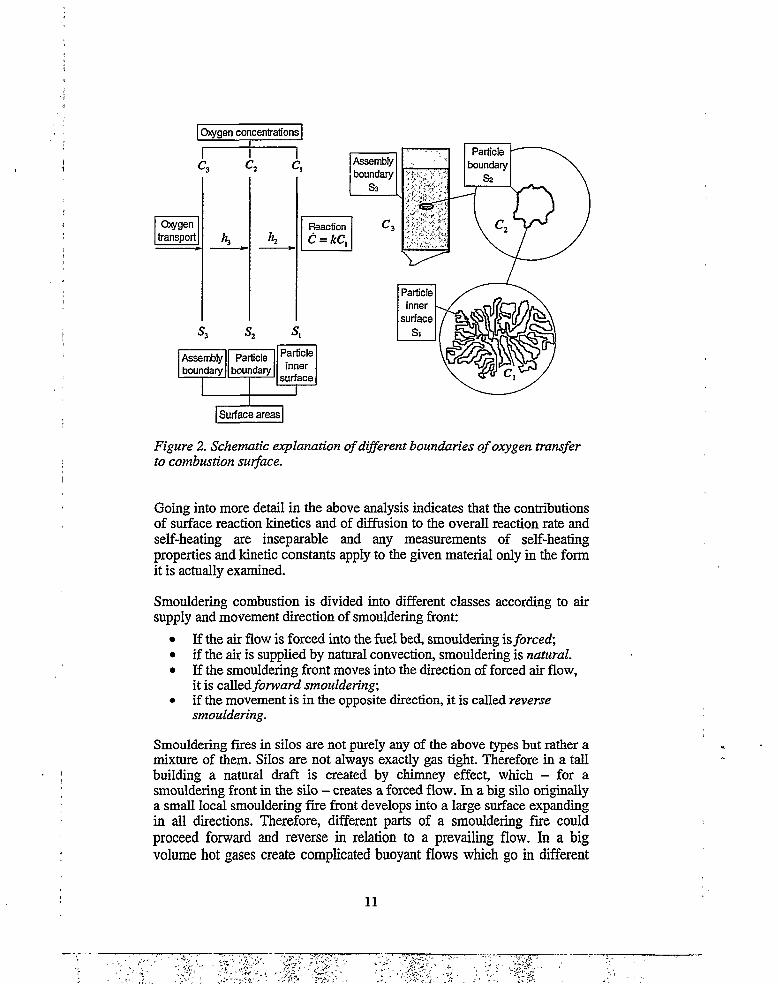
Due to the porosity, the materials prone to self-ignition are well insulatingwith a large reactive surface area, and the smouldering combustion is limited by oxygen supply. Three surfaces can be defined to control the oxygen supply /3/ (see Figure 2) and hence affect the rate of oxidative self- healing:
(1) inner surface area of a single particle Si(2) boundary surface area of a single particle S2, and(3) outer boundary surface area of the assembly of particles S3.
Mass transfer of oxygen at boundary layers and through and between particles can be considered in terms of effective mass transfer coefficients hi, and h3, respectively, for transfer from S2 to Si and from S3 to S2. The actual values of these coefficients depends on geometry, porosities and effective path lengths - varying directly with porosity and inversly with path length.
10
Oxygen concentrations
r
Oxygentransport
C,
KReaction C = ftC,
Assemblyboundary
S3
c3
S,
Assemblyboundary
Particleboundary
Particleinner
surface1
Surface areas
Figure 2. Schematic explanation of different boundaries of oxygen transfer to combustion surface.
Going into more detail in the above analysis indicates that the contributions of surface reaction kinetics and of diffusion to the overall reaction rate and self-heating are inseparable and any measurements of self-heating properties and kinetic constants apply to the given material only in the form it is actually examined.
Smouldering combustion is divided into different classes according to air supply and movement direction of smouldering front:
• If the air flow is forced into the fuel bed, smouldering is forced-,• if the air is supplied by natural convection, smouldering is natural.• If the smouldering front moves into the direction of forced air flow,
it is cdXl&d forward smouldering;• if the movement is in the opposite direction, it is called reverse
smouldering.
Smouldering fires in silos are not purely any of the above types but rather a mixture of them. Silos are not always exactly gas tight. Therefore in a tall building a natural draft is created by chimney effect, which - for a smouldering front in the silo - creates a forced flow. In a big silo originally a small local smouldering fire front develops into a large surface expanding in all directions. Therefore, different parts of a smouldering fire could proceed forward and reverse in relation to a prevailing flow. In a big volume hot gases create complicated buoyant flows which go in different
11

directions directly along the vertical axis of the fire, and far off from it. Therefore, even in the case of a forced flow, a considerable natural component is present.
2.2 THEORETICAL RESEARCH
Self-ignition is well understood and in the simplest approach two material parameters are sufficient in theoretically predicting the ability to self-ignite. The pioneering works of Frank-Kamenetskii, Semenov and Thomas, to mention a few, have been reviewed in an extensive monograph 131. A short description of the principles is found e.g. in Ref. 4.
A comprehensive treatment of ignition by external excitation is given in Ref. 5. Concentrated heat sources in a porous medium have been treated analytically in Ref. 6.
Only a few analytical theories have been presented to model smouldering combustion in a porous solid /7 - 14/, but a new wave of smouldering research was started by a group in California in the 80’s, and the work is continuing, also among scientists outside the US. A steady state model for reverse smouldering using activation energy asymptotics allowing for analytical solution of the problem was presented first /15/. Also a criterion for steady smouldering combustion was proposed, which is analogous with premixed flame, because fuel and oxygen enter the reaction zone from the same direction. Good agreement between a refined theory /16, 17/ and experimental data /18, 19/ has been found. The theory on smouldering waves has been further improved /20/, taking into account also heterogeneous reactions, and non-negligible conversion of the solid fuel into char. Analytical formulas were derived for the propagation velocity, burning temperature, and degree of conversion of the solid. Two types of solutions, termed gas deficient and solid deficient, and their existence criteria as well as extinction limits were found.
A model for forward smouldering 1211 has also been published using the same principles as before, and comparing results with experiments /12, 18, 22/. In forward smouldering the fuel and oxidant enter the combustion zone from different directions. Therefore the combustion is similar to diffusion flame. Two different solutions were found again: reaction leading wave structure when the velocity of the combustion layer exceeds that of the heat transfer layer; and reaction trailing wave structure is obtained when the combustion layer is slower than the heat transfer layer. Good agreement with theoretical predictions was obtained. Similar analysis with equivalent conclusions has been presented also elsewhere /23/. Essentially the same theory has been applied to explain experiments on a closely related problem of downward buoyant filtration combustion I2AI. Another application of the method was done to incineration of municipal waste /25/.
12

2.3 INERTING INCIPIENT FIRES
For inerting incipient fires very little material is available. Where the heat generation depends on oxidation, a finite rate of diffusion of oxygen into the interior as well as heat losses limit the temperature rise. This diffusional control of oxygen was discussed in Ref. 3 with a simplified theory. The theory reveals conditions for the critical values of the temperature rise for ignition or extinction. The analysis shows that the self-heating behaviour can be governed by the value of a dimensionless parameter, £ defined as follows
e _ QDCq RT02 X (1)
where Q is the heat evolution per unit volume at NTP of oxygen reacting, D is the diffusion coefficient for oxygen in the porous body, and CO is the oxygen concentration by volume in the surrounding atmosphere
The parameter £, is interpreted as a dimensionless temperature governed by the ratio of inward-diffusing reaction-heat to conductive heat loss. Critical ignition and extinction phenomena exist only for values of E, which exceed a lower limit and the magnitudes of the corresponding temperature jumps increase directly with the value of £.
One of the key factors in Eq. 1 is the diffusion constant, and two simple relationships are presented for calculating it:
D / D0(T) = 0.66y/D/ D0(T) = \jf3n (2)
( T V*^where the diffusion constant in free air D0(T) = D0(D0 = 0.18 cm2/s).
Both relationships are applicable at porosities yf up to 0.7, the latter one should be used at higher porosities.
Based on the simplified theory, an experimental investigation of the ignition and extinction of wood sawdust was described. Minimum ambient temperatures for the ignition of sawdust in cube-shaped baskets of different sizes were determined at a uniform ambient temperature in an oven. The concentration of oxygen in the air was adjusted by dilution with nitrogen or enrichment of oxygen supplied at a controlled rate.
A few extinction tests were carried out by reducing the oven temperature in steps after ignition had occurred and a steady state had been established. In the tests the ambient oxygen concentration was very low, i.e. 4 %. In one test the sample had self-ignited at an ambient temperature of 225 °C, and after the steady state had been reached the temperature was reduced in two steps (—> 210 °C —> 205 °C), the second reduction was followed by extinction. In another test the temperature was decreased in one step down to 205 °C, also followed by extinction.
13

Applying the simple theory yields a value to %cx, and and the critical temperature for extinction was determined, being 180 °C in the specific case. It is 25 °C lower than the observed value, and the calculated reduction in the ambient temperature for extinction is too large by a factor of two. Thus the specific sample in the given circumstances was more readily extinguished than expected purely from the ignition characteristics of the sample.
The discrepancy between experiment and theory is assumed to be partly due to the approximations in the model and partly to actual changes in the chemical properties of the samples which accompany the transition to the high temperature combustion regime, e.g. the rate of heat generation in unit volume is modified compared to the initial material. The lack of information on the properties of the burned material presents major difficulties, especially if an attempt is to be made to estimate the temperature to which the material must be allowed to cool before the control measures can be relaxed without risk of reignition.
It was concluded that - although further experimental investigation isneeded - the model provides, at least, a semiquantitative understanding ofthe effect of diffusion control on oxidative self-heating and combustion in a porous solid. The model provides a method for estimating the extent to which an atmosphere needs to be diluted with inert gas in order to ensure that a given bulk of material is sub-critical at a given ambient temperature. The simplified approach is not applicable to super-critical self-heating, particularly when diffusion controlled combustion has become established.
For the spreading of the inert fluid in porous material, the mass transfer problem has to be solved. Comprehensive treatments of analytical solutions are found in several references /26 - 30/. Simple forced mass transfer through porous solid can be studied in the cylinder geometry of Figure 3 /31/. The cylinder of height H (with the porous material) is filled from the bottom with an inert gas. The pressures at high and low side are p0 and p} and the average flow velocity in the porous bead U. For coarse matter (particle diameter > 0.3 mm) of porosity yr the pressure difference is calculated from
(3)
where the coefficient A is calculated from
(4)
and the Reynolds number Re is defined by
(5)
14
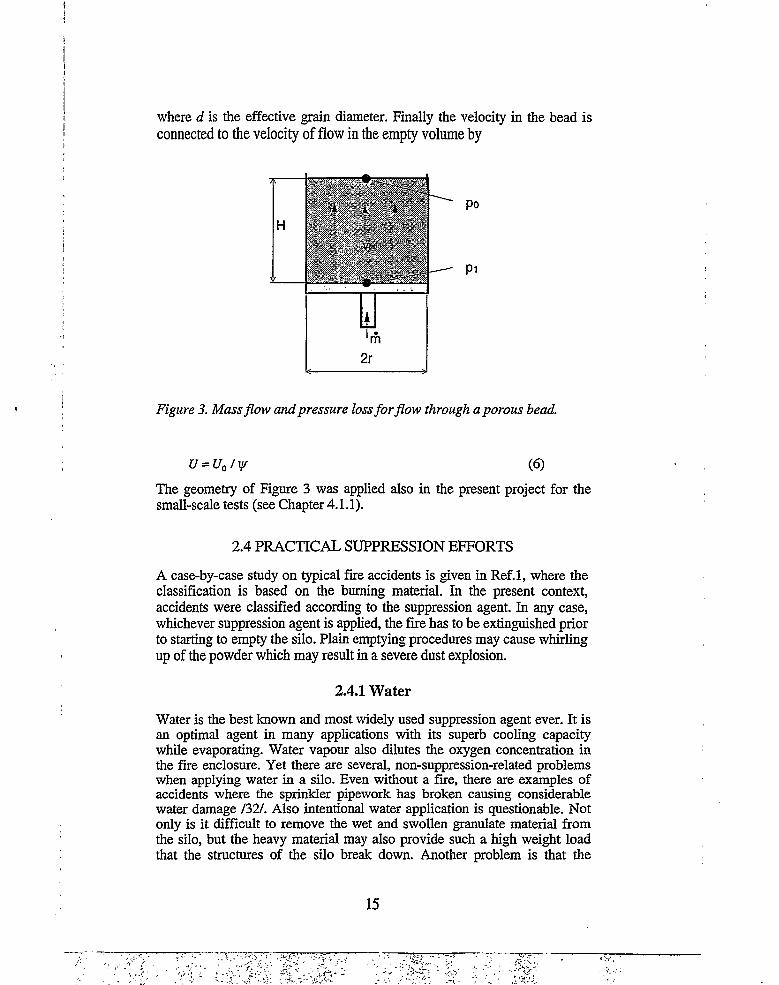
where d is the effective grain diameter. Finally the velocity in the bead isconnected to the velocity of flow in the empty volume by
Figure 3. Mass flow and pressure loss for flow through a porous bead.
U = U0/y/ (6)
The geometry of Figure 3 was applied also in the present project for the small-scale tests (see Chapter 4.1.1).
2.4 PRACTICAL SUPPRESSION EFFORTS
A case-by-case study on typical fire accidents is given in Ref.l, where the classification is based on the burning material. In the present context, accidents were classified according to the suppression agent. In any case, whichever suppression agent is applied, the fire has to be extinguished prior to starting to empty the silo. Plain emptying procedures may cause whirling up of the powder which may result in a severe dust explosion.
2.4.1 Water
Water is the best known and most widely used suppression agent ever. It is an optimal agent in many applications with its superb cooling capacity while evaporating. Water vapour also dilutes the oxygen concentration in the fire enclosure. Yet there are several, non-suppression-related problems when applying water in a silo. Even without a fire, there are examples of accidents where the sprinkler pipework has broken causing considerable water damage /32/. Also intentional water application is questionable. Not only is it difficult to remove the wet and swollen granulate material from the silo, but the heavy material may also provide such a high weight load that the structures of the silo break down. Another problem is that the
15

spraying water may be whirling up the powder: in several cases it has resulted in a dust explosion III.
From purely the suppression point of view, water may be quite inefficient in silo applications: the deeper the fire starts, the more difficult it is to extinguish with water. Penetration of water into a porous material - especially into hydrophobic materials like peat - is weak, although it may be improved by adding different surface active agents like commercial synthetic detergents /33A
If penetration of the liquid water is not a problem, the water may evaporate while approaching the hot region, and the warm vapour follows the flow of the hot combustion gases, i.e. upwards, never reaching the target. With increasing application rate the water may wet the top of the pile but the liquid tends to find channels down to the bottom of the silo, again never reaching the target. There are examples of cases with a thick layer of water on the bottom of the silo and the smouldering fire simultaneously burning freely at another location III. Truly filling the silo with water causes structural problems.
A few suppression attempts with foam applied on top of the pile have been reported III. The foam blocks the oxygen supply from above but there may be an extensive amount of oxygen inside the material to allow for an extended burning period. There are examples of both good and bad experiences with foam. In any case, if the fire starts on the very surface of the pile, foam may be quite effective: in one test the surface of a peat pile was first ignited and later covered with high expansion foam 1331. The fire was extinguished, and no reignition was observed.
2.4.2 Gaseous agents
The most common gaseous agents used in fire suppression applications are C02 and N2. Although not truly inert gases, they act like them even in fire circumstances. The principal suppression mechanism is dilution of the oxygen concentration, the cooling capacity is minimal. C02 is more popular in practice because the fire service has more experience of it - it is widely used both in manual extinguishers and in fixed fire fighting systems.
The principal difference between the two gases is that C02 is denser than air (1.98 kg/m3, relative density 1.52) whereas nitrogen has almost the same density (1.25 kg/m3, relative density 0.97).
Several successful suppression procedures with the gases have been described in the literature /l, 34/. Due to the density differences, N2 is typically fed into the silo from below, C02 from above. There are example cases where either of the gases has been applied, or both of them have been released simultaneously. The only failures have occurred if the gas release has been stopped too early, either before starting to empty the silo or during the emptying procedures.
16

In Ref. 34 it was concluded that it is safe to start emptying the silo only when the oxygen concentration is below 8 %. No basis for the requirement is given, though. Inerting should be continued till the silo is empty. In some cases, the material removed from the bottom has additionally been sprayed with water to prevent dust explosions outside the silo.
Properly inerting the silo seems to allow for its safe and controlled emptying. No systematic study, however, is available, e.g. the flow resistance may play a crucial role in the success of the attempt.
No reference was found in the literature on applying other gaseous agents in a silo fire. Other gaseous agents include pure argon and commercial mixtures of Ar, N2 and CO% that act like inert gases, as well as different replacement gases halons that extinguish a fire chemically, by breaking the chain reactions involved 1351. Halon replacement gases are under constant development and new gases are continuously being presented. Inert gas mixtures are commercially available, but they are still relatively new on the market. Only very few halon replacement gases have become competitive in the commercial market, but they still lack wider approval.
Compared to the traditional N2 and CO2, the new fire fighting gases are more expensive, which may be a decisive factor as the volumes required to fight silo fires are considerable. There are also a few practical disadvantages related to the new gases, e.g. Ar requires a large storage volume as it cannot be stored in liquid form at reasonable pressures, and halon replacement gases may produce toxic gases in fire situations and may also pose such hazards to the environment that some of them may be banned in the near future.
2.4.3 Liquefied gases
Liquefied gases have been applied (in liquid phase) extremely rarely in suppressing silo fires. Only a few - failed - cases were found in the literature, one of them being the following /34/: After detecting a smouldering fire in a wheat pellet silo, emptying procedures were started resulting in a flaming fire. Liquid CO2 was fed into the silo from above, and it extinguished the flames but had no effect on the smouldering fire. No effect on the oxygen concentration was observed either, until additional gaseous N2 was fed into the silo. In total, it took 10 days to extinguish the fire.
By intuition, liquefied gases sound a promising suppression agents in a silo- type application: one litre of liquid expands to hundreds of litres of gas. A high cooling capacity is added to the mechanism of inerting. Yet the example above shows that liquid C02did not perform as expected.
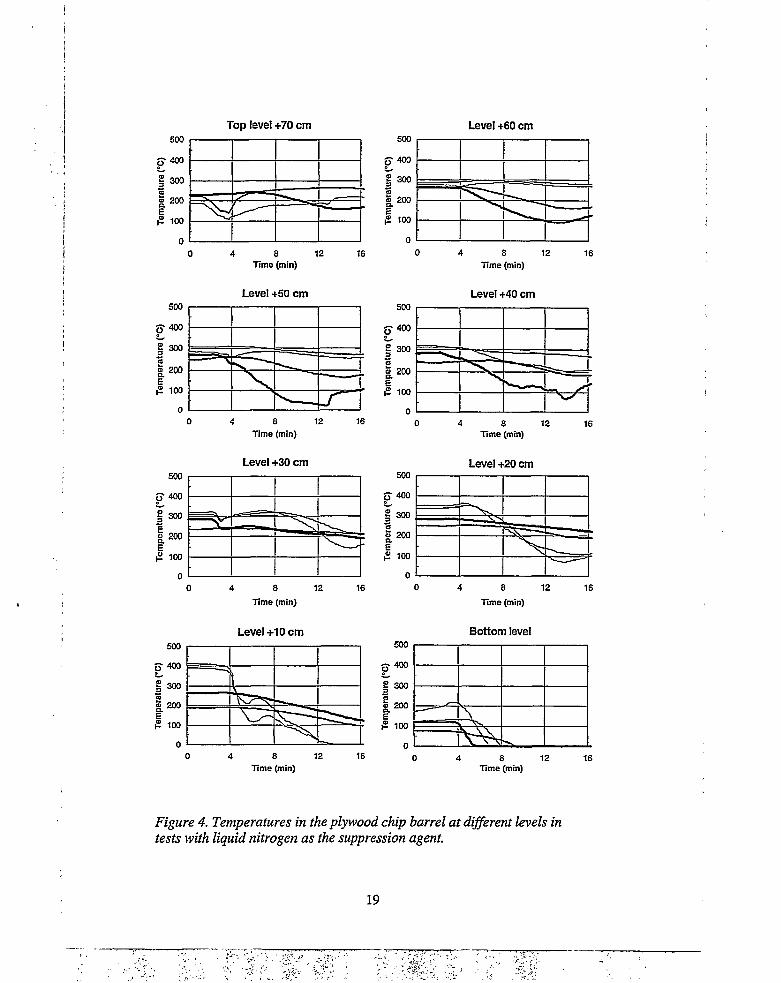
The problem was also confirmed in a set of tests conducted at VTT at the request of Industrial Mutual Ltd. /36/. The potential of liquid nitrogen in suppressing fires in silos was studied in a few tests that were more or less
17

preliminary in nature. A 200 1 barrel was filled with plywood chips of a wide grain size distribution. The overall density of the material was about 200 kg/m3, and the moisture content 7.5 %.
For ignition, a pile of insulating fibreboard pieces soaked in heptane was applied. The pile was first ignited outside the barrel, and after all the heptane had been consumed, the smouldering pile was positioned in the barrel, in the centre of the combustible material. The material was allowed to ignite and bum freely for a time long enough to be sure that the material was burning in a relatively large area. In total, 32 thermocouples were distributed inside the barrel to be able to follow the ignition and suppression processes. The free burning time varied between 10 h and 20 h.
Liquid nitrogen was fed into the barrel from a Dewar slightly pressurized with gaseous nitrogen. Three different application systems were applied: in one system the nitrogen was fed from above and in two others via a perforated pipe along the centreline of the barrel.
Figures 4 a - d show temperature curves measured in a test where liquid nitrogen was fed into the material along the central pipe for about 13 min (between 1 min and 14 min) at a rate of approximately 0.6 kg/min. About7.5 kg of liquid nitrogen was applied in total, corresponding to some 6 0001 of gas when evaporated! The temperature curves show very inhomogeneous cooling (if any) along the horizontal levels, and the temperature gradients in the vertical direction are considerable, ranging from the burning region at some 400 °C down to below 0 °C on the bottom of the barrel. In no way was the fire extinguished or even suppressed: the suppression agent never reached the burning target, but the liquid nitrogen concentrated on the bottom of the barrel, and the gas was released in the air only through certain channels in the material. The barrel was finally emptied and the material wetted with water.
18
Tem
pera
ture
("C
) Te
mpe
ratu
re (°
C)
Tem
pera
ture
(°C
) Te
mpe
ratu
re (°
C)
j
i
Top level +70 cm
0 4 8 12 16Time (min)
Level +60 cm
Time (min)
Level +50 cm
Time (min)
Level +40 cm
S 200
Time (min)
Level +30 cm
Time (min)
Level +20 cm
O 400
a 200
Time (min)
Level +10 cm Bottom level
6 200
£ 100
Time (min) Time (min)
Figure 4. Temperatures in the plywood chip barrel at different levels in tests with liquid nitrogen as the suppression agent.
19

3 THEORETICALThe survey of past and ongoing research summarized in Chapters 2.2 and2.3 indicates how complex the problem of inerting incipient fires in porous solids is. Very little reference material is available - especially about the inerting but also about the baseline case, i.e. a smouldering fire. An inverse problem should be solved to answer the question of how to extinguish a smouldering fire, i.e. the control parameters that bring the fire into a given (extinguished) state should be derived.
Truly understanding (both qualitatively and quantitatively) the extinction of a smouldering fire would require the following:
• Thorough understanding of the physico-chemical and mechanical processes involved in a smouldering fire without any inerting agent
• Mathematical model of the smouldering fire
• Thorough understanding of the physico-chemical and mechanical processes involved in injecting an extinction (inerting, but also reacting) agent into the smouldering fire
• Mathematical model of the smouldering fire with an inerting agent.
Each of the four requirements is far from being obvious or simple, and they are impossible to meet within the limits of the present project. However, some effort was made to approach the problem theoretically, and the principal issues are summarized below. Much more information could have been extracted from the derived equations and dependences than was possible in the present work. A more detailed analysis is left for possible future investigators in the field of a more fundamental research, which is beyond the objectives of the present study.
3.1 CONSERVATION EQUATIONS
The conservation equations in porous media /37 - 40/ subject to fires and suppression were written with the following assumptions:
• Two components are involved, i.e. the solid phase (e.g. wood, char and soot) and the fluid phase (combustion gases, suppression agent and humidity). The fluid phase constitutes of gas, vapour and liquid but in the following it is noted as “gas”.
• The mixture is treated as a continuum, to be able to apply the powerful tools of continuum mathematics, e.g. the conservation laws can be written as a set of partial differential equations.
The state variables, i.e. the independent variables that allow the free energy of the mixture to be written uniquely, are chosen to be the temperature of
20

the mixture and the mass fractions of the components in the mixture. The state variables and relevant related variables are summarized in Table 1.
Table 1. State variables and their derivatives applied in the transfer equations (component ke{s,g}, i.e. solid or gas).
Variable Desciption Other information
T temperature of the mixture
Y* = mk/m mass fraction % II
m total mass pYk = pk= ftft
ft = vk/v volume fraction i—l
ii
%V total volume
ft = mk/v pk = mk/vk
“density fraction”“solid density”
Epk = p
v-vs porosity
if velocity of component k q ii o
General conservation equation for the yield of mass, momentum or energy may be written in the form:
©* =^-+S7-(AkUk +7k)+Bk (7)
where 0* is the internal production rate of component k and g* the external rate of production (often equal to zero), Ak is the variable and 7* the diffusive flux. The overall conservation equation for the mixture is written as
X0*=° (8)k
The conservation equations are complemented with appropriate boundary and initial conditions in order to get a well-posed problem.
In the general form, the conservation equation is complicated and difficult to solve in cases of practical interest. It is conceivable, however, that only a small number of phenomena are dominant in comparison to all other phenomena. The methodology of non-dimensionalization /41, 42/ is a possible way to identify the dominant effects, and it was applied in the present problem.
V &
21
The conservation equations may be written in terms of dimensionless quantities using appropriate reference or characteristic values. The correct selection of these values is a crucial step, because the methodology uses the concept of order of magnitude: if the order of magnitude of a term is lower that that of another, it is deemed to be non-dominant with respect to the other.
The conservation equations may be analysed in their general form, in a dimensionless form, and also in an additional form: If there is a discontinuity over a surface E moving with velocity W (propagation front), the conservation equation takes the form of the jump condition:
[[A‘]]tiV.i?-[[A* =0 (9)
where the jump of a function/is defined as
[[/l=/+-r (io)The virgin zone (not reacted yet) is marked by “+” and the reacted zone by
The jump condition may be applied to the pyrolysis front of the present case.
3.2 MASS TRANSPORT
3.2.1 Conservation equation
Applied to the mass, Ak = pYk, the conservation equation for component k gets the form
Qk=~(pYk)+V-(pYkUk)+V-Jk+Bk (11)ot
which/or the solid phase may be written in several forms (Vs, f,Bs = 0)
Qs=~(pYs) (12a)Ot
= -§[(1-Y')p1 02b)
= -| PS (12c)ot
For the gas phase Eq.ll may be written in forms
Qs = ^(pYg) + V ■(pYsUg)+V -JSD + Bs (13a)
22
(13b)= ^{WS)+V-J?+V-Jf> + Bs
J* = ypgU* =-T*Vp-pg
n=-nvP
(14)
(15)
Equation 14 is the Darcy-like law of convection and Eq. 15 the Pick’s law of molecular diffusion. Assuming that the fluid is an ideal gas, i.e.
pV = vRT (16)
the gas phase equation may be written as (p* = ps(p,T))
0s +V-/£ +£* (17)
where
K SP
dps 1—l-— ©c--- —dr r-
Kr dp T
(18a)
(18b)
Assuming that the diffusive flux is negligible as compared to the convective flux (which is true in the present application) and that the temperature changes only slowly with time, the equation gets the form (/ is the source term)
r* s 0s - Bs « yncsP ^ • (T/Vp) (19)
which is analogous to the heat transfer equation in solid material, and hence the pressure distribution p(x,t) can be solved in the same way as the temperature distribution in the solid is determined.
The overall mass conservation for the mixture is
0r + 0* = 0 (20)which, using the source terms, becomes
/ + Is + Bs = 0 (21)
Practical considerationsThe source term r represents the rate of internal production of the solid and, if no chemical kinetics is involved, it is the pyrolyzation rate that may be expressed by a single-step Arrhenius rate law 74/
r'=0'= <' = -m';d ocexp(-£A /RT) (22)
23

where EA is the activation energy.
The average velocity of the fluid may be written using the Darcy’s law, Eq. 14, or with a permeability coefficient kcs
— r* H WUS = —~V/? = —rf-Vp.
P* Psg(23)
The permeability coefficient of saturated soils can be expressed as /43/
K = KJT_V
= K 1-piaV
(24)
for fully saturated medium, where fT and 0ce are the liquid and frozen water volume fractions. When the humidity and a part of the liquid water freezes, the permeability drops dramatically (not necessarily as dramatically as in the case of saturated medium) affecting the mass transfer of components. With a cold suppression agent like liquid N2 (see Chapter 2.4.3) the fuel material gets frosted and the gas flow through the fuel decreases, and spreading the suppression agent becomes more difficult.
3.2.2 Jump condition
The jump condition can be derived from the mass conservation equation for the solid phase as
[[Prw]]2 =[[7s]]z.«=>+y;-p-r) w (25)
The jump of the solid mass flux is
[(%]]2 •« = A,1Z 3 <0)> (26)
where m"{y/) is the mass flux at the reacting surface E. The velocity of propagation may be written as
w - (27)p*-p: i-Y
where it is assumed that p+s -p~ = ps- pcslmr is approximatively constant for a given product.
Practical considerations
The larger the ratio in Eq. 27 is, the faster the burning front proceeds. The denominator approaches zero with increasing porosity, hence indicating that the velocity increases with porosity. This trend was also confirmed experimentally. However, at the porosities tested, the effect of the increasing mass flux in the numerator was far more dominant than the plain effect of the porosity in the denominator: a slight change in porosity could
24

s
I
result in a considerably higher mass flux and hence faster propagation velocity.
3.2.3 Dimensional analysis
The characteristic variables for writing the conservation equations in dimensionless forms were chosen to be such that the values of the dimensionless variables always lie between 0 and 1. The chosen variables are summarized in Table 2.
Table 2. Characteristic variables.
Physicalvariable
Characteristic quantity Dimensionless variable
t x = tlxg
X L=V / A % = x/L
& IIu us=Us/Usn
p ^.=1/2 P*=Ps!Pr'f
T II 8 8 = T/T"f or
T =Txref xmax ll
tn M 1 rRT* Trcf
Eq. 19 may be written in a dimensionless form by applying the variables of Table 2:
*l=2i!4 4|J,+_d5_dx y/gKSpL2 5 VK'pPnf
or
■^~=n2(Aff2)n, + n3 /(n,,n2,n3,^,,^2)=o
with the dimensionless products:
n, =ps
(28)
(29)
(30a)
kg _ kjvRT2 k*TVgKpI? ygKspLUsn WsSL U* pYsgLUgn
(30b)
.a :57
25

(«£. +^)LvRT2 {m" +m'")LT(30c)
7U,=T (30d)
x2s% (30e)
The lower-case letters 7t (dimensionless time and space) are used to express an implicit dependence of the solution on time and space. They are treated here as parameters. The capital letters II are the ‘control’ parameters.
Practical considerationsEstimating the orders of magnitude of the parameters in Eq. 29 is not straightforward. Certain dependences are clear, though: the dimensionless pressure II, increases with increasing of II3 for the same values of the dimensionless diffusivity H2. On the other hand, the higher the pressure II, is, the faster the pressure gradient smoothes for the same values of II2. Equation 29 (like Eq. 19) is analogous to the heat transfer equation in solid material.
3.3 ENERGY TRANSPORT
3.3.1 Conservation equation
For the energy:
Ak = ek+\pYkUk -UkJk=qk-^k-Uk
(31)
Bk =fk ■ Uk + rkAfter similar but more lengthy mathematical manipulation than was done with the mass balance, one can derive the energy balance for the wholemixture as
p c-rr—+ pYscs Ug ■VT = -pV-Ug +7-(XVT)+rO t (32)
where the effective thermal properties of the mixture are
p crnYscs+Ysc* =Y/psc*+(l-y/-)p'cI (33)
A = YSXS + Y’X = yAs + (1 - y/)As (34)
The heat source in Eq. 32 is formed from the endothermic and exothermic processes
26

(35)r = r,+r_=qZ -i"l-
where %((p) is the combustion efficiency, q> the equivalence ratio and ythe water mass fraction. The combustion efficiency %(<p) s AH^lff / AH^or can be derived from oxygen controlled cone calorimeter tests, and the local equivalence ratio is defined by
(p = (p(Y°*,Yfuel) = 1 mfueI s0, m01
1 m fuel(36)
with sa;r=sO2/0.233, and it contains implicitly the concentration of the inerting agent.
3.3.2 Jump condition
The jump in the internal energy may be viewed as the energy consumed in the overall ‘phase change’. Then the jump condition in the energy at 2 can be approximated by (assuming that q'"Q ■ dV « q"-dL, when dV is small)
P (L'% Yfucl + y i™) W = [[WT]]-n
The spreading velocity is then
D>vr]]-*w = n( Tfue' Yfuel -f-v \Pyr's-tS1 ^ ^suppression)
(37)
(38)
Practical considerationsThe larger the water content y (0...1) is, the slower is the spreading. The minimum velocity is reached when y= 1, i.e. when all the water is in liquid form. In the experimental part, the moisture content of the samples varied between 8 % and 15 %, but - within these narrow limits - no differences in the fire spread were observed.
The water in the material may have a complicated effect in the combustion and extinction. Most of the stored organic materials are hygroscopic and, when in equilibrium with the atmosphere at normal temperatures and relative humidities, they commonly contain 10 - 20 % of water in the condensed phase.
The presence of water typically increases the rate of oxidation and heat generation in many organic materials. Of equal importance to the chemical effect are the physical effects. The mere presence of water can affect thermal properties but the most important consequences for the self-heating of porous hygroscopic materials depend on the high heat of sorption of water, the major component of which is the latent heat of vaporization. The
27
most obvious result of this is that the vaporization and diffusion of water from a high temperature region in a very porous solid, followed by condensation in a cooler region, is accompanied by a considerably higher effective rate of heat transfer than that which can occur by conduction alone.
At very high moisture contents, the thermal conductivity decreases due to pores filling with liquid water.
3.3.3 Dimensional analysis
If the dimensionless variables of Table 2 are applied, the energy equation of the mixture takes the form
d ed x
( yr pscs ^ P cV
M-4%
p cTref p cTr (39)ref
or
|^-+n2-(n6-v,n1)=n3-(AffnI)+n4-n5 (40)
which is a complicated reaction-convection-diffusion equation with the following dimensionless parameters: n, =6
y/pscg yr pscs _ Yscs2 ~ypscg+(1- VOpscs ~ pc ~ Y*c* + Yscs
' yrls+(l-y/)ls 1 X________1 Ysls + Ysls3 “ ypscs + (1 - y)psc* L Ug pcL U* Yscs + Yscs L Usn
(41a)
(41b)
n4
n5 = hernia
n 6=us=u*iui
1Zx=X
n2 =1
pc%fC/;/Z, "" pcZ^[/f/L (41d)
7 L\ mHiOi +4suppression(41e)
(41f)
(41g)
(41h)
28

Practical considerationsThe values of U2 may be relatively small and therefore for small relative velocities fl6 of the inert agent, the product n2-II6 may be negligible, i.e. small compared to unity. If n2/n3« 1 the transport is diffusion dominated, otherwise, when II2/n3 » 1, we are dealing with a convection dominated problem.
The temperature increase at the reacting zone propagates faster with increasing values of II3. Hence, to retard the propagation, the values of H3 need to be decreased. This can be achieved for instance by increasing the injected mass flux of the suppression agent.
The temperature (and hence the smouldering rate) increases with decreasing n5 or increasing II4. The slow burning of the reacting region will not be sustained if II5 > II4, i.e. if heat losses are greater than internal heat production. The condition may be written in the form:
ICetoAfff' - »<!(«<, («>
Assuming that the control volume V is small enough to allow us to take the combustion efficiency outside the integral, Eq. 43 may be reformulated as
x(<p)< J &HludpYfuddV(43)
Equation 44 may be further simplified by assuming constant functions over the control volume V
,, _ ....%vP) < AHfudpYfud ^
Equation 44 may be reformulated to provide an extinction condition for the amount of evaporating water m'£0. Self-extinction may indeed happen if a sufficient amount of water in the material evaporates. This may happen, if the moisture content is high, or even at moderate moisture contents if the water liquid/vapour flux is stopped by adiabatic (with respect to mass flux) borders that induce an increasing concentration of liquid and vapour eventually next to the reacting zone.
29

4 EXPERIMENTAL
The baseline case in the experimental part of the project was an existing smouldering fire in a powder or granulate material. The following items were excluded from the study:
• History before ignition, i.e. the reasons for the ignition• Preventing ignition• Detecting the fire• Suppressing dust clouds
Laboratory scale tests in two different sizes were carried out. Two major issues were studied in the small-scale tests:
1. What is the effect of the burning material on the suppressability?2. Which agents are capable of extinguishing the fire in the first place?
Extinguishing a small-scale fire, however, is a far more simple task than extinguishing a large-scale fire because the suppression agent spreads easily over the whole volume. On a real scale, an agent that is effective on a small scale, may become inefficient due to not reaching the location of the smouldering fire. The agent feeding method may play a crucial role in the effectiveness of the suppression. This issue was studied in the intermediate (yet small) scale tests. No large-scale tests could be run within the limits of the project.
4.1 TEST APPARATUS
4.1.1 Small scale
The small-scale tests were originally planned to be arranged in a ventilation controlled calorimeter. The available space in the calorimeter is limited, and only a very small sample chamber (~ 0.1 dm3) could be fitted in the VTT calorimeter. A few preliminary tests were conducted, but the combustion of sawdust (moisture content -10 %) generated water vapour to such an extent that the condensing water close to and at the walls extinguished the fire (as discussed after Eq. 44).
In a basket-type chamber - if the fire is not self-extinguished - the water evaporates in the surrounding control volume and distorts the true oxygen concentration measurement (the concentration is determined from a dry sample). Because of the practical problems, the ventilation controlled calorimeter was rejected, and consequently a simpler test arrangement was applied.
The sample volume was increased, and the simple geometry of Figure 3 wasapplied. A schematic drawing of the basic test apparatus is shown in Figure5. It consists of an open, cylinder-shaped chamber of approximately 1.3 dm3
30

of volume. A gas inlet in the bottom of the chamber provides the suppression agent into the chamber over its total cross-sectional area.
&150 mm
suppression agent
Figure 5. The small-scale test apparatus.
In a few tests the chamber was covered with a cylinder that left a 3 cm high empty volume above the top of the sample surface. In the cover, there were two approximately 2 cm wide holes to provide exits for the smoke and inlets for fresh air. With the cover on, gaseous agents could also be fed into the chamber from above. Photographs of the open and closed geometry are shown in Figures 6 a and b.
For igniting the material, pilot ignition i.e. a heater wire was applied. The7.5 cm long wire was overloaded with a power of 400 W/m for 30 min, which was sufficient for igniting the tested materials.
Up to seven thermocouples distributed in the chamber indicated the temperature conditions inside the material. Thermocouples TCI - TC4 had fixed positions along the centreline of the chamber, TC5 - TC7 were installed at appropriate locations along the periphery of the chamber to indicate the spread of the smouldering front. No additional thermocouples were applied so as to avoid disturbing the free burning in the small volume.
Pressure difference was measured over the thickness of the sample, and the sample weight loss was also monitored throughout the test.
31
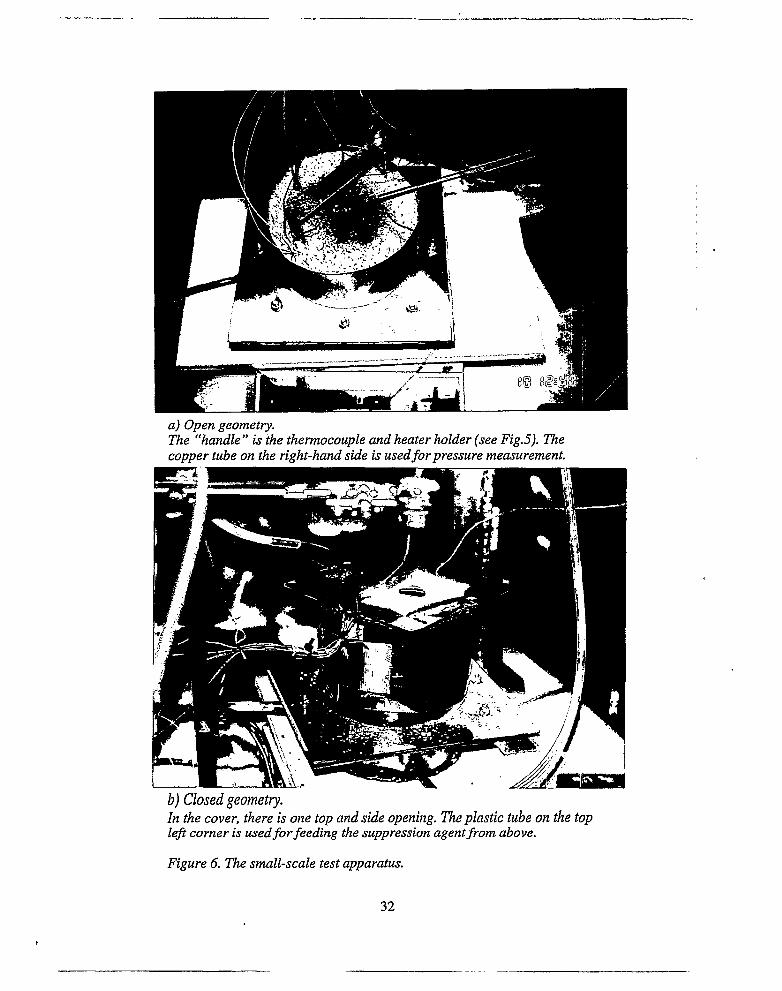
a) Open geometry.The “handle” is the thermocouple and heater holder (see Fig.5). The copper tube on the right-hand side is used for pressure measurement.
b) Closed geometry.In the cover, there is one top and side opening. The plastic tube on the top left comer is used for feeding the suppression agent from above.
Figure 6. The small-scale test apparatus.
32

4.1.2 Intermediate scale
A simple barrel-type test apparatus of Figure 7 was constructed. It consisted of a 178 1 barrel, that was filled with the test material up to 2/3 of volume. To simulate a real, closed silo, the barrel was covered with a plate. The plate was lying freely on top of the barrel, so that there were several leaksbetween the plate and the barrel walls.
10cm CL 10cm
"TtJll.TCi:
- TC4+10 cm 'C7.TC8
ire?:#-—e—•*©TCZ .-10 cm
a) Instrumentation.
b) Gaseous agent feeding systems.
Figure 7. The intermediate-scale test apparatus with two gaseous agent feeding systems.
33

For igniting the material, the small-scale pilot ignition with a longer heating time was applied. The time had to be adjusted for each test separately, to make sure that the material had been ignited. Twelve thermocouples were distributed in the chamber at fixed positions. Pressure was monitored at four locations above the sample surface to indicate how homogeneously the suppression agent was penetrating through the porous material. The sample weight loss was monitored throughout the test.
Three different gas feeding systems were tested. Two systems (see Figure 7b) were made of perforated 010 mm (o.d.) steel tubes, with 01.5 mm holes at 5 cm distance from each other. The gas was fed either from the bottom of the barrel or along the side walls. In the first system the holes were facing the bottom in order to avoid blocking them with the powder. In the third system the gas was simply fed into the barrel via a tube in the empty space above the burning material.
Photographs of the test arrangement are shown in Figures 8 a and b.
4.1.3 Instrumentation
Temperatures were measured with K-type 00.5 mm bare thermocouples.Setra Model 264 pressure transducers were applied in the pressuremeasurements. The O2 concentration was measured with a Siemens Oxymat 5E analyser of paramagnetic type.
The mass loss was monitored throughout the tests with a Precisa 8200 D SCS balance (small-scale tests) and with a Mettler-Toledo KCC300/43 balance (intermediate-scale tests). Gas flow was adjusted and maintained using a flow meter of type Brooks Instrument B.V. with the tubes R-2-26-C, R-6-25-B and R-2-25-D. The maximum flow rate was 39.1 1/min calibrated with nitrogen.
Data were recorded continuously during the tests with either a Solartron 35951C I.M.P. data recorder connected to a 386 PC micro computer or by HP 75000 Series B data acquisition cards and a Labtech Control data acquisition system. The time resolution was 10 s in the small-scale tests and during suppression in the intermediate-scale tests. 5 min resolution was applied during the long free burning period of the intermediate scale tests.
4.2 TEST MATERIALS
Test materials - both the combustibles and the suppression agents - were selected so as to be able to study systematically the effect of different variables on the suppression. The tests had to be restricted to a reasonable number, and hence all the material and suppression agent combinations could not be studied. Criteria for selecting suitable combinations are discussed below.
34

a) The gas feeding pipework on the bottom of the barrel. All other constructions belong to the thermocouple system.
b) (■(—top) Experimental arrangement during a test.A gypsum board was used as the cover. The instrumentation was brought in place through the board. At most, 5 mm opening was left between the cover and the top edge of the barrel.
Figure 8. The intermediate-scale test apparatus.
35
4.2.1 Combustibles
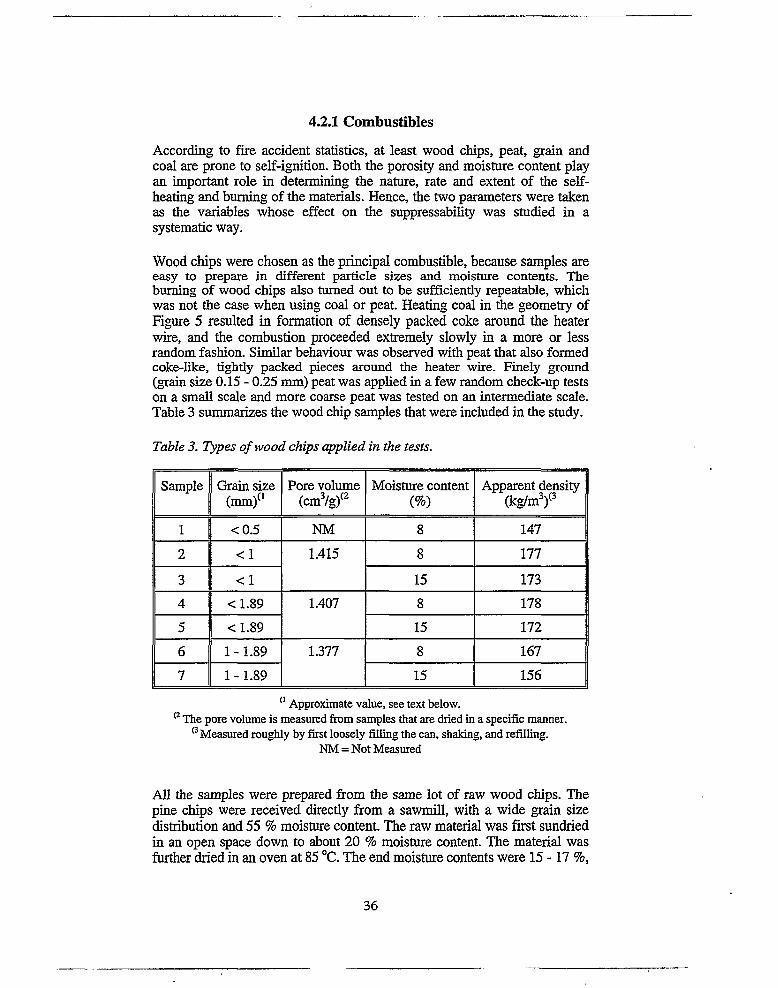
According to fire accident statistics, at least wood chips, peat, grain and coal are prone to self-ignition. Both the porosity and moisture content play an important role in determining the nature, rate and extent of the selfheating and burning of the materials. Hence, the two parameters were taken as the variables whose effect on the suppressability was studied in a systematic way.
Wood chips were chosen as the principal combustible, because samples are easy to prepare in different particle sizes and moisture contents. The burning of wood chips also turned out to be sufficiently repeatable, which was not the case when using coal or peat. Heating coal in the geometry of Figure 5 resulted in formation of densely packed coke around the heater wire, and the combustion proceeded extremely slowly in a more or less random fashion. Similar behaviour was observed with peat that also formed coke-like, tightly packed pieces around the heater wire. Finely ground (grain size 0.15 - 0.25 mm) peat was applied in a few random check-up tests on a small scale and more coarse peat was tested on an intermediate scale. Table 3 summarizes the wood chip samples that were included in the study.
Table 3. Types of wood chips applied in the tests.
Sample Grain size (mm)(1
Pore volume (cm3/g)(2
Moisture content (%)
Apparent density(kgWf
1 <0.5 NM 8 147
2 <1 1.415 8 177
3 <1 15 173
4 <1.89 1.407 8 178
5 <1.89 15 172
6 1 -1.89 1.377 8 167
7 1 -1.89 15 156
0 Approximate value, see text below.D The pore volume is measured from samples that are dried in a specific manner.
(3 Measured roughly by first loosely filling the can, shaking, and refilling. NM = Not Measured
All the samples were prepared from the same lot of raw wood chips. The pine chips were received directly from a sawmill, with a wide grain size distribution and 55 % moisture content. The raw material was first sundried in an open space down to about 20 % moisture content. The material was further dried in an oven at 85 °C. The end moisture contents were 15 -17 %,
36

which is close to the lower limit at which the material starts to get mouldy when stored in plastic bags at room temperature, and 8 %, which is the equilibrium value when stored at room temperature.
The samples were sieved with a continuously operating Sweco shaking sieve (diameter 700 mm). The feeding rate was 3.9 1/min. The sieving was done once for each sample, and hence the given grain sizes are only approximate values. Repeating the sieving procedure would have resulted in better defined fractions, but it was considered unnecessary for the present purposes.
The pore volume of the samples was determined by Micrometries Pore Sizer 9300 mercury porosimeter. The results were calculated using the value 130° for the angle between the sample and mercury. Before the analysis, the samples were dried at room temperature and reduced pressure for about two hours. The porosity of the samples can be calculated by multiplying the pore volume by the apparent density. The porosity was close to 0.2 for each sample, but it increased slightly with decreasing grain size.
A few self-ignition temperatures were determined, to define the limiting temperature for the suppression tests, at which the fire could be judged to have been extinguished. Self-ignition temperatures were determined for sample #5 in accordance with the Nordtest method NT FERE 045 /44, 45/. The results are summarized in Table 4.
Table 4. Self-ignition data for wood chips of grain size <1.89 mm and moisture content 15 %.
Sample volume Radius Tjon @ midpoint Ti<ni @ half radius(1) (m) (°C) (°C)
0.1 0.025 220 215
0.7 0.05 190 190
4.9 0.1 179 179
The self-ignition temperature depends at least on the density and moisture content of the sample. It increases with increasing moisture content and decreasing density. The variations in the present sample densities and moisture contents were so small that the self-ignition temperatures of the other wood chip samples are expected to be reasonably close to the values of Table 4, at least within the accuracy required for the present purposes.
In Ref. 46, self-ignition temperatures were measured for various samples of peat. The results for milled peat that most closely corresponds to the sample used in the small-scale tests, are summarized in Table 5. The self-ignition temperatures for wood chips are higher than those for peat. The present peat
>1- .$
37

sample had a higher density than any of the samples in Table 5, which indicates even lower self-ignition temperatures.
Table 5. Self-ignition data for milled peat/46/.
Moisture content (%)
Density(kg/m3)
Tia„(°C)
0.11 0.71 4.91
40.1 0.195 200 170 140
41.4 0.355 170 150 130
9.3 0.165 190 160 130
9.1 0.215 170 150 130
Based on the results above, the safe limiting temperature for the small-scale tests was taken to be 150 °C, at which active suppression procedures were stopped. Reignition was observed in some rare cases, indicating that higher temperatures had prevailed at locations outside the measurement points. In afew tests, also higher end temperatures (up to 180 °C) were applied. It should be noted, however, as discussed in Chapter 2.2, that the lack of information on the properties of the burned material makes it difficult to estimate what would be a truly safe temperature to stop the suppression measures. Also, on any larger scale, the self-ignition temperature is lower than that measured on a small scale, and typically the value is not known.
4.2.2 Suppression agents
Possible suppression agents include at least the following agents:
• liquid and gaseous N2• liquid and gaseous C02• Ar and other commercial inert gas mixtures• halon replacement gases• water with and without additives.
Liquefied gases were totally excluded from the study based on both the bad experimental experience (see Chapter 2.4.3) and the aspects pointed out in the theoretical part of the project (see Chapter 3.2).
Plain water discharged into a silo has well-known negative side-effects that were discussed in Chapter 2.4.1, and it was applied only in few random tests for demonstration purposes. One foam and one other additive were also tested.
The most promising suppression agents in silo-type applications are the gaseous agents, which have proven to be successful in real fires, too (see
38

5
Chapter 2.4.2). Unfortunately, there are also several examples of unsuccessful attacks with gaseous agents, which indicates that tactics plays a crucial role in the fire fighting. Hence, the performance of different gaseous agents in the suppression process was chosen to be studied in a systematic way.
The traditional gases N2 and C02 were taken as the agents of practical importance. Ar and its inert mixtures (with a density between the nritogen and carbon dioxide densities) may be expected to behave in a similar way.
4.3 TEST RESULTS
4.3.1 Small-scale tests
Test procedureOver 40 small-scale fire tests were conducted, most of them in the open geometry of Figure 5. The ignition procedure was always the same:
• the heater was turned on for 30 min,• after which the generated smouldering fire was allowed to proceed
freely for a further 60 min.• The active suppression procedures were started and continued till the
temperature at each measurement location had reached a value below 150 °C.
• The development of temperatures was further recorded to see whether the sample reignited or the extinguishment was confirmed.
Burning of wood chipsThe two moisture contents (15 % and 8 %) were not observed to affect the burning of the samples, whereas the grain size had a considerable effect: the smaller the grain size, the faster the burning. Figure 9 summarizes the mass loss during the first 90 min in all the compatible tests.
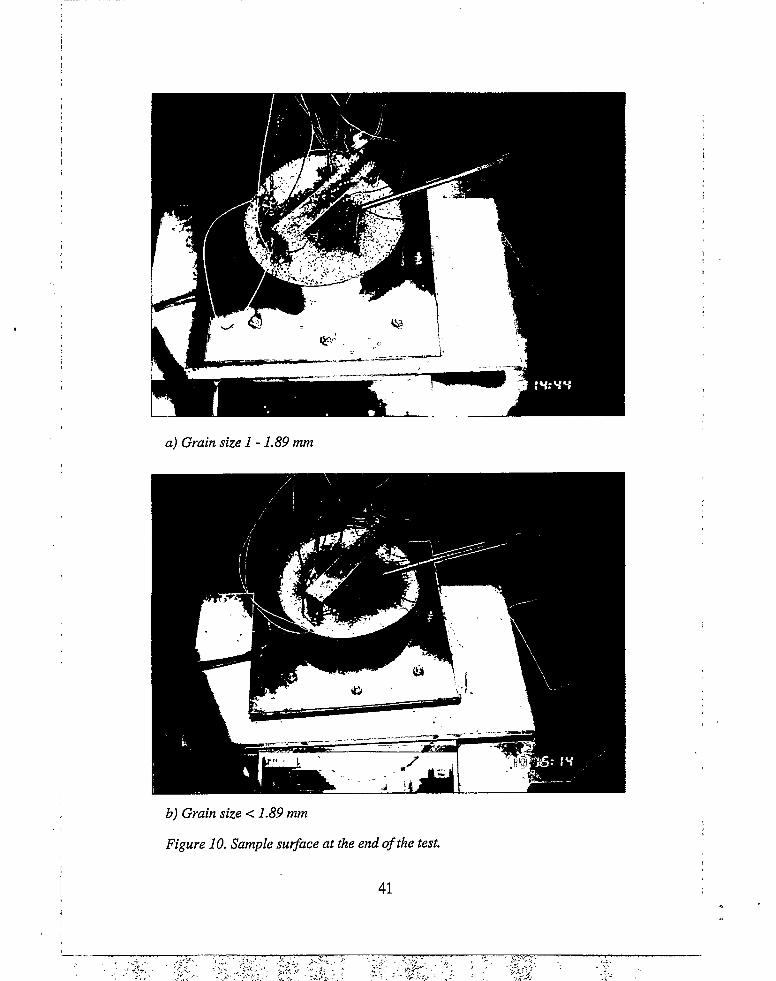
Figures 10 a - d show photographs taken after four tests with samples of different grain sizes (samples 1,2,4 and 6 in Table 3). The faster spreading of the smouldering front at a smaller grain size is evident in the photographs.
Figures 11 a - d show the temperature curves measured during the four tests. With the large grain size (1 - 1.89 mm), the temperatures further away from ignition (TCI, TC2, TC5) show an increasing trend during the free burning period. The burning material gradually collapses during combustion, exposing the thermocouple close to the top surface of the sample (TCI) to ambient air, and the temperature starts to decrease. The same behaviour - but at an earlier stage - is also observed at the grain size < 1.89 mm. At the smallest grain size (< 0.5 mm), a deep hole is generated in the centre of sample, and all the temperatures along the centreline except for TC4 start to
>'
39
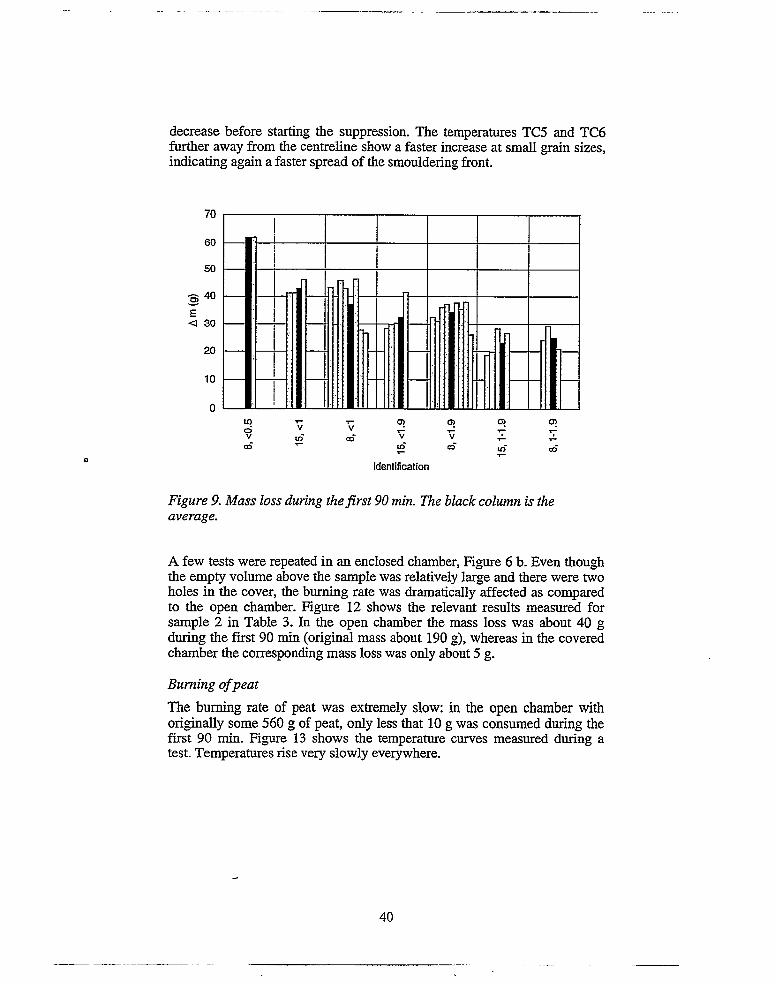
decrease before starting the suppression. The temperatures TC5 and TC6 further away from the centreline show a faster increase at small grain sizes, indicating again a faster spread of the smouldering front.
1=5 40
< 30
Identification
Figure 9. Mass loss during the first 90 min. The black column is the average.
A few tests were repeated in an enclosed chamber, Figure 6 b. Even though the empty volume above the sample was relatively large and there were two holes in the cover, the burning rate was dramatically affected as compared to the open chamber. Figure 12 shows the relevant results measured for sample 2 in Table 3. In the open chamber the mass loss was about 40 g during the first 90 min (original mass about 190 g), whereas in the covered chamber the corresponding mass loss was only about 5 g.
Burning of peatThe burning rate of peat was extremely slow: in the open chamber with originally some 560 g of peat, only less that 10 g was consumed during the first 90 min. Figure 13 shows the temperature curves measured during a test. Temperatures rise very slowly everywhere.
40
a) Grain size 1 -1.89 mm
b) Grain size < 1.89 mm
Figure 10. Sample surface at the end of the test.
41

c) Grain size < 1 mm
d) Grain size <0.5 mm
Figure 10 (cont’d). Sample surface at the end of the test.
42

700
600
0 10 20 30 40 50 60 70 80 90 100
Time (min)
a) Grain size 1 -1.89 mm
S 300£ ZOO
100 J)
Time (min)
b) Grain size < L89 mm
2 300£ 200
90 100Time (min)
5 400
2 300
£ 200
Time (min)
c) Grain size < 1 mm
d) Grain size < 0.5 mm
Figure 11. Temperatures in wood chip samples (moisture content 8 %) of different grain sizes. The heater was on for the first 30 min, followed by a further 60 min of free burning. Suppression was started at 90 min. For thermocouple locations, see Figure 5. For clarity, of TC5 - TC7 only the one reaching the highest temperatures is shown.
43

open closed
Identification
Figure 12. Mass loss during the first 90 min in an open and an enclosed chamber. The black column is the average.
O 500
5 400
g_ 300
8. 200
"Time (min)
Figure 13. Temperatures in a peat sample. The heater was on for the first 30 min, followed by a further 60 min of free burning. Suppression was started at 90 min. For thermocouple locations, see Figure 5. For clarity, of TC5 - TC7 only the one reaching the highest temperatures is shown.
Suppressability of the samplesDifferences in the suppressability of the wood chip samples was studied systematically with nitrogen as the suppression agent. The agent was applied into the open chamber from below at different flow rates, i.e. 10 1/min, 5 1/min, 11/min and 0.51/min.
Figures 14 a and b show the relevant results of the tests. One test with peatis also included. Both the suppression time and total amount of applied nitrogen are given. No distinct trends were observed in the suppressability as a function of moisture content or grain size. Even the suppressability of peat with its totally different fire spread characteristics was similar to that of the wood chips. Only the agent flow rate affected the results: the higher the
44

flow rate was, the faster the fire was extinguished but the more nitrogen was applied in total. There was, however, a lower limit for the flow rate at which the fire could be extinguished in the first place: the flow rate 0.5 1/min was already at the edge, and at 0.11/min the fire was not extinguished.
10 5 1Flow rate (Ipm)
0.5
a) Suppression time.
a 8, <0.5 a 15, <1 □ 8, <1 □ 15, <1.9 D 8, <1.9 Q15,1 -1.9 B 8,1 -1.9 n peat
Flow rate (Ipm)
b) Total amount of consumed nitrogen.
Figure 14. Suppresion time and consumed suppression agent at different application rates. The legend shows the moisture content (%) and the grain size (mm) of the sample.
45
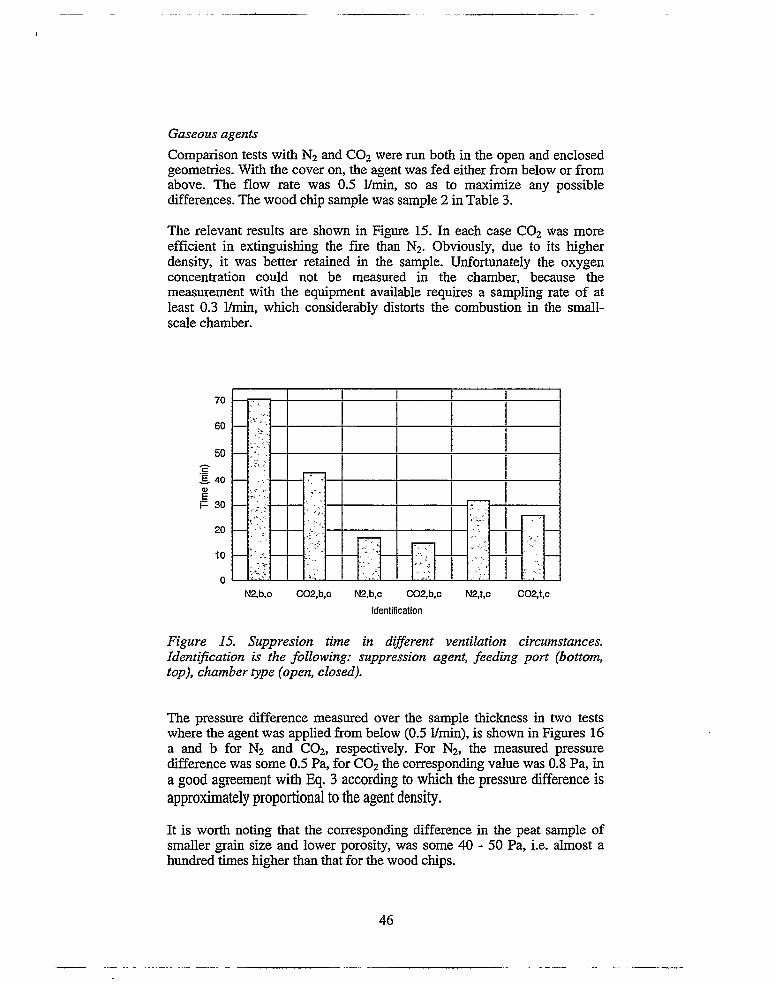
Gaseous agentsComparison tests with N2 and C02 were run both in the open and enclosed geometries. With the cover on, the agent was fed either from below or from above. The flow rate was 0.5 1/min, so as to maximize any possible differences. The wood chip sample was sample 2 in Table 3.
The relevant results are shown in Figure 15. In each case C02 was more efficient in extinguishing the fire than N2. Obviously, due to its higher density, it was better retained in the sample. Unfortunately the oxygen concentration could not be measured in the chamber, because the measurement with the equipment available requires a sampling rate of at least 0.3 1/min, which considerably distorts the combustion in the small- scale chamber.
F so
C02,b,cN2,b,o C02,b,o N2,b,c C02,t,cIdentification
Figure 15. Suppresion time in different ventilation circumstances. Identification is the following: suppression agent, feeding port (bottom, top), chamber type (open, closed).
The pressure difference measured over the sample thickness in two tests where the agent was applied from below (0.5 1/min), is shown in Figures 16 a and b for N2 and C02, respectively. For N2, the measured pressure difference was some 0.5 Pa, for C02 the corresponding value was 0.8 Pa, in a good agreement with Eq. 3 according to which the pressure difference is approximately proportional to the agent density.
It is worth noting that the corresponding difference in the peat sample of smaller grain size and lower porosity, was some 40 - 50 Pa, i.e. almost a hundred times higher than that for the wood chips.
46

Time (min)
a) Nitrogen
fS
m L L
r UflWUU mm V! 'I'H
0 20 40 60 80 100 120Tame (min)
b) Carbon dioxide
Figure 16. Pressure difference over the sample with the two suppression agents. Agent flow started at 90 min.
Water with and without additivesAlthough water was deemed to be unsuitable in silo applications for the practical reasons given in Chapter 2.4.1, two tests were conducted, one with plain water and one with low expansion foam. Open chamber geometry was applied, and the sample was again sample 2 in Table 3.
For spraying water, a full cone nozzle of type Danfoss 1.25 USG 60° S was applied. The nozzle was fixed to a height of about 10 cm, so that most of the water released was sprayed onto the sample surface. The discharge rate onto the sample surface area was 48 g/min, corresponding to some 2.7 1/min/m2.
In the small-scale test, penetration of water was no problem, and the whole sample was wetted effectively. Cooling of the sample was abrupt almost everywhere, and it took only 6 min 30 s to reach the 150 °C at all the measurement locations (0.3 1 of water in total). One problem was observed though: when starting the spraying, sparks were emitted all around the sample surface.
The low expansion foam was prepared from National Foam Liquid AOW PSL 6 - 10 %, with the foam index of 2. Suppression was conducted manually by continuously applying foam onto the sample surface so that it remained fully covered till 150 °C was reached. The cooling was almost as abrupt as with plain water, the suppression time was 9 min 10 s. Foam was found to be a potential suppression agent if it can be ensured that the surface is kept covered all the time.
47

4.3.2 Intermediate-scale tests
Nine intermediate-scale fire tests were conducted to confirm and check certain important issues revealed in the small-scale tests. The ignition procedure was similar to that applied in the small scale tests except that the external heating time as well as the free burning time were much longer. The times were adjusted separately in each test so that it was evident that the material had ignited and that the smouldering front was spreading on its own. The material in each test was a mixture of wood chips of grain size < 1.89 mm with the two moisture contents. The test material weighed some18.5 kg when the barrel was filled up to 2/3 of the volume. In two tests, peat with a moisture content of some 8 % was applied.
Five different suppression agents were applied, i.e. N2, C02, low expansion foam, water, and water with an additive. The following major issues were studied in the tests:
• C02 vs. N2The small-scale tests indicate that C02 is more effective than N2 which is a consequence of its higher density.
• Required amount of gasTypically the storage of a gaseous agent is dimensioned to fill the silo at a concentration 1-1.5 kg/m3 1321. The two limiting values were applied in the tests.
• Gas feeding methodThe two gas feeding systems of Figure 7 b, i.e. feeding from the bottom or at the side walls were applied. Also filling the enclosure from above was tested, and the effect of the gas feeding rate was studied. The (controlled) maximum feeding rate was restricted to less than 40 1/min due to constraints of the flow meter.
• Stage of the fireA silo fire is a challenge at each stage. At an early stage, there is only a small localized hot volume and it may be difficult to reach the specific location. At a later stage the temperatures are high everywhere, and gaseous suppression agents may be quickly driven upwards due to buoyant forces, resulting in a too low agent concentration at the correct location.
• Applicability of foamFoam was included in the study because of the promising results in the small-scale test.
• Plain water vs. water with an additive (lower surface tension).Even though water was deemed to be unsuitable for silo fires (see Chapter 2.4.1), it was included in the study to provide additional information about suppressing fires in open piles.
One test could serve more than one objective. Therefore, each test is described separately.
Test procedure
48

Test #1
Agent n2Nominal max concentration 1.5 kg/m3
Amount 2201 in 5 min 37 s
Feeding method bottomStage of the fire early stage (prebum - 6 h)Result Extinguished (150 °C in ~ 44 min)
Figures 17 a - c show the temperature curves measured during the test. External heating is turned off at 1 h, and suppression is started at - 6 h 10 min.
a) Along the centreline
£ 1C050 at
17 T9
Time pi)
b) Lower level
T6 T12
0 1 2 3 4 5 6 7Time (h)
c) Upper level
Figure 17. Temperatures in the barrel. For thermocouple positioning, seeFigure 7 a.
49

Figures 18 a and b show the oxygen concentration in the open volume of the barrel and the pressure measured at three locations just above the sample surface (the fourth pressure gauge was damaged). The oxygen concentration goes down to 2 %, but rises again quickly, so that the total time of a concentration less than 10 % is under 15 min. The pressure curves are almost identical indicating a more or less homogeneous flow of the agent through the sample.
o 5
6 6.1 6.2 6.3 6.4 6.5 6.6 6.7 6.8 6.9 7Time (h)
b) Pressure at three locations above the sample surface.
Figure 18. Changing conditions due to suppression.
The fire was extinguished, and no reignition was observed. After the test, the charred sample volume was visually estimated to be some 15 cm in diameter and 10 cm in height. The mass loss was not recorded in this specific test.
50

Test #2
Agent n2Nominal max concentration 1.5 kg/m3
Amount 2201 in 5 min 37 sFeeding method bottomStage of the fire later stage (prebum - 21 h)Result NOT extinguished
Test #1 was repeated but the fire was allowed to evolve for a longer time. Figures 19 a - c show the temperature curves measured during the test. External heating is turned off first at ~ 2 h, it is turned on again at - 16 h and heating is continued for 3 h. Suppression is started at ~ 20 h 40 min. Temperatures (especially Til) start to rise again around 22 h.
0 4 8 12 16 20 24
a) Along the centreline
£ 100
0 4 8 12 16 20 24Time(h)
b) Lower level
0 4 8 12 16 20 24Tiroe(ti)
c) Upper level
Figure 19. Temperatures in the barrel. For thermocouple positioning, seeFigure 7 a.
51

Figures 20 a and b show the oxygen concentration in the open volume of the barrel and the pressure measured at four locations just above the sample surface. The oxygen concentration goes down to 2 %, but rises again quickly, so that the total time of concentration less than 10 % is under 15 min. The curve is almost identical to that of Figure 18 a. The pressure curves are almost identical during the short time of releasing the suppression agent, indicating a more or less homogeneous flow of the agent through the sample.
6 5
20.5 20.6 20.7 20.8 20.9 21.1 21.2 21.3 21.4 21.5
Hme(h)
a) Oxygen concentration in the open volume above the sample.
0.15
0.10
0.05«— 0.00: 1 ' I -0.05
-0.10
-0.15
-0.20
-rWf 4fl1 nrfyi f
20.5 20.6 20.7 20.8 20.9 21 21.1 21.2 21.3 21.4 21.5Hme(h)
b) Pressure at four locations above the sample surface.
Figure 20. Changing conditions due to suppression.
The fire was not extinguished. After the test, the charred sample volume was visually estimated to be some 20 cm of diameter. In total, some 80 g of mass loss was recorded during the test.
52

Test #3
Agent C02Nominal max concentration 1.5 kg/m3
Amount 1401 in 4 min 15 sFeeding method bottomStage of the fire later stage (prebum ~ 22 h)
Result Extinguished (150 °C in ~2 h 17 min)
Test #2 was repeated with a different gaseous suppression agent. Figures 21 a - c show the temperature curves measured during the test. External heating is turned off at ~ 4 h, and suppression is started at ~ 22 h 20 min.
a) Along the centreline
S ioo
b) Lower level
5 100
I 75
c) Upper level
Figure 21. Temperatures in the barrel For thermocouple positioning, seeFigure 7 a.
53
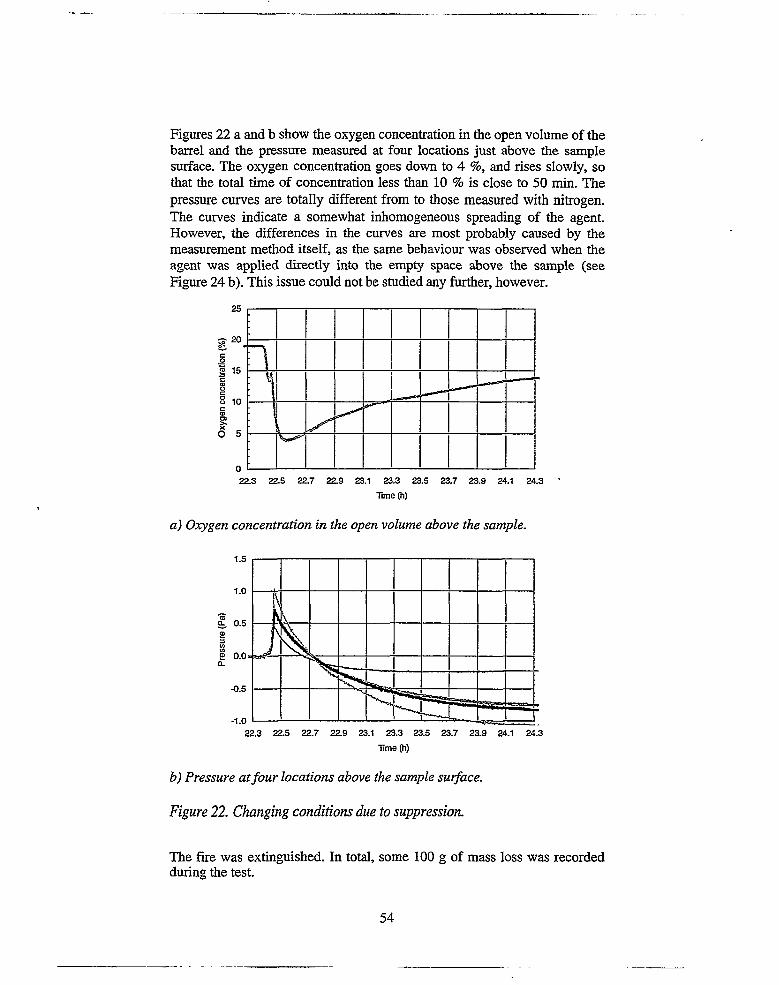
Figures 22 a and b show the oxygen concentration in the open volume of the barrel and the pressure measured at four locations just above the sample surface. The oxygen concentration goes down to 4 %, and rises slowly, so that the total time of concentration less than 10 % is close to 50 min. The pressure curves are totally different from to those measured with nitrogen. The curves indicate a somewhat inhomogeneous spreading of the agent. However, the differences in the curves are most probably caused by the measurement method itself, as the same behaviour was observed when the agent was applied directly into the empty space above the sample (see Figure 24 b). This issue could not be studied any further, however.
s 10
22.3 22.5 22.7 22.9 23.1 23.3 23.5 23.7 23.9 24.1Time (h)
a) Oxygen concentration in the open volume above the sample.
B 0.5
S 0.0
22.3 22.5 22.7 22.9 23.1 23.3 23.5 23.7 23.9 24.1 24.3Time (h)
b) Pressure at four locations above the sample surface.
Figure 22. Changing conditions due to suppression.
The fire was extinguished. In total, some 100 g of mass loss was recorded during the test.
54

Test #4
Agent C02
Nominal max concentration 1.5 kg/m3
Amount 1401 in 4 min 15 sFeeding method topStage of the fire later stage (prebum - 21 h)
Result NOT extinguished
Test #3 was repeated with a different suppression agent feeding method. Figures 23 a - c show the temperature curves measured during the test. External heating is turned off at ~ 5.75 h, and suppression is started at ~ 21 h 20 min. Temperatures start to rise again around 23 h.
i iso
0 4 8 12 16 20 24 28Time(h)
a) Along the centreline
b) Lower level
0 4 8 12 16 20 24 23Time (8)
c) Upper level
Figure 23. Temperatures in the barrel. For thermocouple positioning, seeFigure 7 a.
55

Figures 24 a and b show the oxygen concentration in the open volume of the barrel and the pressure measured at four locations just above the sample surface. The oxygen concentration goes down to 6 %, and rises again so that the total time of concentration less than 10 % is under 35 min. The pressure curves during the agent injection are very similar to those of Figure 22 b even though the gas is distributed directly into the open space above the sample.
o 5
21.4 21.6 21.8 22.2 22.4 22.6 22.8Time (h)
a) Oxygen concentration in the open volume above the sample.
Q. 0.5
2 0.0
21.2 21.4 21.6 21.8 22.2 22.4 22.6 22.8Time (h)
b) Pressure at four locations above the sample surface.
Figure 24. Changing conditions due to suppression.
The fire was not extinguished. In total, some 120 g of mass loss was recorded during the test.
56

Test #5
Agent Low expansion foamStage of the fire later stage (prebum - 21 h)
Result Extinguished (150 °C in ~4 h 10 min)
Foam was applied manually onto the sample surface so that the surface was kept covered throughout the test. Figures 25 a - c show the temperature curves measured during the test. External heating is turned off at ~ 4 h, and suppression is started at ~ 20 h 40 min.
S 200
0 4 8 12 16 20 24 28Time(h)
a) Along the centreline
2 150
£ 100
0 4 8 12 16 20 24 28Time (h)
b) Lower level
<5 75
0 4 8 12 16 20 24 28Time pi)
c) Upper level
Figure 25. Temperatures in the barrel. For thermocouple positioning, seeFigure 7 a.
57
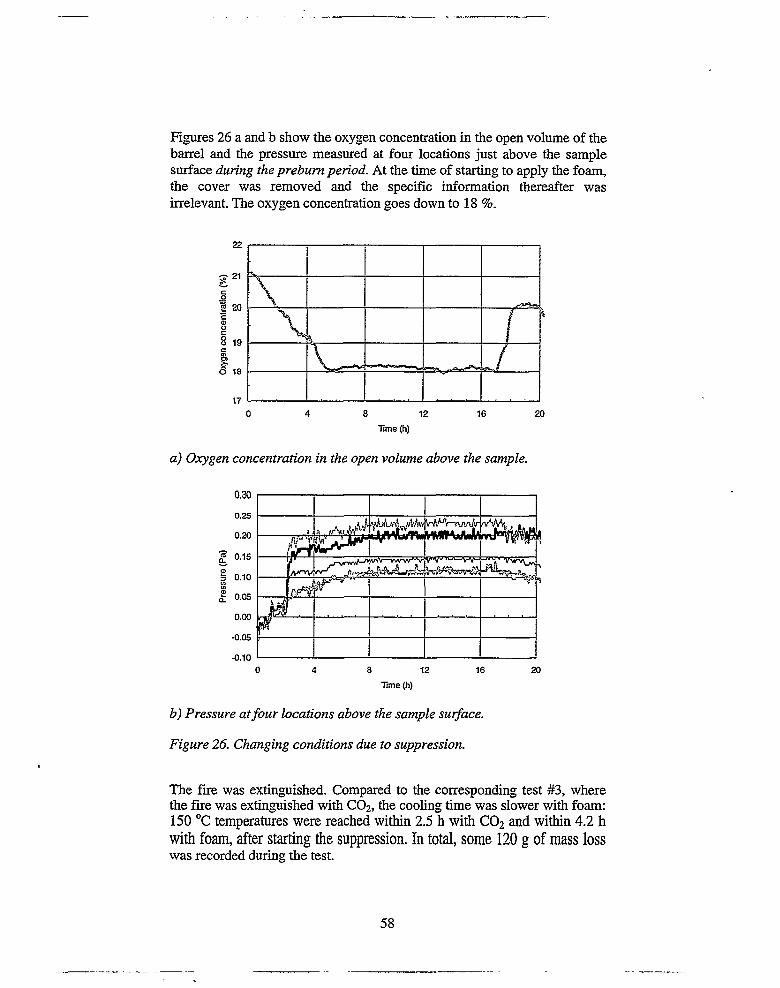
Figures 26 a and b show the oxygen concentration in the open volume of the barrel and the pressure measured at four locations just above the sample surface during the prebum period. At the time of starting to apply the foam, the cover was removed and the specific information thereafter was irrelevant. The oxygen concentration goes down to 18 %.
a) Oxygen concentration in the open volume above the sample.
Mr/V-iiv/iaAt r/'M«,
0.15
S 0.10
£ 0.05
Time (h)
b) Pressure at four locations above the sample surface.
Figure 26. Changing conditions due to suppression.
The fire was extinguished. Compared to the corresponding test #3, where the fire was extinguished with CO2, the cooling time was slower with foam: 150 °C temperatures were reached within 2.5 h with C02 and within 4.2 h with foam, after starting the suppression. In total, some 120 g of mass losswas recorded during the test.
58

Test #6
Agent 1. C022. Foam
Nominal max concentration 1.1 1 kg/m3
1.2 lkg/m3
1.3 1.5 kg/m3
1.4 1.5 kg/m3
Amount 1.1 95 1 in 2 min 50 s1.2 951 in 5 min 40 s1.3 1401 in 4 min 15 s1.4 1401 in 4 min 15 s
Feeding method 1. bottom2. top
Stage of the fire later stage (prebum — 22-28 h)Result NOT extinguished
Test #3 was repeated with a smaller nominal maximum concentration of the gaseous suppression agent. As the suppression was unsuccessful, the test was continued with several extinguishing attempts as summarized above.
Figures 27 a - c show the temperature curves measured during the test (starting at 20 h). Suppression is first started at ~ 22 h, but after the initial temperature drop, the temperatures start to rise again. The second suppression attempt is started at ~ 25 h 50 min. Again, the temperatures first decrease but soon start to rise. The third suppression attempt is started at ~ 27 h and the fourth at ~ 28 h, both unsuccessful.
Foam is applied at ~ 29 h 10 min, and the temperatures clearly decrease. Due to the steady decrease and seemingly thick foam covering, the test was left unattended overnight starting at ~ 30 h 50 min. Almost immediately after that, the temperature curves turned upwards again: the foam coverage did not last long enough without refilling. At and around 40 h the fire starts to evolve at an accelerated rate.
Figure 28 shows the oxygen concentration in the open volume of the banrel during the gas suppression attempts. During the four attempts the oxygen concentration goes down to 8 %, 11 %, 7 % and 6 %, and remains under 10 % for less than 15 min, if at all.
The fire was not extinguished but it is highly conceivable that it would have been extinguished with foam if it had not been left unattended. The foam covering should have been maintained at least till all the temperatures had reached values below 150 °C.
59
I 150
a) Along the centreline
S 150'
Tme(h)
b) Lower level
S 150
c) Upper level
Figure 27. Temperatures in the barrel. For thermocouple positioning, see Figure 7 a.
Figure 28. Oxygen concentration in the open volume above the sample.
60

Test #7
Agent water
Application rate 1.441/min
Feeding method topfull cone nozzleLechler 460.406
Stage of the fire later stage (prebum - 28 h)
Result Extinguished (150 °C in ~ 44 min)
The test was a specific test to compare the ability of plain water to extinguish a peat fire as compared to water treated with an additive that decreases its surface tension. The test material around the heater consisted of wood chips surrounded and covered with commercial vegetative peat. The commercial peat, however, was too humid to be a challenge for water absorption. Therefore, the sample was covered with a 35 cm layer of plain dried peat (8 - 10 %).
Figures 29 a - c show the temperature curves measured during the test. External heating is turned off at ~ 22.5 h, and suppression is started at ~ 28 h 40 min. (There was a suppression attempt also at about 26 h, but the nozzle was partly blocked and the water flow was turned off.) Temperatures decrease first gradually but then, at most locations, they drop abruptly.
The fire was extinguished. After the test, it was observed that the water had not wetted the top dry layer of peat at all: all the water had channelled through it, wetted the lower peat and wood chip layers, and extinguishment occued only after the water level had reached the combustion front. The temperatures decreased below 150 °C in some ~ 45 min, i.e. over 60 1 of water was applied (a third of the free barrel volume).
61

Tem
pera
ture
(*C
) Te
mpe
ratu
re (*
0)
Tem
pera
ture
(*C
)
0 4 8 12 16 20 24 28*nme(h)
a) Along the centreline
T5.T11
0 4 8 12 16 20 24 28Time (h)
b) Lower level
0 4 8 12 16 20 24 28
Time(h)
c) Upper level
Figure 29. Temperatures in the barrel. For thermocouple positioning, see Figure 7 a.
62
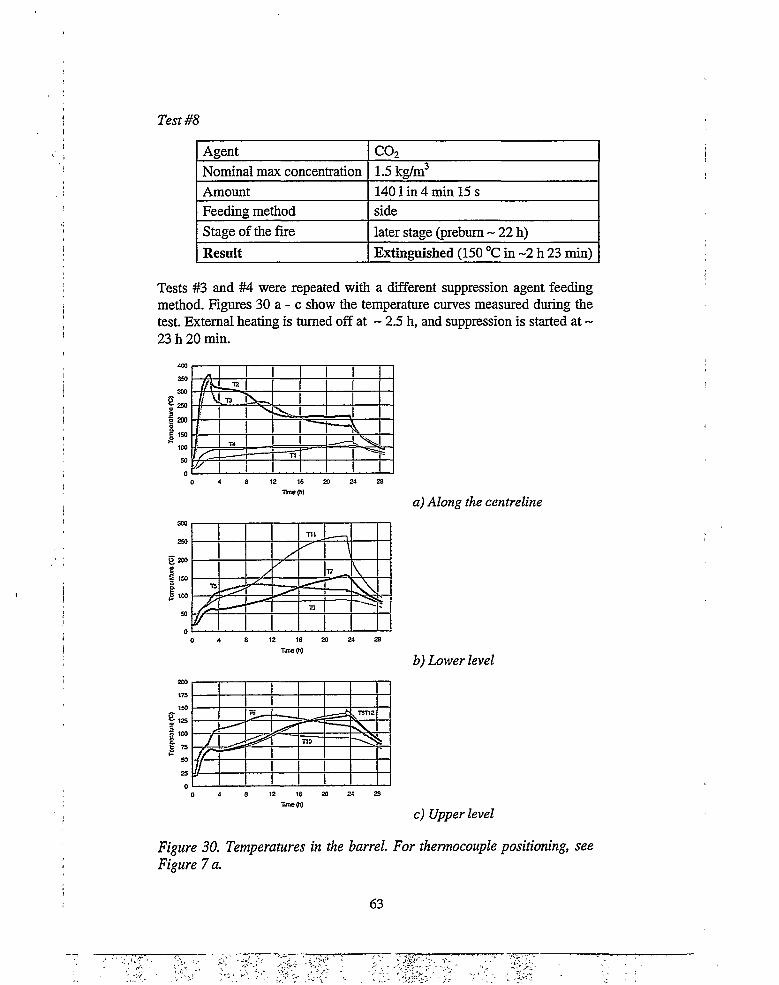
Test #8
Agent C02Nominal max concentration 1.5 kg/m3
Amount 1401 in 4 min 15 sFeeding method sideStage of the fire later stage (prebum ~ 22 h)Result Extinguished (150 °C in ~2 h 23 min)
Tests #3 and #4 were repeated with a different suppression agent feeding method. Figures 30 a - c show the temperature curves measured during the test. External heating is turned off at ~ 2.5 h, and suppression is started at ~ 23 h 20 min.
a) Along the centreline
£ 100
0 4 8 12 16 20 24 28Time(h)
b) Lower level
0 4 8 12 16 20 24 28Time(h)
c) Upper level
Figure 30. Temperatures in the barrel. For thermocouple positioning, see Figure 7 a.
63

Figures 31 a and b show the oxygen concentration in the open volume of the barrel and the pressure measured at four locations just above the sample surface. The oxygen concentration goes down below 1 %, and rises slowly, so that the total time of concentration less than 10 % is close to 60 min. The very low minimum concentration may be due to the location of gas sampling, which was very close to one of the C02 feeding ports. The pressure curves are almost identical to those measured during feeding the suppression agent from below (see Figure 22 b) and from above (see Figure 24 b), further confirming that the differences between the curves are caused by the measuring system itself.
o 5
23.2 23.4 23.6 23.8 24.2 24.4 24.6 24.8Time (h)
a) Oxygen concentration in the open volume above the sample.
& 0.5
2 0.0
23.2 23.4 23.6 23.8 24.2 24.4 24.6 24.8
Time (h)
b) Pressure at four locations above the sample surface.
Figure 31. Changing conditions due to suppression.
The fire was extinguished. In total, some 75 g of mass loss was recorded during the test.
64

Test #9
Agent water + surface tension reducing additiveApplication rate 1.441/minFeeding method top
full cone nozzle
Lechler 460.406
Stage of the fire later stage (prebum ~ 24.5 h)Result Extinguished (150 °C in ~ 11 min)
Reignition
Test #7 was repeated with water that was treated with an additive that — among other things - decreases its surface tension.
Figures 32 a - c show the temperature curves measured during the test. External heating is turned off at ~ 5.5 h, and suppression is started at ~ 24 h 30 min. All the temperatures drop abruptly below the limiting 150 °C but start to rise again after the water flow was stopped. Suppression was restarted and continued till the temperatures were below 100 °C.
The temperatures decreased extremely fast: they dropped below 150 °C in some ~ 11 min, i.e. only some 161 of water was applied. The treated water spread effectively into the material, and the top layer of peat was slightly humid after the test (in contrast to test #7). Even though the amount of water in the test was not sufficient to prevent reignition, the additive was shown to be a potential candidate in fighting smouldering fires in open storage piles. The issue could not be studied any further within the present project.
65

Tem
pera
ture
(*0)
Te
mpe
ratu
re (*
C)
Tem
pera
ture
(*C)
0 4 ' 8 12 16 20 24 287ime(h)
a) Along the centreline
0 4 8 12 16 20 24 28Time (h)
b) Lower level '
0 4 8 12 16 20 24 28Time (h)
c) Upper level
Figure 32. Temperatures in the barrel. For thermocouple positioning, see Figure 7 a.
66

5 DISCUSSIONExtinguishing smouldering fires in silos is an extremely complicated problem, both from theoretical and purely practical points of view. This complexity was confirmed also by the present project.
The principal issue that complicates the problem is the inhomogeneity of the stored porous material. To be able to use the simplifying tools of continuum mathematics in the theoretical treatment, a so-called representative volume of the sample material has to be defined. The volume is such that the state variables, e.g. temperature and density, may be assumed to be constant over the volume. Due to the highly insulating nature of most of the porous materials stored in silos, the temperature gradients may be considerable even over a few centimetres’ distances. Hence, there is an upper limit for the representative volume, and the theory cannot be oversimplified without losing essential information. General heat and mass transfer equations for porous media subject to fires and suppression were written, though, and a number of experimentally observed phenomena were confirmed by analysing the equations. A more detailed qualitative and quantitative analysis was beyond the practical objectives of the project.
The material inhomogeneity also complicates considerably the experimental approach, because verifying the extinguishment is difficult. Temperatures may be well below self-ignition temperatures at any measurement locations, but at other locations - not far from the monitoring points - the smouldering may be proceeding, or the temperatures are still sufficiently high to cause reignition. Also, the critical temperature is seldom known, as it is not a characteristic property of the material alone, but is dependent on geometric factors like the overall volume of the stored material.
The other critical parameter in the suppression process, i.e. the oxygen concentration, measured in the empty space above the material is not the same as the concentration stored inside the material, which, during burning, is highly inhomogeneous. And yet, monitoring the suppression process is of crucial practical importance, because emptying the silo is safe only after extinguishment. It is conceivable that many suppression attempts in real silos have failed because the silo has been opened too early. The monitoring is closely related to detecting the fire in the first place. Fire detection, however, was beyond the present project.
These practical difficulties were identified and their true meaning realised only during the experimental part of the project. Two laboratory scales were applied in the tests: a small scale (~ 1 1) and an intermediate (yet small) scale (- 2001). There were five major questions to be solved:
1. What is the effect of the burning material on the suppressability?2. Which suppression agents are capable of extinguishing the fire in the first
place?3. Which agents are most efficient?
67
4. What is the most efficient injection method?5. How to verify the extinguishment?
Items 1 and 2 were studied primarily in the small-scale tests, items 3 - 5 inthe intermediate-scale tests. The questions are treated separately below.
1. The effect of the burning material was studied systematically with different wood chip samples, the grain size and moisture content of which were varied. A few tests were conducted also with a totally different sample, i.e. peat. Nitrogen was used as the suppression agent. No effect on the suppressability was found among the tested samples even though their burning rates varied considerably: the smaller the wood chip grain size, the faster the smouldering front proceeded and the higher was the mass loss rate. The mass loss rate of peat was an order of magnitude lower than that of the wood chip samples.
The results indicate that the burning material is not critical when selecting the suppression agent. It should be noted, however, that only a limited number of materials were tested within the project. Also, it is a well-known fact that fighting fires of hydrophobic peat with plain water is much more difficult than fighting fires of, say, grain or wood chips. Water, however, should not be applied in silo fires in the first place.
2. All the tested suppression agents, i.e. nitrogen, carbon dioxide, plain water and low expansion foam, could extinguish the fires. It is most probable that any other gaseous suppression agent would perform similarly. The other potential gases, however, are not so readily available, and they are also more expensive.
Liquefied gases were excluded from the study due to the convincing evidence of their unsuitability, provided both by an earlier experimental study and the theoretical treatment in the present study. Any agent at a temperature below 0 °C, dramatically decreases the porosity of the material as all the moisture freezes, blocking the free spreading of the suppression agent.
Water must be excluded from real silo applications due to purely practical problems related to removing the wet and swollen material from the silo and to providing unbearable weight loads against the structures. However, water may be suitable for suppressing open storage pile fires, especially if it is treated with a suitable additive, e.g. an additive that reduces the surface tension.
The results indicate that almost any conceivable suppression agent (except for liquefied gases) is capable of extinguishing afire in a porous material, but due to practical limitations, the true potential candidates are N2, C02 and low expansion foam. 3
3. The intermediate-scale tests confirmed the fact that - due to its higher density - C02 is more effective than N2. Being heavier than air, C02
68

remains in the enclosure for a longer time than N2, the density of which is slightly lower than the air density. The silos are never gastight and the suppression agent gradually leaks out from the enclosure. After injecting the agent, the oxygen concentration first reaches a minimum but soon starts to increase again, the rate of which depends primarily on the tightness of the silo but also on the stage of the fire: the later the stage, the more considerable is the convection flow of combustion products and hot gases in the upward direction. A nominal maximum concentration of 1.5 kg/m3 of C02 was sufficient in extinguishing fires on the intermediate scale, when the measured temperatures were around 100 - 250 °C, whereas at a later stage with the temperatures around 150 - 400 °C, the same amount was not sufficient.
Surprisingly also low expansion foam was found to be a potential suppression agent candidate. Foam blocks the oxygen supply from above (provided that the foam layer is maintained unbroken throughout the suppression), but the oxygen inside the material may be consumed in the combustion process. Due to the extended burning period, cooling is slower than with C02. The effect on the extended burning time is not straightforward, though, as the combustion gases also participate in lowering the oxygen concentration inside the material.
However, prior to actually recommending the use of foam, larger scale tests should be conducted, to observe the true effect of the extended burning period.
4. The most efficient way of injecting a gaseous agent is from below. Due to the upward flow in a fire situation, the oxygen necessary for the smouldering will flow into the smouldering material primarily from below and will gradually be replaced by the inert gas.
5. To verify the extinguishment from outside is extremely difficult for the reasons discussed earlier in this chapter.
In the present study, the fire was deemed to be extinguished when all the measured temperatures were below 150 °C, i.e. clearly lower than the self-ignition temperature. Still, in a few tests the material reignited indicating that higher temperatures prevailed outside the measurement locations.
In the successful intermediate scale tests with C02, the oxygen concentration in the empty space above the porous material decreased down to below 5 % after injection, and remained below 10 % for almost an hour. What the required time scales in a real silo might be, is not known without further testing on a larger scale.
Based on the results, no quantitative recommendations can be given on howto extinguish the fire in the first place and how to verify the extinguishmentTo quantify the qualitative guidelines given, a whole new project should beinitiated on fire detection, along with a systematic larger scale test series.
69
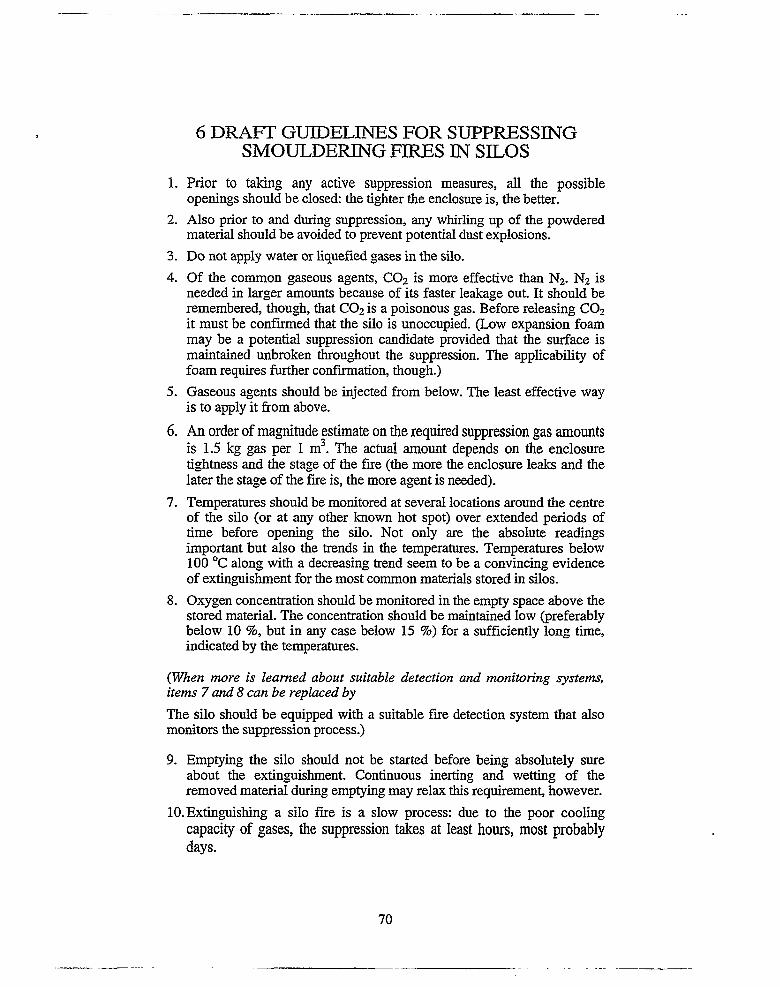
6 DRAFT GUIDELINES FOR SUPPRESSING SMOULDERING FIRES IN SILOS
1. Prior to taking any active suppression measures, all the possible openings should be closed: the tighter the enclosure is, the better.
2. Also prior to and during suppression, any whirling up of the powdered material should be avoided to prevent potential dust explosions.
3. Do not apply water or liquefied gases in the silo.
4. Of the common gaseous agents, CO2 is more effective than N2. N2 is needed in larger amounts because of its faster leakage out. It should be remembered, though, that C02 is a poisonous gas. Before releasing C02 it must be confirmed that the silo is unoccupied. (Low expansion foam may be a potential suppression candidate provided that the surface is maintained unbroken throughout the suppression. The applicability of foam requires further confirmation, though.)
5. Gaseous agents should be injected from below. The least effective way is to apply it from above.
6. An order of magnitude estimate on the required suppression gas amounts is 1.5 kg gas per 1 m3. The actual amount depends on the enclosure tightness and the stage of the fire (the more the enclosure leaks and the later the stage of the fire is, the more agent is needed).
7. Temperatures should be monitored at several locations around the centre of the silo (or at any other known hot spot) over extended periods of time before opening the silo. Not only are the absolute readings important but also the trends in the temperatures. Temperatures below 100 °C along with a decreasing trend seem to be a convincing evidence of extinguishment for the most common materials stored in silos.
8. Oxygen concentration should be monitored in the empty space above the stored material. The concentration should be maintained low (preferably below 10 %, but in any case below 15 %) for a sufficiently long time, indicated by the temperatures.
(When more is learned, about suitable detection and monitoring systems,items 7 and 8 can be replaced byThe silo should be equipped with a suitable fire detection system that alsomonitors the suppression process.)
9. Emptying the silo should not be started before being absolutely sure about the extinguishment. Continuous inerting and wetting of the removed material during emptying may relax this requirement, however.
10. Extinguishing a silo fire is a slow process: due to the poor cooling capacity of gases, the suppression takes at least hours, most probably days.
70
REFERENCES
1. van Wingerden, K. and Alfert, F. Detection and suppression of smouldering fires in industrial plants. A literature review. Report CMR- 94-F25068, Christian Michelsen Research AS, Bergen, 1994,54 p.
2. Drysdale, D. An Introduction to Fire Dynamics. Chapter 8, Spontaneous ignition within solids and smouldeimg combustion. John Wiley & Sons Ltd., Chichester, 1986, pp. 253 - 277.
3. Bowes, P.C. Self-heating: evaluating and controlling the hazards. Department of the Environment, Building Research Establishment, Her Majesty’s Stationery Office, London, 1984,500 p.
4. Beever, P.F. Self-heating and Spontaneous Combustion. In: PJ. DiNenno et al. (eds), SFPE Handbook of Fire Protection Engineering. National Fire Protection Association, Quincy, MS, Second Edition (1995), Section 2/Chapter 12.
5. Vilyunov, V.N. and Zarko, V.E. Ignition of Solids. Elsevier, Amsterdam, 1989.
6. Bejan, A. Convection Heat Transfer. Wiley, New York (1984), pp. 372 - 380.477 p.
7. Kinbara, T., Endo, H. and Sega, S. Downward Propagation of Smoldering Combustion through Solid Material. Eleventh Symposium (International) on Combustion, The Combustion Institute, Pittsburgh, PA, 1967, pp. 525 - 531.
8. Kansa, E.J., Perlee, H.E. and Chaiken, R.F. Mathematical Model of Wood Pyrolysis Including Internal Forced Convection. Combustion and Flame 29 (1977) pp. 311 - 324.
9. Aldushin, A.P. and Seplyarskii, B.S. Propagation of waves of exothermal reaction in porous medium during gas blown-through. Soviet Physics Doklady 23 (1978) pp. 483 - 485.
10. Muramatsu, M., Umemura, S. and Okada, T. A Mathematical Model of Evaporation-Pyrolysis Processes Inside a Naturally Smoldering Cigarette. Combustion and Flame 36 (1979) pp. 245 - 262.
11. Ohlemiller, T.J., Bellan, J. and Rogers, F. A Model for Smoldering Combustion Applied to Flexible Polyurethane Foams. Combustion and Flame 36 (1979) pp. 197 - 215.
12. Ohlemiller, T.J. and Lucca, D.A. An Experimental Comparison of Forward and Reverse Smolder Propagation in Permeable Fuel Beds. Combustion and Flame 54 (1983) pp. 131 - 147.
71
13. Bakhman, N.N. Smoldering wave propagation mechanism, I. Critical conditions. Combustion, Explosion and Shock Waves 29 (1992) pp. 14 - 17.
14. Bakhman, N.N. Smoldering wave propagation mechanism, H Smoldering velocity and temperature in smoldering zone. Combustion, Explosion and Shock Waves 29 (1992) pp. 18 - 24.
15. Donsanjh, S.S., Pagni, PJ. and Femandez-Pello, A.C. Forced Cocurrent Smoldering Combustion. Combustion and Flame 68 (1987) pp. 131 - 142.
16. Lozinski, D. and Buckmaster, J. Quenching of Reverse Smolder. Combustion and Flame 102 (1995) pp. 87 - 100.
17. Lozinski, D. and Buckmaster, J. The Fast-Time Stability of a Simple Deflagration. Combustion Science and Technology 110 - 111 (1995) pp. 379 - 391.
18. Torero, J.L., Femandez-Pello, A.C. and Kitano, M. Opposed Forced How Smoldering of Polyurethane Foam. Combustion Science and Technology 91 (1993) pp. 95 - 117.
19. Torero, J.L. and Femandez-Pello, A.C. Natural Convection Smolder of Polyurethane Foam, Upward Propagation. Fire Safety Journal 24 (1995) pp. 35 - 52.
20. Schult, D.A., Matkowsky, B.J., Volpert, V.A. and Femandez-Pello, A.C. Propagation and Extinction of Forced Opposed How Smolder Waves. Combustion and Hame 101 (1995) pp. 471 - 490.
21. Schult, D.A., Matkowsky, B.J., Volpert, V.A. and Femandez-Pello, A.C. Forced Forward Smolder Combustion. Combustion and Hame 104 (1996) pp. 1 - 26.
22. Torero, J.L. and Femandez-Pello, A.C. Forward Smolder of Polyurethane Foam in a Forced Air How. Combustion and Hame 106 (1996) pp. 89 - 109.
23. Buckmaster, J. and Lozinski, D. An Elementary Discussion on Forward Smoldering. Combustion and Hame 104 (1996) pp. 300 - 310.
24. Aldushin, A.P., Matkowsky, B.J. and Schult, D.A. Downward Buoyant Filtration Combustion. Combustion and Hame 107, (1996) 151 -175.
25. Zhou, X., Torero, J.L., Coudeau, J.C. and Bregon, B. On the Propagation of a Reaction Front Through a Porous Fuel in the Presence of an Opposed Forced How: Application to Mixtures Characteristic of
72
Municipal Waste Combustion Science and Technology 110 - 111 (1995) pp. 123 - 146.
26. Crank, J. The Mathematics of Diffusion. Oxford University Press, London (1957).
27. lost, W. Diffusion in Solids, Liquids and Gases. Academic, Third Printing, New York (1960).
28. Cotta, R.M., Baohua, C. and Heilbron Filho, P.F.L. Analytical Solutions to Transient Convective Mass Transfer within Porous Media. In: S. Kakag, B. Kilkis, F.A. Kulacki & F. Aring (eds) Convective Heat and Mass Transfer in Porous Media. Kluwer Academic Publishers, Dordrecht (1991), p. 525 - 540.
29. Ene, H.I. and Polisevski, D. Thermal Flow in Porous Media. D. Reidel, Dordrecht (1987), 194 p
30. Kaviany, M. Principles of Heat Transfer in Porous Media. Springer, New York (1991), 626 p.
31. Kast, W. Druckverlust bei der Stromung durch Schuttungen. VDI- Warmeatlas, VDI-Verlag, Dusseldorf (1985), Lei - Le3. (in German)
32. Willberg, L.-E. Industrial Mutual Ltd., private communication.
33. Weckman, H. Kotimaisten polttoaineiden turvallinen tuotanto ja kaytto. Osa 5. Sammutusteknisia mittauksia. (Safe production and use of domestic fuels. Part 5. Extinguishing measurements) Technical Research Centre of Finland, Research Notes 629, 24 p. + app. 4 p., Espoo 1986 (in Finnish)
34. Weiss, A. Inertisierung mit Kohlendioxid Oder Stickstoff bei Schwelbranden in Silos. Brandschutz 11/1981, pp. 390 - 393.
35. Grant, C.C. Halon and beyond: Developing new alternatives. NFPA Journal 1994. Vol. 88, No. 6, p 40 - 54.
36. Suppressing fires in silos with liquid nitrogen. VTT Research Report No. RTE11313/96,1996, 9 p. (in Finnish)
37. Bear, J. and Bachmat, Y. Introduction to Modelling of Transport Phenomena in Porous Media. Theory and applications of transport in porous media. London, 1991,553 p.
38. Coussy, O. Mecanique des milieux poreux, Ed. TECHNIP, Paris 1991, 431 p.
I 73
39. Germain, P., Nguyen, Q.S. and Suquet, P. Continuum Thermodynamis, Journal of Applied Mechanics, Transactions of ASME, Vol. 50, December 1983, pp. 1111-1020.
40. Klausner, Y. Fundamentals of Continuum Mechanics of Soils. Springer-Verlag, Paris, 1991,597 p.
41. Langhaar, H.L. Dimensional Analysis and Theory of Models. New York, 1980,163 p.
42. Ohlemiller, TJ. Modeling of Smodering Combustion Propagation. Progressive Energy Combustion Science, Vol. 11, 1985, pp.277-310.
43. Konrad, J.-M., Seto, J.T.C. Frost heave characteristics of undistributed sensitive Champlain Sea clay. Can. Geoteh. J. Vol. 31, 1994, pp.285 -298.
44. NT FIRE 045, Solid materials: Spontaneous ignition temperature by continuous heating, 1992-09,7 p.
45. Bjorkman, J. and Keski-Rahkonen, O. Test method for self-ignition of materials. VTT Publications 96, Technical Research Centre of Finland, Espoo, 1992, 28 p. + app. 13 p.
46. Vuorio, M. and Weckman, H. Measurements of the self-ignition of peat. Fire Technology Laboratory, Technical Research Centre of Finland, Report 20, Espoo, June 1980,15 p.
74
Published by
\T/ , VuorimiehentieS, P.O.Box2000, FIN-02044VTT, FinlandSeries title, number and report code of publication VTT Publications 339 VTT-PUBS-339
VII Fax+ 358 9 456 4374 DateMarch 1998
Project number R6SU00886
Authors)
Tuomisaari, Maarit, Baroudi, Djebar &Latva, Risto
Name of project
Commissioned bySiilopalot
Title
Extinguishing smouldering fires in silosBRANDFORSK project 745-961
Abstract
Combustible, porous materials may self-ignite during their storage time in silos as a result of internal heating. The self-ignition process may be slow, and it results in smouldering fires that are extremely difficult to extinguish.Suitable means to fight the smouldering fire were studied both theoretically and experimentally. General heat and mass transfer equations for porous media subject to fires and suppression were written. The equations together with dimensional analysis revealed critical parameters, like the grain size and moisture content, affecting the combustion and suppression process, but they also revealed the complexity of the problem.Experimental results of over 5 0 tests with varying combustibles and suppression agents were used as the basis for proposed qualitative guidelines on how to fight a smouldering silo fire. Among the potential gaseous agents, COz was found to be the most efficient one. Low expansion foam was also found to be a potential candidate, but its applicability requires further confirmation.Quantifying the guidelines requires a whole new study on the detection of a smouldering fire. The same detection system should be capable of monitoring the suppression process and - most importantly - verifying the extinguishment.
Activity unit yjj Bu;ijjng Technology, Building Physics, Building Services and Fire Technology, Kivimiehentie 4, P.O.Box 1803, FIN-02044 VTT, Finland
Series title and ISSN
VTT PUBLICATIONS1235-0621 (soft back edition)1455-0849 (URL: http://www.inf.vtt.fi/pdf/)
ISBN951-38-5219-9 (soft back edition) 951-38-5220-2 (URL: http://www.inf.vtt.fi/pdf/)
Language
English
Class (UDC)
614.842:541.128:621.796Keywords
fires, silos, self ignition, smouldering fires, extinguishing, fire fighting
Sold by VTT Information ServiceP.O.Box 2000, FIN-02044 VTT, Finland Phone internal. + 358 9 456 4404 Fax + 358 9 456 4374
Pages
74 p.
Price group
B

VTT PUBLICATIONS
317 Hildebrand, Martin. Local impact strength of various boat-building materials. 1997.28 p. + app. 6 p.
318 Latvakoski, Juhani. Integration test automation of embedded communication software. 1997. 98 p. + app. 28 p.
319 Narumo, Timo. Modelling of two-phase flow based on separation of the flow according to velocity. 1997. 39 p. + app. 103 p.
320 Hienonen, Risto, Kaijalainen, Matti & Lankinen, Raija. Verification of the thermal design of electronic equipment. 1997. 85 p. + app. 13 p.
321 Tuomisaari, Maarit & Yli-Penttila, Martti. Extinguishing efficiency of powders against class A fires. 1997. 26 p. + app. 8 p.
322 Kronlof, Anna. Filler effect of inert mineral powder in concrete. 1997.155 p. + app. 32 p.
323 Stenholm, Katharina. Malt limit dextrinase and its importance in brewing. 1997.117 p. + app. 28 p.
324 Mangs, Johan & Keski-Rahkonen, Olavi. Full-scale fire experiments on vertical and horizontal cable trays. 1997. 58 p. + app. 44 p.
325 Kauppinen, Pentti. The evaluation of integrity and elasticity of thermally sprayed ceramic coatings by ultrasonics. 1997. 130 p.
326 Tuomisaari, Maarit. Smoke ventilation in operational fire fighting. 1997. 52 p.327 Knuuttila, Matti. A novel acoustic method for gas flow measurement using corre
lation techniques. 1997. 75 p.328 Lehtila, Antti, Savolainen, Dkka & Tuhkanen, Sami. Indicators of C02 emissions
and energy efficiency. Comparison of Finland with other countries. 1997. 80 p. + app. 31 p.
329 Vahanne, Pasi. Urban erosion control in the Triangulo pilot study area Nacala city, Mozambique, Equatorial Africa. A multidisciplinary approach with specific emphasis on control of gully erosion by labour intensive construction work. 1997. 161 p. + app. 13 p.
330 Simell, Pekka. Catalytic hot gas cleaning of gasification gas. 1997.68 p. + app. 87 p.
331 Rasilainen, Kari. Matrix diffusion model. In situ tests using natural analogues. 1997. 81 p. + app. 67 p.
332 Bjorkman, Jouni & Keski-Rahkonen, Olavi. Full-scale experiments with different smokes. 1997. 18 p. + app. 62 p.
333 Malkki, Helena & Frilander, Pertti. Life cycle assessment of peat utilisation in Finland. 1997. 86 p. + app. 6 p.
334 Gowda, Shankare, Kortesmaa, Markku & Ranta-Maunus, Alpo. Duration of load effect on curved glulam beams. Part 2. Long term load tests and analysis. 1998. 76 p. + app. 28 p.
335 Hanhijarvi, Antti, Kortesmaa, Markku & Fonselius, Mikael. Computational optimisation of test specimen for planar shear strength tests of wood based panels. 1998. 46 p.
336 Latva-Somppi, Jouko. Experimental studies on pulp and paper mill sludge ash behavior in fluidized bed combustors. 1998.
337 Hyotylainen, Raimo. Implementation of technical change as organizational problemsolving process. Management and user activities. 1998. 238 p. + app. 12 p.
338 Sinisalo, Jukka. Estimation of greenhouse impacts of continuous regional emissions. 1998. 54 p. + app. 102 p.
339 Tuomisaari, Maarit, Baroudi, Djebar & Latva, Risto. Extinguishing smouldering fires in silos. BRANDFORSK project 745-961. 1998. 74 p.