External Tank (ET) Foam Thermal/Structural Analysis Project · External Tank (ET) Foam...
79
January 2008 NASA/TM-2008- 215102 NESC-RP-06-55/06-012-I External Tank (ET) Foam Thermal/Structural Analysis Project David F. Moore NASA Langley Research Center, Hampton, Virginia Eugene K. Ungar NASA Johnson Space Center, Houston, Texas Li C. Chang NASA Glenn Research Center, Cleveland, Ohio Eric T. Malroy NASA Johnson Space Center, Houston, Texas Ryan A. Stephan NASA Johnson Space Center, Houston, Texas https://ntrs.nasa.gov/search.jsp?R=20080014306 2020-02-29T20:37:42+00:00Z
Transcript of External Tank (ET) Foam Thermal/Structural Analysis Project · External Tank (ET) Foam...
January 2008
NASA/TM-2008- 215102NESC-RP-06-55/06-012-I
External Tank (ET) Foam Thermal/StructuralAnalysis ProjectDavid F. MooreNASA Langley Research Center, Hampton, Virginia
Eugene K. UngarNASA Johnson Space Center, Houston, Texas
Li C. ChangNASA Glenn Research Center, Cleveland, Ohio
Eric T. MalroyNASA Johnson Space Center, Houston, Texas
Ryan A. StephanNASA Johnson Space Center, Houston, Texas
https://ntrs.nasa.gov/search.jsp?R=20080014306 2020-02-29T20:37:42+00:00Z
The NASA STI Program Office . . . in Profile
Since its founding, NASA has been dedicated to theadvancement of aeronautics and space science. TheNASA Scientific and Technical Information (STI)Program Office plays a key part in helping NASAmaintain this important role.
The NASA STI Program Office is operated byLangley Research Center, the lead center for NASA’sscientific and technical information. The NASA STIProgram Office provides access to the NASA STIDatabase, the largest collection of aeronautical andspace science STI in the world. The Program Office isalso NASA’s institutional mechanism fordisseminating the results of its research anddevelopment activities. These results are published byNASA in the NASA STI Report Series, whichincludes the following report types:
TECHNICAL PUBLICATION. Reports ofcompleted research or a major significant phaseof research that present the results of NASAprograms and include extensive data ortheoretical analysis. Includes compilations ofsignificant scientific and technical data andinformation deemed to be of continuingreference value. NASA counterpart of peer-reviewed formal professional papers, but havingless stringent limitations on manuscript lengthand extent of graphic presentations.
TECHNICAL MEMORANDUM. Scientificand technical findings that are preliminary or ofspecialized interest, e.g., quick release reports,working papers, and bibliographies that containminimal annotation. Does not contain extensiveanalysis.
CONTRACTOR REPORT. Scientific andtechnical findings by NASA-sponsoredcontractors and grantees.
CONFERENCE PUBLICATION. Collectedpapers from scientific and technicalconferences, symposia, seminars, or othermeetings sponsored or co-sponsored by NASA.
SPECIAL PUBLICATION. Scientific,technical, or historical information from NASAprograms, projects, and missions, oftenconcerned with subjects having substantialpublic interest.
TECHNICAL TRANSLATION. English-language translations of foreign scientific andtechnical material pertinent to NASA’s mission.
Specialized services that complement the STIProgram Office’s diverse offerings include creatingcustom thesauri, building customized databases,organizing and publishing research results ... evenproviding videos.
For more information about the NASA STI ProgramOffice, see the following:
Access the NASA STI Program Home Page athttp://www.sti.nasa.gov
E-mail your question via the Internet [email protected]
Fax your question to the NASA STI Help Deskat (301) 621-0134
Phone the NASA STI Help Desk at(301) 621-0390
Write to:NASA STI Help DeskNASA Center for AeroSpace Information7115 Standard DriveHanover, MD 21076-1320
NASA Engineering and Safety CenterLangley Research CenterHampton, Virginia 23681-2199
January 2008
NASA/TM-2008- 215102NESC-RP-06-55/06-012-I
External Tank (ET) Foam Thermal/StructuralAnalysis ProjectDavid F. MooreNASA Langley Research Center, Hampton, Virginia
Eugene K. UngarNASA Johnson Space Center, Houston, Texas
Li C. ChangNASA Glenn Research Center, Cleveland, Ohio
Eric T. MalroyNASA Johnson Space Center, Houston, Texas
Ryan A. StephanNASA Johnson Space Center, Houston, Texas

Available from:NASA Center for AeroSpace Information (CASI)
7115 Standard DriveHanover, MD 21076-1320
(301) 621-0390
The use of trademarks or names of manufacturers in the report is for accurate reporting and does notconstitute an official endorsement, either expressed or implied, of such products or manufacturers by theNational Aeronautics and Space Administration.

NASA Engineering and Safety CenterTechnical Assessment Report
Document #:
RP-06-55Version:
1.0
Title:
External Tank (ET) Foam Thermal Analysis ProjectPage #:
1 of 74
NESC Request No. 06-012-I
External Tank (ET) Foam Thermal/Structural Analysis
June 27, 2006
NASA Engineering and Safety CenterTechnical Assessment Report
Document #:
RP-06-55Version:
1.0
Title:
External Tank (ET) Foam Thermal Analysis ProjectPage #:
2 of 74
NESC Request No. 06-012-I
TABLE OF CONTENTS
Volume I: Technical Consultation Report1.0 Authorization and Notification........................................................................................ 52.0 Signature Page................................................................................................................... 63.0 Team Members, Ex Officio Members, and Consultants ............................................... 74.0 Executive Summary .......................................................................................................... 85.0 Consultation Plan.............................................................................................................. 96.0 Description of the Problem, Proposed Solutions, and Risk Assessment .................... 10
6.1 Description of the Problem ...................................................................................... 106.2 Proposed Solution ..................................................................................................... 106.3 Risk Assessment ........................................................................................................ 10
7.0 Configurations Analyzed................................................................................................ 117.1 Methodology .............................................................................................................. 137.2 The Bipod Closeout Models ..................................................................................... 157.3 The IFR Precursor Models ...................................................................................... 267.4 The Detailed IFR Models ......................................................................................... 31
8.0 Findings, Recommendations, and Observations .......................................................... 618.1 Findings...................................................................................................................... 618.2 Recommendations ..................................................................................................... 628.3 Observations .............................................................................................................. 62
9.0 Lessons Learned.............................................................................................................. 6310.0 Definition of Terms ......................................................................................................... 6311.0 Alternate View Point....................................................................................................... 6312.0 List of Acronyms ............................................................................................................. 64
Volume II: AppendicesAppendix A. ITA/I Request Form (NESC-PR-003-FM-01)................................................... 66Appendix B. FoamMechanical Properties .............................................................................. 69
List of FiguresFigure 7.0-1. Bipod Closeout....................................................................................................... 11Figure 7.0-2. LH2 Ice/Frost Ramp ............................................................................................... 12Figure 7.0-3. LO2 Ice/Frost Ramps STS-114 ET Separation Photograph .................................. 12Figure 7.2-1. Bipod Closeout....................................................................................................... 15Figure 7.2-2. Finite Element Mesh for the Two Bipod Closeout Models ................................... 16Figure 7.2-3. Steady-State Temperature Profile Near Bipod Fitting ........................................... 18Figure 7.2-4 Bipod Closeout Model near the Bipod Fitting ......................................................... 19Figure 7.2-5. x in the Bipod Closeout BX-265 Foam (units of psi)............................................ 20Figure 7.2-6. y in the Bipod Closeout BX-265 Foam (units of psi)............................................ 20Figure 7.2-7. z in the Bipod Closeout BX-265 Foam (units of psi)............................................ 21

NASA Engineering and Safety CenterTechnical Assessment Report
Document #:
RP-06-55Version:
1.0
Title:
External Tank (ET) Foam Thermal Analysis ProjectPage #:
3 of 74
NESC Request No. 06-012-I
Figure 7.2-8. zx in the Bipod Closeout BX-265 Foam (units of psi) ........................................... 21Figure 7.2-9. Steady-State Temperature for Interface Model...................................................... 23Figure 7.2-10. Foam Interface Model ........................................................................................... 24Figure 7.2-11. Foam x in the Interface Model (units of psi)....................................................... 24Figure 7.2-12. Foam y in the Interface Model (units of psi)....................................................... 25Figure 7.2-13. Foam z in the Interface Model (units of psi) ....................................................... 25Figure 7.2-14. Foam zx in the Interface Model (units of psi) ...................................................... 26Figure 7.3-1. Initial IFR Redesign Concept................................................................................. 27Figure 7.3-2. IFR Precursor Models ............................................................................................ 27Figure 7.3-3. Thermal Profile in Ramp Model ............................................................................ 28Figure 7.3-4. Finite Element Mesh for IFR Precursor Models .................................................... 28Figure 7.3-5. Foam x in the IFR Precursor Models (units of psi).............................................. 29Figure 7.3-6. Foam y in the IFR Precursor Models (units of psi).............................................. 30Figure 7.3-7. Foam z in the IFR Precursor Models (units of psi) .............................................. 30Figure 7.3-8. Foam yz in the IFR Precursor Models (units of psi) ............................................. 31Figure 7.4-1. LO2 IFR.................................................................................................................. 32Figure 7.4-2. LH2 IFR Model ...................................................................................................... 33Figure 7.4-3. LO2 IFR Model Substrate, Bracketry and NCFI 24-124 Foam ............................. 34Figure 7.4-4. Complete LO2 IFR Model...................................................................................... 35Figure 7.4-5. LH2 IFR Substrate, NCFI 24-124 Foam, Insulators, and Al 2219 Bracket ........... 36Figure 7.4-6. PDL 1034 foam Fill Around Al Bracket Plus Hexcel F161-1581
Mounting Bracket ................................................................................................. 37Figure 7.4-7. Complete LH2 Ice/Frost Ramp Model ................................................................... 37Figure 7.4-8. Temperature Profiles in LO2 Model....................................................................... 39Figure 7.4-9. LH2 Ramp Temperature Profiles – Cold Case ....................................................... 41Figure 7.4-10. LH2 Ramp Temperature Profiles – Hot Case....................................................... 42Figure 7.4-11. LO2 Ramp Model Sections................................................................................... 44Figure 7.4-12. Foam x in the LO2 Ramp Model (units of psi)................................................... 45Figure 7.4.13. Foam y in the LO2 Ramp Model (units of psi) ................................................... 45Figure 7.4-14. Foam z in the LO2 Ramp Model (units of psi) ................................................... 46Figure 7.4-15. Foam xy in the LO2 Ramp Model (units of psi) .................................................. 46Figure 7.4-16. Foam yz in the LO2 Ramp Model (units of psi) .................................................. 47Figure 7.4-17. Foam zx in the LO2 Ramp Model (units of psi) .................................................. 47Figure 7.4-18. Foam Normal Stresses in the LO2 Ramp Model (units of psi) ............................ 48Figure 7.4-19. Foam Shear Stresses in the LO2 Ramp Model (units of psi)................................ 49Figure 7.4-20. Foam Normal Stresses in the LO2 Ramp Model (units of psi) ............................ 50Figure 7.4-21. Foam Shear Stresses in the LO2 Ramp Model (units of psi)................................ 51Figure 7.4-22. LH 2 Ramp Model Sections.................................................................................. 53Figure 7.4-23. x in the LH2 Ramp Model (units of psi) ............................................................. 54Figure 7.4.24. y in the LH2 Ramp Model (units of psi) ............................................................. 54Figure 7.4-25. z in the LH2 Ramp Model (units of psi) ............................................................. 55

NASA Engineering and Safety CenterTechnical Assessment Report
Document #:
RP-06-55Version:
1.0
Title:
External Tank (ET) Foam Thermal Analysis ProjectPage #:
4 of 74
NESC Request No. 06-012-I
Figure 7.4-26. xy in the LH2 Ramp Model (units of psi) ............................................................ 55Figure 7.4-27. yz in the LH2 Ramp Model (units of psi) ............................................................ 56Figure 7.4-28. zx in the LH2 Ramp Model (units of psi) ............................................................ 56Figure 7.4-29. Normal Stresses in the LH2 Ramp Model (units of psi)....................................... 57Figure 7.4-30. Shear Stresses in the LH2 Ramp Model (units of psi).......................................... 58Figure 7.4-31. Normal Stresses in the LH2 Ramp Model (units of psi)....................................... 59Figure 7.4-32. Shear Stresses in the LH2 Ramp Model (units of psi).......................................... 60
NASA Engineering and Safety CenterTechnical Assessment Report
Document #:
RP-06-55Version:
1.0
Title:
External Tank (ET) Foam Thermal Analysis ProjectPage #:
5 of 74
NESC Request No. 06-012-I
Volume I: Technical Consultation Report
1.0 Authorization and NotificationThe request to conduct an assessment on the External Tank (ET) Foam Thermal Analysis Projectwas submitted to the NASA Engineering and Safety Center (NESC) on February 1, 2006.
The authority to proceed was approved in an out-of-board action on February 1, 2006. TheNESC Review Board formally approved the project on March 10, 2006.

NASA Engineering and Safety CenterTechnical Assessment Report
Document #:
RP-06-55Version:
1.0
Title:
External Tank (ET) Foam Thermal Analysis ProjectPage #:
6 of 74
NESC Request No. 06-012-I
2.0 Signature Page
Assessment TeamMembers
Eugene K. Ungar, NESC Lead Li C. Chang, GRC
Eric T. Malroy, JSC David F. Moore, LaRC
Ryan A. Stephan, JSC
NASA Engineering and Safety CenterTechnical Assessment Report
Document #:
RP-06-55Version:
1.0
Title:
External Tank (ET) Foam Thermal Analysis ProjectPage #:
7 of 74
NESC Request No. 06-012-I
3.0 TeamMembers, Ex Officio Members, and Consultants
Eugene K. Ungar, NESC Team LeadLi C. Chang, GRC Structural AnalystEric T. Malroy, JSC Thermal and Fluids AnalystDavid F. Moore, LaRC Structural AnalystRyan A. Stephan, JSC Thermal and Fluids AnalystIvatury S. Raju NESC Structures Discipline ExpertNorman F. Knight GD Structural AnalystJohn Stadler, LaRC Systems EngineeringJaime Belitz, Swales, LaRC SchedulerCindy Bruno, LaRC Program AnalystStacey E. Walker, Swales, LaRC Technical Writer
NASA Engineering and Safety CenterTechnical Assessment Report
Document #:
RP-06-55Version:
1.0
Title:
External Tank (ET) Foam Thermal Analysis ProjectPage #:
8 of 74
NESC Request No. 06-012-I
4.0 Executive Summary
An independent study was performed to assess the pre-launch thermally induced stresses in theSpace Shuttle External Tank Bipod closeout and Ice/Frost ramps (IFRs). Finite element modelswith various levels of detail were built that included the three types of foam (BX-265,NCFI 24-124, and PDL 1034) and the underlying structure and bracketry. Temperature profilesgenerated by the thermal analyses were input to the structural models to calculate the stresslevels. The analysis included both the thermally induced stress and the tank wall stress inducedby the ET pressurization.
An area of high stress in the Bipod closeout was found along the aluminum tank wall near thephenolic insulator and along the phenolic insulator itself. This area of high stress might be proneto cracking and possible delamination.
Removing the front of the hydrogen tank IFR, leaving only the NCFI 24-124 foam, would lowerthe thermally induced stresses in the NCFI 24-124 foam.
The IFR models indicated that the BX-265 foam mini-ramps do not increase the stress in theexisting PDL 1034 foam in either the LO2 IFRs or the LH2 IFRs.
The highest calculated stresses in the BX-265 foam mini-ramps in both the LO2 IFRs and theLH2 IFRs are less than half the extreme values calculated in the Bipod closeout. Thus the mini-ramps are not highly stressed.
The stresses in the NCFI 24-124 foam are highest deep under the LO2 and LH2 IFRs. However,the highest stresses in the LH2 NCFI 24-124 foam are higher than in similar locations in the LO2IFR. This finding is consistent with the dissection results of IFRs on ET-120, which had beenloaded twice with cryogenic propellant. Cracks were found outboard of the cable tray in thesehighly stressed areas of NCFI 24-124 foam on two of the three dissected LH2 IFRs that were inlocations with no protuberance aerodynamic load (PAL) ramp. No cracks were found in any ofthe three LO2 IFRS that were dissected.
NASA Engineering and Safety CenterTechnical Assessment Report
Document #:
RP-06-55Version:
1.0
Title:
External Tank (ET) Foam Thermal Analysis ProjectPage #:
9 of 74
NESC Request No. 06-012-I
5.0 Consultation PlanThis Charter establishes the Independent Thermal/Structural Analysis Team for ET Foam withinthe NESC. It defines the mission, responsibilities, membership, and conduct of operations forthis assessment.
This assessment was initiated out-of-board by the authority of the NESC Deputy Director onFebruary 1, 2006, and was formally approved by the NESC Review Board on March 10, 2006.The objective was to provide an independent assessment of the likelihood of creating thermally-induced cracks in the Shuttle’s ET IFRs and Bipod foam closeout. Mitigators for the thermalstresses were identified.
An NESC team with relevant expertise was formed to perform the assessment. The teamdeveloped thermal and structural models of the oxygen IFRs, hydrogen IFRs, and Bipod foam.The team modeled the foam to identify areas of high stress concentration and assessed thepropensity of cracking.
NASA Engineering and Safety CenterTechnical Assessment Report
Document #:
RP-06-55Version:
1.0
Title:
External Tank (ET) Foam Thermal Analysis ProjectPage #:
10 of 74
NESC Request No. 06-012-I
6.0 Description of the Problem, Proposed Solutions, and RiskAssessment
6.1 Description of the ProblemThe probable underlying cause of the large foam loss from the LH2 tank PAL ramp on STS-114was thermally induced cracks and associated delaminations along the tank substrate1. Althoughthe PAL ramp has been eliminated from the next flight of the Space Shuttle, there was concernthat the Bipod closeout and the IFRs on the ET would be susceptible to similar cracks fromthermally induced stress, which could lead to foam loss.
To address this issue, an independent assessment of pre-launch thermally induced stresses in theBipod closeout and IFR foam was performed. The assessment used highly simplified precursormodels, models where the configuration was simplified, and highly detailed models to identifyand assess regions of high stress.
6.2 Proposed SolutionThe analysis showed high thermal stresses in the Bipod closeout and in the NCFI 24-124 foamunder the LH2 IFRs. The high thermal stresses calculated for the Bipod closeout are inherent in asystem where the warm Bipod fitting is, of necessity, very close to the cryogenic tank. The highthermal stresses in the LH2 IFRs outboard of the cable trays arise from the PDL 1034/NCFI 24-124 foam interface perpendicular to the tank wall. This configuration is also inherentin the foam-on-foam design of the IFRs. The high stress areas could be eliminated byredesigning the Bipod fitting attachment and the IFR foam, but this may not be practicable.
6.3 Risk AssessmentBarring a redesign of the Bipod fitting attachment and the IFR foam, the risk of foam loss duringascent that is caused by cracking and possible delamination at the high stress areas must be dealtwith through a probabilistic risk assessment.
1 STS-114/ET-121 Investigation PAL Ramp Team Report, report number 809-8561, Lockheed-Martin MichoudSpace Systems.
NASA Engineering and Safety CenterTechnical Assessment Report
Document #:
RP-06-55Version:
1.0
Title:
External Tank (ET) Foam Thermal Analysis ProjectPage #:
11 of 74
NESC Request No. 06-012-I
7.0 Configurations AnalyzedThree areas where thermally induced cracking might is likely to prior to launch were addressedin the present work: the Bipod closeout, LH2 IFRs, and LO2 tank IFRs.
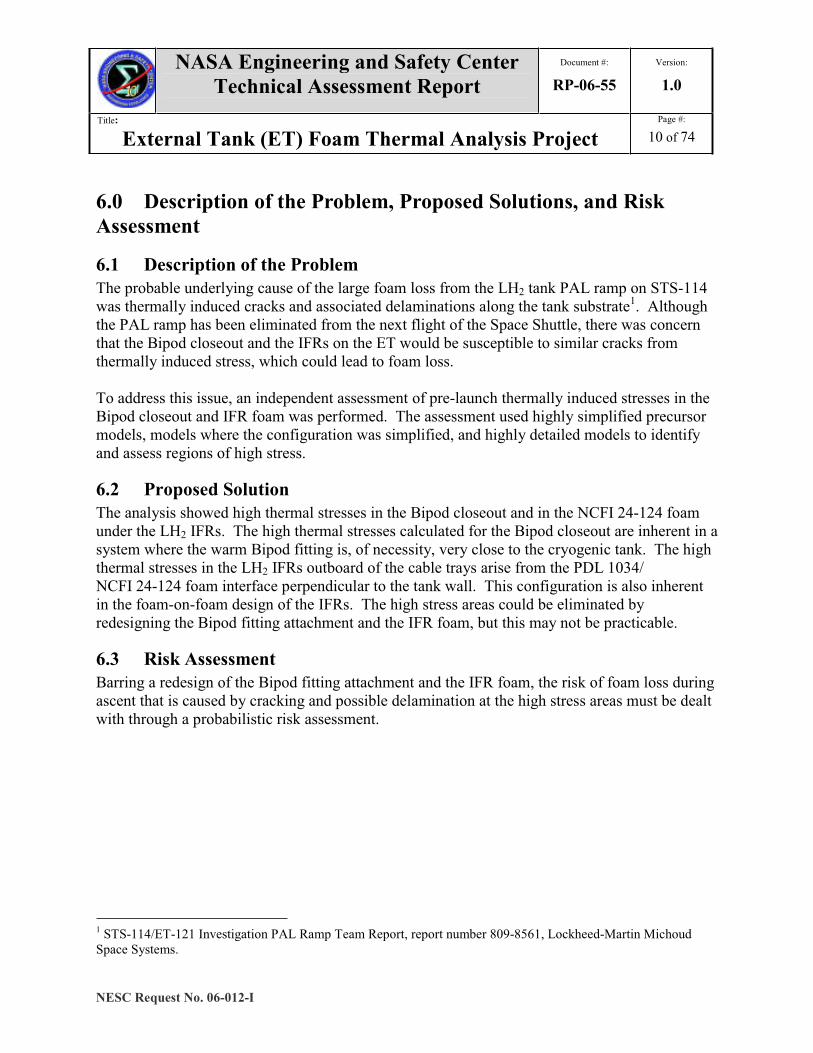
The Bipod closeout was redesigned prior to STS-114. The new closeout, which is also plannedto be used on all future Space Shuttle flights, is shown in Figure 7.0-1. It is a hand-sprayedapplication of BX-265 foam2 that abuts the machine-sprayed NCFI 24-1243 foam on the LH2tank and Intertank and the previously manually applied BX-265 foam over the flange (asindicated by the dotted boundaries shown on Figure 7.0-1). The Bipod closeout was chosen tobe analyzed for thermally induced stresses because it is fairly thick and abuts a foam withdifferent mechanical properties.
direction of flight NCFI 24-124
BX-265BX-265
NCFI 24-124
direction of flightdirection of flight NCFI 24-124
BX-265BX-265
NCFI 24-124
bipodclose
out
direction of flight NCFI 24-124
BX-265BX-265
NCFI 24-124
direction of flightdirection of flight NCFI 24-124
BX-265BX-265
NCFI 24-124
bipodclose
out
Figure 7.0-1. Bipod Closeout
The LH2 IFRs prevent the formation of ice on the LH2 tank cable tray and pressurization linesupport bracketry. A typical LH2 IFR is shown in Figure 7.0-2. The IFRs are a pouredPDL 10344 foam. Because of their thickness (a maximum of approximately 8 inches), andpresence of an interface with the NCFI 24-124 foam, thermally induced cracking is a concern. Inaddition, in the areas where the LH2 PAL ramp has been removed from existing ETs, a hand-sprayed BX-265 foam mini-ramp has been applied to maintain a uniform outer mold line for allof the LH2 IFRs (see right side of Figure 7.0-2). The mini-ramp introduces a third foam in theIFRs, changes the thermally induced stress in that region, and may increase the probability ofthermally-induced cracking.
2 BX-265 is a hand-sprayed closed-cell polyurethane foam.3 NCFI 24-124 is a machine-sprayed closed-cell polyisocyanurate foam.4 PDL 1034 is a poured closed-cell polyurethane foam.

NASA Engineering and Safety CenterTechnical Assessment Report
Document #:
RP-06-55Version:
1.0
Title:
External Tank (ET) Foam Thermal Analysis ProjectPage #:
12 of 74
NESC Request No. 06-012-I
locations where PALramp did not exist
locations where PAL
NCFI 24-124
PDL 1034
cross-section
PDL 1034NCFI 24-124
locations where PALramp did not exist
locations where PALramp has been removed
NCFI 24-124
PDL 1034
BX-265
BX-265
BX-265
cross-section
PDL 1034NCFI 24-124
locations where PALramp did not exist
locations where PAL
NCFI 24-124
PDL 1034
cross-section
PDL 1034NCFI 24-124
locations where PALramp did not exist
locations where PALramp has been removed
NCFI 24-124
PDL 1034
BX-265
BX-265
BX-265
BX-265
BX-265
BX-265
cross-section
PDL 1034NCFI 24-124
Figure 7.0-2. LH2 Ice/Frost Ramp
The LO2 IFRs prevent the formation of ice on the LO2 tank cable tray and pressurization linesupport bracketry. These ramps are shown in Figure 7.0-3. The LO2 IFRs are a pouredPDL 1034 foam. They have a similar interface with the machine-sprayed NCFI 24-124 foam asthe LH2 IFRs, so thermally induced cracking is a concern here as well. In the areas where theLO2 PAL ramp has been removed from existing ETs, a hand-sprayed BX-265 foam mini-ramphas been applied to maintain a uniform outer mold line for the IFRs. The new mini-rampchanges the thermally induced stress in this region and may increase the possibility of cracking.
Figure 7.0-3. LO2 Ice/Frost RampsSTS-114 ET Separation Photograph

NASA Engineering and Safety CenterTechnical Assessment Report
Document #:
RP-06-55Version:
1.0
Title:
External Tank (ET) Foam Thermal Analysis ProjectPage #:
13 of 74
NESC Request No. 06-012-I
7.1 MethodologySimplifications and Assumptions – Several simplifications and assumptions were made in thepresent work. Those specific to particular models are discussed in the appropriate section. Theones that apply globally are discussed here.
In all the models, the ET substrate was modeled as a flat plate. Because of the ET’s 14-footradius of curvature, even the widest model (at 34 inches) has a maximum deviation of less than¾ inch from flat.
In all the models, the foams were assumed to have complete bonding with the tank substrate, theinsulating blocks, bracketry, and with the other foams in the closeout. No voids or defects wereassumed or included in these analysis models.
Foam Material Modeling - Cellular foam materials are difficult to model using the existing finiteelement technology. These foam materials exhibit inhomogeneity, anisotropy, nonlinearity,bimodular behavior, and temperature and strain-rate dependency. Inhomogeneity refers to thecellular nature of the foams and the lack of uniformity of the material due to the presence of knitlines and the non-uniformity of the foam cells. Anisotropy refers to having different materialproperties in different directions. Nonlinearity refers to the relationship between stress andstrain, which usually is assumed to be linear. Bimodular behavior refers to the materialexhibiting different behavior in tension and in compression. Temperature and strain-ratedependencies refer to the state dependencies of the material to temperature and the rate of strain.
Material data from the NASA/Marshall Space Flight Center database for foam materials presenttransversely isotropic tensile properties as a function of temperature. Transverse isotropy meansthe material properties in the longitudinal and circumferential directions are the same, while theproperties in the thickness (or rise) direction are different.
In the finite element analyses reported here, the assumption was made that all foam behaves as atemperature dependent homogeneous linear elastic material with the same moduli in tension andcompression. The mechanical property set used for each of the insulating foams is discussed indetail below.
NCFI 24-124 foam - two temperature dependent property sets are used: isotropic properties andtransversely isotropic properties. For the latter, the properties in the foam rise direction differfrom those in the directions parallel to the foam knit lines. Owing to the fact that theNCFI 24-124 foam is machine sprayed, the knit line orientation is consistent, facilitating the useof transversely isotropic properties. The foam rise direction is taken as perpendicular to the tankwall in all cases.

NASA Engineering and Safety CenterTechnical Assessment Report
Document #:
RP-06-55Version:
1.0
Title:
External Tank (ET) Foam Thermal Analysis ProjectPage #:
14 of 74
NESC Request No. 06-012-I
BX-265 foam – the knit lines in the BX-265 foam hand-sprayed applications analyzed in thepresent work are not consistently oriented with a single axis owing to their applicationtechniques. Therefore, only the temperature dependent isotropic property set is used here.
PDL 1034 foam – the rise direction in the PDL 1034 foam poured applications analyzed in thepresent work are not consistently oriented with a single axis since the pours are made in acomplex mold and must rise around pre-existing bracketry. Therefore, only the temperaturedependent isotropic property set is used here.
The foam mechanical properties are listed in Appendix B. In addition, ultimate strength data forall three insulating foams is given for reference.
Modeling Technique – The thermal and structural models were developed and integrated in twodifferent ways, depending on the complexity of the model. The configurations were simplifiedfor all the models except the detailed models of the LO2 and LH2 IFRs. Here, separate thermaland structural models with identical configurations were developed using different analyticaltools. The thermal model was solved for the steady-state temperature profile and that profile wasused as input to the structural model. Only a single model was developed for each of thecomplex geometries of the LO2 and LH2 IFRs. These models were used for both the thermalanalysis and, using the thermal analysis as input, for the structural analysis.
Stresses Analyzed – In the present work, the intensity of the stress state is characterized byexamining the normal stresses and shear stresses. Because the calculated values of theseparameters depend strongly on the material properties and assumptions used in the analysis(particularly the assumptions of homogeneity5 and linear elastic behavior), the results must beinterpreted with care. The stresses that are calculated by the current finite element modelsshould be used for comparative purposes and not as quantitative measures. The strongestconclusions result from a one-to-one comparison of stresses in similar geometric configurations.Where similar configurations are not available for comparison, the values of the stresses withinthe model are evaluated to identify the areas of highest stress.
Orientation of the Coordinate System - All the results are reported with the coordinate systemarranged so the tank longitudinal axis is along the x axis; y denotes the circumferential directionaround the tank; and the direction perpendicular to the tank wall is z.
5 Lack of sufficient data to characterize the influence of the inhomogeneity aspects of the foam preclude anyassessment of their influence on the results presented.

NASA Engineering and Safety CenterTechnical Assessment Report
Document #:
RP-06-55Version:
1.0
Title:
External Tank (ET) Foam Thermal Analysis ProjectPage #:
15 of 74
NESC Request No. 06-012-I
7.2 The Bipod Closeout ModelsSimplified models of the Bipod closeout region were developed to identify the areas of higheststress. The models were effectively two-dimensional, modeling an axial cross-section of thecloseout as shown in Figure 7.2-1.
directionof flight
plane ofanalysis
directionof flight
plane ofanalysis
Figure 7.2-1. Bipod Closeout
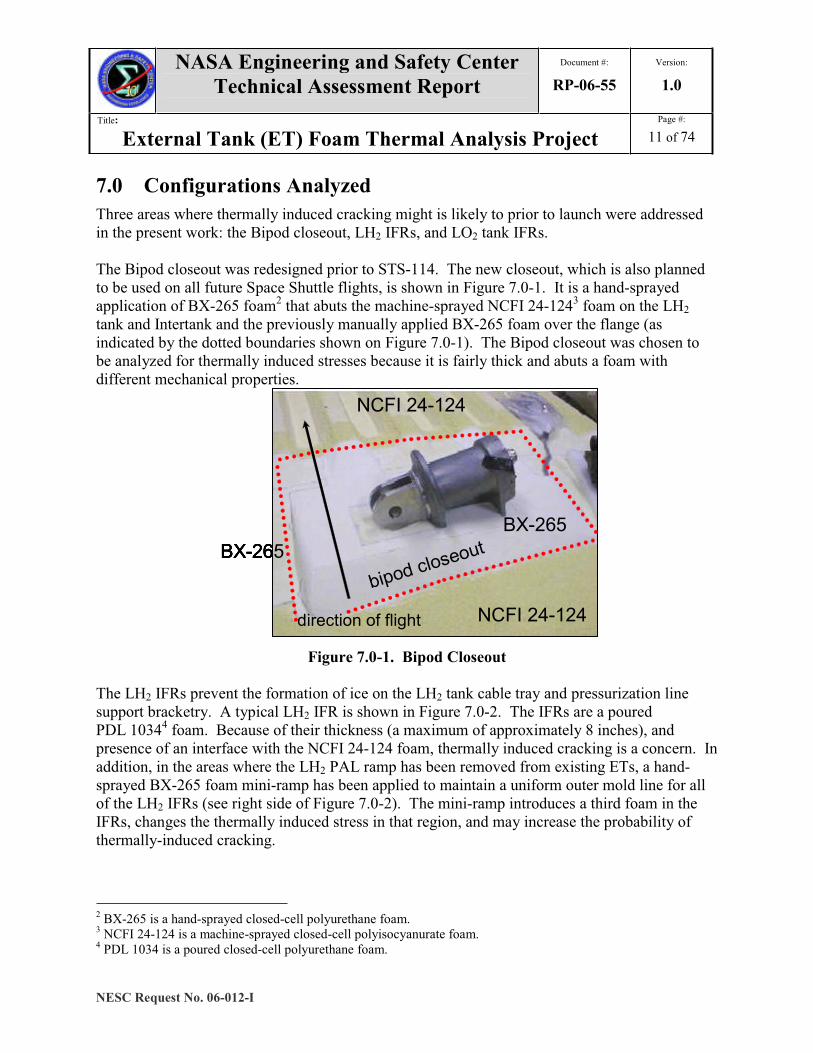
Two models were built to investigate stresses near the Bipod fitting and at theBX-265/NCFI 24-124 foam interface. Figure 7.2-2 shows the configuration and the finiteelement meshes used in the models. The Bipod model on the left includes the Aluminum 2219tank wall, A088 glass phenolic insulator that isolates the heated Bipod fitting from the tank, andrepresentations of the copper Bipod fitting heater plate and the base of the Bipod fitting. Themodel is 6-inches wide, allowing essentially two-dimensional results to be obtained along itscenterline. The foam interface model included the tank wall and two types of foam. The 10 by10 inch ¼ inch thick 2219 Al baseplate is covered with a 1 inch thick layer of foam. The foam isevenly divided between BX-265 and NCFI 24-124 foams.
NASA Engineering and Safety CenterTechnical Assessment Report
Document #:
RP-06-55Version:
1.0
Title:
External Tank (ET) Foam Thermal Analysis ProjectPage #:
16 of 74
NESC Request No. 06-012-I
phenolic insulator
bipod fittingbase and
copper heaterplate
BX-265
phenolic insulator
bipod fittingbase and
copper heaterplate
BX-265
2219 Al tank wallphenolic insulator
bipod fittingbase and
copper heaterplate
BX-265
direction of flight
Bipod Model
InterfaceModel
NCFI 24-124BX-265
2219 Al
direction of flight
phenolic insulator
bipod fittingbase and
copper heaterplate
BX-265
phenolic insulator
bipod fittingbase and
copper heaterplate
BX-265
2219 Al tank wallphenolic insulator
bipod fittingbase and
copper heaterplate
BX-265
direction of flight
Bipod Model
InterfaceModel
NCFI 24-124BX-265
2219 Al
NCFI 24-124BX-265
2219 Al
direction of flightFigure 7.2-2. Finite Element Mesh for the Two Bipod Closeout Models
7.2.1 The Bipod Closeout ModelAll dimensions used in the model were taken from the drawings for the ET. The thermal andstructural models were geometrically identical.
Thermal Model – A two-dimensional thermal model of the Bipod closeout region was built inThermal Desktop® to analyze the steady-state temperature field. The following pre-launchboundary conditions were applied to the thermal model:
Tank wall at -423 F
Outer surface of all foam at 70 F
Cut surfaces of the foam were adiabatic
Bipod fitting and underlying copper plate were maintained at 70 F

NASA Engineering and Safety CenterTechnical Assessment Report
Document #:
RP-06-55Version:
1.0
Title:
External Tank (ET) Foam Thermal Analysis ProjectPage #:
17 of 74
NESC Request No. 06-012-I
The pre-launch foam surface temperature can be warmer or colder than the assumed 70 Fdepending on the ambient temperature and the local convection coefficient. The Bipod fitting isactually cooler than 70 F, but remains above freezing. However, since the critical temperaturefor thermal stresses is the -423 F liquid hydrogen temperature, these simplifications should haveonly a small effect on the high stress regions in the foam. Thus, the boundary conditions ofuniform 70 F temperatures for the foam free boundary plus the Bipod fitting and underlyingcopper plate are a reasonable simplification for this analysis.
The thermal properties for all the materials in this and in the other the models developed in thepresent work were taken to be isotropic. The thermal properties used in the present work fornon-metallic materials were obtained from the Lockheed-Martin Michoud Space SystemsDatabase6. The metal thermal properties were obtained from standard references.
The predicted steady-state temperature profile near the Bipod fitting is shown in Figure 7.3-3.The figure shows that the heated Bipod fitting causes a large region of the foam to be maintainedat 70 F. There is an area of large temperature gradients in the foam near the phenolic insulatorwhere the temperature changes from 70 to -423 F across the 0.325 inch thick insulator.
6 Non-metallic thermal conductivities were taken from External Tank Thermal Data Book 80900200102,Revision G, Lockheed-Martin Michoud Space Systems.

NASA Engineering and Safety CenterTechnical Assessment Report
Document #:
RP-06-55Version:
1.0
Title:
External Tank (ET) Foam Thermal Analysis ProjectPage #:
18 of 74
NESC Request No. 06-012-I
Figure 7.2-3. Steady-State Temperature Profile Near Bipod Fitting
Structural Results – The Bipod finite element model was built in the MSC.PATRAN 7 interfaceto the NASTRAN 8 structural analysis code. The model width was taken to be 6 inches, to yieldessentially two-dimensional results along the model’s plane of symmetry. The followingboundary conditions were used:
Reference temperature9 of the materials is 75 F
Applied temperature field per the thermal model results
Tank wall was constrained to be flat
Bipod fitting plane of symmetry (on the far left in Figure 7.2-3) was constrained to beflat and perpendicular to the tank wall
Aluminum 221910 mechanical properties were used for the Bipod fitting and the copper heaterplate for convenience. Because this part of the model was held at a constant 70 F, the thermallydriven dimension change was negligible. In addition, because the titanium Bipod fitting and
7 MSC.PATRAN is a registered trademark of MSC.Software Corporation, Santa Ana, CA.8 NASTRAN is a registered trademark of NASA.9 The reference temperature is the temperature where there is zero thermal strain in the materials.10 All metal structural properties were taken from: Sparks, Scotty, “BiPod Closeout ET Stress Report” LMMSS-ET-SEOS-439, January 23, 2006.
NASA Engineering and Safety CenterTechnical Assessment Report
Document #:
RP-06-55Version:
1.0
Title:
External Tank (ET) Foam Thermal Analysis ProjectPage #:
19 of 74
NESC Request No. 06-012-I
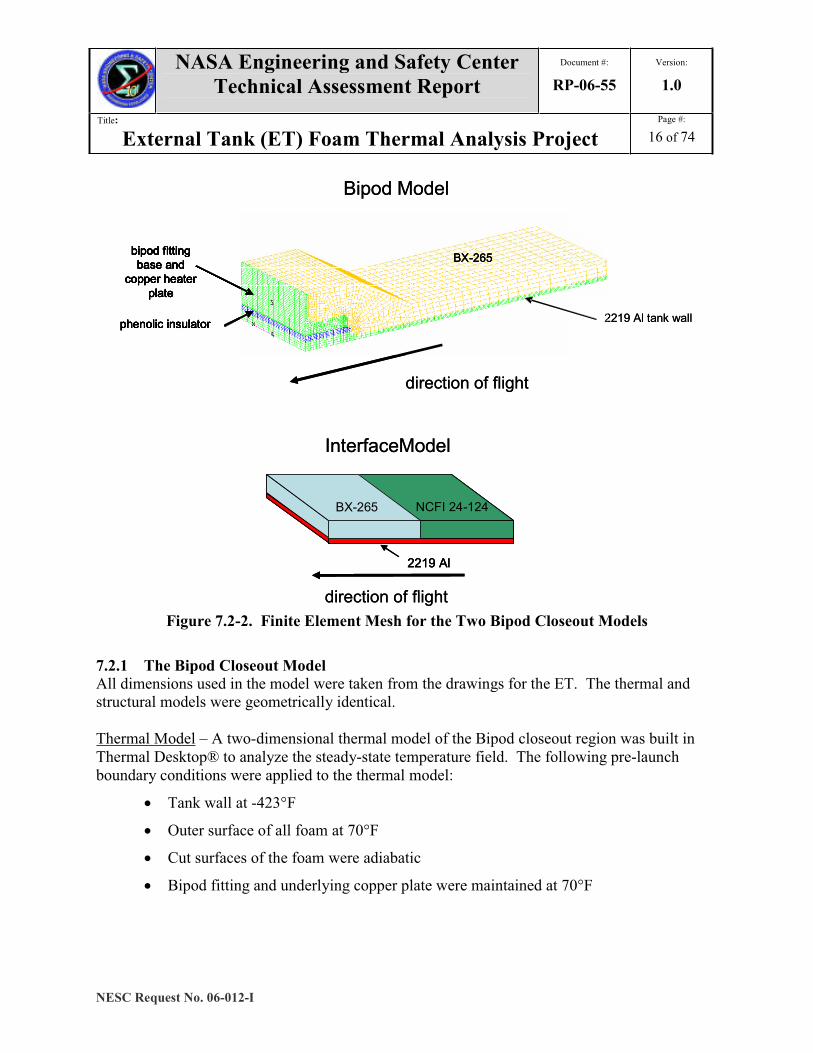
copper heater plate are both orders of magnitude stiffer than the foam11, the analytical use of anymetal’s mechanical properties is acceptable here. The BX-265 foam was modeled as an isotropicmaterial.
Figure 7.2-4 shows the material layout and the mesh used in the NASTRAN model. The mesh inthe foam was refined at the location of maximum thermal gradients near the phenolic insulatorand at the locations of complex geometries.
tank wall
Bipod fittingand copper plate
phenolic insulator
BX-265
tank wall
Bipod fittingand copper plate
phenolic insulator
BX-265
Figure 7.2-4 Bipod Closeout Model near the Bipod Fitting
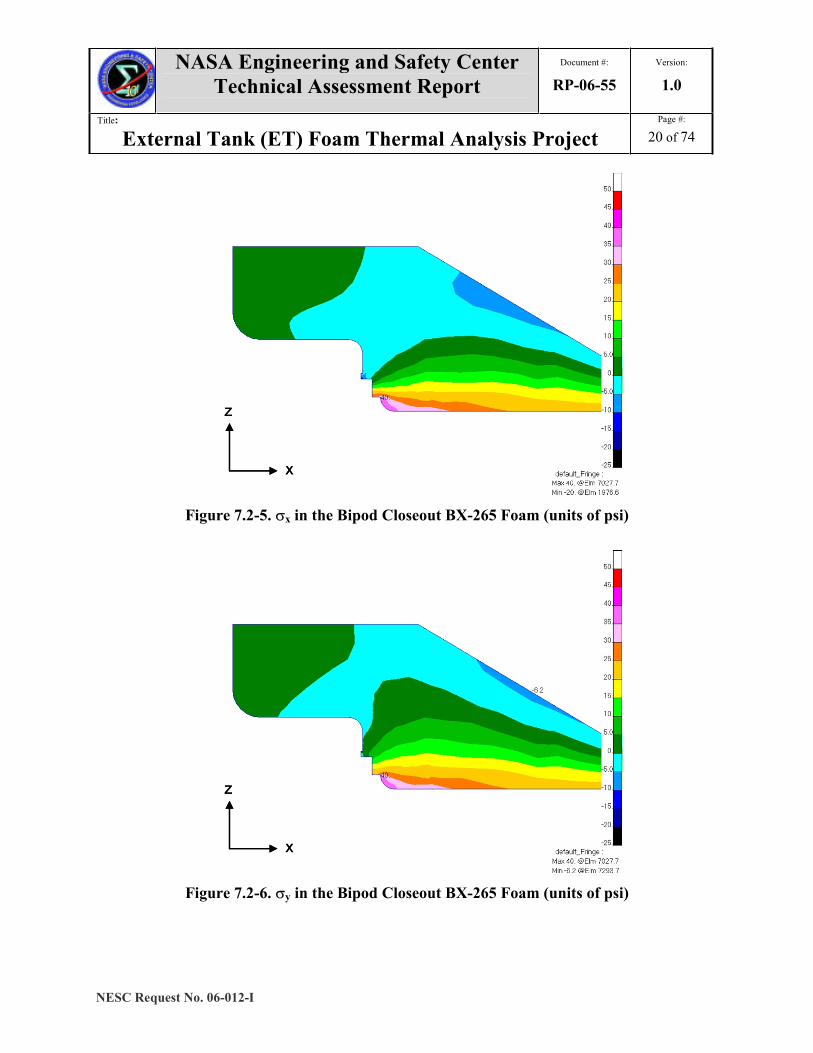
Figures 7.2-5, 6, and 7 show the normal stresses in the foam on the plane of symmetry in thedirection along the tank longitudinal axis, in the circumferential direction, and in the directionperpendicular to the tank wall, respectively. All three figures use the same fixed range scale forthe stress level. Figure 7.2-8 shows the non-zero shear stresses in the foam on the centerlineplane. Owing to symmetry, only zx is non-zero.
11 Foam structural properties were taken from ET Project-Design Values for Non-Metallic Materials provided by theLockheed Martin Space System in a test report "Contract NAS8-00016 WBS 3.6.1.7.2.” – A listing of foammechanical properties is contained in Appendix B.
NASA Engineering and Safety CenterTechnical Assessment Report
Document #:
RP-06-55Version:
1.0
Title:
External Tank (ET) Foam Thermal Analysis ProjectPage #:
20 of 74
NESC Request No. 06-012-I
x
z
x
z
x
z
Figure 7.2-5. x in the Bipod Closeout BX-265 Foam (units of psi)
x
z
x
z
x
z
Figure 7.2-6. y in the Bipod Closeout BX-265 Foam (units of psi)

NASA Engineering and Safety CenterTechnical Assessment Report
Document #:
RP-06-55Version:
1.0
Title:
External Tank (ET) Foam Thermal Analysis ProjectPage #:
21 of 74
NESC Request No. 06-012-I
x
z
x
z
x
z
Figure 7.2-7. z in the Bipod Closeout BX-265 Foam (units of psi)
x
z
x
z
x
z
Figure 7.2-8. zx in the Bipod Closeout BX-265 Foam (units of psi)

NASA Engineering and Safety CenterTechnical Assessment Report
Document #:
RP-06-55Version:
1.0
Title:
External Tank (ET) Foam Thermal Analysis ProjectPage #:
22 of 74
NESC Request No. 06-012-I
The Bipod closeout stress figures show a region of high tensile and shear stress located along thealuminum tank wall near the phenolic insulator and along the phenolic insulator itself. This areaof high stress might be prone to cracking. In particular, the transverse normal stress z exhibits ahigh local “peel” stress behavior near the interface. This result does not conflict with thedissection results from the Bipod foam qualification tests12 and the dissection results13 of theET-120 Bipod closeout (ET-120 had been loaded twice with cryogenic fuel). The qualificationtest closeout showed no through cracking that was not associated with the details of the testconfiguration. The ET-120 dissection showed several through cracks in the Bipod closeout,although those cracks were not on the fitting centerline which is modeled here. The thermallyinduced stresses in those locations may have been exacerbated by three-dimensional effects inthe closeout or the inhomogeneity and anisotropy of the foam material.
7.2.2 The Foam Interface ModelThe foam interface model shown in Figure 7.2-2 was modeled a 10 by 10 inch piece of 1 inchthick foam on a 0.25 inch thick 2219 Al plate. The foam was half NCFI 24-124 foam and halfBX-265 foam with an interface perpendicular to the plate.
Thermal Results – A two-dimensional thermal model of the interface was built in ThermalDesktop® to solve for the temperature field. The following boundary conditions were used:
Tank wall at -423 F
Outer surface of all foam at 70 F
Cut surfaces of the foam were adiabatic
The steady-state temperature profile for this model is shown in Figure 7.2-9. The slightunevenness in the temperature profiles at the center of the model is caused by the difference inthermal conductivities between the BX-265 and NCFI 24-124 foams.
12 Kevin C. Davis External Tank Return to Flight Test Report 809-9486 Bipod TPS Thermal Vacuum Test Report,Lockheed-Martin Michoud Space Systems, February 19, 2005.13 MSFC Engineering Directorate M&P Laboratory, ET-120 & Related Dissection Summary, presented at MSFCEng Assessment Team TIM 1/23/06.

NASA Engineering and Safety CenterTechnical Assessment Report
Document #:
RP-06-55Version:
1.0
Title:
External Tank (ET) Foam Thermal Analysis ProjectPage #:
23 of 74
NESC Request No. 06-012-I
x
z
NCFI 24-124 BX-265
2219 Al
x
z
x
z
NCFI 24-124 BX-265
2219 Al
Figure 7.2-9. Steady-State Temperature for Interface Model
Structural Results – The finite element model for this case was built in the PATRAN interface tothe NASTRAN structural analysis code. The structural model was run using the followingboundary conditions:
Reference temperature of the materials is 75 F
Final temperature per the thermal model results
2219 Al was constrained to be flat
The BX-265 foam was modeled with isotropic properties. Transversely isotropic properties wereused for the NCFI 24-124 foam. Figure 7.2-10 shows the material layout and finite elementmesh in the model. The finite element mesh was defined so that the largest dimension of anyelement did not exceed 0.1 inch. The relative positions of the materials are maintained throughthe presentation and discussion of these results.

NASA Engineering and Safety CenterTechnical Assessment Report
Document #:
RP-06-55Version:
1.0
Title:
External Tank (ET) Foam Thermal Analysis ProjectPage #:
24 of 74
NESC Request No. 06-012-I
NCFI 24-124 BX-265
2219 Al
NCFI 24-124 BX-265
2219 Al2219 AlFigure 7.2-10. Foam Interface Model
Figures 7.2-11, 12, and 13 show the normal stresses in the foam calculated on the plane ofsymmetry in the direction along the tank longitudinal axis, in the circumferential direction, andin the direction perpendicular to the tank wall, respectively. All three figures use the same fixedrange scale for the stress level. Figure 7.2-14 shows the non-zero foam shear stresses along thesame plane.
Figure 7.2-11. Foam x in the Interface Model (units of psi)

NASA Engineering and Safety CenterTechnical Assessment Report
Document #:
RP-06-55Version:
1.0
Title:
External Tank (ET) Foam Thermal Analysis ProjectPage #:
25 of 74
NESC Request No. 06-012-I
Figure 7.2-12. Foam y in the Interface Model (units of psi)
Figure 7.2-13. Foam z in the Interface Model (units of psi)

NASA Engineering and Safety CenterTechnical Assessment Report
Document #:
RP-06-55Version:
1.0
Title:
External Tank (ET) Foam Thermal Analysis ProjectPage #:
26 of 74
NESC Request No. 06-012-I
Figure 7.2-14. Foam zx in the Interface Model (units of psi)
The figures indicate a small region of slightly increased stress in the NCFI 24-124 foam near thejoint with BX-265 foam. Overall, however, the presence of the interface does not substantiallyincrease the thermally induced stress levels in the foams.
7.3 The IFR Precursor ModelsWhen the present work was begun, there was a plan to reduce thermal stresses in the LH2 IFRsby removing the front part of the ramps (their “toes”). The planned flight configuration is shownin Figure 7.3-1. Two highly simplified models were built to provide a quick assessment of theeffect of removing the IFR toe. One model was a simplified representation of the PDL 1034foam ramp over machine-sprayed NCFI 24-124 foam. The second represented the NCFI 24-124foam alone.

NASA Engineering and Safety CenterTechnical Assessment Report
Document #:
RP-06-55Version:
1.0
Title:
External Tank (ET) Foam Thermal Analysis ProjectPage #:
27 of 74
NESC Request No. 06-012-I
footprint ofexisting “toe”footprint ofexisting “toe”
Figure 7.3-1. Initial IFR Redesign Concept
The geometries of these precursor models are shown in Figure 7.3-2. Both models include1 inch of NCFI 24-124 foam on a 0.1 inch 2195 Al-Li plate. The ramp model has a 6 by 18 inchAl-Li baseplate. This model also includes a 6-inch wide by 4-inch tall ramp, representingapproximately half the maximum IFR height. The no-ramp model has a 10 by 10 inch Al-Libaseplate.
10 x 10 inmodel
1 in NCFI0.1 in Al-Li
NCFI
PDL
6 in wide ramp
4 in tallramp
6 x 18 in model
10 x 10 inmodel
1 in NCFI0.1 in Al-Li
NCFI
PDL
6 in wide ramp
4 in tallramp
6 x 18 in model
No-ramp ModelRamp Model
10 x 10 inmodel
1 in NCFI0.1 in Al-Li
NCFI
PDL
6 in wide ramp
4 in tallramp
6 x 18 in model
10 x 10 inmodel
1 in NCFI0.1 in Al-Li
NCFI
PDL
6 in wide ramp
4 in tallramp
6 x 18 in model
No-ramp ModelRamp Model
Figure 7.3-2. IFR Precursor Models
Thermal Results – Two-dimensional thermal models were built in Thermal Desktop® tocalculate the pre-launch thermal field in the foam. The following boundary conditions wereused:
Tank wall at -423 F
Outer surface of foam at 70 F
NASA Engineering and Safety CenterTechnical Assessment Report
Document #:
RP-06-55Version:
1.0
Title:
External Tank (ET) Foam Thermal Analysis ProjectPage #:
28 of 74
NESC Request No. 06-012-I
Cut surfaces of the foam were adiabatic
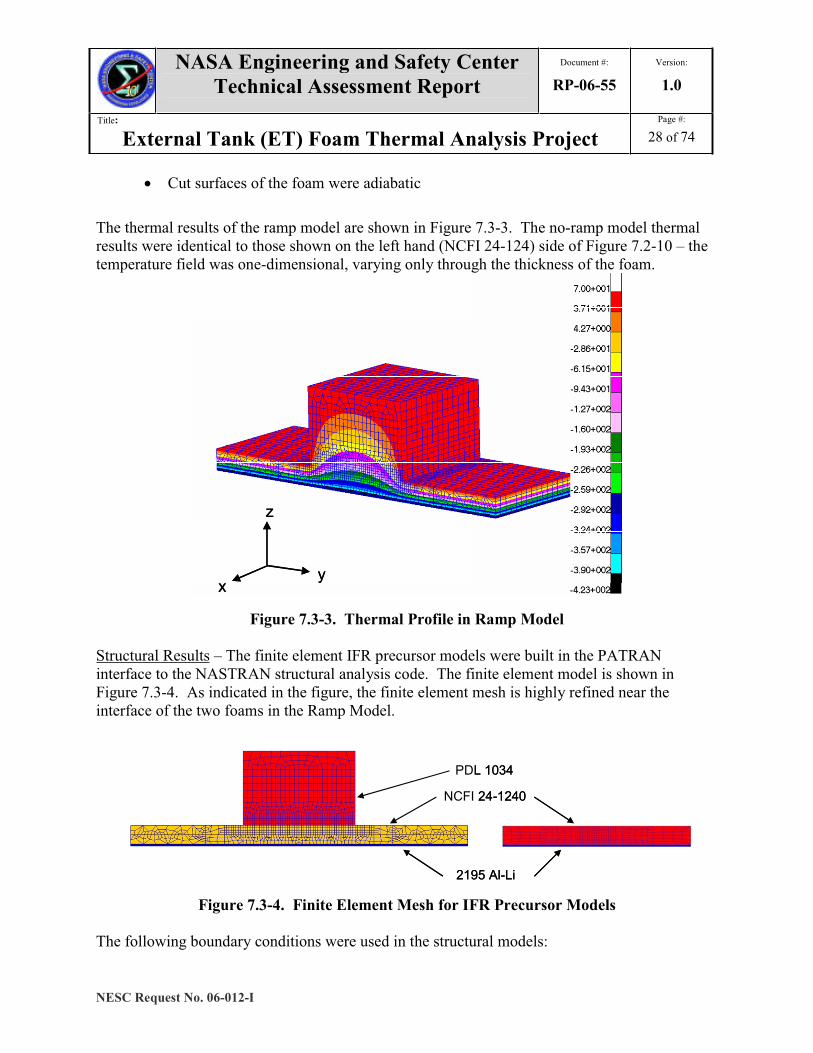
The thermal results of the ramp model are shown in Figure 7.3-3. The no-ramp model thermalresults were identical to those shown on the left hand (NCFI 24-124) side of Figure 7.2-10 – thetemperature field was one-dimensional, varying only through the thickness of the foam.
x
z
yx
z
y
Figure 7.3-3. Thermal Profile in Ramp Model
Structural Results – The finite element IFR precursor models were built in the PATRANinterface to the NASTRAN structural analysis code. The finite element model is shown inFigure 7.3-4. As indicated in the figure, the finite element mesh is highly refined near theinterface of the two foams in the Ramp Model.
2195 Al-Li
NCFI 24-1240
PDL 1034
2195 Al-Li
NCFI 24-1240
PDL 1034
Figure 7.3-4. Finite Element Mesh for IFR Precursor Models
The following boundary conditions were used in the structural models:

NASA Engineering and Safety CenterTechnical Assessment Report
Document #:
RP-06-55Version:
1.0
Title:
External Tank (ET) Foam Thermal Analysis ProjectPage #:
29 of 74
NESC Request No. 06-012-I
Reference temperature of the materials is 75 F
Temperature distribution per the thermal model results
Al-Li plates were constrained to be flat
The foams were modeled as isotropic materials.
Figure 7.3-5, 6, and 7 compare the foam normal stresses on planes cut through the model centers.All three figures use the same fixed range scale for the stress level. The foam non-zero shearstresses in the same locations are plotted in Figure 7.3-8. The stress contour plots are plotted bymaterial property meaning that stress results for the same material property are smoothed acrosselement boundaries and stress results for elements adjacent to each other with different materialproperties are not. Thus, a discontinuity in the stress results indicates a material propertyinterface.
y
z
y
z
y
z
y
z
y
z
y
z
Figure 7.3-5. Foam x in the IFR Precursor Models (units of psi)

NASA Engineering and Safety CenterTechnical Assessment Report
Document #:
RP-06-55Version:
1.0
Title:
External Tank (ET) Foam Thermal Analysis ProjectPage #:
30 of 74
NESC Request No. 06-012-I
y
z
y
z
y
z
y
z
y
z
y
z
Figure 7.3-6. Foam y in the IFR Precursor Models (units of psi)
y
z
y
z
y
z
y
z
y
z
y
z
Figure 7.3-7. Foam z in the IFR Precursor Models (units of psi)
NASA Engineering and Safety CenterTechnical Assessment Report
Document #:
RP-06-55Version:
1.0
Title:
External Tank (ET) Foam Thermal Analysis ProjectPage #:
31 of 74
NESC Request No. 06-012-I
y
z
y
z
y
z
y
z
y
z
y
z
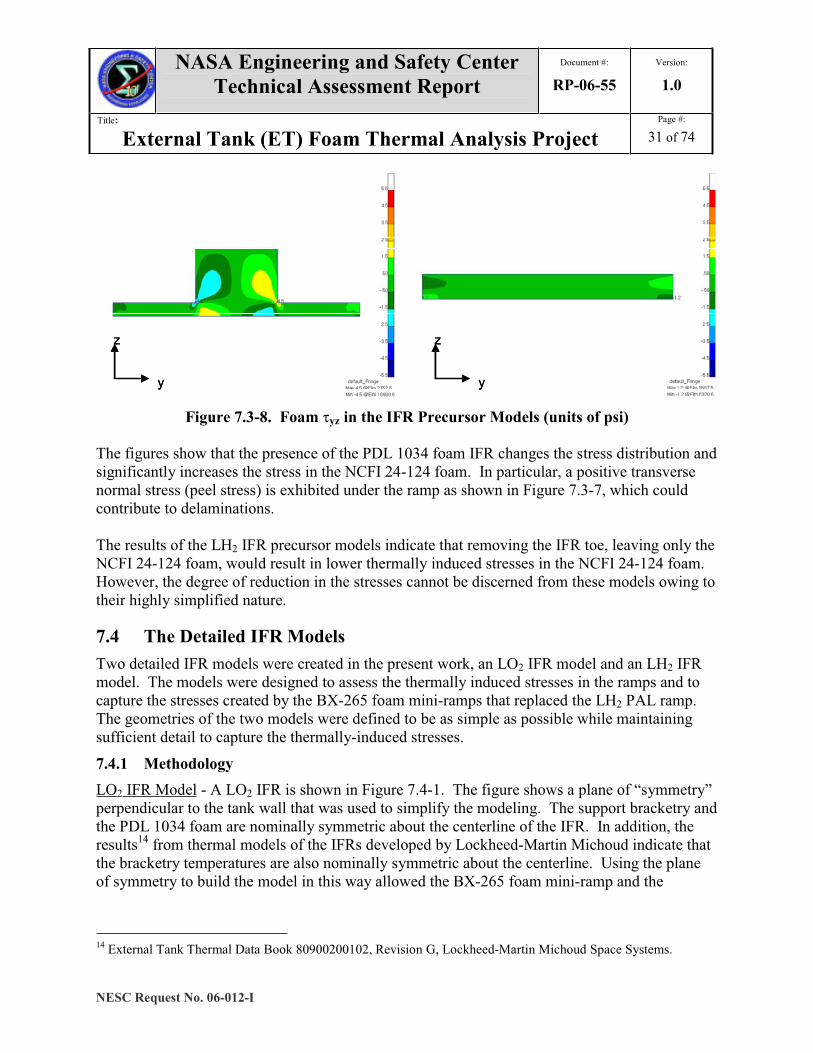
Figure 7.3-8. Foam yz in the IFR Precursor Models (units of psi)
The figures show that the presence of the PDL 1034 foam IFR changes the stress distribution andsignificantly increases the stress in the NCFI 24-124 foam. In particular, a positive transversenormal stress (peel stress) is exhibited under the ramp as shown in Figure 7.3-7, which couldcontribute to delaminations.
The results of the LH2 IFR precursor models indicate that removing the IFR toe, leaving only theNCFI 24-124 foam, would result in lower thermally induced stresses in the NCFI 24-124 foam.However, the degree of reduction in the stresses cannot be discerned from these models owing totheir highly simplified nature.
7.4 The Detailed IFR ModelsTwo detailed IFR models were created in the present work, an LO2 IFR model and an LH2 IFRmodel. The models were designed to assess the thermally induced stresses in the ramps and tocapture the stresses created by the BX-265 foam mini-ramps that replaced the LH2 PAL ramp.The geometries of the two models were defined to be as simple as possible while maintainingsufficient detail to capture the thermally-induced stresses.
7.4.1 MethodologyLO2 IFR Model - A LO2 IFR is shown in Figure 7.4-1. The figure shows a plane of “symmetry”perpendicular to the tank wall that was used to simplify the modeling. The support bracketry andthe PDL 1034 foam are nominally symmetric about the centerline of the IFR. In addition, theresults14 from thermal models of the IFRs developed by Lockheed-Martin Michoud indicate thatthe bracketry temperatures are also nominally symmetric about the centerline. Using the planeof symmetry to build the model in this way allowed the BX-265 foam mini-ramp and the
14 External Tank Thermal Data Book 80900200102, Revision G, Lockheed-Martin Michoud Space Systems.

I External Tank (ET) F o a m Ther ma1 Analysis Project 32 o f 74
PDL 1034 foam that fills the sa*e Space at the nan-PAL ramp locations to be assessed in the
same model.
I Model I I Analysis Configuration
. $lane of "symmetry" BX-265 mini-ramp
Figure 7.4-1. LO2 IFR
The model was built using the configuration for the IFR at station 794 near the
LO2 tanklrntertank flange. The overall configuration of the IFR at this location is typical of the
other LO2 IFRs, but the details present a more severe case for the following reasons. The 1-inch
thick NCFI 24-124 foam machine-sprayed foam at this location is the minimum thickness for
LO2 IFRs. This results in the coldest temperatures at the NCFI 24-124IPDL 1034 foam
interface, yielding the highest thermal stress caused by differential thermal expansion. Also, the
absence of super lightweight ablator (SLA) around the bracket at this location results a larger
region of near-LO2 temperature PDL 1034 foam, yielding the highest thermal stresses.
NESC Request No. 06-012-1
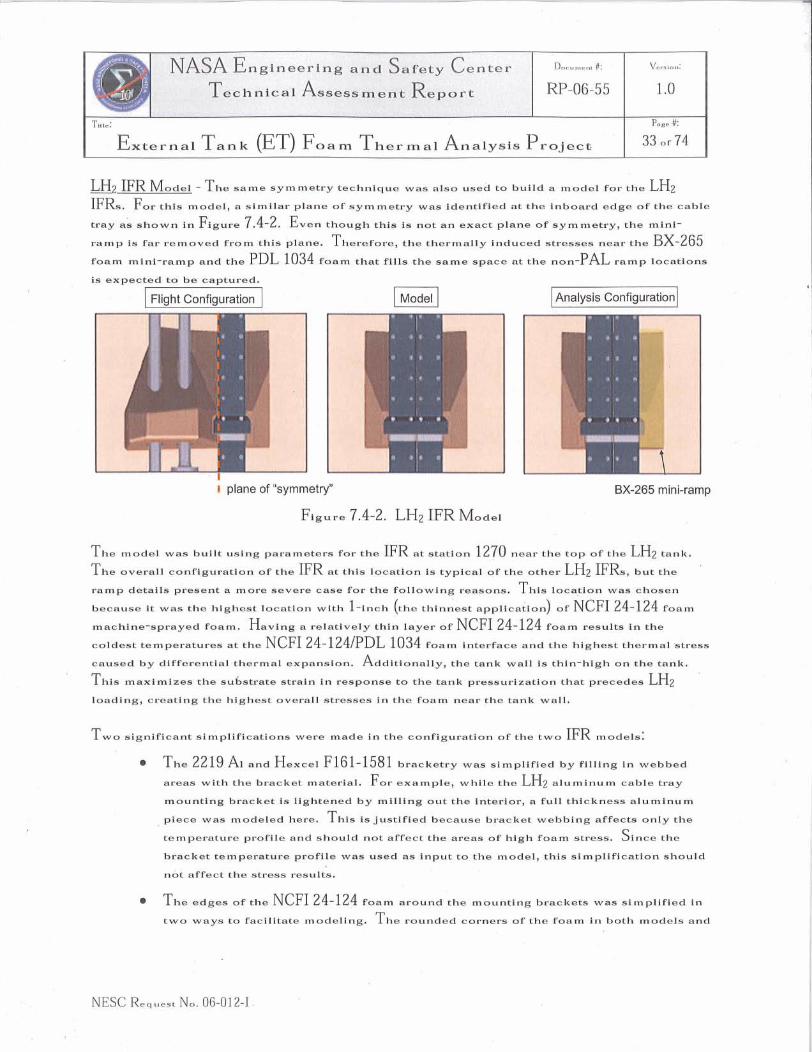
I External Tank (ET) Foam T h e r m a l Analysis Project I I& IFR Model - The same symmetry technique was also used to build a model for the LH2 IFRs. For this model, a similar plane of,symmetry was identified at the inboard edge of the cable
tray as shown in Figure 7.4-2. Even though this ie not an exact plane bf symmetry, the mini-
ramp is far removed from this plane. Therefore, the thermally induced stressgs near the EX-265 foam mini-romp end the PDL 1034 foam that fills the same spaoe at the nan-PAL ramp locations
is expected to be captured.
1rrss4ines p,r*=Sqg tke himest o r e M l a ~ e ~ i ~ s i e s the @oe% naja~ t;- tw& =at.
Two & g a t f i ~ * n O w ~ m p ~ i f l ~ m ~ ~ a n w w m w made Jsr t-ha rsnnflgwra&mn;r of t-he twa Fa naaktf3i5~~
n&t wdTPeot: the &mew mmIIk-,
NESC Resuest No. 06-012-1
NASA Engineering and Safety CenterTechnical Assessment Report
Document #:
RP-06-55Version:
1.0
Title:
External Tank (ET) Foam Thermal Analysis ProjectPage #:
34 of 74
NESC Request No. 06-012-I
the chamfer at the forward edge on the LO2 tank foam were squared off in themodels.
7.4.2 The Models
The two IFR models were built in PATRAN using similar techniques. The substrate, bracketry,and foam geometries were entered to create geometric shapes that were then meshed. Themaximum dimension of any solid element in the models was ¼ inch. The models are discussed,in turn, in the subsequent sections.
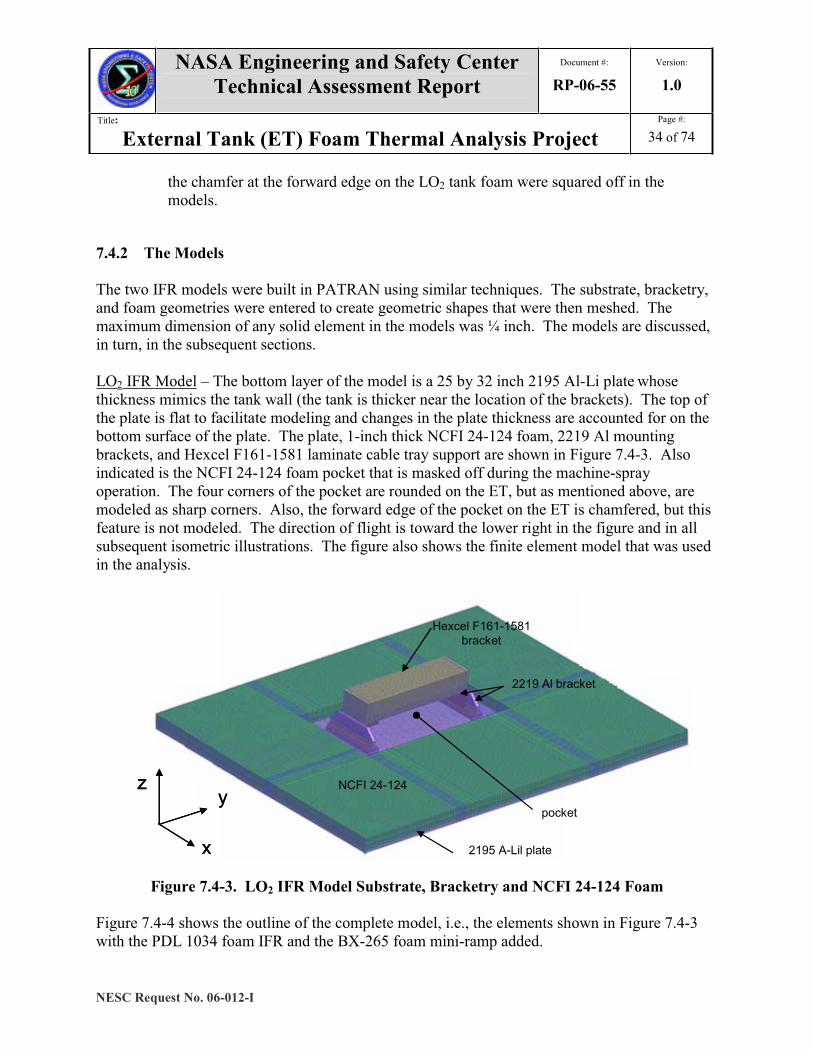
LO2 IFR Model – The bottom layer of the model is a 25 by 32 inch 2195 Al-Li plate whosethickness mimics the tank wall (the tank is thicker near the location of the brackets). The top ofthe plate is flat to facilitate modeling and changes in the plate thickness are accounted for on thebottom surface of the plate. The plate, 1-inch thick NCFI 24-124 foam, 2219 Al mountingbrackets, and Hexcel F161-1581 laminate cable tray support are shown in Figure 7.4-3. Alsoindicated is the NCFI 24-124 foam pocket that is masked off during the machine-sprayoperation. The four corners of the pocket are rounded on the ET, but as mentioned above, aremodeled as sharp corners. Also, the forward edge of the pocket on the ET is chamfered, but thisfeature is not modeled. The direction of flight is toward the lower right in the figure and in allsubsequent isometric illustrations. The figure also shows the finite element model that was usedin the analysis.
x
yz
2219 Al bracket
Hexcel F161-1581bracket
NCFI 24-124
2195 A-Lil platex
yz
x
yz
2219 Al bracket
Hexcel F161-1581bracket
NCFI 24-124
2195 A-Lil plate
Figure 7.4-3. LO2 IFR Model Substrate, Bracketry and NCFI 24-124 Foam
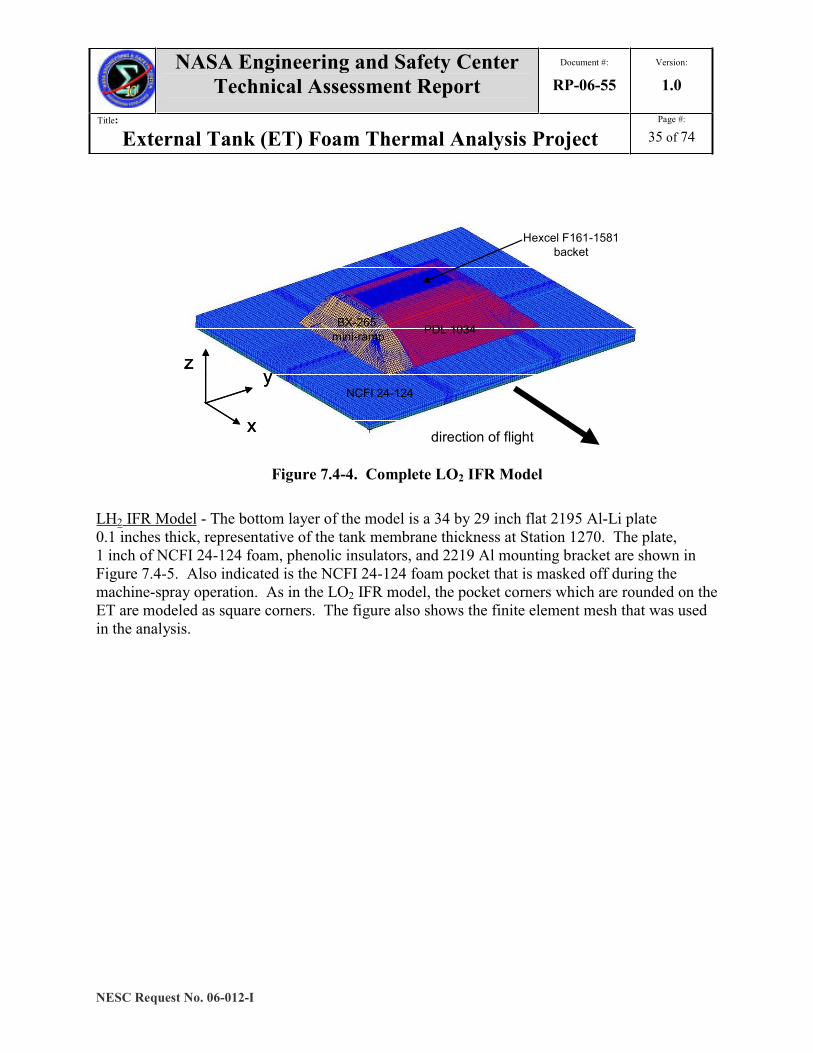
Figure 7.4-4 shows the outline of the complete model, i.e., the elements shown in Figure 7.4-3with the PDL 1034 foam IFR and the BX-265 foam mini-ramp added.
NASA Engineering and Safety CenterTechnical Assessment Report
Document #:
RP-06-55Version:
1.0
Title:
External Tank (ET) Foam Thermal Analysis ProjectPage #:
35 of 74
NESC Request No. 06-012-I
x
yz
BX-265mini-ramp
Hexcel F161-1581backet
NCFI 24-124
PDL 1034
direction of flightx
yz
x
yz
BX-265mini-ramp
Hexcel F161-1581backet
NCFI 24-124
PDL 1034
direction of flight
Figure 7.4-4. Complete LO2 IFR Model
LH2 IFR Model - The bottom layer of the model is a 34 by 29 inch flat 2195 Al-Li plate0.1 inches thick, representative of the tank membrane thickness at Station 1270. The plate,1 inch of NCFI 24-124 foam, phenolic insulators, and 2219 Al mounting bracket are shown inFigure 7.4-5. Also indicated is the NCFI 24-124 foam pocket that is masked off during themachine-spray operation. As in the LO2 IFR model, the pocket corners which are rounded on theET are modeled as square corners. The figure also shows the finite element mesh that was usedin the analysis.

NASA Engineering and Safety CenterTechnical Assessment Report
Document #:
RP-06-55Version:
1.0
Title:
External Tank (ET) Foam Thermal Analysis ProjectPage #:
36 of 74
NESC Request No. 06-012-I
x
yz
2219 Albracketphenolic
insulator
NCFI 24-124
2195 Al-Li plate
x
yz
2219 Albracketphenolic
insulator
NCFI 24-124
2195 Al-Li plate
x
yz
x
yz
2219 Albracketphenolic
insulator
NCFI 24-124
2195 Al-Li plate
Figure 7.4-5. LH2 IFR Substrate, NCFI 24-124 Foam, Insulators, and Al 2219 Bracket
Figure 7.4-6 shows the same configuration as in the previous figure with the addition of theHexcel F161-1581 cable tray mounting bracket and the portion of the PDL 1034 foam that fillsin the NCFI 24-124 foam pocket.

NASA Engineering and Safety CenterTechnical Assessment Report
Document #:
RP-06-55Version:
1.0
Title:
External Tank (ET) Foam Thermal Analysis ProjectPage #:
37 of 74
NESC Request No. 06-012-I
Hexcel F161-1581bracket
PDL 1034 fill
2219 Albracket
NCFI 24-124
Hexcel F161-1581bracket
PDL 1034 fill
2219 Albracket
NCFI 24-124
Figure 7.4-6. PDL 1034 foam Fill Around Al Bracket Plus Hexcel F161-1581 MountingBracket
Figure 7.4-7 shows the complete model. The top of the Hexcel bracket can be seen in line withthe top surface of the PDL 1034 foam ramp.
BX-265mini-ramp
Hexcel F161-1581backet
NCFI 24-124
PDL 1034
x
yz
direction of flight
BX-265mini-ramp
Hexcel F161-1581backet
NCFI 24-124
PDL 1034
x
yz
BX-265mini-ramp
Hexcel F161-1581backet
NCFI 24-124
PDL 1034
x
yz
x
yz
direction of flight
Figure 7.4-7. Complete LH2 Ice/Frost Ramp Model7.4.3 The Thermal ResultsSimilar pre-launch boundary conditions were used for the two detailed IFR models. Thebaseplate was held at the cryogen temperature, -297 F for the LO2 model and -423 F for the LH2model. The cut surfaces of foam along the edges of the models were taken to be adiabatic. For
NASA Engineering and Safety CenterTechnical Assessment Report
Document #:
RP-06-55Version:
1.0
Title:
External Tank (ET) Foam Thermal Analysis ProjectPage #:
38 of 74
NESC Request No. 06-012-I
the LO2 model, the temperatures of the Hexcel bracket were taken from Lockheed MartinMichoud minimum temperature predictions15. Results for two cases from the same source wereused in the LH2 cable tray model. Here maximum and minimum temperature predictions wereused to set the temperatures of the aluminum bracket and Hexcel bracket. The boundaryconditions of the foam exterior were taken to be consistent with the temperature predictions: forminimum temperature case, a cold ambient temperature of 31 F and a still air convectioncoefficient of 0.6 BTU/hr ft2 F16 were applied; for maximum temperature case, an ambienttemperature of 99 F and a 5 knot wind convection coefficient of 1.2 BTU/hr ft2 F were applied.
LO2 IFR Model - The temperature distributions predicted by the LO2 IFR model are shown inFigure 7.4-8. The figure shows the temperature on a plane cut through the center of the modelalong the tank axis and on a circumferential plane cut through the center of the bracket. Thetemperature profiles for all materials in the model are shown in the figures.
15External Tank Thermal Data Book 80900200102, Revision G, Lockheed-Martin Michoud Space Systems.16 Convection coefficients are calculated using HPSim Rev F, Lockheed Martin Michoud Space Systems.

NASA Engineering and Safety CenterTechnical Assessment Report
Document #:
RP-06-55Version:
1.0
Title:
External Tank (ET) Foam Thermal Analysis ProjectPage #:
39 of 74
NESC Request No. 06-012-I
x
z
yx
z
yx
z
yx
z
y
x
z
y
Figure 7.4-8. Temperature Profiles in LO2 Model
The thermal results show the large low temperature area that is created by the 2219 Al mountingbrackets. The figures also show that the presence of the ramp causes low temperatures topenetrate far into the insulating foam. This results in low temperatures at the NCFI 24-124/PDL 1034 foam interface parallel to the tank.

NASA Engineering and Safety CenterTechnical Assessment Report
Document #:
RP-06-55Version:
1.0
Title:
External Tank (ET) Foam Thermal Analysis ProjectPage #:
40 of 74
NESC Request No. 06-012-I
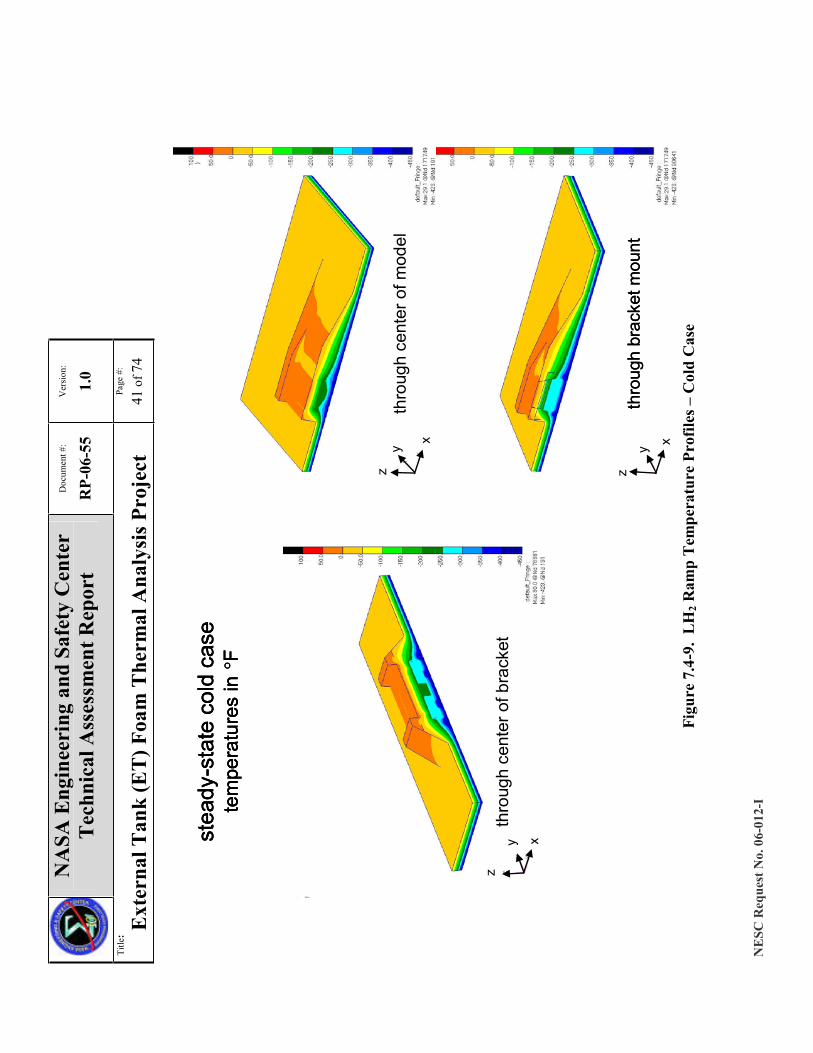
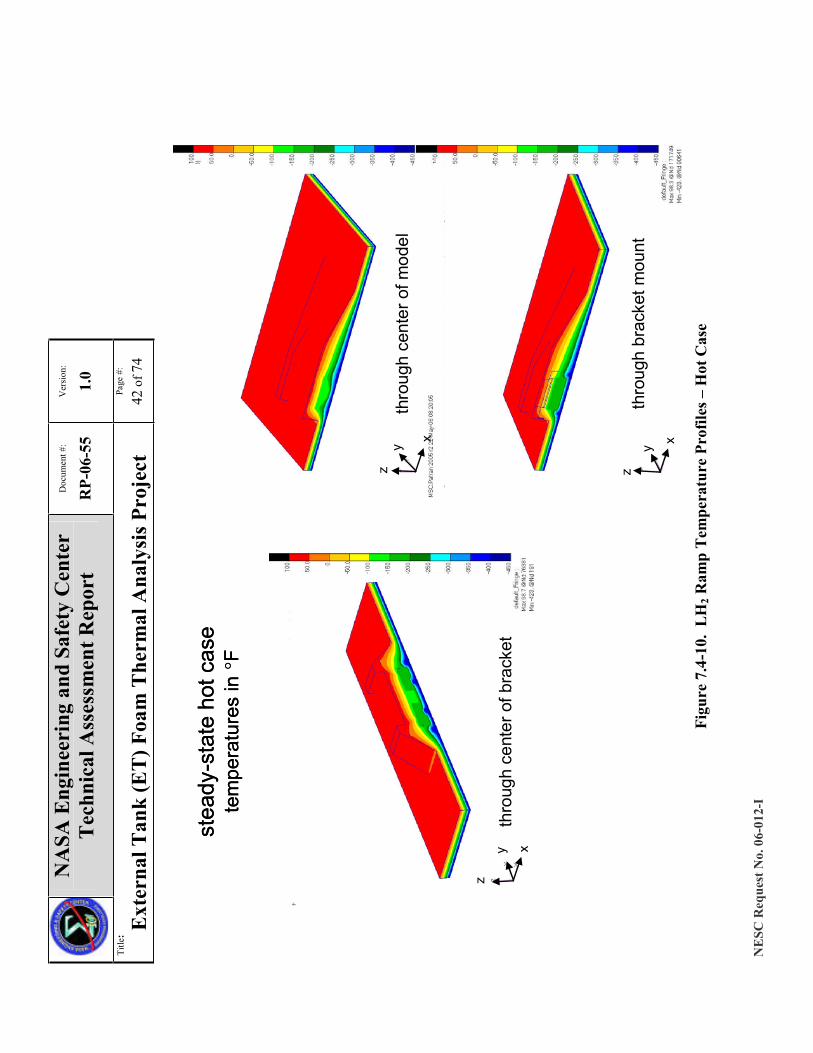
LH2 IFR Model - The temperatures predicted by the LH2 IFR model are shown in Figures 7.4-9and 10. Figure 7.4-9 shows the predicted temperature map for the minimum temperature (cold)case and Figure 7.4-10 shows the results for the maximum temperature (hot) case. The figuresshow the temperature on a plane cut through the center of the model along the tank axis, parallelplane cut through the bracket mount, and circumferential plane through the center of the bracket.The temperature profiles for all materials in the model are shown in the figures.
NASAEngineeringandSafetyCenter
TechnicalAssessmentReport
Document#:
RP-06-55
Version:
1.0
Title:
ExternalTank(ET)FoamThermalAnalysisProject
Page#:
41of74
NESCRequestNo.06-012-I
throughcenterofbracket
throughcenterofmodel
throughbracketmount
steady-statecoldcase
temperaturesin
F
throughcenterofbracket
throughcenterofmodel
throughbracketmount
steady-statecoldcase
temperaturesin
F
throughcenterofbracket
throughcenterofmodel
throughbracketmount
steady-statecoldcase
temperaturesin
F
x
zy
x
zy
x
zy
Figure7.4-9.LH2RampTemperatureProfiles–ColdCase
NASAEngineeringandSafetyCenter
TechnicalAssessmentReport
Document#:
RP-06-55
Version:
1.0
Title:
ExternalTank(ET)FoamThermalAnalysisProject
Page#:
42of74
NESCRequestNo.06-012-I
steady-statehotcase
temperaturesin
F
throughcenterofbracket
throughcenterofmodel
throughbracketmount
steady-statehotcase
temperaturesin
F
throughcenterofbracket
throughcenterofmodel
throughbracketmount
x
zy
x
zy
x
zy
Figure7.4-10.LH2RampTemperatureProfiles–HotCase
NASA Engineering and Safety CenterTechnical Assessment Report
Document #:
RP-06-55Version:
1.0
Title:
External Tank (ET) Foam Thermal Analysis ProjectPage #:
43 of 74
NESC Request No. 06-012-I
The thermal results show that the presence of the ramp causes low temperatures to penetrate farinto the insulating foam. This results in low temperatures at the NCFI 24-124/PDL 1034 foaminterface parallel to the tank.
7.4.4 The Structural Analysis Results
The boundary conditions for the stress analysis were consistent in the two IFR models. Thetemperature field calculated in the thermal models was applied to the structural models. For thecases with pressurization included, values of the hoop stress and axial stress were calculated tobe applied uniformly over the appropriate edges of the tank substrate. The unpressurized caseshad no applied stress at the substrate edges. As in the other models, the plates representing thetank substrate were constrained to be flat, but were allowed to expand and contract freely in-plane. The free edges of the NCFI 24-124 foam were not constrained.
LO2 IFR Model - Three cases were run using the LO2 IFR model. They were:
isotropic properties for all materialso zero tank pressure
transversely isotropic properties for NCFI 24-124 foam, isotropic properties for allother materials
o zero tank pressure
o 35 psig tank pressure17 – the induced stress at the model edges wascalculated based the tank pressure, the substrate thickness at the model edge,and the ET radius18.
The results of the three cases were very similar. The choice of isotropic versus transverselyisotropic properties had only a minor effect on the stresses in the NCFI 24-124 foam.
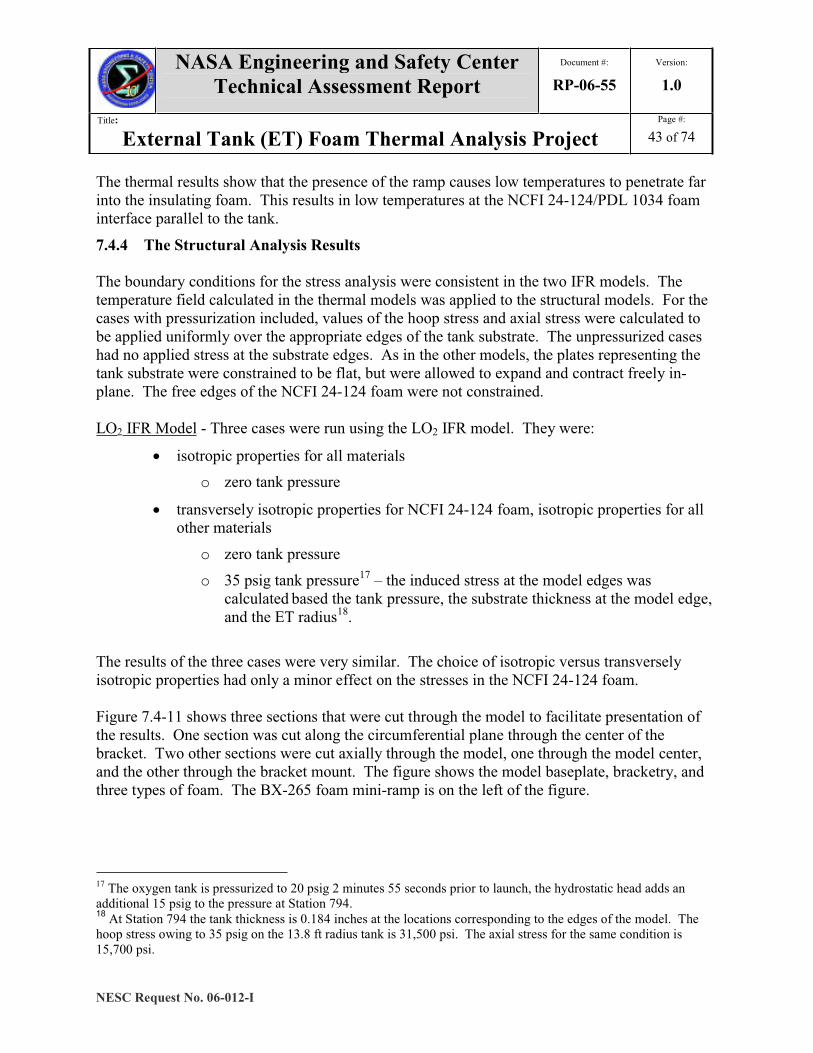
Figure 7.4-11 shows three sections that were cut through the model to facilitate presentation ofthe results. One section was cut along the circumferential plane through the center of thebracket. Two other sections were cut axially through the model, one through the model center,and the other through the bracket mount. The figure shows the model baseplate, bracketry, andthree types of foam. The BX-265 foam mini-ramp is on the left of the figure.
17 The oxygen tank is pressurized to 20 psig 2 minutes 55 seconds prior to launch, the hydrostatic head adds anadditional 15 psig to the pressure at Station 794.18 At Station 794 the tank thickness is 0.184 inches at the locations corresponding to the edges of the model. Thehoop stress owing to 35 psig on the 13.8 ft radius tank is 31,500 psi. The axial stress for the same condition is15,700 psi.
NASA Engineering and Safety CenterTechnical Assessment Report
Document #:
RP-06-55Version:
1.0
Title:
External Tank (ET) Foam Thermal Analysis ProjectPage #:
44 of 74
NESC Request No. 06-012-I
BX-265mini-ramp
Hexcel F161-1581backet
NCFI 24-124
PDL 1034
2195 Al-Li plate
2219 Al bracket
BX-265mini-ramp
Hexcel F161-1581backet
NCFI 24-124
PDL 1034
2195 Al-Li plate
2219 Al bracket
Figure 7.4-11. LO2 Ramp Model Sections
The pressurized transversely isotropic NCFI 24-124 foam case is discussed here in detail as it isthe most accurate physical representation and for the case with the highest stress levels. Thenormal stresses for this case are shown in Figures 7.4-12, 13, and 14. All three figures use thesame fixed range scale for the stress level. Figures 7.4-15, 16, and 17 show the shear stresses.These three figures use their own fixed range scale for the stress level. The stress contour plotsare plotted by material property meaning that stress results for the same material property aresmoothed across element boundaries and stress results for elements adjacent to each other withdifferent material properties are not. Thus, a discontinuity in the stress results indicates amaterial property interface.

NASA Engineering and Safety CenterTechnical Assessment Report
Document #:
RP-06-55Version:
1.0
Title:
External Tank (ET) Foam Thermal Analysis ProjectPage #:
45 of 74
NESC Request No. 06-012-I
x
z
y
x
z
y
Figure 7.4-12. Foam x in the LO2 Ramp Model (units of psi)
x
z
y
x
z
y
Figure 7.4.13. Foam y in the LO2 Ramp Model (units of psi)
NASA Engineering and Safety CenterTechnical Assessment Report
Document #:
RP-06-55Version:
1.0
Title:
External Tank (ET) Foam Thermal Analysis ProjectPage #:
46 of 74
NESC Request No. 06-012-I
x
z
y
x
z
y
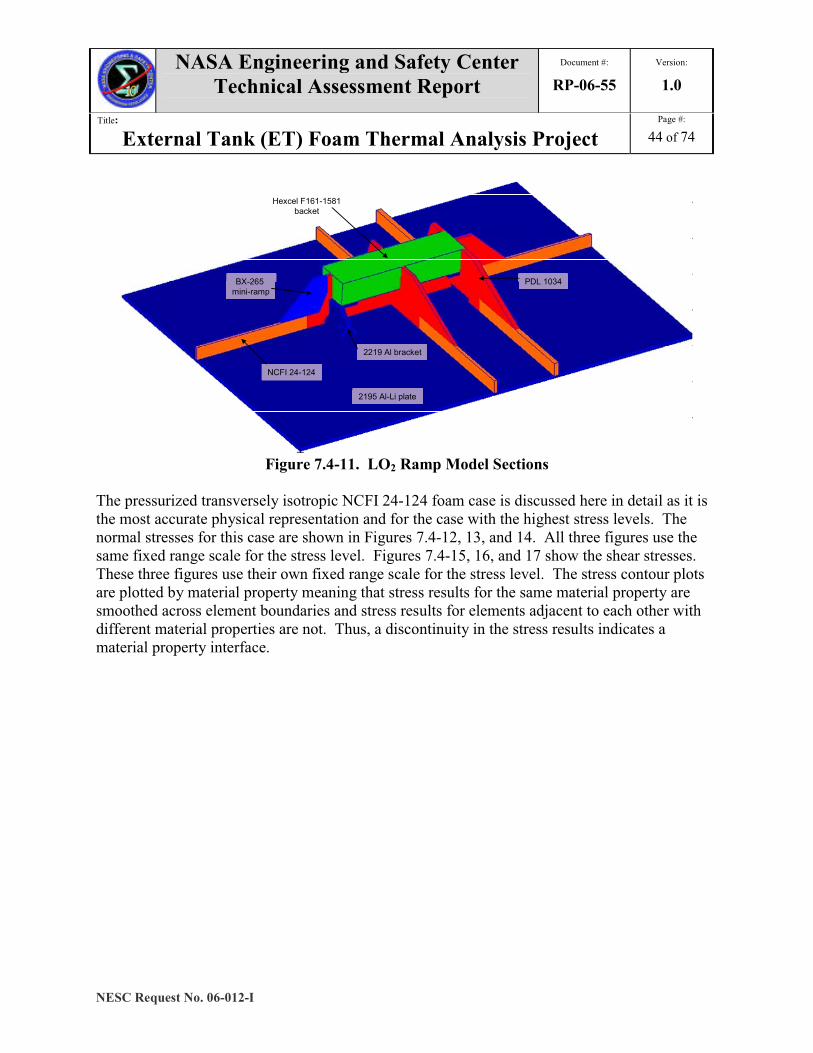
Figure 7.4-14. Foam z in the LO2 Ramp Model (units of psi)
x
z
y
x
z
y
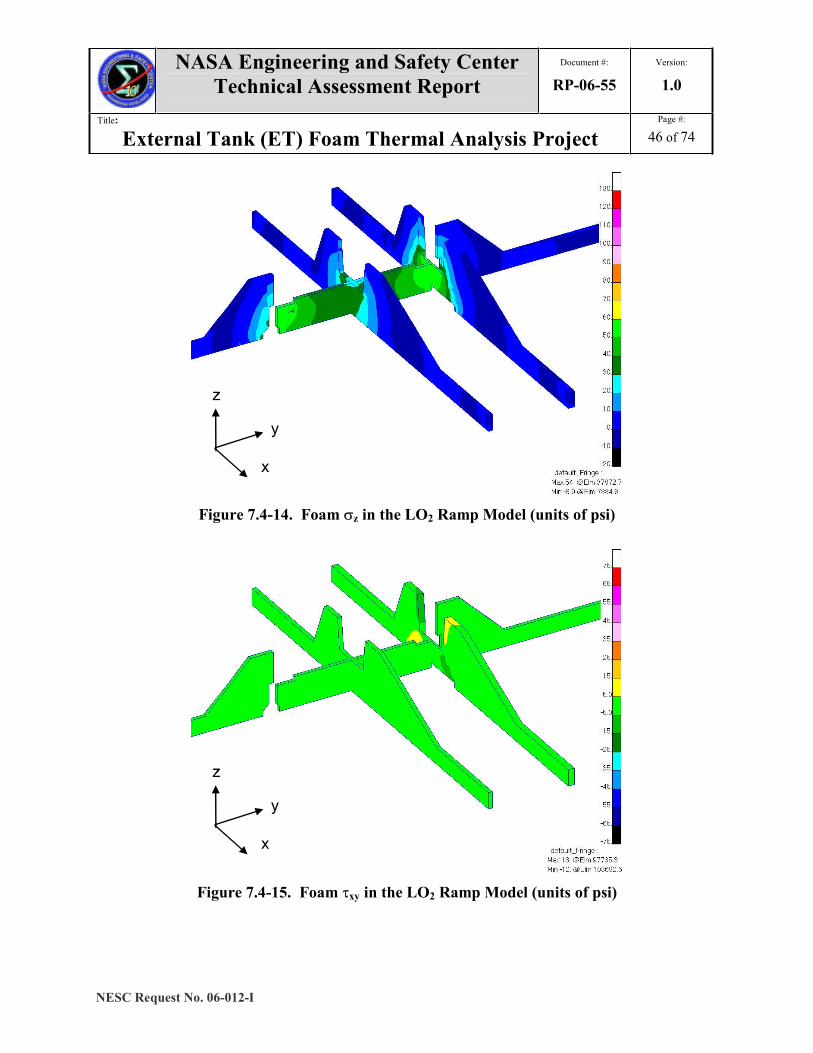
Figure 7.4-15. Foam xy in the LO2 Ramp Model (units of psi)

NASA Engineering and Safety CenterTechnical Assessment Report
Document #:
RP-06-55Version:
1.0
Title:
External Tank (ET) Foam Thermal Analysis ProjectPage #:
47 of 74
NESC Request No. 06-012-I
x
z
y
x
z
y
Figure 7.4-16. Foam yz in the LO2 Ramp Model (units of psi)
x
z
y
x
z
y
Figure 7.4-17. Foam zx in the LO2 Ramp Model (units of psi)

NASA Engineering and Safety CenterTechnical Assessment Report
Document #:
RP-06-55Version:
1.0
Title:
External Tank (ET) Foam Thermal Analysis ProjectPage #:
48 of 74
NESC Request No. 06-012-I
The stresses in the BX-265 foam mini-ramp and the surrounding PDL 1034 foam along thecircumferential plane cut through the centerline of the bracket are shown in Figure 7.4-18, as arethe material locations. The shear stresses along the same plane are shown in Figure 7.4-19.
x
y
z
y
z
NCFI 24-124 PDL 1034
BX-265
x
y
z
x
y
z
y
z
y
z
NCFI 24-124 PDL 1034
BX-265
NCFI 24-124 PDL 1034
BX-265
Figure 7.4-18. Foam Normal Stresses in the LO2 Ramp Model (units of psi)

NASA Engineering and Safety CenterTechnical Assessment Report
Document #:
RP-06-55Version:
1.0
Title:
External Tank (ET) Foam Thermal Analysis ProjectPage #:
49 of 74
NESC Request No. 06-012-I
xy
yz
zxyz
NCFI 24-124 PDL 1034
BX-265materials
-
-
-
-
xy
yz
zxyz
NCFI 24-124 PDL 1034
BX-265materials
-
-
-
-
Figure 7.4-19. Foam Shear Stresses in the LO2 Ramp Model (units of psi)
A comparison of the stresses in the left and right sides of the model shows that the BX-265 foammini-ramp does not increase the stress in the PDL 1034 foam IFR beyond the levels seen wherethe mini-ramp region is filled by the PDL 1034 foam (i.e., where there was no PAL ramp to beremoved and replaced by the mini-ramps). Also, comparing the stresses in the BX-265 foammini-ramp to those calculated for the BX-265 foam Bipod closeout show that the stresses in themini-ramp are no more than half of the highest values in the Bipod closeout. The LO2 mini-ramps themselves are not severely stressed and they do not increase the stress in the existingPDL 1034 foam IFRs.
NASA Engineering and Safety CenterTechnical Assessment Report
Document #:
RP-06-55Version:
1.0
Title:
External Tank (ET) Foam Thermal Analysis ProjectPage #:
50 of 74
NESC Request No. 06-012-I
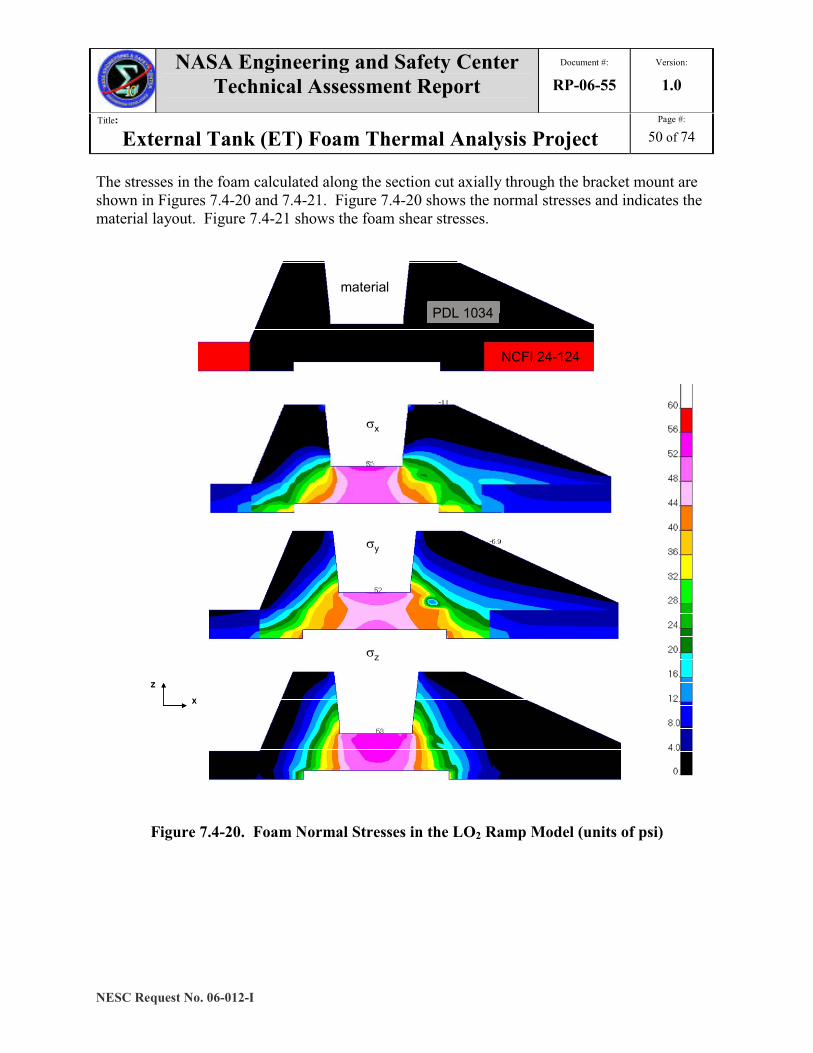
The stresses in the foam calculated along the section cut axially through the bracket mount areshown in Figures 7.4-20 and 7.4-21. Figure 7.4-20 shows the normal stresses and indicates thematerial layout. Figure 7.4-21 shows the foam shear stresses.
x
z
x
y
z
NCFI 24-124
PDL 1034
material
x
z
x
z
x
y
z
NCFI 24-124
PDL 1034
NCFI 24-124
PDL 1034
material
Figure 7.4-20. Foam Normal Stresses in the LO2 Ramp Model (units of psi)

NASA Engineering and Safety CenterTechnical Assessment Report
Document #:
RP-06-55Version:
1.0
Title:
External Tank (ET) Foam Thermal Analysis ProjectPage #:
51 of 74
NESC Request No. 06-012-I
NCFI 24-124
PDL 1034
xy
zx
x
z
yz
NCFI 24-124
PDL 1034
NCFI 24-124
PDL 1034
xy
zx
x
z
yz
xy
zx
x
z
x
z
yz
Figure 7.4-21. Foam Shear Stresses in the LO2 Ramp Model (units of psi)
Figures 7.4-18 to 21 show that the stresses in the NCFI 24-124 foam are highest at the pocketinterface with the PDL 1034 foam.
LH2 IFR Model
Five cases were run using the LH2 IFR model. They were:
isotropic properties for all materials – cold case
NASA Engineering and Safety CenterTechnical Assessment Report
Document #:
RP-06-55Version:
1.0
Title:
External Tank (ET) Foam Thermal Analysis ProjectPage #:
52 of 74
NESC Request No. 06-012-I
o 25 psig tank pressure19
transversely isotropic properties for NCFI 24-124 foam, isotropic properties for allother materials – cold case
o zero tank pressure
o 25 psig tank pressure
transversely isotropic properties for NCFI 24-124 foam, isotropic properties for allother materials – hot case
o zero tank pressure
o 25 psig tank pressure
The pressure induced stresses on the substrate boundary at 25 psig were calculated based on thedetailed dimensions of the tank wall and internal isogrid. First, equivalent tank thicknesses inthe axial and circumferential directions were calculated. Those thicknesses were then used tocalculate axial and hoop pressurization stresses in the tank wall to be applied to the appropriatemodel boundaries20.
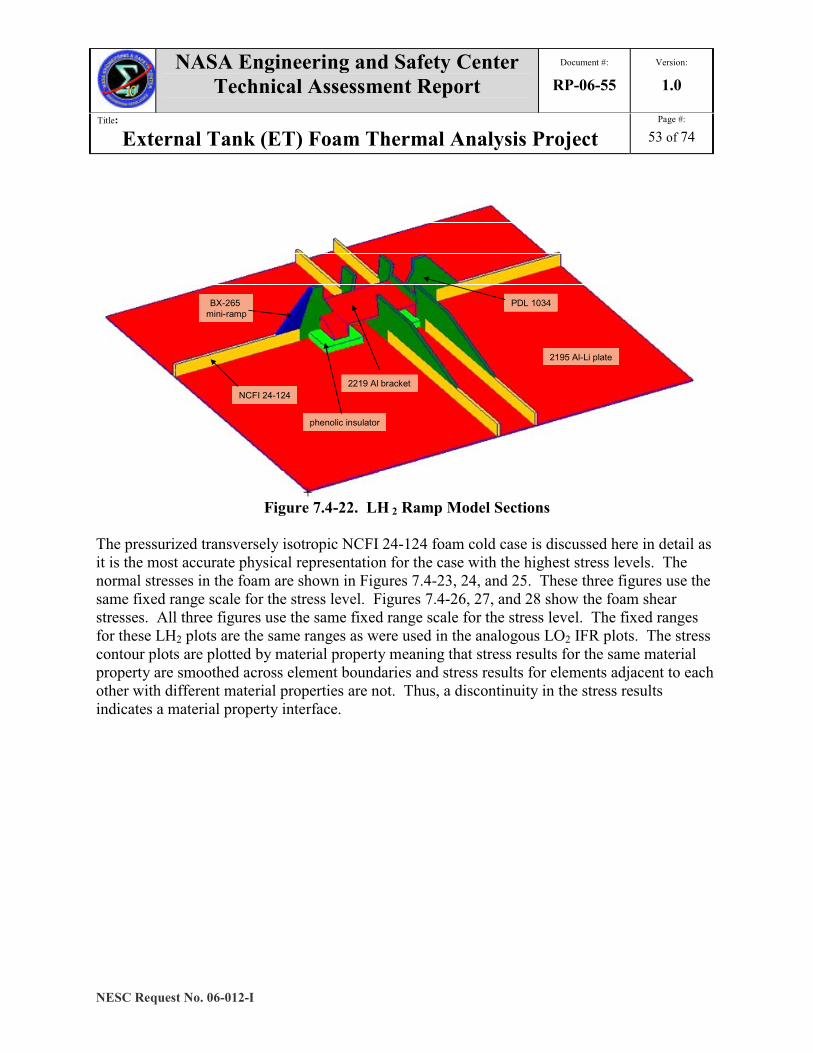
Figure 7.4-22 shows three sections that were cut through the model to facilitate presentation ofthe results. One section was cut along the circumferential plane through the center of thebracket. Two other sections were cut axially through the model, one through the model centerand the other through the bracket mount. The figure shows the model baseplate, the phenolicinsulators, the bracketry, and three types of foam. The BX-265 foam mini-ramp is on the left ofthe figure.
19 The hydrogen tank is pressurized to 25 psig before loading. The less than 1 psi of LH2 hydrostatic head at thislocation is neglected in the analysis as it is within the variation of the tank pressurization.20 At Station 1270 the effective circumferential thickness is 0.127 inches and the effective axial thickness is0.151 inches. The hoop stress owing to 25 psig on the 13.8 ft radius tank is 32000 psi. The axial stress for the samecondition is 13400 psi.
NASA Engineering and Safety CenterTechnical Assessment Report
Document #:
RP-06-55Version:
1.0
Title:
External Tank (ET) Foam Thermal Analysis ProjectPage #:
53 of 74
NESC Request No. 06-012-I
BX-265mini-ramp
NCFI 24-124
PDL 1034
2195 Al-Li plate
2219 Al bracket
phenolic insulator
Figure 7.4-22. LH 2 Ramp Model Sections
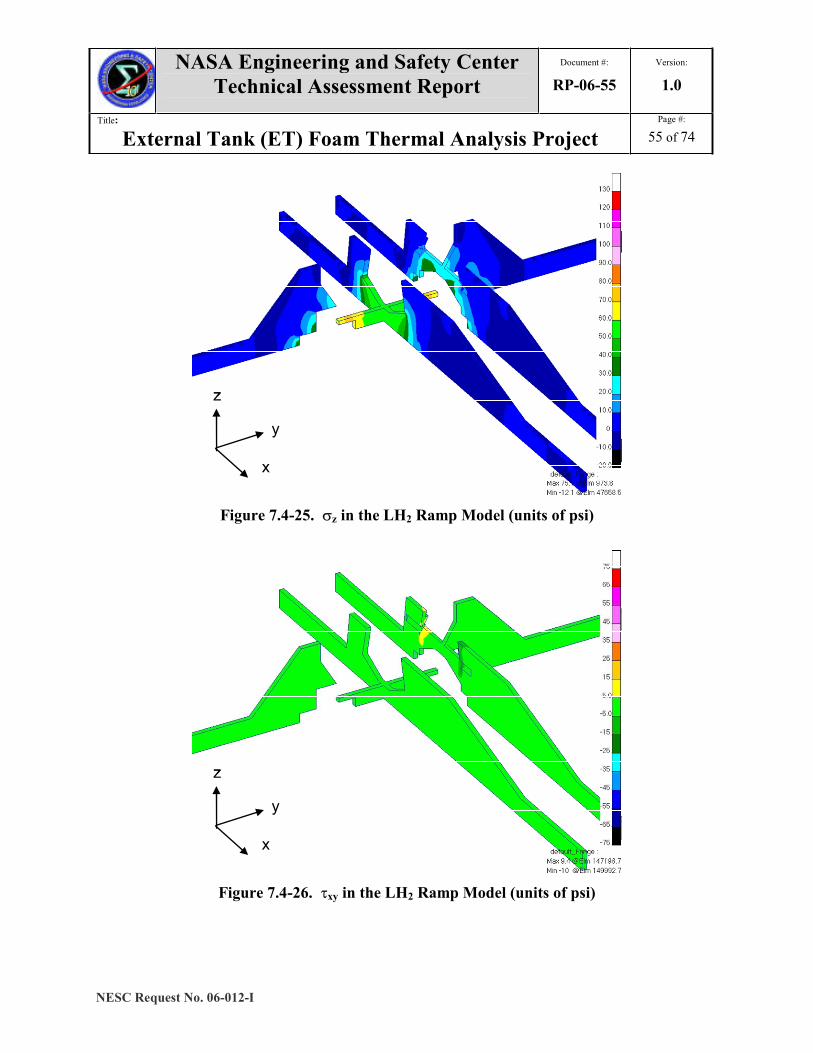
The pressurized transversely isotropic NCFI 24-124 foam cold case is discussed here in detail asit is the most accurate physical representation for the case with the highest stress levels. Thenormal stresses in the foam are shown in Figures 7.4-23, 24, and 25. These three figures use thesame fixed range scale for the stress level. Figures 7.4-26, 27, and 28 show the foam shearstresses. All three figures use the same fixed range scale for the stress level. The fixed rangesfor these LH2 plots are the same ranges as were used in the analogous LO2 IFR plots. The stresscontour plots are plotted by material property meaning that stress results for the same materialproperty are smoothed across element boundaries and stress results for elements adjacent to eachother with different material properties are not. Thus, a discontinuity in the stress resultsindicates a material property interface.

NASA Engineering and Safety CenterTechnical Assessment Report
Document #:
RP-06-55Version:
1.0
Title:
External Tank (ET) Foam Thermal Analysis ProjectPage #:
54 of 74
NESC Request No. 06-012-I
x
z
y
x
z
y
Figure 7.4-23. x in the LH2 Ramp Model (units of psi)
x
z
y
x
z
y
Figure 7.4.24. y in the LH2 Ramp Model (units of psi)
NASA Engineering and Safety CenterTechnical Assessment Report
Document #:
RP-06-55Version:
1.0
Title:
External Tank (ET) Foam Thermal Analysis ProjectPage #:
55 of 74
NESC Request No. 06-012-I
x
z
y
x
z
y
Figure 7.4-25. z in the LH2 Ramp Model (units of psi)
x
z
y
x
z
y
Figure 7.4-26. xy in the LH2 Ramp Model (units of psi)

NASA Engineering and Safety CenterTechnical Assessment Report
Document #:
RP-06-55Version:
1.0
Title:
External Tank (ET) Foam Thermal Analysis ProjectPage #:
56 of 74
NESC Request No. 06-012-I
x
z
y
x
z
y
Figure 7.4-27. yz in the LH2 Ramp Model (units of psi)
x
z
y
x
z
y
Figure 7.4-28. zx in the LH2 Ramp Model (units of psi)

NASA Engineering and Safety CenterTechnical Assessment Report
Document #:
RP-06-55Version:
1.0
Title:
External Tank (ET) Foam Thermal Analysis ProjectPage #:
57 of 74
NESC Request No. 06-012-I
The stresses in the BX-265 foam mini-ramp, surrounding PDL 1034 foam, and NCFI 24-124foam along the circumferential plane cut through the centerline of the bracket are shown inFigure 7.4-30, as is the material layout. The foam shear stresses along the same plane are shownin Figure 7.4-31.
x
y
z
y
z
NCFI 24-124
PDL 1034BX-265
x
y
z
y
z
x
y
z
y
z
y
z
NCFI 24-124
PDL 1034BX-265
Figure 7.4-29. Normal Stresses in the LH2 Ramp Model (units of psi)

NASA Engineering and Safety CenterTechnical Assessment Report
Document #:
RP-06-55Version:
1.0
Title:
External Tank (ET) Foam Thermal Analysis ProjectPage #:
58 of 74
NESC Request No. 06-012-I
yz
zx
y
z
xy
NCFI 24-124
PDL 1034BX-265
yz
zx
y
z
xy
yz
zx
y
z
y
z
xy
NCFI 24-124
PDL 1034BX-265
NCFI 24-124
PDL 1034BX-265
Figure 7.4-30. Shear Stresses in the LH2 Ramp Model (units of psi)
A comparison of the stresses in the left and right sides of the model shows similar results to theLO2 IFR model. The BX-265 foam mini-ramp does not increase the stress in the PDL 1034foam IFR beyond the levels seen where the mini-ramp region is filled by the PDL 1034 foam(i.e., where there was no PAL ramp to be removed and replaced by the mini-ramps). Also,comparing the stresses in the BX-265 foam mini-ramp to those calculated for the BX-265 foam
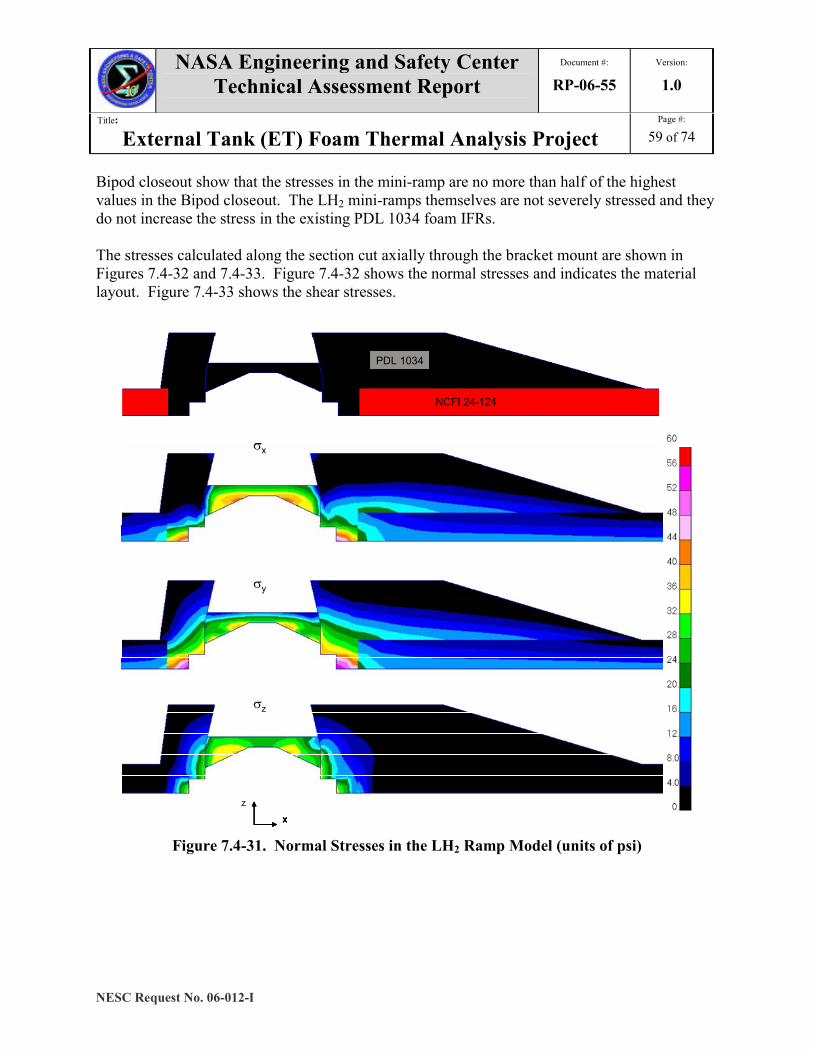
NASA Engineering and Safety CenterTechnical Assessment Report
Document #:
RP-06-55Version:
1.0
Title:
External Tank (ET) Foam Thermal Analysis ProjectPage #:
59 of 74
NESC Request No. 06-012-I
Bipod closeout show that the stresses in the mini-ramp are no more than half of the highestvalues in the Bipod closeout. The LH2 mini-ramps themselves are not severely stressed and theydo not increase the stress in the existing PDL 1034 foam IFRs.
The stresses calculated along the section cut axially through the bracket mount are shown inFigures 7.4-32 and 7.4-33. Figure 7.4-32 shows the normal stresses and indicates the materiallayout. Figure 7.4-33 shows the shear stresses.
x
y
z
x
z
NCFI 24-124
PDL 1034
x
y
z
x
z
x
y
z
x
z
x
z
NCFI 24-124
PDL 1034
Figure 7.4-31. Normal Stresses in the LH2 Ramp Model (units of psi)

NASA Engineering and Safety CenterTechnical Assessment Report
Document #:
RP-06-55Version:
1.0
Title:
External Tank (ET) Foam Thermal Analysis ProjectPage #:
60 of 74
NESC Request No. 06-012-I
xy
yz
zx
x
z
NCFI 24-124
PDL 1034
xy
yz
zx
x
z
xy
yz
zx
x
z
x
z
NCFI 24-124
PDL 1034
NCFI 24-124
PDL 1034
Figure 7.4-32. Shear Stresses in the LH2 Ramp Model (units of psi)
As was observed for the LO2 IFR, the stresses in the NCFI 24-124 foam are highest under theramp near the pocket. However, the stresses in the LH2 NCFI 24-124 foam are higher than in theLO2 IFR. In particular, the transverse shear stresses known to be associated with the formationof delaminations in laminated structures ( zx and yz) are large. The level of stress in theNCFI 24-124 deep under the IFR are consistent with the dissections of IFRs on ET-120, whichhad been tanked twice. Two of the three LH2 IFRs that were in locations with no PAL ramp (andare encompassed by these results) had cracks in the NCFI 24-124 foam emanating from therounded corners of the pocket. No cracks were found in any of the three LO2 IFRs that weredissected.

NASA Engineering and Safety CenterTechnical Assessment Report
Document #:
RP-06-55Version:
1.0
Title:
External Tank (ET) Foam Thermal Analysis ProjectPage #:
61 of 74
NESC Request No. 06-012-I
8.0 Findings, Recommendations, and ObservationsThermal and stress analysis models were built to assess the thermally induced stresses in the ETBipod closeout, LO2 Ice/Frost ramps, and LH2 IFRs. Models with various levels ofsimplification were built that included the foam plus underlying structure and bracketry.Thermal analyses were used to generate steady-state temperature profiles, which were input astemperature distributions on the structural models. Based on these linear analysis models andassociated assumptions related to geometry, materials and loadings, the following findings,recommendations, and observations are offered.
8.1 FindingsBipod Models
F-1. An area of high stress on the bipod axial centerline was found along the aluminum tankwall near the phenolic insulator and along the phenolic insulator itself. This area of highstress might be prone to cracking. A more complete assessment of stresses in thecloseout requires a model that captures the three-dimensional effects in the closeout.Section 7.2.1.
F-2. There is a small region of slightly increased stress in the NCFI 24-124 foam near its jointwith BX-265 foam. However, the presence of the interface does not substantiallyincrease the thermally induced stress levels in the foams. Section 7.2.2.
LH2 IFR Precursor Models
F-3. Removing the front (“toe”) of the LH2 IFRs, leaving only the NCFI 24-124 foam, wouldreduce the thermally induced stresses in the NCFI 24-124 foam. However, the degree ofreduction in the stresses cannot be discerned from these models owing to their highlysimplified configuration. Section 7.3.
LO2 IFR Model
F-4. The BX-265 foam mini-ramp does not increase the stress in the PDL 1034 foam IFRbeyond the levels seen where the mini-ramp region is filled by the PDL 1034 foam (i.e.,where there was no PAL ramp to be removed and replaced by the mini-ramps). Section7.4.4
F-5. The highest stresses in the BX-265 foam mini-ramp are less than half the extreme valuesin the Bipod closeout. Thus, the mini-ramp is not severely stressed. Section 7.4.4

NASA Engineering and Safety CenterTechnical Assessment Report
Document #:
RP-06-55Version:
1.0
Title:
External Tank (ET) Foam Thermal Analysis ProjectPage #:
62 of 74
NESC Request No. 06-012-I
LH2 IFR Model
F-6. The BX-265 foam mini-ramp does not increase the stress in the PDL 1034 foam IFRbeyond the levels seen where the mini-ramp region is filled by the PDL 1034 foam (i.e.,where there was no PAL ramp to be removed and replaced by the mini-ramps). Section7.4.4
F-7. The highest stresses in the BX-265 foam mini-ramp are less than half the extreme valuesin the Bipod closeout. The mini-ramp is not highly stressed. Section 7.4.4
F-8. The stresses in the NCFI 24-124 foam are highest under the ramp near the pocket as theyare in the LO2 IFR. However, the stresses in the LH2 NCFI 24-124 foam are higher.This result is consistent with the dissection of IFRs on ET-120, which had been tankedtwice. Cracks were found emanating from the rounded corners of the pocket on two ofthe three LH2 IFRs that were in locations with no PAL ramp. No cracks were found inany of the three LO2 IFRS that were dissected. Section 7.4.4
8.2 Recommendations
R-1. The Bipod closeout modeling should be expanded to include three-dimensional effects tobetter assess the stress level in the closeout. F-1
R-2. The forward ramp portion (“toe”) of the LH2 Ice/Frost ramps should be modeled in muchgreater detail to understand the stress levels in the NCFI 24-124 and to assess thereductions in stress that would occur if the toe were removed or modified. F-3
8.3 ObservationsNo observations were evident during this consultation.

NASA Engineering and Safety CenterTechnical Assessment Report
Document #:
RP-06-55Version:
1.0
Title:
External Tank (ET) Foam Thermal Analysis ProjectPage #:
63 of 74
NESC Request No. 06-012-I
9.0 Lessons LearnedThere were no lessons learned during this consultation.
10.0 Definition of TermsCorrective Actions Changes to design processes, work instructions, workmanship practices,
training, inspections, tests, procedures, specifications, drawings, tools,equipment, facilities, resources, or material that result in preventing,minimizing, or limiting the potential for recurrence of a problem.
Finding A conclusion based on facts established during the assessment/inspectionby the investigating authority.
Lessons Learned Knowledge or understanding gained by experience. The experience maybe positive, as in a successful test or mission, or negative, as in a mishapor failure. A lesson must be significant in that it has real or assumedimpact on operations; valid in that it is factually and technically correct;and applicable in that it identifies a specific design, process, or decisionthat reduces or limits the potential for failures and mishaps, or reinforces apositive result.
Observation A factor, event, or circumstance identified during theassessment/inspection that did not contribute to the problem, but if leftuncorrected has the potential to cause a mishap, injury, or increase theseverity should a mishap occur.
Problem The subject of the technical assessment/inspection.
Requirement An action developed by the assessment/inspection team to correct thecause or a deficiency identified during the investigation. The requirementswill be used in the preparation of the corrective action plan.
Root Cause Along a chain of events leading to a mishap or close call, the first causalaction or failure to act that could have been controlled systemically eitherby policy/practice/procedure or individual adherence topolicy/practice/procedure.
11.0 Alternate View PointThere were no alternate view points during this consultation.

NASA Engineering and Safety CenterTechnical Assessment Report
Document #:
RP-06-55Version:
1.0
Title:
External Tank (ET) Foam Thermal Analysis ProjectPage #:
64 of 74
NESC Request No. 06-012-I
12.0 List of Acronyms
Al AluminumAl-Li Aluminum-lithiumET External TankGRC Glenn Research CenterHQ HeadquartersIFR Ice/Frost RampJSC Johnson Space CenterLaRC Langley Research CenterLH2 Liquid HydrogenLO2 Liquid OxygenNASA National Aeronautics and Space AdministrationNCFI North Carolina Foam InsulatorNESC NASA Engineering and Safety CenterNRB NESC Review BoardPAL Protuberance Aerodynamic LoadPDL Process Data Logging (FoamMix®)PSIG Pounds Per Square Inch GageSLA Super Lightweight Ablator
NASA Engineering and Safety CenterTechnical Assessment Report
Document #:
RP-06-55Version:
1.0
Title:
External Tank (ET) Foam Thermal Analysis ProjectPage #:
65 of 74
NESC Request No. 06-012-I
Volume II: Appendices
A ITA/I Request Form (NESC-PR-003-FM-01)B Foam Mechanical Properties

NASA Engineering and Safety CenterTechnical Assessment Report
Document #:
RP-06-55Version:
1.0
Title:
External Tank (ET) Foam Thermal Analysis ProjectPage #:
66 of 74
NESC Request No. 06-012-I
Appendix A. ITA/I Request Form (NESC-PR-003-FM-01)

NASA Engineering and Safety CenterTechnical Assessment Report
Document #:
RP-06-55Version:
1.0
Title:
External Tank (ET) Foam Thermal Analysis ProjectPage #:
67 of 74
NESC Request No. 06-012-I

NASA Engineering and Safety CenterTechnical Assessment Report
Document #:
RP-06-55Version:
1.0
Title:
External Tank (ET) Foam Thermal Analysis ProjectPage #:
68 of 74
NESC Request No. 06-012-I

NASA Engineering and Safety CenterTechnical Assessment Report
Document #:
RP-06-55Version:
1.0
Title:
External Tank (ET) Foam Thermal Analysis ProjectPage #:
69 of 74
NESC Request No. 06-012-I
Appendix B. Foam Mechanical Properties
Table B-1. Isotropic PropertiesE- Youngs modulus– Poisson’s ratio
– coefficient of thermal expansion
BX-265 foam Manual SolidTemp E(F) (psi) (in/in/F)-423 1600 0.30 3.31E-05-320 1400 0.30 3.94E-05-100 1038 0.30 5.47E-0575 750 0.30 7.00E-05200 271 0.30 1.35E-04250 20 0.30
NCFI 24-124 foam SolidTemp E(F) (psi) (in/in/F)-423 1500 0.30 2.68E-05-320 1292 0.30 3.32E-05-100 937 0.30 3.40E-0575 654 0.30 4.00E-05200 479 0.30 4.90E-05300 345 0.30 1.09E-04450 20 0.30
PDL 1034 foam SolidTemp E(F) (psi) (in/in/F)-423 4062 0.30 2.66E-05-320 3545 0.30 3.29E-05-100 2428 0.30 4.12E-0575 1540 0.30 5.00E-05200 756 0.30 1.18E-04300 141 0.30 3.01E-04320 20 0.30
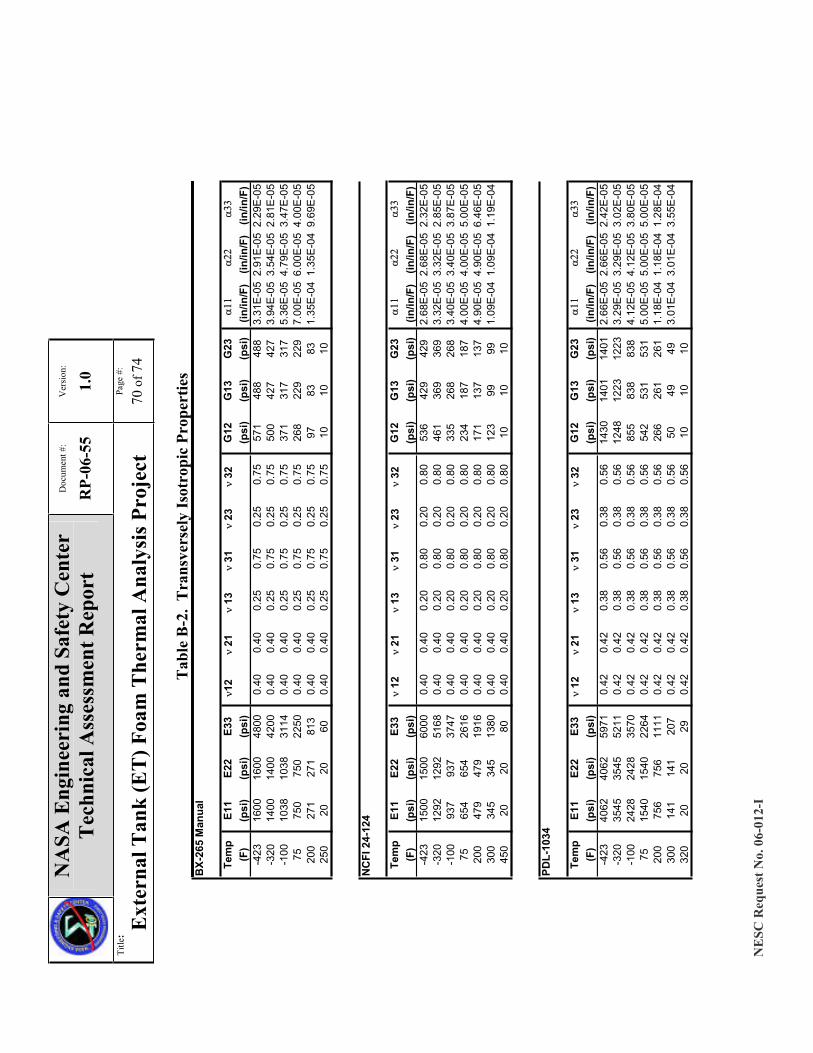
NASAEngineeringandSafetyCenter
TechnicalAssessmentReport
Document#:
RP-06-55
Version:
1.0
Title:
ExternalTank(ET)FoamThermalAnalysisProject
Page#:
70of74
NESCRequestNo.06-012-I
TableB-2.TransverselyIsotropicProperties
BX-265Manual
Temp
E11
E22
E33
1221
1331
2332
G12
G13
G23
(F)
(psi)
(psi)
(psi)
(psi)
(psi)
(psi)
(in/in/F)(in/in/F)(in/in/F)
-423
1600
1600
4800
0.40
0.40
0.25
0.75
0.25
0.75
571
488
488
3.31E-052.91E-052.29E-05
-320
1400
1400
4200
0.40
0.40
0.25
0.75
0.25
0.75
500
427
427
3.94E-053.54E-052.81E-05
-100
1038
1038
3114
0.40
0.40
0.25
0.75
0.25
0.75
371
317
317
5.36E-054.79E-053.47E-05
75750
750
2250
0.40
0.40
0.25
0.75
0.25
0.75
268
229
229
7.00E-056.00E-054.00E-05
200
271
271
813
0.40
0.40
0.25
0.75
0.25
0.75
9783
831.35E-041.35E-049.69E-05
250
2020
600.40
0.40
0.25
0.75
0.25
0.75
1010
10
NCFI24-124
Temp
E11
E22
E33
1221
1331
2332
G12
G13
G23
(F)
(psi)
(psi)
(psi)
(psi)
(psi)
(psi)
(in/in/F)(in/in/F)(in/in/F)
-423
1500
1500
6000
0.40
0.40
0.20
0.80
0.20
0.80
536
429
429
2.68E-052.68E-052.32E-05
-320
1292
1292
5168
0.40
0.40
0.20
0.80
0.20
0.80
461
369
369
3.32E-053.32E-052.85E-05
-100
937
937
3747
0.40
0.40
0.20
0.80
0.20
0.80
335
268
268
3.40E-053.40E-053.87E-05
75654
654
2616
0.40
0.40
0.20
0.80
0.20
0.80
234
187
187
4.00E-054.00E-055.00E-05
200
479
479
1916
0.40
0.40
0.20
0.80
0.20
0.80
171
137
137
4.90E-054.90E-056.46E-05
300
345
345
1380
0.40
0.40
0.20
0.80
0.20
0.80
123
9999
1.09E-041.09E-041.19E-04
450
2020
800.40
0.40
0.20
0.80
0.20
0.80
1010
10
PDL-1034
Temp
E11
E22
E33
1221
1331
2332
G12
G13
G23
(F)
(psi)
(psi)
(psi)
(psi)
(psi)
(psi)
(in/in/F)(in/in/F)(in/in/F)
-423
4062
4062
5971
0.42
0.42
0.38
0.56
0.38
0.56
1430
1401
1401
2.66E-052.66E-052.42E-05
-320
3545
3545
5211
0.42
0.42
0.38
0.56
0.38
0.56
1248
1223
1223
3.29E-053.29E-053.02E-05
-100
2428
2428
3570
0.42
0.42
0.38
0.56
0.38
0.56
855
838
838
4.12E-054.12E-053.80E-05
751540
1540
2264
0.42
0.42
0.38
0.56
0.38
0.56
542
531
531
5.00E-055.00E-055.00E-05
200
756
756
1111
0.42
0.42
0.38
0.56
0.38
0.56
266
261
261
1.18E-041.18E-041.28E-04
300
141
141
207
0.42
0.42
0.38
0.56
0.38
0.56
5049
493.01E-043.01E-043.55E-04
320
2020
290.42
0.42
0.38
0.56
0.38
0.56
1010
10

NASA Engineering and Safety CenterTechnical Assessment Report
Document #:
RP-06-55Version:
1.0
Title:
External Tank (ET) Foam Thermal Analysis ProjectPage #:
71 of 74
NESC Request No. 06-012-I
BX-265
0
20
40
60
80
100
120
140
160
-500 -400 -300 -200 -100 0 100
temperature (F)
strength(psi) min flatwise Tension (psi)
avg flatwise Tension (psi)max flatwise Tension (psi)min bond Tension (psi)avg bond Tension (psi)max bond Tension (psi)
Figure B-1. BX-265 foam Tensile StrengthBX-265 Shear Strength
0
10
20
30
40
50
60
-500 -400 -300 -200 -100 0 100
temperature (F)
strength(psi)
BX min shear strength (psi)BX avg shear strength (psi)BX max shear strength (psi)
Figure B-2. BX-265 foam Shear Strength
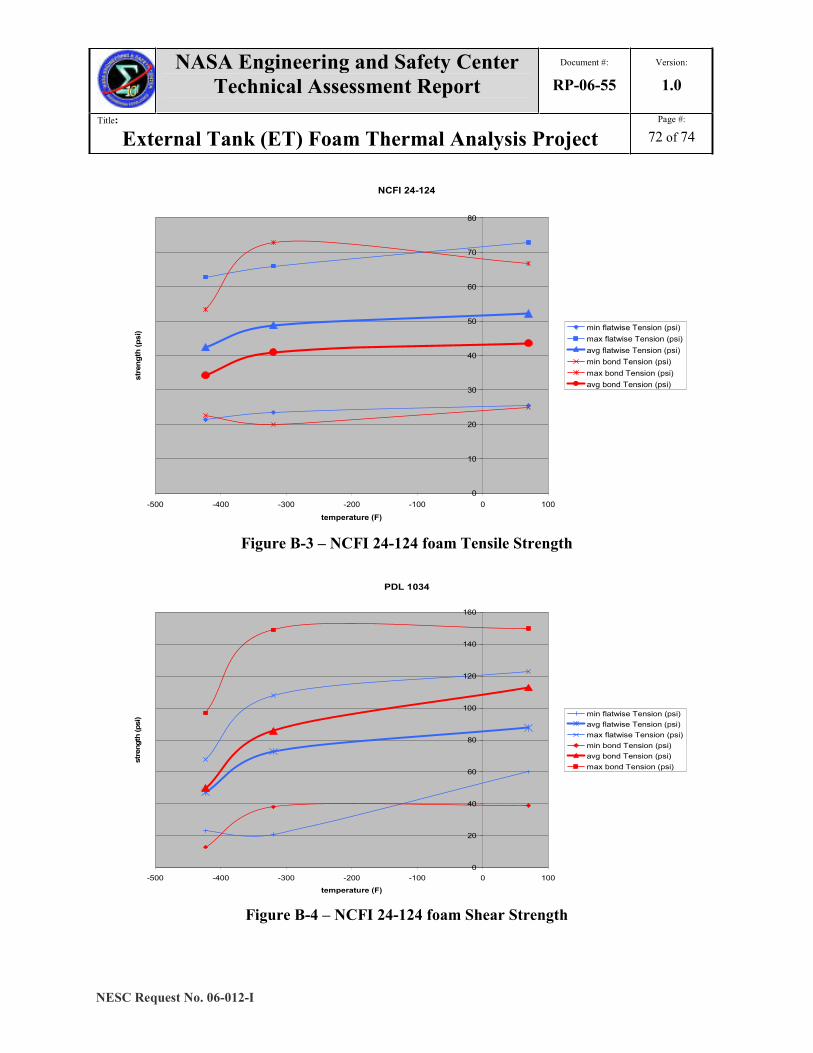
NASA Engineering and Safety CenterTechnical Assessment Report
Document #:
RP-06-55Version:
1.0
Title:
External Tank (ET) Foam Thermal Analysis ProjectPage #:
72 of 74
NESC Request No. 06-012-I
NCFI 24-124
0
10
20
30
40
50
60
70
80
-500 -400 -300 -200 -100 0 100
temperature (F)
strength(psi) min flatwise Tension (psi)
max flatwise Tension (psi)avg flatwise Tension (psi)min bond Tension (psi)max bond Tension (psi)avg bond Tension (psi)
Figure B-3 – NCFI 24-124 foam Tensile Strength
PDL 1034
0
20
40
60
80
100
120
140
160
-500 -400 -300 -200 -100 0 100
temperature (F)
strength(psi) min flatwise Tension (psi)
avg flatwise Tension (psi)max flatwise Tension (psi)min bond Tension (psi)avg bond Tension (psi)max bond Tension (psi)
Figure B-4 – NCFI 24-124 foam Shear Strength

NASA Engineering and Safety CenterTechnical Assessment Report
Document #:
RP-06-55Version:
1.0
Title:
External Tank (ET) Foam Thermal Analysis ProjectPage #:
73 of 74
NESC Request No. 06-012-I
PDL 1034
0
20
40
60
80
100
120
140
160
-500 -400 -300 -200 -100 0 100
temperature (F)
strength(psi) min flatwise Tension (psi)
avg flatwise Tension (psi)max flatwise Tension (psi)min bond Tension (psi)avg bond Tension (psi)max bond Tension (psi)
Figure B-5. PDL 1034 foam Tensile StrengthPDL 1034
0
10
20
30
40
50
60
-500 -400 -300 -200 -100 0 100
temperature (F)
strength(psi)
PDL min shear strength (psi)PDL avg shear strength (psi)PDL max shear strength (psi)
Figure B-6. PDL 1034 foam Shear Strength

NASA Engineering and Safety CenterTechnical Assessment Report
Document #:
RP-06-55Version:
1.0
Title:
External Tank (ET) Foam Thermal Analysis ProjectPage #:
74 of 74
NESC Request No. 06-012-I
Approval and Document Revision History
Approved: Original signed on file 8-7-06
NESC Director Date
Version Description of Revision Office of PrimaryResponsibility
EffectiveDate
1.0 Initial Release NESC PrincipalEngineer’s Office
7-27-06

REPORT DOCUMENTATION PAGE Form Approved
OMB No. 0704-0188 The public reporting burden for this collection of information is estimated to average 1 hour per response, including the time for reviewing instructions, searching existingdata sources, gathering and maintaining the data needed, and completing and reviewing the collection of information. Send comments regarding this burden estimate or any other aspect of this collection of information, including suggestions for reducing this burden, to Department of Defense, Washington Headquarters Services, Directoratefor Information Operations and Reports (0704-0188), 1215 Jefferson Davis Highway, Suite 1204, Arlington, VA 22202-4302. Respondents should be aware thatnotwithstanding any other provision of law, no person shall be subject to any penalty for failing to comply with a collection of information if it does not display a currentlyvalid OMB control number. PLEASE DO NOT RETURN YOUR FORM TO THE ABOVE ADDRESS.
1. REPORT DATE (DD-MM-YYYY) 2. REPORT TYPE 3. DATES COVERED (From - To)
4. TITLE AND SUBTITLE 5a. CONTRACT NUMBER
5b. GRANT NUMBER
5c. PROGRAM ELEMENT NUMBER
6. AUTHOR(S) 5d. PROJECT NUMBER
5e. TASK NUMBER
5f. WORK UNIT NUMBER
7. PERFORMING ORGANIZATION NAME(S) AND ADDRESS(ES) 8. PERFORMING ORGANIZATIONREPORT NUMBER
9. SPONSORING/MONITORING AGENCY NAME(S) AND ADDRESS(ES) 10. SPONSORING/MONITOR'S ACRONYM(S)
11. SPONSORING/MONITORINGREPORT NUMBER
12. DISTRIBUTION/AVAILABILITY STATEMENT
13. SUPPLEMENTARY NOTES
14. ABSTRACT
15. SUBJECT TERMS
16. SECURITY CLASSIFICATION OF: 17. LIMITATION OF
ABSTRACT18. NUMBER
OFPAGES
19a. NAME OF RESPONSIBLE PERSON
a. REPORT b. ABSTRACT c. THIS PAGE19b. TELEPHONE NUMBER (Include area code)
Standard Form 298 (Rev. 8-98)Prescribed by ANSI Std. Z39-18
01-01-2008 Technical Memorandum Feb 2006- Jul 2006
External Tank (ET) Foam Thermal/Structural Analysis Project
510505.01.07.01.06
Moore, David F.; Ungar, Eugene K.; Chang, Li C.; Malroy, Eric T.; Stephan,Ryan A.
NASA Engineering and Safety CenterLangley Research CenterHampton, VA 23681-2199
L-19443 NESC-RP-06-55/06-012-I
National Aeronautics and Space AdministrationWashington, DC 20546-0001
NASA
NASA/TM-2008- 215102
Unclassified - Unlimited Availability: NASA CASI (301) 621-0390Subject Category 18 Spacecraft Design, Testing And Performance
An independent study was performed to assess the pre-launch thermally induced stresses in the Space Shuttle External Tank Bipodcloseout and Ice/Frost ramps (IFRs). Finite element models with various levels of detail were built that included the three types offoam (BX-265, NCFI 24-124, and PDL 1034) and the underlying structure and bracketry. Temperature profiles generated by thethermal analyses were input to the structural models to calculate the stress levels. An area of high stress in the Bipod closeout wasfound along the aluminum tank wall near the phenolic insulator and along the phenolic insulator itself. This area of high stressmight be prone to cracking and possible delamination. There is a small region of slightly increased stress in the NCFI 24-124 foamnear its joint with the Bipod closeout BX-265 foam. The calculated stresses in the NCFI 24-124 acreage foam are highest at theNCFI 24-124/PDL 1034/tank wall interface under the LO2 and LH2 IFRs. The highest calculated stresses in the LH2 NCFI 24-124foam are higher than in similar locations in the LO2 IFR. This finding is consistent with the dissection results of IFRs on ET-120.
NESC, External Tank (ET), Ice/Frost ramps (IFRs), BX-265, NCFI 24-124, PDL 1034, protuberance aerodynamic load (PAL),Foam Material Modeling, super lightweight ablator (SLA), Bipod foam
UU UU UU UU 79
STI Help Desk (email: [email protected])
(301) 621-0390