External Review of Timethyl Benzene PBPK Model Internal ... · External Review of Timethyl Benzene...
18
External Review of Timethyl Benzene PBPK Model Internal Metrics June, 2014 Model Overview A PBPK model for white spirit constituents was developed and published by TNO Quality of Life, The Netherlands (Hissink et al., 2007). This model was reviewed along with other trimethyl benzene (1,2,4-TMB) models by the U.S. EPA (the Agency) and chosen to use for internal dose metric estimation (U.S. EPA, 2013). In this process, a detailed computer code analysis was conducted, and generally found to be acceptable, but some corrections were necessary. The changes to the model code (.csl file) consisted of addressing a coding error in the supplied file (not discussed in the manuscript) that resulted in metabolic rate changing over the course of exposure (VMAX = KVMAX*(ABS(T-TLEG)+(T-TLEG))/2+VMAX0). KVMAX was set equal to 0, so metabolic rates are consistent throughout time. Second, flow mass-balance was corrected by adding a simple equation to calculate total as 1- summed flows (QSTOTC = 1 – QRTOTC). Finally, the description of inhaled/exhaled concentrations from inhaled exposures were altered to fit conventions of alveolar volume (70% of total). The Agency version of the model achieves this 70% by adding a second ventilation rate (QPC) that represents alveolar and QP2C that represents entire lung volume. Changes in input parameters (.m files) were also incorporated including anatomical parameters which were updated to base them on the conventionally used parameters listed in (Brown et al., 1997) (Tables 1 and 2). Rat Internal Dose Metrics After implementing the modest model corrections, the Agency numerically optimized metabolic parameters (Vmax and Km) to fit the rodent data. The Agency chose the repeat dosing data of Swiercz et al. (2003) to calibrate the model and optimized parameters are shown in Table 1. The model fits to the data sets from Hissink et al.,
Transcript of External Review of Timethyl Benzene PBPK Model Internal ... · External Review of Timethyl Benzene...

External Review of Timethyl Benzene PBPK Model Internal Metrics
June, 2014
Model Overview
A PBPK model for white spirit constituents was developed and published by TNO
Quality of Life, The Netherlands (Hissink et al., 2007). This model was reviewed along
with other trimethyl benzene (1,2,4-TMB) models by the U.S. EPA (the Agency) and
chosen to use for internal dose metric estimation (U.S. EPA, 2013). In this process, a
detailed computer code analysis was conducted, and generally found to be acceptable,
but some corrections were necessary.
The changes to the model code (.csl file) consisted of addressing a coding error in the
supplied file (not discussed in the manuscript) that resulted in metabolic rate changing
over the course of exposure (VMAX = KVMAX*(ABS(T-TLEG)+(T-TLEG))/2+VMAX0).
KVMAX was set equal to 0, so metabolic rates are consistent throughout time. Second,
flow mass-balance was corrected by adding a simple equation to calculate total as 1-
summed flows (QSTOTC = 1 – QRTOTC). Finally, the description of inhaled/exhaled
concentrations from inhaled exposures were altered to fit conventions of alveolar
volume (70% of total). The Agency version of the model achieves this 70% by adding a
second ventilation rate (QPC) that represents alveolar and QP2C that represents entire
lung volume. Changes in input parameters (.m files) were also incorporated including
anatomical parameters which were updated to base them on the conventionally used
parameters listed in (Brown et al., 1997) (Tables 1 and 2).
Rat Internal Dose Metrics
After implementing the modest model corrections, the Agency numerically optimized
metabolic parameters (Vmax and Km) to fit the rodent data. The Agency chose the
repeat dosing data of Swiercz et al. (2003) to calibrate the model and optimized
parameters are shown in Table 1. The model fits to the data sets from Hissink et al.,

2007 and Swiercz et al., 2003 are shown in Figures 1 and 2 and a comparison of
predicted blood concentrations to study-specific end of exposure measures
concentrations for these two studies are shown in Table 3.
Figure 1. Model predicted blood concentrations for the study described in Hissink et al.,
2007. Compare this figure to B-10(b) of U.S. EPA (2013). This figure represents the fit
to the final model parameters and thus replicates Figure B-10(b).


Figure 2. Model predicted blood concentrations for the study described in Swiercz et al.,
2003. Rats were exposed to TMB 6 hr/day, 5 days/wk for 4 weeks. Blood was collected
from the tail vein after the last exposure. Top) whole timecourse, Bottom) last 6 hr.
Compare this figure to B-12 of U.S. EPA (2013).
Internal blood 1,2,4-TMB metrics predicted by the model were compared to a few other
studies and consistently over-predicted the data, as reported in U.S. EPA 2013 (Tables
4 and 5).

Human Internal Dose Metrics
In the report (U.S. EPA 2013), the human exposure data of Hissink et al., 2007 was
shown with the Vmax and Km optimized to fit the rat data from the same study, and was
not shown using the Vmax and Km optimized from the Swiercz et al. (2003) rat data
which was used in the final model (Table 2). Figure 3 shows the fit of that data using the
VmaxC/Km used for internal dose metric determinations.
In agreement with figures B-14 and B-15, the model also under-predicts the data from
Järnberg et al. (1998, 1997a; 1996) (Figure 4 and Table 5) and Kostrzewki et al, 1997
(Figure 5).
Figure 3. Comparisons of model predictions to measured human venous blood in
human volunteers exposed to 100 ppm WS with 7.8% 1,2,4-TMB (39 mg/m3 1,2,4-
TMB). The red line shows the fit when the metabolic parameters optimized to fit rat data
from the same study (Hissink et al., 2007) are used, the blue line shows the fit when the
VmaxC and Km optimized from the study of Swiercz et al., 2003 is used.

Figure 4. Comparisons of model predictions to measured human venous blood
concentrations of Järnberg et al. (1998, 1997a; 1996) in volunteers exposed to 2 or 25 ppm (~10 or 123 mg/m3) 1,2,4-TMB for 2 hours while riding a bicycle (50 W).
Figure 5. Comparisons of model predictions to measured human venous blood concentrations in Kostrzewki et al. (1997) in human volunteers exposed to 154 mg 1,2,4-TMB/m3 for 8 hours.
Conclusions
Agency changes are consistent with state of the art PBPK modeling and well-
implemented. The Agency version of the model consistently underpredicts compared to
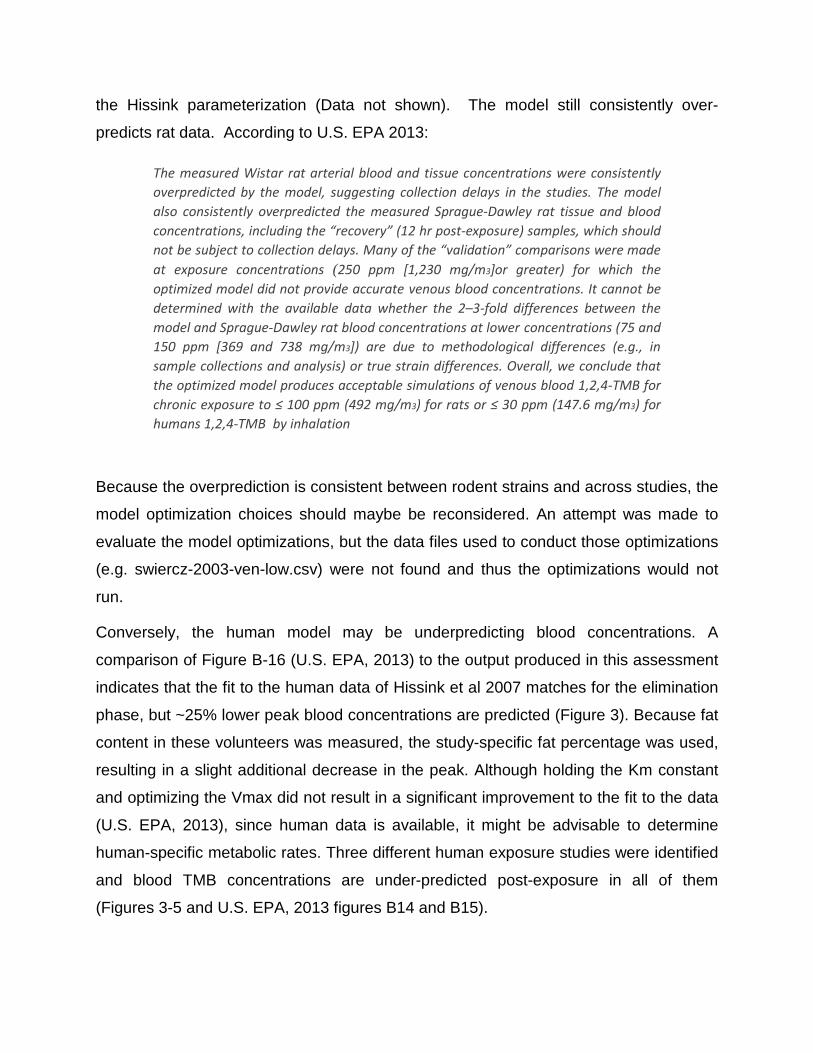
the Hissink parameterization (Data not shown). The model still consistently over-
predicts rat data. According to U.S. EPA 2013:
The measured Wistar rat arterial blood and tissue concentrations were consistently overpredicted by the model, suggesting collection delays in the studies. The model also consistently overpredicted the measured Sprague-Dawley rat tissue and blood concentrations, including the “recovery” (12 hr post-exposure) samples, which should not be subject to collection delays. Many of the “validation” comparisons were made at exposure concentrations (250 ppm [1,230 mg/m3]or greater) for which the optimized model did not provide accurate venous blood concentrations. It cannot be determined with the available data whether the 2–3-fold differences between the model and Sprague-Dawley rat blood concentrations at lower concentrations (75 and 150 ppm [369 and 738 mg/m3]) are due to methodological differences (e.g., in sample collections and analysis) or true strain differences. Overall, we conclude that the optimized model produces acceptable simulations of venous blood 1,2,4-TMB for chronic exposure to ≤ 100 ppm (492 mg/m3) for rats or ≤ 30 ppm (147.6 mg/m3) for humans 1,2,4-TMB by inhalation
Because the overprediction is consistent between rodent strains and across studies, the
model optimization choices should maybe be reconsidered. An attempt was made to
evaluate the model optimizations, but the data files used to conduct those optimizations
(e.g. swiercz-2003-ven-low.csv) were not found and thus the optimizations would not
run.
Conversely, the human model may be underpredicting blood concentrations. A
comparison of Figure B-16 (U.S. EPA, 2013) to the output produced in this assessment
indicates that the fit to the human data of Hissink et al 2007 matches for the elimination
phase, but ~25% lower peak blood concentrations are predicted (Figure 3). Because fat
content in these volunteers was measured, the study-specific fat percentage was used,
resulting in a slight additional decrease in the peak. Although holding the Km constant
and optimizing the Vmax did not result in a significant improvement to the fit to the data
(U.S. EPA, 2013), since human data is available, it might be advisable to determine
human-specific metabolic rates. Three different human exposure studies were identified
and blood TMB concentrations are under-predicted post-exposure in all of them
(Figures 3-5 and U.S. EPA, 2013 figures B14 and B15).

Apart from the consistent over-prediction of rat data and under-prediction of human
data, this model simulates the data overall and parameterization and implementation
seem correct, although a complete model review was not conducted.

Suggested Conventions to Facilitate PBPK Model Review
The US EPA needs to implement a rigorous and consistent approach to having their PBPK models and approach is peer-reviewed. This peer-review should be implemented in a consistent and thorough manner and should be conducted by an external panel, either the CAAC or some other assembled peer-review panel. This peer-review should yield a report detailing the findings of the peer-review. The review can follow EPA’s own method for reviewing PBPK models (McLanahan et al., 2012). As the CAAC reviews assessments that utilize PBPK models, the Agency can facilitate the panels ability to review and confirm the uses of the PBPK model. These include:
• The inclusion of an “about these files” script is excellent and highly
recommended. This file is very important and should be checked carefully. The
file should include information to:
o Describe generated figures (publication and figure #1)
o Dosing and parameters.
o other pertinent information.
• Over-arching setup files should be included. Parameters set in individual .m files
should be discouraged to assure a unified parameterization is in place.
o Because files may not be run in order, each file must setup all parameters
through the use of standardized setup files and must either contain the
data needed to produce figures or must call a central data file.
• Files should be put organized in a logical progression. Suggested order might be:
o Setup files for difference species/conditions
o Rodent studies via a route
o Rodent studies via alternate routes…
o Human studies
o Simulations
• All files should be annotated
o Especially note changes or different from standardize approaches

o Should indicate which, if any figures they reproduce from EPA reports
and/or manuscripts.
o Data source should be identified (Digitized from figure, supplied by
author…)
• Files should show the model mass-balance
References Brown, R.P., Delp, M.D., Lindstedt, S.L., Rhomberg, L.R., Beliles, R.P., 1997.
Physiological parameter values for physiologically based pharmacokinetic models.
Toxicol. Ind. Health 13, 407–84.
Hissink, A.M., Krüse, J., Kulig, B.M., Verwei, M., Muijser, H., Salmon, F., Leenheers,
L.H., Owen, D.E., Lammers, J.H.C.M., Freidig, A.P., McKee, R.H., 2007. Model studies
for evaluating the neurobehavioral effects of complex hydrocarbon solvents III. PBPK
modeling of white spirit constituents as a tool for integrating animal and human test
data. Neurotoxicology 28, 751–60.
U.S. EPA (2013). Toxicological Review of Trimethylbenzenes (CASRN 25551‐13‐7, 95‐
63‐6, 526‐73‐8, and108‐67‐8). In Support of Summary Information on the Integrated
Risk Information System (IRIS). Supplemental Information. EPA/635/R‐13/171b
Revised External Review Draft www.epa.gov/iris

TABLE 1. COMPARISON OF RAT MODEL INPUT PARAMETERS
Parameter (Hissink et al.,
2007)
Transmitted to
EPA
Transmitted to
Summit
Comments
Partitioning
Saline:Air 3 QC by EPA, as reported in Hissink et al
Olive oil:Air 13200 QC by EPA, as reported in Hissink et al
Blood:Air - rat 148 QC by EPA, as reported in Hissink et al
Rapidly perfused:Blood 2.53 QC by EPA, as reported in Hissink et al
Slowly perfused:Blood 1.21 QC by EPA, as reported in Hissink et al
Fat:Blood 62.7 QC by EPA, as reported in Hissink et al
Brain:Blood 2.53 QC by EPA, as reported in Hissink et al
Liver:Blood 2.53 QC by EPA, as reported in Hissink et al
Anatomical and Physiological
Alveolar ventilation rate (L/hr/kg0.7) 20 14* (Brown et al., 1997)
Total cardiac output (L/hr/kg0.7) 20 14* (Brown et al., 1997)
Blood flow (% cardiac output)
Liver (total) 25 17.6 (Brown et al., 1997)
Fat 9
Brain 1.2 2 (Brown et al., 1997)
Rapidly perfused (total) 49.8 76ǂ 57.4§ (Brown et al., 1997)
Slowly perfused (total) 15 NA Calculated
Tissue volume (% body weight)
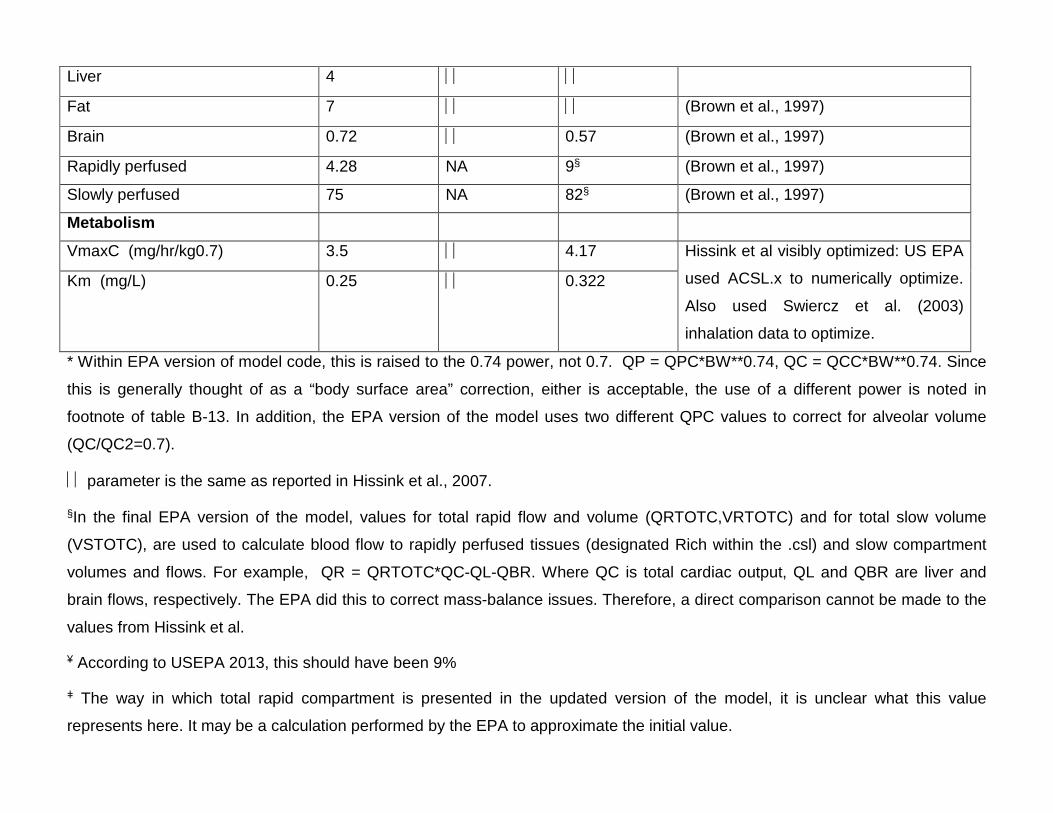
Liver 4
Fat 7 (Brown et al., 1997)
Brain 0.72 0.57 (Brown et al., 1997)
Rapidly perfused 4.28 NA 9§ (Brown et al., 1997)
Slowly perfused 75 NA 82§ (Brown et al., 1997)
Metabolism
VmaxC (mg/hr/kg0.7) 3.5 4.17 Hissink et al visibly optimized: US EPA
used ACSL.x to numerically optimize.
Also used Swiercz et al. (2003)
inhalation data to optimize.
Km (mg/L) 0.25 0.322
* Within EPA version of model code, this is raised to the 0.74 power, not 0.7. QP = QPC*BW**0.74, QC = QCC*BW**0.74. Since
this is generally thought of as a “body surface area” correction, either is acceptable, the use of a different power is noted in
footnote of table B-13. In addition, the EPA version of the model uses two different QPC values to correct for alveolar volume
(QC/QC2=0.7).
parameter is the same as reported in Hissink et al., 2007.
§In the final EPA version of the model, values for total rapid flow and volume (QRTOTC,VRTOTC) and for total slow volume
(VSTOTC), are used to calculate blood flow to rapidly perfused tissues (designated Rich within the .csl) and slow compartment
volumes and flows. For example, QR = QRTOTC*QC-QL-QBR. Where QC is total cardiac output, QL and QBR are liver and
brain flows, respectively. The EPA did this to correct mass-balance issues. Therefore, a direct comparison cannot be made to the
values from Hissink et al.
¥ According to USEPA 2013, this should have been 9%
ǂ The way in which total rapid compartment is presented in the updated version of the model, it is unclear what this value
represents here. It may be a calculation performed by the EPA to approximate the initial value.

NA – Because the way in which total rapid and slow compartments are presented in the updated version of the model, these
values would not be used in the model and were not provided to Summit for review.

TABLE 2. COMPARISON OF HUMAN MODEL INPUT PARAMETERS
Parameter (Hissink et al., 2007) Transmitted to Summit
Comments
Partitioning Saline:Air 3 QC by EPA, as reported in Hissink et al Olive oil:Air 13200 QC by EPA, as reported in Hissink et al Blood:Air - human 85 QC by EPA, as reported in Hissink et al Rapidly perfused:Blood 2.53 QC by EPA, as reported in Hissink et al Slowly perfused:Blood 2.11 QC by EPA, as reported in Hissink et al Fat:Blood 62.7 QC by EPA, as reported in Hissink et al Brain:Blood 2.53 QC by EPA, as reported in Hissink et al Liver:Blood 2.53 QC by EPA, as reported in Hissink et al Anatomical and Physiological Alveolar ventilation rate (L/hr/kg0.7) 20 15* (Brown et al., 1997) Total cardiac output (L/hr/kg0.7) 20 16* (Brown et al., 1997) Blood flow (% cardiac output) Liver (total) 26 17.5 (Brown et al., 1997) Fat 5 8.5 (Brown et al., 1997) Brain 14 11.4 (Brown et al., 1997) Rapidly perfused (total) 30 66.6 Slowly perfused (total) 25 Calculated§ Tissue volume (% body weight) Liver 2.6 Fat 14.6 21.4 Hissink et al., 2007, were describing
the specific population from their study – average body fat (measured using calipers was 14.6%.
Brain 2 Rapidly perfused 3 7.6 (Brown et al., 1997) Slowly perfused 66.4 81§ (Brown et al., 1997) VmaxC (mg/hr/kg0.7) 3.5 4.17 Scaled from rat Optimization Km (mg/L) 0.25 0.322 Scaled from rat Optimization

* Within EPA version of model code, this is raised to the 0.74 power, not 0.7. QP = QPC*BW**0.74, QC = QCC*BW**0.74. Since
this is generally thought of as a “body surface area” correction, either is acceptable, the use of a different power is noted in
footnote of table B-13. In addition, the EPA version of the model uses two different QPC values to correct for alveolar volume
(QP/QP2=0.7).
Parameter is the same as reported in Hissink et al., 2007
§In all versions of the model, values for total rapid flow and volume (QRTOTC,VRTOTC) and for total slow volume (VSTOTC), are
used to calculate blood flow to rapidly perfused tissues (designated Rich within the .csl) and slow compartment volumes and
flows. For example, QR = QRTOTC*QC-QL-QBR. Where QC is total cardiac output, QL and QBR are liver and brain flows,
respectively. The EPA added a mass-balance equation (QSTOTC=1-QRTOTC) to correct mass-balance issues. Therefore, a
direct comparison cannot be made to the values from Hissink et al. for Flows to the slow compartment.

TABLE 3. STUDY-REPORTED CMAX COMPARED TO PREDICTED CMAX Exposure
Concentration
(mg/l)
Data AVG* Model Prediction Model Prediction/Data
Hissink et al, 2007 (8 hr)
0.047 0.16 ± 0.010 0.27 1.7
0.19 0.81 ± NA 1.2 1.5
0.37 4.0 ± 0.70 3.7 0.93
Swiercz et al. 2003,
0.12 0.56 0.55 0.98
0.49 4.1 4.7 1.1
1.23 14 21.0 1.5
Comparison of model-predicted Blood 1,2,4-TMB to study-specific data. For Hissink et
al. 2007, data is at the end of the 8 hr exposure, for Swiercz et al., 2003 data is first
collected on the last day of repeated exposures. For .* ± SD when available.
TABLE 4. MODEL SIMULATED AND EXPERIMENTAL MEASURED CONCENTRATIONS OF 1,2,4-TMB IN MALE SPRAGUE-DAWLEY RATS EXPOSED TO 1,2,4-TMB AT THE END OF 12 HOUR EXPOSURE (ZAHLSEN, 1996).: TABLE B-11 FROM U.S. EPA 2013 Exposure
Concentration
(mg/l)
Experiment (mg/L)
Model Prediction Model Prediction/Data
0.37 1.7 4.2 2.5
0.74 6.9 18 2.6
1.5 14 48 3.5

TABLE 4. MODEL SIMULATED AND EXPERIMENTAL MEASURED CONCENTRATIONS OF 1,2,4-TMB IN MALE SPRAGUE-DAWLEY RATS EXPOSED TO 1,000 PPM (4,920 MG/M3) 1,2,4-TMB (12 HR/DAY, FOR 14 DAYS) AT THE END OF EXPOSURE: TABLE B-12 FROM U.S. EPA 2013 Day Experiment
(mg/L) Model Prediction Model
Prediction/Data
1 63.5 181 2.8
3 43.1 293 6.8
7 33.4 372 11.1
10 34.0 395 11.6
14 35.2 399 11.3
Table 5: Model simulated and experimental measured concentrations of 1,2,4-TMB in humans exposed to 2 ppm or 25 ppm for 2 hours during light workload (data from Jarnberg et al.). Exposure Concentration (2 hr, conditions of light work)
Measured average Blood Cmax (mg/L) Model Cmax (mg/L) Difference
2 ppm (11 mg/m3) 0.056 0.032 0.6 25 (123 mg/m3) 0.77 0.36 0.5
NON-CANCER ENDPOINT DOSE-RESPONSE MODELING FOR 1,2,4-TMB:KORSAK ET AL., 2000 1
US EPA 2013 Average mg/l
2 Model
Average mg/l
3 Hissink Model Average mg/l
4 Hissink/Model Average mg/l
Low 0.1339 0.13 0.16 1.2
Mid 0.8671 0.87 1.9 2.2

High 5.248 5.4 12.2 2.3
Column 1 is the data taken from U.S. EPA, 2013 Table C-1 (Korsak et al., 2000a).
Column 2 are the weekly average blood concentrations produced using average
exposures and body weights from that study in this assessment. Column 3 shows the
same assessment using the rat paramters from Hissink et al, 2017 (Table 1). Column 4
shows the difference between the Hissink and U.S. EPA, 2013 parameterization.
HUMAN INTERNAL METRIC COMPARISON AFTER CONTINUOUS INHALATION EXPOSURE: VENOUS TMB CONCENTRATION (SS) Exposure
Concentration (mg/m3)
Model
mg/l
Hissink Model
mg/l
Hissink/Model
mg/l
16 0.09 0.10 1.1
24.5 0.13 0.15 1.1
84 0.50 0.62 1.2
134 0.89 1.4 1.6