External Quantum Efficiency Optimization of Hybrid...
47
International Scientific Conference eRA-8 ISSN-1791-1133 1 External Quantum Efficiency Optimization of Hybrid Organic Photovoltaics using a Transmission Line method S.P.Savaidis 1 , N.A.Stathopoulos 1 , A.Botsialas 1 , G.Pagiatakis 3 and M.Vasilopoulou 2 1 Technological and Educational Institute of Piraeus, Department of Electronics Engineering, 12244 Aegaleo, Greece 2 NCSR ―Demokritos‖, Institute of Advanced Materials Physical Chemistry Processes and Micro-Nano-Electronics, POB 60228, 15310 Agia Paraskevi Attiki, Greece 3 School of Pedagogical and Technological Education (ASPETE) – Marousi Athens Abstract In this paper, the influence of inorganic metal oxide thin layers on the external quantum efficiency of a typical bulk heterojunction HyOPV with different materials, thicknesses and placement throughout the device’s structure is examined. In addition, the roughness that is typically developed at the deposition phase will be taken into account, since it affects the interference phenomena. The final results are useful for optimum design in both terms of external and internal quantum efficiency. In this context, the Transmission Line Method is used as the simulation method for the external quantum efficiency due to its simplicity and efficiency in comparison with the more popular Transfer Matrix Method (TMM). 1. Introduction Organic Photovoltaics (OPVs) have attracted great research and industrial interest during the last decades, mainly due to their promising applications in the field of renewable energy and their potential cost- effective use in the solar energy industry. Their structure is based on a stack of different organic and inorganic thin films, where their optical and geometrical characteristics (thickness, spectral refractive index and spectral extinction coefficient) play a significant role on the determination of the interference effects taking place across the layered structure. In turn, the optical interference effects determine the external quantum efficiency (EQE) of the OPVs. In particular, the design of an OPV device should take into account the aforementioned interference phenomena, in order to maximize the distribution of the optical electric field inside the photoactive layer. As a result, the maximum optical energy will be
Transcript of External Quantum Efficiency Optimization of Hybrid...

International Scientific Conference eRA-8
ISSN-1791-1133 1
External Quantum Efficiency
Optimization of Hybrid Organic
Photovoltaics using a Transmission
Line method
S.P.Savaidis1, N.A.Stathopoulos1, A.Botsialas1, G.Pagiatakis3 and
M.Vasilopoulou2
1 Technological and Educational Institute of Piraeus, Department of Electronics Engineering, 12244 Aegaleo, Greece
2 NCSR ―Demokritos‖, Institute of Advanced Materials Physical Chemistry Processes and Micro-Nano-Electronics, POB 60228, 15310 Agia Paraskevi
Attiki, Greece 3 School of Pedagogical and Technological Education (ASPETE) – Marousi
Athens
Abstract
In this paper, the influence of inorganic metal oxide thin layers on the external quantum efficiency of a typical bulk heterojunction HyOPV with different materials, thicknesses and placement throughout the device’s structure is examined. In addition, the roughness that is typically developed at the deposition phase will be taken into account, since it affects the interference phenomena. The final results are useful for optimum design in both terms of external and internal quantum efficiency. In this context, the Transmission Line Method is used as the simulation method for the external quantum efficiency due to its simplicity and efficiency in comparison with the more popular Transfer Matrix Method (TMM).
1. Introduction
Organic Photovoltaics (OPVs) have attracted great research and industrial interest during the last decades, mainly due to their promising applications in the field of renewable energy and their potential cost-effective use in the solar energy industry. Their structure is based on a stack of different organic and inorganic thin films, where their optical and geometrical characteristics (thickness, spectral refractive index and spectral extinction coefficient) play a significant role on the determination of the interference effects taking place across the layered structure. In turn, the optical interference effects determine the external quantum efficiency (EQE) of the OPVs. In particular, the design of an OPV device should take into account the aforementioned interference phenomena, in order to maximize the distribution of the optical electric field inside the photoactive layer. As a result, the maximum optical energy will be
International Scientific Conference eRA-8
ISSN-1791-1133 2
available for absorption by the photoactive layer and, in terms of the external quantum efficiency, the maximum photocurrent will be produced. Nevertheless, the combination of the layers’ thicknesses for the maximization of the field distribution across the photoactive layer, is not always suitable for the maximum internal quantum efficiency (IQE). In order to overcome this obstacle, the use of thin dielectric layers as optical spacers, has been proposed from many authors in the past[1]. Although the use of optical spacers has been embodied in an OPV’s optimum design procedure, their impact in the IQE is not always harmless. A rather thick dielectric spacer will act as an insulator and eventually as a charge barrier that reduces the OPV’s photocurrent. Additionally, its optical absorption characteristics in the visible spectrum should be taken into consideration for losses-efficiency balance. Recently, the use of thin metal oxide layers has been proposed, as alternative p-type or n-type materials, in order to enhance the charges transition throughout the layers between the electrodes[2]. Since these materials are inorganic, the OPVs that use this type of materials are referred to as Hybrid OPVs or HyOPV. Their selection, deposition and chemical or semiconducting characteristics, have been analyzed and tested extensively in order to improve the device’s IQE[3]. However, even if their thickness is limited to a very thin layer, they act as spacers and they have to be taken into account for the EQE calculation. Present paper examines the influence of the inorganic metal oxide thin layers, in the EQE of a HyOPV, for a variety of materials, thicknesses and placement throughout the device’s structure. Moreover, the roughness that is typically developed at the deposition phase will be taken into account, since it affects the interference phenomena. The final results will be useful for optimum design in both terms of EQE and IQE. In this context, the Transmission Line Method (TLM) will be used as the simulation method for the EQE, due to its simplicity and efficiency in comparison with the more popular Transfer Matrix Method (TMM). The photocurrent calculation using the aforementioned methods considers IQE=1 (i.e. all absorbed photons produce charges that contribute to the photocurrent).
2. The Transmission line method (TLM) for light incidence at the normal direction
The TLM has been described in detail elsewhere, for both normal[2] and inclined light incidence direction[4]. Herein, the normal incidence direction will be examined for an OPV multilayer structure that uses a typical bulk heterojunction photoactive layer, i.e. P3HT:PCBM compound. This device (see Figure 1) uses the PEDOT:PSS as a hole transport layer, however, for a HyOPV this layer could be replaced by a thin film of a p-type metal oxide. In addition, an n-type metal oxide thin layer could be inserted between the photoactive layer and the Aluminum electrode.

International Scientific Conference eRA-8
ISSN-1791-1133 3
Figure 1: The structure of a typical OPV
Figure 1’s equivalent transmission line circuit is depicted in Figure 2. In particular, each layer is represented by a transmission line with the corresponding length, the characteristic impedance and the transmission constant respectively. All transmission lines are connected in tandem and they are terminated at the Aluminum’s characteristic impedance (ZAl). Since the characteristic impedance and the transmission constant of each line is a function of its complex refractive index, the equivalent lines are in general lossy ones. The optical electric field is equivalent with the transmission lines’ magnetic current whereas the incidence optical wave is represented by the incoming current I0 from the semi-infinite transmission line that represents the thick glass substrate. Through the elementary transmission line theory, the current at the connection of the transmission lines can be easily derived, as well as the current distribution along the photoactive layer’s equivalent transmission line.
Figure 2: The equivalent transmission line circuit for the OPV of Figure 1.
ZAl
Zactive
ZPEDOT:PSS
ZITO
Zglass
I0
I1
I2
I3
22
033 2exp hk
ITO
PEDOT:PSS
Aluminum electrode
Bulk heterojunction photoactive layer
(P3HT:PCBM)
Glass light

International Scientific Conference eRA-8
ISSN-1791-1133 4
For each wavelength, the photocurrent can be calculated by the extinction coefficient of the photoactive material and by the integration of the modulus square of the magnetic current along the photoactive layer. For a light source within the visible spectrum, a new integration should be done by taking into account the corresponding weighting factor for each wavelength. Moreover, the use of metal oxides as hole transition layer, may result to a rather rough interface with the active layer. The depth of the roughness is a function of the metal oxide’s deposition condition, and in any case, is not negligible. In order to include roughness in the transmission line model, the reflection coefficient between the two layers should be modified, by multiplying the planar interface reflection
coefficient with [5], where h denotes the rms height of the
corrugation at the rough interface. Herein the rms value of the roughness depth has been taken into account and the final results are compared with the corresponding perfectly smooth interface.
3. Simulation results
Using the aforementioned procedure, the short circuit photocurrent has been calculated by considering an AM 1.5 G 100 mW/cm2 illumination source spectrum. In particular, we consider the OPV structure of Figure 1 where the hole transport layer is the PEDOT:PSS compound. In Figure 3 the short circuit photocurrent is depicted in a contour line form whereas, the thickness of the photoactive layer is varied between 10 and 400nm while the PEDOT:PSS is varied up to 70nm. In this case the interface between the two layers is considered perfectly smooth. As a result, high photocurrent values are achieved only for active layer thickness greater than 200nm. This is a non-realistic case because the thick photoactive layers present higher resistance and the IQE decreases drastically. However, there is a small range between 120 and 140nm where for thin enough PEDOT:PSS films the photocurrent is 13mA/cm2 . Next, we insert the roughness of the interface between the two layers that modifies the photocurrent contour diagram according to Figure 4. It is evident that at the same range of the active layer’s thickness, the photocurrent has been improved even for PEDOT:PSS films with up to 20nm thickness. By substituting now the PEDOT:PSS layer with the molybdenum oxide MoO3, the corresponding results are depicted in Figures 6 and 7.

International Scientific Conference eRA-8
ISSN-1791-1133 5
Figure 3: Short circuit photocurrent for perfectly smooth interfaces
Figure 4: Short circuit photocurrent for rough interface between PEDOT:PSS and photoactive layer (roughness up to 10nm)
The complex refractive index of the molybdenum oxide layer has been measured with ellipsometry and in Figure 6 the photocurrent is illustrated for perfectly smooth interface between the two layers. The results are almost similar with the PEDOT:PSS case, taking into account the condition of IQE=1. However, the roughness between the layers rather improves the photocurrent even more.

International Scientific Conference eRA-8
ISSN-1791-1133 6
Figure 6: Short circuit photocurrent for perfectly smooth interfaces
Figure 7: Short circuit photocurrent for rough interface between the MoO3 layer and the
photoactive layer (roughness up to 10nm)

International Scientific Conference eRA-8
ISSN-1791-1133 7
3. Conclusions
The simulation of the external quantum efficiency of hybrid OPV devices using the transmission line method has been presented. Considering IQE=1, the photocurrent has been calculated for a range of thicknesses for both the photoactive layer and the hole transition layer. The influence of the roughness of the interface between the two layers has also been taken into account. The simulated results showed that in terms of EQE, both the metal oxides and the typical polymer hole transport materials present the same efficiency.
Acknowledgement
This research has been co-financed by the European Union (European Social Fund – ESF) and Greek national funds through the Operational Program "Education and Lifelong Learning" of the National Strategic Reference Framework (NSRF) - Research Funding Program: ARCHIMEDES III. Investing in knowledge society through the European Social Fund.
References
[1] L. A. A. Pettersson, L. S. Roman, and O. Inganas, J. Appl. Phys., vol. 86, no. 1, pp. 487–496, 1999.
[2] N.A.Stathopoulos, L.C.Palilis, S.P.Savaidis, S.R.Yesayan, M.Vasilopoulou, G.Papadimitropoulos, D.Davazoglou and P.Argitis IEEE – JSTQE 16 (6), art. no. 5466225, pp. 1784-1791 (2010)
[3] L.C.Palilis, M.Vasilopoulou, A.M.Douvas, D.G.Georgiadou, S.Kennou, N.A.Stathopoulos, V.Constantoudis, P.Argitis Solar Energy Materials & Solar Cells 114, 205–213, (2013)
[4] N.A.Stathopoulos, L.C.Palilis, S.R.Yesayan, S.P.Savaidis, M.Vasilopoulou, and P.Argitis, J. Appl. Phys. 110, 114506 (2011)
[5] S.P.Savaidis, N.A.Stathopoulos, M.Vasilopoulou MNE2013, London, Sept 2013

International Scientific Conference eRA-8
ISSN-1791-1133 8
Medical Emergency Wearable System based on Wireless Tracing
Gear
E. J. Shanko1, Dr. M. G. Papoutsidakis2
1 Dpt. of Automation, Technological Educational Institute of Piraeus, P. Ralli and Thivon 250, Athens, 12244, Greece
Tel: +6972436439, E-mail: [email protected]
2 Dpt. of Automation, Technological Educational Institute of Piraeus, P. Ralli and Thivon 250, Athens, 12244, Greece
Tel: +30 2105381483, E-mail: [email protected]
This project demonstrates the feasibility of using cost-effective, flexible, and user-friendly equipment to inform people when user needs an emergency response. For years, emergency medical service providers conducted patient care by manually measuring vital signs. Herein, we describe a scalable emergency medical response system that couples the efficient data collection of a pulse sensor with the flexibility and interoperability of GSM / GPS service architecture. It is proven that in most of the cases disabled people can significantly improve their safety feeling by using such devices.
1. Introduction
Level of popularity on the medical alarm devices has been getting to be more and more well-known. These are remaining desired with the senior citizens thoroughly. They are fundamentally some form of miniature products. It may be worn by the user around the wrist or while in the neck. They have a button, which might be pressed in the event of an unexpected emergency. After the button is pressed the method will send the signal to the worried responders. In the event of any eventuality like falling down, meeting with a few incident and any of these types of issue, the elderly people today can easily access the button and press it. It doesn't require much effort. To ensure this ease of use, the gear is worn at ease areas such as the neck or the wrist. Once the button is pressed, the worried relatives will get activated. It will definitely keep the person at peace. All these services arrive with all the equipment from the companies. Some firms have released advanced gear that enables verbal conversation between the person and service supplier. The progress of technological innovations adds to products very innovative facilities. The most up-to-date progress enables to forward the help call and terminate many of the minimal priority calls routinely. One can find a number of sorts of units for various usages. Using this gear there's no have-to preserve check on the elderly in any-way moments. Some substantial devices can be utilized for multi purposes. These devices are called

International Scientific Conference eRA-8
ISSN-1791-1133 9
―emergency response systems‖. For example, Southern Illinois University Carbondale (SIUC) has established a toll-free and local telephone number that one can call to receive the latest SIUC Alert, see [1]. This is also passive emergency information. In the event of emergency, other options, including call-centers, media alerts, and other pre-recorded messages may be available using the same toll-free number, see [1]. In this research project, the motivation of study arises from the need to trace people who need assistance. The Wireless Medical Emergency System Gear (Wireless MESG) is a well-designed wrist cuff for the elderly or people who need help and attention. This gear consists of a medical aspect where reaching the phone or calling for help is not possible. So far, this user-friendly and low-cost gear is safe for children, adults and the elderly. It refers to people who have heart diseases or Alzheimer and live alone. It, surely, is automation for life, when landline phone is not available. This study will also be assisted by up to date technology like GPS location of the patient in an attempt to make the step beyond of what is already implemented nowadays.
2. Problem Solution
The user-patient, by pushing the only button on the bracelet, three relatives are informed by text messages. The content of the message is a phrase (i.e. «SOS», «ΗELP») and the coordinates of the patient’s location are transformed into street addresses, information easy to be read, by the relative in response. The main operation procedure includes many scenarios. If the button is pressed accidentally then a buzzer is set on. The mechanism gives the ability to the user to press it again, so that the buzzer is turned off, within 10 seconds. The microcontroller is receiving data continuously by a plug-and-play heart-rate sensor. In case of abnormal heart rate (heart rate => 90 or heart =<50), the module of the button has been pressed simultaneously with the activation of the buzzer. If ten seconds have passed, without the repressing of the button, the procedure for the messages has begun. The batteries ensure autonomous long-term operation, as seen in Fig 2.
3. Implementation Plan and Gear
The project will utilize open hardware for realizing its goals. Specifically we intend to use Arduino’s UNO Icomsat v1.1 [as seen in Fig. 1] solution to conduct a feasibility study. The reason to choose Arduino platform is also to have a cost effective and a robust design.
International Scientific Conference eRA-8
ISSN-1791-1133 10
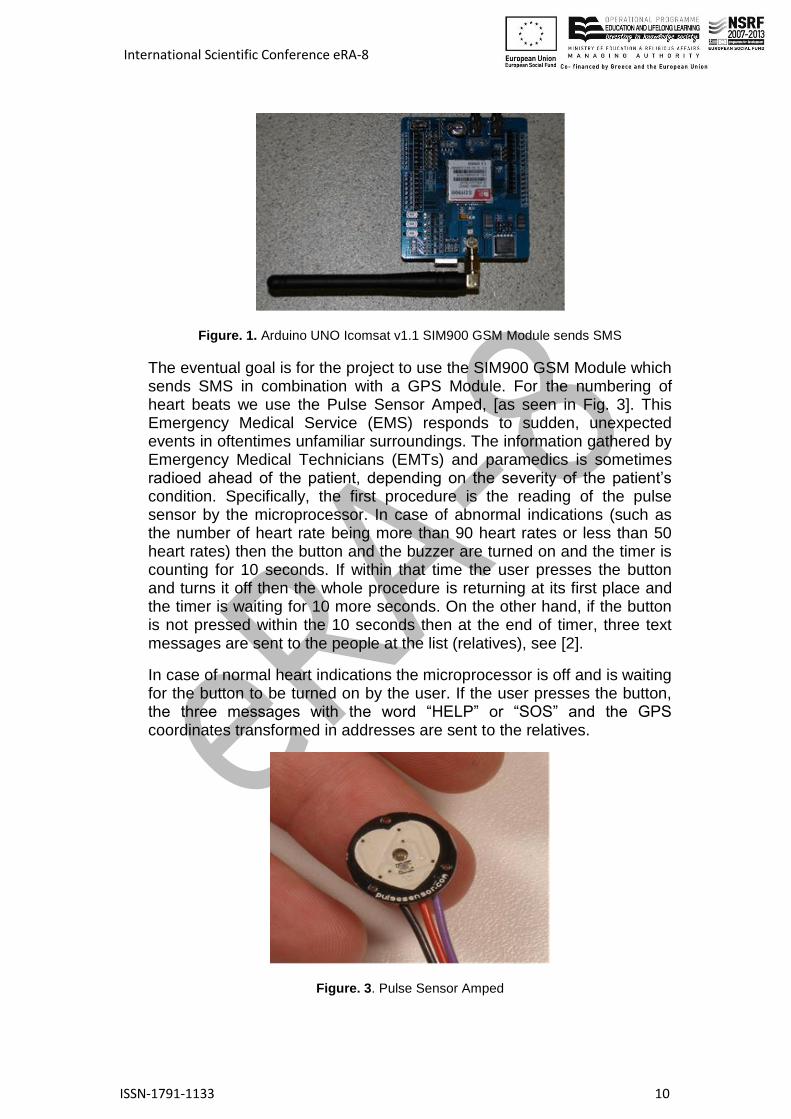
Figure. 1. Arduino UNO Icomsat v1.1 SIM900 GSM Module sends SMS
The eventual goal is for the project to use the SIM900 GSM Module which sends SMS in combination with a GPS Module. For the numbering of heart beats we use the Pulse Sensor Amped, [as seen in Fig. 3]. This Emergency Medical Service (EMS) responds to sudden, unexpected events in oftentimes unfamiliar surroundings. The information gathered by Emergency Medical Technicians (EMTs) and paramedics is sometimes radioed ahead of the patient, depending on the severity of the patient’s condition. Specifically, the first procedure is the reading of the pulse sensor by the microprocessor. In case of abnormal indications (such as the number of heart rate being more than 90 heart rates or less than 50 heart rates) then the button and the buzzer are turned on and the timer is counting for 10 seconds. If within that time the user presses the button and turns it off then the whole procedure is returning at its first place and the timer is waiting for 10 more seconds. On the other hand, if the button is not pressed within the 10 seconds then at the end of timer, three text messages are sent to the people at the list (relatives), see [2].
In case of normal heart indications the microprocessor is off and is waiting for the button to be turned on by the user. If the user presses the button, the three messages with the word ―HELP‖ or ―SOS‖ and the GPS coordinates transformed in addresses are sent to the relatives.
Figure. 3. Pulse Sensor Amped

International Scientific Conference eRA-8
ISSN-1791-1133 11
There are three options related to the coordinates’ transformation. There can be an application to the relatives’ phones which takes all the data from the bracelet and transform it into street addresses; of course there will be a deviation of 1, 5-2 meters. If an application cannot be available, the relatives should be attached to Wi-Fi spots so that the data get attached to a site (i.e. GSNetwork.com) and then be transformed. The other case that should be covered is the one where a Wi-Fi spot is not nearby. In that case, a Wireless Sensor Network (wireless protocol IEEE.804.4) should be included, as seen in figure 4, see [3]. Of course, it has to be mentioned that the first two options (the application and the site transformation) have not been into produced yet. As all authors are aware of, so far, this is the first attempt where the GPS’ coordinate transformation at cell phone text messages is introduced.
Figure. 4. Arduino and GPS Module
We will find and different kinds of communication between the user and the relative. For example at the Harvard’s Sensor Networks Lab ―CodeBlue: Wireless Sensors for Medical Care‖, the radio communication capabilities, [as seen in Fig. 5]. Sensor networks permit data gathering and computation to be deeply embedded in the physical environment. This technology has the potential to impact the delivery and study of resuscitative care by allowing vital signs to be automatically collected and fully integrated into the patient care record and used for real-time triage, correlation with hospital records, and long-term observation, see [4].
Figure 5. Accelerometer, gyroscope, and electromyogram (EMG) sensor for stroke
patient monitoring

International Scientific Conference eRA-8
ISSN-1791-1133 12
Given below are some key factors we look into, as we develop an emergency notification system: 1. Effectiveness of the heart-rate sensor to detect an emergency. 2. Transmission delay between sensing and reporting of information from the sensor to the central processing unit. 3. Threat validation delay once the emergency has been detected. 4. Overall notification delay to end user, see [5].
Similar to the idea of the Wireless MESG one can find the ALERTSU of Stanford University, see [6]. AlertSU is the Stanford University emergency notification strategy used to communicate time-sensitive information during an emergency event affecting campus. At this time, it is comprised of a mass notification system, an outdoor warning system, emergency website and emergency information hotline. The mass notification system delivers notifications via voice mail, email and text-messaging to members of the Stanford community. The outdoor warning system is a series of seven sirens which use a combination of alert tones and verbal instructions to deliver information to anyone outdoor on campus. These are the push methods for delivering information to the campus community. MissionMode Solutions, Inc. supplies Stanford University with mass notification functionality through its product, MissionMode. This hosted service provides a mechanism for delivering messages to the Stanford community through a variety of concurrent mechanisms including voice, email, and SMS (text message).
4. Future Work
Real time monitoring system is widely used and applied to many disciplines such as biomedicine. Nazeran et al. developed a computer-based monitor system to analyze the sleep breathing disorder in children by using heart rate variability analysis, see [7] and [8]. A user friendly system of real time wavelet analysis of the heart rate sensor signal can be designed. In this system, the friendly graphic control interface of LABVIEW can build a platform, upon which the input analog heart rate sensor signal can be transformed with a MATLAB program, in order to check on the patient’s heart rate every second. In other words, the proposed platform makes possible the development of a system prototype for real time signal analysis and monitoring without high development cost. The time-frequency characteristics of the heart rate sensor signal or the frequency of the pressing of the button, data obtained from the system can be read by a doctor for clinical diagnosis, see [7].
5. Conclusion
The need of the elderly to feel safe and the concern of the relatives for their beloved ones, is our motivation to study and create such a gear. The mechanism allows people to be found, if lost, especially people who have Alzheimer and live alone. On the other hand, people with heart diseases or panic crisis will benefit as well.

International Scientific Conference eRA-8
ISSN-1791-1133 13
Just by pushing the button the whole procedure takes place within a few seconds. Text messages are sent to relatives with a word (i.e. ―HELP‖) and GPS coordinates transformed into street addresses. Furthermore, in case that someone does not have the ability to push the button, a heart rate sensor activates the microprocessor, if heart rates are abnormal. If not, the beeper turns off when the button is pressed. It has to be mentioned, that a bracelet is all the user has put on. Wireless Medical Emergency Systems combined with web services offer a unique system for EMS. The preliminary results of the attempt suggest that the gear described herein sufficiently robust and scalable to meet the needs of our changing world.

International Scientific Conference eRA-8
ISSN-1791-1133 14
Figure 2. Wireless Medical Emergency System Gear Flowchart

International Scientific Conference eRA-8
ISSN-1791-1133 15
Acknowledgements
This research is implemented through the operational program "Education
and Lifelong Learning" (ARCHIMEDES III, project MIS 383575) and is co-
financed by the European Union (European Social Fund) and Greek national
funds.
References
[1] Southern Illinois University Carbondale, ―SIUC::Emergency Response Site‖ March 2008.
[2] Tia Gao, Dan Greenspan, Matt Welsh, Radford R. Juang, Alex Alm ―Vital Signs Monitoring and Patient Tracking Over a Wireless Network‖.
[3] Nada Hashmi, Dan Myung, Mark Gaynor, Steve Moulton, ―A Sensor-based, Web Service-enabled, Emergency Medical vcv‖
[4] Facilities net, ―Evaluating Campus Emergency Response Plans After Virginia Tech‖ April 2007.
[5] Konrad Lorincz, Bor-rong Chen, Jason Waterman, Geoff Werner-Allen, Matt Welsh ―Resource Aware Programming in the Pixie OS‖.
[6] Stanford University Environmental Health and Safety, MissionMode Solutions, Inc. ―AlertSU‖.
[7] Chien-Yue Chen1, Wing-Kwong, Cheng-Deng Kuo, Yun-Tzai Lia, Ming-Da Ke, Wavelet Real Time Monitoring System:A case study of the musical influence on electroencephalography, WSEAS TRANSACTIONS on SYSTEMS, Vol. 7, No. 3, pp. 60, 2008.
[8] Nazeran H, Pamula Y, Gradziel A, Ung K, S Vijendra, Behbehani K, Computer-based Analysis of Heart Rate Variability Signal for Detection of Sleep Disordered Breathing in Children, Proceedings of the 25th IEEE/EMBS International Conference, pp.17-21, 2003.

International Scientific Conference eRA-8
ISSN-1791-1133 16
Micro inverters for PV plants compared to the ordinary string or
central inverters
F. S. Gazis1, G. Α. Vokas2, I. J. Katsimardou3, J. K. Kaldelis4
1 Electronic Engineer - T.E.I. Piraeus, MSc in energy – TEI Piraeus & Heriot Watt University E-mail: [email protected]
2 Ass. Prof. T.E.I. Piraeus, Dept. of Electronics, Aigaleo - Athens, Greece Tel: + 30 (210) 5381180, E-mail: [email protected]
3 Mechanical Engineer, Aristotle university of Thessaloniki, MSc in energy – TEI Piraeus & Heriot Watt University
E-mail: [email protected]
4 Lab of Soft Energy Applications and Environmental Protection, Mechanical Engineering Department, TEI Piraeus, P.O. Box 41046, 12201 Athens,
Greece Tel: +30 (210) 5381237, E-mail: [email protected]
Abstract
The aim of this research is to study the micro inverter technology, where the inverter is placed on each photovoltaic (PV) module individually in comparison to the common string or central inverters.
In the already existing string and central inverters, several strings of PV modules are combined in order to achieve the power required from the inverter to operate. Especially in central inverters, more than 100 strings are connected in parallel and then these strings are led to the inverter after running several meters of DC cables. These cables are often very thick and as a result very expensive while at the same time they add losses to the overall system. On the other hand, AC cables are much less expensive and they have fewer losses. A significant advantage of this technology is the avoidance of shading losses and mismatch among different PV technologies which consists a great challenge on PV installations.
In order to compare the performance and output of the two inverter technologies, energy simulations will be conducted for each inverter topology. This way, the most suitable choice for PV inverters will be selected. The simulation application which is selected is PVSyst (photovoltaic system software) which uses data of the location of the project, the PV module and the inverter and calculates the annual energy production and performance of the installation.

International Scientific Conference eRA-8
ISSN-1791-1133 17
1. Introduction
The Kyoto agreement renewed interest in renewable energy systems worldwide. Many renewable energy technologies today are well developed, reliable, and cost competitive with conventional generators. Great interest is in grid connected applications, where the payback of the system is much faster and investors get a monthly salary according to the energy production of their PV application. The main components of a grid connected PV plant are the PV modules, the inverter, the safety components (i.e. fuses, circuit breakers, surge protectors etc.) and mounting systems. The inverter however, is the most vital component on a PV plant (Gazis et. al., 2010). The selection of the inverter has to be carefully made in accordance to the initial cost of the investment and the maintenance costs, which are directly related to the reliability of the system. There are three main types of inverters for grid connected applications, the string and multistring inverters, the central inverters and the micro inverters (Johns et al., 2010).
In many cases of PV installations, especially in the case of rooftop installations, the installer tries to install the highest possible PV power, so that the investor saves more money and pays back the system much faster. However, in such applications, the installer might face the risk of shadings that will reduce the energy yield of the system. Shadings can be caused from obstacles caused by the same building, such as chimneys, staircases and walls or it can be caused by nearby buildings or trees.
Shading may occur uniformly, covering the whole surface of the PV module, or it can only apply in a part of the module. In all cases, this will lead to a power degradation of the PV module and to the overall system respectively (Paraskevadaki and Papathanasiou, 2011). Moreover, in the worst case scenario, it can cause hot spots and damage the cells of the modules.
The aim of this research is the selection of an inverter topology that will maximise the energy yield of each PV module and on the same time to minimise the mismatch losses between different modules both for different energy classes and for different orientations. Moreover, this inverter will minimise the shadow losses on the PV plant and it will eliminate the risk of damaging the shadowed modules.
2. Reaction of the inverter’s and PV module’s output under shading conditions
Shadows created by clouds, trees, walls or different obstacles can cause change to the ―I – V‖ characteristics of the shadowed PV modules and to the total string on which they are connected. This way, the MPP tracker cannot locate the maximum power point of operation and power extracted from the string is less than expected (Al-Diab and Sourkounis, 2010).

International Scientific Conference eRA-8
ISSN-1791-1133 18
Sera et al. (2009), mentions that shadowing a part of a PV module will create deviation of its ―I – V‖ curve from the normal characteristics. Depending on the shadow type, in respect to the bypass diodes, this will
create different shapes of ―I – V‖ curves. On figures 1 to 3 below, the ―I – V‖ curves of shaded PV modules are given in respect to the non-shaded curve of the PV module.
Figure 1: Experimental I−V curves of the BP MSX120 panel with partial shadow (Sera et al.
2009).
Figure 2: Experimental I−V curves of the BP MSX120 panel with partial shadow (Sera et al.
2009).
Figure 3: Experimental I−V curves of the BP MSX120 panel with partial shadow (Sera et al.
2009).
Figure 4: Fill Factor variation in function of shadow rate of one cell of the PV module
(Girona, 2004).
Girona et al. (2004) suggests that shadows also lead to variations on the fill factor (FF) of the PV module. The author also proposes that these changes are related with changes in the shunt and series resistance of the PV module. On figure 4, the author presents the variation of the FF in function of shadow rate of one cell of a PV module.
If this shaded module is connected to a PV string with several other modules, the total current of the string will be reduced by the low power module. The drop of power is relative to the number of cells shadowed

International Scientific Conference eRA-8
ISSN-1791-1133 19
from the PV module and the effect on the system is greater than only reducing the power of that certain PV module. String inverters use their MPP tracker to scan the whole string of modules that is connected to them. So, in case of partial shading, the MPP tracking will not be sufficient to achieve a certain efficiency requirement. The reason is that the MPP tracker of the string inverter is not able to separate the shaded module
and adjust its MPP tracker so that it can harvest the maximum power from the non-shaded modules. This means that the string inverter will only monitor one I-V curve for the whole string of modules which will be distorted from the shaded module.
3. Methodology
A theoretical approach is used in order to compare the two different inverter technologies. The simulations were done through PVSyst (version 5) software, which has a database of all the available PV modules and inverters that are available on the market and it calculates the energy production of the system in accordance to the meteorological values that the user inserts. There are many different sources for meteorological data. In our case, Meteonorm (version 7) application was used, which is considered to be the most accurate and up to date.
The inputs of the simulation included the inclination of the modules and the orientation on the field, the horizon effects on the PV system, meaning the shadow losses on the system due to the natural shading objects (i.e. mountains, hills, etc.), the near shading effects, meaning the shadow losses on the system due to shading obstacles on the plant area or due to the PV arrays themselves and the system information, meaning the exact dimensioning of the PV system, the module interconnection and the thermal parameters of the PV modules.
The outputs of the simulation include the shading diagram of the PV arrays in reference to the sun altitude and to the shading obstacles and horizon effects on the plant, a detailed report for the produced energy, specific production (KWh/KWp) as well as the performance ratio of the plant. Finally it includes a detailed table presenting all most relevant information for the plant. These data include the Global irradiation, ambient temperature, monthly energy production of the PV arrays, monthly energy production of the PV plant, after the system losses, efficiency of the system.
The constant parameters of the study are the technical characteristics of the PV modules and PV inverters, the meteorological data for the area, the shading obstacles and the system losses, meaning cable losses, losses due to the air pollution and the thermal losses of the PV modules due to the rising temperatures on their surfaces. These values where left constant in order to achieve an accurate system comparison.

International Scientific Conference eRA-8
ISSN-1791-1133 20
For these four systems a complete payback period calculation is done, in order to evaluate the payback period of each system and fully understand whether it makes sense to use micro inverters instead of a string inverter.
According to (Kaldelis and Gavras, 2000), the complete payback period considers the time in which the present value of benefits equals the initial investment and it uses the discounted values of the cash flows for the relative calculations. Although it solves time value problem, it ignores the cash flow beyond the payback period.
The initial investment cost is given on the below equation:
'
1 1
1 (1 )l n l n
ln o o ll l
IC aIC i IC i
Where:
i: return on investment index, i': capital cost, α: participation of investor, β: participation of loan, γ: subsidy percentage
α + β = 1 – γ
The fixed maintenance and operational cost ―FCn‖ is calculated by the following simplified equation:
11
11 1
n
n
n oFC
g
im IC g i
i g
Where:
g: mean annual inflation rate (assumption), i: demanded return index of the own capital invested, m: fixed maintenance and operational factor and n: lifetime of investment
The future value of the total investment cost ―Cn‖ is given by the equation below:
Cn = ICn + FCn
The total savings over an ―n‖ year period, due to the operation of the system is given as follows:

International Scientific Conference eRA-8
ISSN-1791-1133 21
11
11 1
n
n
n oR
e
iR e i
i e
Where:
e: mean long term annual electricity price escalation rate and i: demanded return index of the own capital investment
The corresponding gains ―Gn‖ of the investment are defined:
Gn = Rn - Cn
In order to identify the point where the total revenue is just sufficient to cover the total cost, the brake even technique is used, where cost and revenue are equal. Thus, in this case:
Gn = Rn - Cn = 0
Finally, apart from the abovementioned approach for comparing micro and string inverters, a second simulation test is done which compares string and micro inverters under different levels of shadings. In more detail, a 3 KWp system was chosen which consists of the same materials as the one studied above. However, this time a different shading object is used which is placed 2m above the PV modules. On the two systems which are compared, the only variant is the height of the shading object. Since the shading object is different in shape and height, the inverter reaction and the inverter losses will be different than the previous case study. This way it can be tested whether micro inverters are still the most optimal solution on a shaded environment.
In this simulation, seven different cases where considered starting from non-shaded modules which was studied above and then shading was introduced uniformly on the surface of all the PV modules. In more detail, the following shade cases were studied:
Case 1: Approx. 10% of shade during the midday. The object height is 0.75m.
Case 2: Approx. 25% of shade during the midday. The object height is 1.00m.
Case 3: Approx. 50% of shade during the midday. The object height is 1.25m.

International Scientific Conference eRA-8
ISSN-1791-1133 22
Case 4: Approx. 70% of shade during the midday. The object height is 1.50m.
Case 5: Approx. 90% of shade during the midday. The object height is 1.75m.
Case 6: Approx. 100% of shade during the midday. The object height is 2.00m.
4. Findings and results
Figure 5 presents the annual energy production of a non-shaded 3 KWp system with a string inverter, compared to the one of an identical system which is equipped with micro inverters. It is found that the system with a string inverter appears 3.66% higher energy output compared to the system with micro inverter. Moreover, table 1 presents the monthly deviations of the two systems and the resulting average results. On the other hand, it is detected that the system with micro inverters appears
11.36% higher energy output in shaded conditions. Figure 6 and table 2 display the annual results of the system simulation.
Figure 5: Comparison between string and micro inverters in non-shaded environment
Figure 6: Comparison between string and micro inverters in shaded environment
0200400600
Jan
uar
y
Feb
rua…
Mar
ch
Ap
ril
May
Jun
e
July
Au
gust
Sep
te…
Oct
ob
er
No
ve…
Dec
em…
String inverter 3 KWp non-shadedEnergy (KWh)
Microinverter 3 KWp non-shadedEnergy (KWh)
0
200
400
Jan
uar
y
Feb
ru…
Mar
ch
Ap
ril
May
Jun
e
July
Au
gust
Sep
te…
Oct
ob
er
No
ve…
Dec
em…
String inverter 3 KWp shadedEnergy (KWh)
Microinverter 3 KWp shadedEnergy (KWh)

International Scientific Conference eRA-8
ISSN-1791-1133 23
Table 1: Comparison between string and micro inverters in non-shaded environment
Table 2: Comparison between string and micro inverters in shaded environment
Moreover, a comparison is made for each one system individually in shaded and non-shaded conditions. It appears that the system with micro inverters reduces its energy output by an average of 5.75% on an annual
basis when the system is partially shaded. On the other hand, the system with string inverters appears 19.40% lower energy output on the same shading conditions. Figures 7 and 8 as well as table 3 present the output of the simulations.
Figure 7: Comparison between string inverter’s operation under shaded and non-
shaded environments
Figure 8: Comparison between micro inverter’s operation under shaded and non-shaded
environments
Month
String inverter 3 KWp non-
shaded
Energy (KWh)
Microinverter 3 KWp non-
shaded
Energy (KWh)
String inverter 3 KWp shaded
Energy (KWh)
Microinverter 3 KWp shaded
Energy (KWh)Micro vs. string inverter (non-shaded)
January 93.80 86.80 78.90 83.00 -8.06%
February 151.70 144.60 122.90 136.00 -4.91%
March 240.50 233.00 193.70 218.90 -3.22%
April 332.60 323.80 265.20 303.60 -2.72%
May 384.80 374.00 310.10 353.20 -2.89%
June 386.20 374.20 313.60 355.30 -3.21%
July 408.90 396.10 329.40 374.80 -3.23%
August 366.20 354.50 292.30 333.50 -3.30%
September 282.80 275.20 225.70 257.60 -2.76%
October 193.30 185.50 153.30 172.00 -4.20%
November 104.60 97.50 86.00 92.50 -7.28%
December 71.70 65.40 60.60 62.80 -9.63%
Total 3017.10 2910.60 2431.70 2743.20 -3.66%
Month
String inverter 3 KWp non-
shaded
Energy (KWh)
Microinverter 3 KWp non-
shaded
Energy (KWh)
String inverter 3 KWp shaded
Energy (KWh)
Microinverter 3 KWp shaded
Energy (KWh)Micro vs. string inverter (shaded)
January 93.80 86.80 78.90 83.00 4.94%
February 151.70 144.60 122.90 136.00 9.63%
March 240.50 233.00 193.70 218.90 11.51%
April 332.60 323.80 265.20 303.60 12.65%
May 384.80 374.00 310.10 353.20 12.20%
June 386.20 374.20 313.60 355.30 11.74%
July 408.90 396.10 329.40 374.80 12.11%
August 366.20 354.50 292.30 333.50 12.35%
September 282.80 275.20 225.70 257.60 12.38%
October 193.30 185.50 153.30 172.00 10.87%
November 104.60 97.50 86.00 92.50 7.03%
December 71.70 65.40 60.60 62.80 3.50%
Total 3017.10 2910.60 2431.70 2743.20 11.36%
0
500
Feb
r…
Mar
ch
Ap
ril
May
Jun
e
July
Au
gust
Sep
t…
Oct
o…
No
ve…
Dec
e…
String inverter 3 KWp non-shadedEnergy (KWh)
String inverter 3 KWp shadedEnergy (KWh)
0
500
Feb
r…
Mar
ch
Ap
ril
May
Jun
e
July
Au
gu…
Sep
t…
Oct
o…
No
ve…
Dec
e…
Microinverter 3 KWp non-shadedEnergy (KWh)
Microinverter 3 KWp shadedEnergy (KWh)

International Scientific Conference eRA-8
ISSN-1791-1133 24
Table 3: Comparison between string and micro inverters themselves in shaded and non-
shaded environments
In terms of the payback period, the calculation of the complete payback period for each system gave the following results:
Table 4: Complete payback period calculation for each of the four systems
Finally, for the case of the variable shading systems, the conduction of the study gave the results which are presented on table 5 and figure 9:
Table 5: Comparison between string and micro inverters in different shading percentage
Month
String inverter 3 KWp non-
shaded
Energy (KWh)
Microinverter 3 KWp non-
shaded
Energy (KWh)
String inverter 3 KWp shaded
Energy (KWh)
Microinverter 3 KWp shaded
Energy (KWh)Micro non-shaded vs. micro shaded String non-shaded vs. string shaded
January 93.80 86.80 78.90 83.00 4.38% 15.88%
February 151.70 144.60 122.90 136.00 5.95% 18.98%
March 240.50 233.00 193.70 218.90 6.05% 19.46%
April 332.60 323.80 265.20 303.60 6.24% 20.26%
May 384.80 374.00 310.10 353.20 5.56% 19.41%
June 386.20 374.20 313.60 355.30 5.05% 18.80%
July 408.90 396.10 329.40 374.80 5.38% 19.44%
August 366.20 354.50 292.30 333.50 5.92% 20.18%
September 282.80 275.20 225.70 257.60 6.40% 20.19%
October 193.30 185.50 153.30 172.00 7.28% 20.69%
November 104.60 97.50 86.00 92.50 5.13% 17.78%
December 71.70 65.40 60.60 62.80 3.98% 15.48%
Total 3017.10 2910.60 2431.70 2743.20 5.75% 19.40%
Type of installation Complete payback period
String inverter non-shaded 3-4 years
String inverter shaded 5-6 years
Micro inverter non-shaded 6-7 years
Micro inverter shaded 6-7 years
String inverter 100% uniform shaded 5-6 years
Micro inverter 100% uniform shaded 7-8 years
MonthString inverter
Energy (KWh)
Micro inverter (KWh)
Energy (KWh)Micro vs. string inverter
non shaded 3017.10 2910.60 -3.66%
shaded - case 1 2787.80 2865.50 2.71%
shaded - case 2 2714.40 2786.50 2.59%
shaded - case 3 2640.40 2707.10 2.46%
shaded - case 4 2549.50 2609.30 2.29%
shaded - case 5 2461.60 2515.00 2.12%
shaded - case 6 2365.30 2412.00 1.94%

International Scientific Conference eRA-8
ISSN-1791-1133 25
Figure 9: Comparison between string and micro inverters in different shading
percentage
5. Conclusion
The results of the study showed that the performance of a system with micro inverters was not as high as expected. It was seen that only in the case of shaded systems we have the opportunity to harvest higher energy outputs compared to the system with string inverters. In the case of partial shading, the system with micro inverters produced 11.36% higher energy output. Even in the case of the variant uniform shading tests, the system with micro inverters produced at least 1.94% higher energy output throughout the year while being exposed to very strong shading. Conversely, it appears that the system with micro inverters underperforms by 3.66% in a non-shaded environment.
It was also seen that for the case of string inverters, the non-shaded system’s complete payback is achieved between the 3rd and 4th year of operation where for the shaded system the payback period was achieved between the 5th and 6th year of operation. For the case of micro inverters, it is seen that for both cases the complete payback is achieved between the 6th and 7th year of operation. However, although the payback period is higher for the system with micro inverters, the shaded system with micro inverters will provide higher revenue compared to the shaded system with a string inverter in a long term analysis. For the case of uniform shading, the system with string inverters has 5 - 6 years
complete payback period while the system with micro inverters has 7 - 8 years complete payback period.
Judging by these values, one can see that the micro inverter will always over-perform in a shaded environment. But on the other hand, the percentage of over-performance should be related to the additional cost which micro inverters require. Moreover, the feed in tariff (FIT) should always be considered so that the investor evaluates all the possible inverter alternatives. Finally, the replacement costs should always be
-5%
0%
5%
non shaded
shaded - case 1
shaded - case 2
shaded - case 3
shaded - case 4
shaded - case 5
shaded - case 6
Micro vs. string inverter
Micro vs. string inverter
International Scientific Conference eRA-8
ISSN-1791-1133 26
taken into consideration before selecting the most optimal inverter technology.
References
[9] Al-Diab, A. and Sourkounis, C., (2010). Multi-tracking single-fed PV inverter. MELECON 2010 - 15th IEEE Mediterranean Electrotechnical Conference [online], pp.1117-1122. Available from: www.ieeexplore.org [cited 1 June 2010]
[10] Gazis, P., Vokas, G. and Papathanasiou, St., (2010). Trends of power electronics on renewable energy systems [online].
[11] Girona, C., (2007). Shading effects in characteristic parameters of PV modules [online], pp.116-118. Available from: www.ieeexplore.ieee.org [cited 16 July 2007].
[12] Johns, M., Le, H.P. and Seeman, M., (2010). Grid connected solar electronics. Contemporary Energy Issues [online], pp.1-12. Available from: www.ieeexplore.org.
[13] Kaldellis, J. and Gavras, J. (2000). The economic viability of commercial wind plants in Greece. A complete sensitivity analysis. Energy Policy [online], vol. 37, pp. 4874–4883. Available from: www.sciencedirect.com [cited 19 May 2000].
[14] Paraskevadaki, E.V. and Papathanassiou, S.A., (2011). Evaluation of MPP Voltage and Power of mc-Si PV Modules in Partial Shading Conditions. In: Energy Conversion, IEEE Transactions [online], Issue 99, pp.1-10. Available from: www.ieeexplore.ieee.org [cited 21April 2011].
[15] Sera, D., Teodorescu, R. and Rodriguez, P., (2009). Partial shadowing detection based on equivalent thermal voltage monitoring for PV module diagnostics. Industrial Electronics, 2009. IECON '09. 35th Annual Conference of IEEE [online], pp.708-713. Available from: www.ieeexplore.org [cited 17 February 2010].
International Scientific Conference eRA-8
ISSN-1791-1133 27
Performance evaluation of a building integrated photovoltaic
thermal (BIPVT) air collector using different photovoltaic technologies
I.J. Katsimardou1, G.A. Vokas2, F.S. Gazis3, J.K. Kaldelis4
1 Mechanical Engineer-Aristotle University of Thessaloniki, MSc in Energy-T.E.I. Piraeus & Herriot Watt University, E-mail: [email protected]
2 Ass. Prof. T.E.I. Piraeus, Dept. of Electronics, Aigaleo - Athens, Greece, Tel: +30 (210) 5381180, E-mail: [email protected]
3 Electronic Engineer-T.E.I. Piraeus, MSc in Energy-T.E.I. Piraeus & Herriot Watt University E-mail: [email protected]
4 Lab of Soft Energy Applications and Environmental Protection, Mechanical Engineering Department, TEI Piraeus, P.O. Box 41046, 12201 Athens, Greece Tel: +30 (210) 5381237, E-mail: [email protected]
Abstract
The aim of this research is to study the potentiality of covering the heating power demand of a residential building using a hybrid photovoltaic/thermal (PV/T) system integrated on a south façade of the building as well as the suitability of different photovoltaic (PV) technologies to develop a system like this. The analysis includes the estimation of the heating power demand of the studied building. Moreover, a computational algorithm is developed in order to calculate the electrical efficiency of the three different PV collectors and the three different created PV/T air collectors as well as the thermal efficiency of the conventional solar collectors and the different PV/T air collectors. Thereafter a comparison of the thermal and electrical performance of each different PV/T air collector is presented.
1. Introduction
Nowadays, due to the increasing oil price, people turn to alternative solutions in order to cover their energy needs. Due to the insufficient thermal insulation of most Greek buildings, the heating and cooling processes tend to require significant energy consumption. In more detail, 60% of the energy consumption is used for heating [1]. The only way to reduce the energy price is to turn to sustainable resources. Solar energy is proven to be the most promising source of energy compared to the other energy resources and it has shown a growth of 33% since 1997 [2].
From the absorbed solar radiation by a PV module, only 5 – 15% is converted into electricity and the rest is emitted to the environment as

International Scientific Conference eRA-8
ISSN-1791-1133 28
waste heat which leads to an increase of the cell temperature and reduction of its efficiency [3]. According to each PV module specifications, there is a thermal coefficient that indicates the decrease of power per degree rise in temperature. PV thermal application (PV/T) is separated to two different parts, including the PV module that turns solar radiation into energy and the thermal solar technology which converts solar radiation into heat [4].
The integration of PV modules in a building’s surface or rooftop is referred as building integrated PV (BIPV). In BIPV a cavity is created between the PV module and the external wall of the building, so that air can be circulated in it. The air is heated due to the increased temperature of the PV surface and leads to heating the inner side of the building. In addition, the PV surface prevents the solar radiation from reaching the external wall of the building and reduces this way the cooling load in summer. The air flow in the cavity can either be naturally generated or through force. However, systems with heat extraction by air circulation appear to have reduced efficiency due to the low density of the circulated air [5].
The most recent technological advancements regarding the applications of PV/T hybrid systems are appeared in solar cooling, water desalination, solar greenhouse, solar still, photovoltaic-thermal solar heat pump/air conditioning system and building integrated photovoltaic/thermal (BIPVT) solar collectors by using different types of new materials for PV cells as well as different types of thermal collectors [6].
2. Analysis of the used methodology
2.1 Description of the studied system
The studied residential building is a detached house, with pilotis roof, basement and flat roof. It was constructed in 2001, in a building plot of a building site area of 186.99 m2. It is located in Agia Varvara, a suburb of Athens. It is assumed that the building is detached free. The surface of pilotis is 110.59 m2 and the surface of the first floor-apartment is 106.53 m2.The total height of the building is H=6.06m, while the height of the first floor as well as the pilotis is H=3,03m respectively. The total surface and volume of the heating areas of the building is 96.02 m2 and 338.4054m3 respectively.
The PV collectors that are attached on the south façade of the building develop an air duct. Eight vents are going to be constructed on the top and the bottom of the wall to transfer the air between the air duct and the building. Thermocouples are going to be installed to measure the temperature deviation of the room from floor to ceiling at different height levels. According to the indications of the thermocouples the vents open periodically. The indoor air is sucked from the bottom air vent. Thereafter, airflow is caused due to thermosiphon and absorbs heat from the PV

International Scientific Conference eRA-8
ISSN-1791-1133 29
panel and the wall. The warmed air subsequently enters into the building from the top vent.
There are going to be used three different photovoltaic panels in order to construct three different PV/T air collector systems. In more detail, it is assumed to be installed 18 semi-transparent PV collectors (SOLARWATT ORANGE 36M) of 155W covering an area of 23.04m2, 18 polycrystalline PV collectors (SOLARWATT ORANGE 54P) of 225W covering an area of 27.08m2 and 18 monocrystalline PV collectors (SOLARWATT ORANGE 54M) of 225W covering an area of 27.08m2 correspondingly. An illustration of the system is presented in Fig. 1.
Figure 1: Cross sectional view of the studied system.
2.2 Estimation of heating power demand
In order to estimate the heating power demand of the building the variable base degree day method was used. The total thermal conductivity having integrated the thermal losses to the ground is given from the following equation [7]:
tot cond p k k gnd gnd p
k
Wk k c V U A U A c V
K (1)
Where: Uk is the total thermal conductivity of the external walls, the roof as well as the French doors in
Ugrid is the thermal conductivity of the floor to the ground
Ak is the total surface of the external walls, the roof as well as the French doors

International Scientific Conference eRA-8
ISSN-1791-1133 30
Agrid is the surface of the floor in contact to the ground
V is the ventilation rate of the building
Cp is the specific heat of the air
ρ is the air density
The equilibrium temperature of the building is given as [7]:
gain
bal i
tot
Qt t
k (2)
The total heat gain of the building from the sun (Qsol), the people (Qocc), the lights (Qlit) as well as the devices (Qequ) is given from the below mentioned equation [7]:
gain occ lit equ solQ Q Q Q Q (3)
The monthly energy consumption for the heating is calculated as [7]
24balhtotm tDDkQ (4)
Where DDh(tbal) are the heating degree days in [Kdays]
The heating loss from the interior of the building to non-heated area is described by the below equation [7]:
'
1 int, int, 24wall wall i iQ U A t t n (5)
Where: Uint,wall is the thermal conductivity of the internal wall in contact to non-heated area of the building.
Aint,wall is the surface of the internal wall in contact to non-heated area of the building.
' 9it C (zone B)
n is the number of days per month
The monthly energy consumption for heating is estimated as [7]:
1mtot
b
Q QQ
n (6)
Where: nb is the efficiency of the boiler.
2.3 Estimation of the collector’s electrical characteristics

International Scientific Conference eRA-8
ISSN-1791-1133 31
The electrical efficiency of each collector is given from the following
equation [8]:
,( ) , ,( ) , ,( ) ( )mp PV mp ref PV P mp PV C refn n T T (7)
Where nmp,ref is the maximum power point efficiency of the PV module at reference conditions calculated under N.O.C.T.
μP,mp is the efficiency temperature coefficient
The mean monthly energy output of a PV module as well as of a PV/T air collector in kWh is calculated by the below equation [8]:
C elE H n (9)
Where: σρ is the pollution coefficient and it is assumed to be equal to 1 for clean collector.
σθ is the temperature correction coefficient and is calculated by the following equation.
2.4 Estimation of the collector’s thermal characteristics
The thermal efficiency of the PV/T air collector as well as the solar collector is calculated following the f-chart method. The connection between the monthly fraction of loads carried by solar energy f and the dimensionless variables is presented by the following equations [8]: f = 1.040Y - 0.065X – 0.159Y2 + 0.00187X2 – 0.0095Y3 (10)
'
( )R CR L ref a
R
F AX F U T T t
F L (11)
' ( )( )
( )
R CR n T
R n
F a AY F a H N
F L (12)
Where: AC is the collector area FR is the collector-heat exchanger efficiency factor UL is the collector overall loss coefficient (W/m2C) Δt is the total number of seconds in the month Ta is the monthly average ambient temperature Tref is empirical derived reference temperature L is the monthly total heating load for space heating (J)
TH is the monthly average daily radiation incident on the collector surface
per unit area (J/m2) N is the days in month
( )a is the monthly average transmittance-absorptance product

International Scientific Conference eRA-8
ISSN-1791-1133 32
In terms of the useful energy gain as well as the thermal efficiency of the PV/T air collector, these two parameters are estimated as [8]:
[ ( ) ( )]u C R T n L i aQ A F I U T T (13)
( ) i aT R n R L
T
T Tn F a F U
G (14)
Where IT, GT is the monthly solar irradiation.
3. Results and analysis
Regarding the heating load of the studied building figure 2 below presents the needed energy for heating during the period of October to April.
Figure 2: Building’s energy demand for space heating from October to April.
Taking into consideration the use of the three different types of photovoltaic collectors, the following tables perform a comparison between the electrical and the thermal efficiency of each system of each photovoltaic technology as well as a comparison of the energy flow and the domestic heating load that is potentially covered by each system respectively.
Table 1: Comparison of the electrical characteristics of different PV collectors
SOLARWATT
ORANGE 36M
SOLARWATT
ORANGE 54P
SOLARWATT
ORANGE 54M
PV PV/T PV PV/T PV PV/T
nmp 10.1% 11.3% 12.7% 13.8% 12.4% 13.6%
Percentage of
improvement (%) 11.9% 8.7% 9.6%
As it can be deduced, the electrical efficiency of all PV/T air collectors is higher than the corresponding PV collector of each technology. The PV/T air collector system that uses the polycrystalline SOLARWATT ORANGE 54P photovoltaic collector presents the higher electrical efficiency. Slightly lower electrical efficiency presents the PV/T air collector system that uses

International Scientific Conference eRA-8
ISSN-1791-1133 33
the monocrystalline SOLARWATT ORANGE 54M photovoltaic collector while the semi-transparent SOLARWATT ORANGE 36M PV/T air collector presents the lower electrical efficiency. However, the semi-
transparent SOLARWATT ORANGE 36M PV/T air collector presents the higher percentage of improvement in the electrical efficiency reaching the value of 11.96%.
Table 2: Comparison of the monthly domestic heating load covered by PV/T system and
conventional solar system
Month
SOLARWATT ORANGE 36M
SOLARWATT ORANGE 54P
SOLARWATT ORANGE 54M
f PV/T f solar f PV/T f solar f PV/T f solar
January 0.3473 0.4511 0.4175 0.5469 0.4175 0.5469
February 0.3772 0.4898 0.4534 0.5941 0.4534 0.5940
March 0.4916 0.6386 0.5912 0.7744 0.5912 0.7743
April 0.9591 1.2459 1.1528 1.5104 1.1528 1.5104
October 2.1654 2.8125 2.6038 3.4105 2.6038 3.4105
November 0.7565 0.9826 0.9094 1.1913 0.9094 1.1912
December 0.3682 0.4782 0.4426 0.5798 0.4426 0.5798
Figure 3: Comparison of the monthly domestic heating load covered by PV/T system and conventional solar system.
As it is observed, the percentage of the monthly domestic heating load covered potentially by each conventional solar system is higher than the corresponding PV/T air collector system. However, the PV/T air collector system that uses the polycrystalline SOLARWATT ORANGE 54P as well as the PV/T air collector system that uses the monocrystalline SOLARWATT ORANGE 54M photovoltaic collector present to have the same capability of covering the needed energy for space heating. Slightly lower domestic heating load appeared to be covered by the PV/T air

International Scientific Conference eRA-8
ISSN-1791-1133 34
collector system that uses the semi-transparent SOLARWATT ORANGE 36M collector. A comparison of the energy flow of each PV/T system and
each conventional solar system of each different photovoltaic technology is presented in table 3 as well as in figure 4.
Table 3: Comparison of energy flow between the PV/T system and the conventional
solar system
Month
SOLARWATT ORANGE 36M
SOLARWATT ORANGE 54P
SOLARWATT ORANGE 54M
qu,solar
[MJ/m2] qu,PV/T
[MJ/m2] qu,solar
[MJ/m2] qu,PV/T
[MJ/m2] qu,solar
[MJ/m2] qu,PV/T
[MJ/m2]
January 227.331 199.489 230.892 201.736 230.892 201.736
February 226.825 199.045 230.409 201.296 230.387 201.296
March 248.469 218.021 252.391 220.515 252.377 220.515
April 211.627 185.675 214.928 187.769 214.928 187.769
October 274.275 240.663 278.592 243.426 278.592 243.426
November 242.253 212.566 246.051 214.974 246.038 214.974
December 220.909 193.840 224.365 196.027 224.362 196.027
Figure 4: Comparison of energy flow between the PV/T system and the conventional solar system.
As it is can be seen, the monthly energy flow of each conventional solar system is higher than the corresponding PV/T air collector system. However, the PV/T air collector system that uses the polycrystalline SOLARWATT ORANGE 54P as well as the PV/T air collector system that uses the monocrystalline SOLARWATT ORANGE 54M photovoltaic collector present to have the same monthly energy flow. Slightly lower

International Scientific Conference eRA-8
ISSN-1791-1133 35
monthly energy flow appeared in the PV/T air collector system that uses the semi-transparent SOLARWATT ORANGE 36M collector.
4. Conclusion
The aim of this research is to propose the most suitable photovoltaic technology for creating a hybrid PV/T air heating system by taking advantage of the produced heat in a photovoltaic collector and using it for heating the internal of a building. The thermal efficiency of the photovoltaic thermal collector using the semi-transparent PV collector, the polycrystalline PV collector and the monocrystalline PV collector was calculated to be 49.31%, 49.87%, and 49.87% respectively. The thermal efficiency of the corresponding conventional solar collector calculated under the same conditions was found 56.19%, 57.08% and 57.07%. As it is observed, there is a small deviation in the thermal efficiency of the three different PV/T collectors with the polycrystalline PV/T collector and the monocrystalline PV/T collector to present the highest thermal efficiency. However, all three PV/T collectors present lower thermal efficiency compared to the conventional solar collector in a percentage of 6.88%, 7.21% and 7.20% correspondingly. Regarding the estimation of the electrical efficiency of each PV/T collector in comparison with the plain photovoltaic collector, the calculations under N.O.C.T conditions revealed that the efficiency of the semi-transparent PV/T collector is equal to 11.36% compared to 10.14% that the plain semi-transparent PV collector has under the same conditions. Similarly, the electrical efficiency of the polycrystalline PV/T collector is equal to 13.80% compared to 12.69% that the plain polycrystalline PV collector has, while the efficiency of monocrystalline PV/T collector is equal to 13.65% compared to 12.46% that the plain monocrystalline PV collector has. As it is deduced the polycrystalline PV/T collector presents the highest electrical efficiency. As it is observed each PV/T collector has lower total efficiency compared to the installation of both the conventional solar collector and the plain photovoltaic collector. To be more specific the total efficiency of the semi-transparent PV/T collector, the polycrystalline PV/T collector and the monocrystalline PV/T collector is lower in a percentage of 5.66%, 6.10% and 6.01% respectively. However, the important advantage of the PV/T technology is that although it presents slightly lower total efficiency it requires half of the surface available in order to produce almost the same thermal and electrical energy compared to the surface needed for the installation of both the plain PV collector and the conventional solar collector. Moreover, regarding the comparison among the three different PV/T technologies the polycrystalline PV/T collector presents the highest total efficiency constituting the polycrystalline PV module the most

International Scientific Conference eRA-8
ISSN-1791-1133 36
suitable PV technology among the three of them for developing a PV/T air collector system able to present high electrical and thermal efficiency as well.
References
[16] G. Vokas, N. Christantonis, F. Skittides, ―Hybrid photovoltaic–thermal systems for domestic heating and cooling—A theoretical approach‖, Solar energy, 80, 5, pp.607-615, May 2005.
[17] A. Ibrahim, M. Othman, M. Ruslan, S. Mat, K. Sopian, ―Recent advances in flat plate photovoltaic/thermal (PV/T) solar collectors‖, Renewable and Sustainable Energy Reviews, pp.352–365, September 2010.
[18] J. Tonui, Y. Tripanagnostopoulos, ―Improved PV/T solar collectors with heat extraction by forced or natural air circulation‖, Renewable energy, 32, 4, pp.623-637, May 2006.
[19] E. Erdil, M. Ilkan, F. Egelioglu, ―An experimental study on energy generation with a photovoltaic (PV) – solar thermal hybrid system‖ Energy, pp.1241– 1245, December 2007.
[20] H. Zondag, ―Flat-plate PV-Thermal collectors and systems: A review‖, Renewable & Sustainable energy reviews, 12, 4, pp.1-12, December 2005.
[21] V.V. Tyagi, S.C. Kaushika, S.K. Tyagib, ―Advancement in solar photovoltaic/thermal (PV/T) hybrid collector technology‖ Renewable and Sustainable Energy Reviews, 16, pp.1383-1398, January 2012.
[22] K. Papakostas, ―Notes for heating lesson‖, Thessaloniki: Aristotle University of Thessaloniki Press, 2004.
[23] J.A. Duffie, W.A., Beckman, ―Solar Engineering of Thermal Processes‖, John Wiley & Sons, Inc., New York, 1991.

International Scientific Conference eRA-8
ISSN-1791-1133 37
PV energy production over Greece: comparison between two simulation
toolsand real measurements
K. V. Lagogiannis1
, G. Α. Vokas2
1
Electronic Engineer, T.E.I. Piraeus, Tel: +30 210 5028932, E-mail: [email protected]
2
Ass. Prof. T.E.I. Piraeus, Dept. of Electronics, Aigaleo -Athens, Greece Tel: +30 210 5381180, E-mail: [email protected]
Abstract
The purpose of this study is to compare two of the most well known softwares tools that have been used worldwide, PVsyst 5.2 preliminary design and PVgis, as regard to their simulation energy production results that a Photovoltaic (PV) park can produce in each area of Greece. The recent Greek regulation provided to the PV parks favourable incentive schemes, like high Feed-in-Tariff kWh sales price, and this fact led to high increase of the PV parks installations. In this research a comparison of simulated and real measured data is performed and presented, showing large differences between them. Investors, banks and authorities use such software tools, when investment decisions are needed. Therefore, the results of this investigation must be taken into account when accurate calculations are needed. Moreover, using PVgis’ meteorological database, a new and more detailed solar map than the one presently existing is made.
1. Introduction
The rational use of energy and the exploitation of new methods of improved energy conversion efficiency was, is and will be one of the most important issues and challenges of the scientific world. Every object we produce required energy to make something or energy to transport, and the energy demands are closely linked to the economic growth of a country. Renewable energy provides a variable and environmental friendly option and national energy security at a time when decreasing global reserves of fossil fuels threatens the long-term sustainability of global economy [1].

International Scientific Conference eRA-8
ISSN-1791-1133 38
About 16% of global final energy consumption comes from renewables. Sun is an almost unlimited source responsible for most of all other energy kinds. Sunlight and heat are transformed and absorbed by the environment in a multitude of ways. Some of these transformations result
in renewable energy flows such as biomass and wind energy [2].
Solar powered electrical generation relies on photovoltaics and heat engines. Active solar techniques include the use of photovoltaic panels and solar thermal collectors to harness the energy. According to all known solar irradiation maps the solar radiation in Greece is considered as of the highest in Europe. The sunshine duration in the south part of the country is about 3,000h per year and the average annual global solar radiation is
around 1,700kWh/m2
on the horizontal surface [3]. This leaded a huge growth of the installations of Photovoltaic (PV) Parks in Greece and in most developed Europe countries during the recent years. More specifically, until 2005, only 5,44MWp of off-grid and grid-connected PV systems were installed [4]. But, after 2006, when new incentives were set through Law 3468/2006, more than 2,2GWp of PV parks are installed in Greece within the last 6 years, covering a significant part of energy demand especially during the peak hours [5]. This achievement is four times more than the target set in the European PV Policy Group [6], in which a target of 5% of the installed Greek capacity was set until 2020. Hence, the importance of precise energy calculations is high, especially when large RES investments are planned to be realized. Investors, banks, installers and suppliers are calculating the expected energy using known simulation tools like PVgis and PVsyst 5.2. However, the precision of their calculations is to be investigated both between them and between real measurements of already installed and operating PV parks.
2. Renewable energy capacity in Greece
According to the monthly bulletin of the Hellenic Electricity Market Operator presented in Figure 1, till the end of July 2013, the installed capacity of wind was 1497MW, of small hydro systems 218MW, of biomass-biogas 46MW, of photovoltaic systems 2017MW and of roof PV systems was 340MW.

International Scientific Conference eRA-8
ISSN-1791-1133 39
Figure 1: 2008-2013 Installed RES capacity in the interconnected System (Source:
Hellenic Electricity Market Operator, 2013)
Remarkable is the macroevolution of the PV installation capacity. Greece has already fulfilled both targets [7] that have been set from European Union council of Ministers and the European parliament for the year of 2015 (1500MW) and the target for the year of 2020 with 2200MW. In August of 2011 the installed capacity was 301MW, in August of 2012 was 904MW and in August of 2013 was 2363MW (cumulative capacity of PVs and roof PVs).
3. PVsyst 5.2 preliminary and PVgis presentation
PVyst 5.2 [8] is a computer’s software package for the study, sizing and data analysis of complete PV systems. It deals with grid-connected, stand-alone, pumping and DC-grid (public transport) PV systems, and includes extensive meteorological and PV systems components databases, as well as general solar energy tools.
PVsyst 5.2 offers 3 levels of PV system study, roughly corresponding to the different stages in the development of real project. In this investigation the preliminary design level is used. This is the pre-sizing step of a project. In this mode the system yield evaluations are performed very quickly in monthly values, using only a very few general system characteristics or parameters, without specifying actual system components. A rough estimation of the system cost is also available.
For grid-connected systems, and especially for building integration, this level will be architect-oriented, requiring information on available area, PV technology (colors, transparency, etc), and power required or desired

International Scientific Conference eRA-8
ISSN-1791-1133 40
investment.
For stand-alone systems this tool allows to size the required PV power and battery capacity, given the load profile and the probability that the
user will not be satisfied ("Loss of Load" LOL probability, or equivalently the desired "solar fraction").
For Pumping systems, given water requirements and a depth for pumping, and specifying some general technical options, this tool evaluates the pump power and PV array size needed. As for stand-alone systems, this sizing may be performed according to a specified probability that the water needs are not met over the year.
On the other hand PVgis [9] is a database of solar radiation and temperature data combined with a web interface that lets user calculate the energy output of photovoltaic (PV) systems. Moreover is a scientific tool that allows everyone to do a research on the performance of PV systems over large geographical areas and estimate the potential for solar energy deployment in Europe and Africa. The PVgis solar radiation databases for Europe were obtained by getting long term monthly averages global and diffuse irradiation from ground stations that are interpolated onto a spatial grid. These data are collected by European Solar Radiation Atlas over the period of 1981 – 1990.
4. PVgis Vs PVsyst 5.2 preliminary Results
PVgis needs less information for system’s specification, it has an easier and faster interface than PVsyst and it has its own database of solar radiation and temperature data. However it does not have great accuracy regarding the solar energy potential of a selected site. On the other hand using PVsyst 5.2 preliminary version, quick evaluations using monthly values performed. In this software, the meteorological data are allowed to be imported from more than seven sources. In Table 1 a comparison between the energy results of each software tool of a medium scale low voltage PV park in absolute and percentage values is presented.
Table 1. Differences between data exported from PVsyst 5.2 Preliminary Design and PVgis concerning the same point in each region Figure 2: Differences between data exported from PVsyst 5.2 Preliminary Design and PVgis concerning the same point in each region
Prefecture PVgis energy in kWh/kWp
PVsyst energy in kWh/kWp
Difference in percentage (%)
Corinthia 1390 1372 1,31
Achaea 1310 1298 0,92
Elis 1310 1304 0,46
Arcadia 1390 1366 1,76
Messnia 1320 1319 0,08
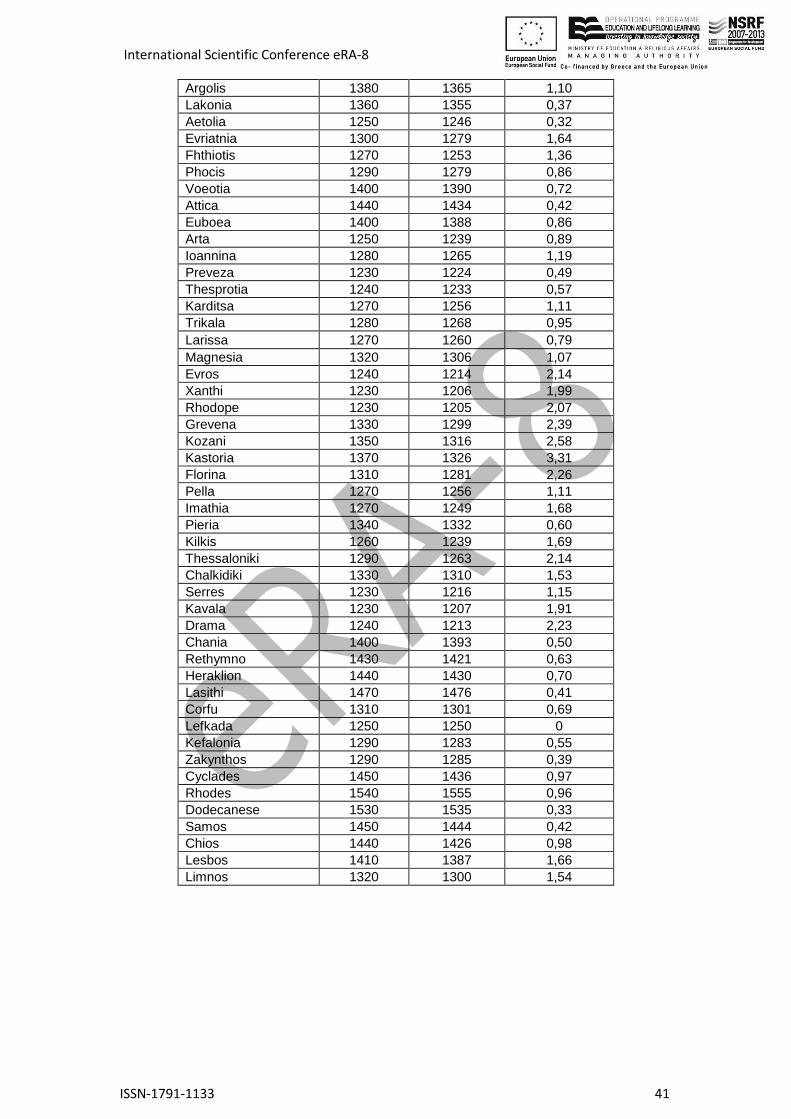
International Scientific Conference eRA-8
ISSN-1791-1133 41
Argolis 1380 1365 1,10
Lakonia 1360 1355 0,37
Aetolia 1250 1246 0,32
Evriatnia 1300 1279 1,64
Fhthiotis 1270 1253 1,36
Phocis 1290 1279 0,86
Voeotia 1400 1390 0,72
Attica 1440 1434 0,42
Euboea 1400 1388 0,86
Arta 1250 1239 0,89
Ioannina 1280 1265 1,19
Preveza 1230 1224 0,49
Thesprotia 1240 1233 0,57
Karditsa 1270 1256 1,11
Trikala 1280 1268 0,95
Larissa 1270 1260 0,79
Magnesia 1320 1306 1,07
Evros 1240 1214 2,14
Xanthi 1230 1206 1,99
Rhodope 1230 1205 2,07
Grevena 1330 1299 2,39
Kozani 1350 1316 2,58
Kastoria 1370 1326 3,31
Florina 1310 1281 2,26
Pella 1270 1256 1,11
Imathia 1270 1249 1,68
Pieria 1340 1332 0,60
Kilkis 1260 1239 1,69
Thessaloniki 1290 1263 2,14
Chalkidiki 1330 1310 1,53
Serres 1230 1216 1,15
Kavala 1230 1207 1,91
Drama 1240 1213 2,23
Chania 1400 1393 0,50
Rethymno 1430 1421 0,63
Heraklion 1440 1430 0,70
Lasithi 1470 1476 0,41
Corfu 1310 1301 0,69
Lefkada 1250 1250 0
Kefalonia 1290 1283 0,55
Zakynthos 1290 1285 0,39
Cyclades 1450 1436 0,97
Rhodes 1540 1555 0,96
Dodecanese 1530 1535 0,33
Samos 1450 1444 0,42
Chios 1440 1426 0,98
Lesbos 1410 1387 1,66
Limnos 1320 1300 1,54

International Scientific Conference eRA-8
ISSN-1791-1133 42
Figure 2: Differences between data exported from PVsyst 5.2 Preliminary Design and PVgis concerning thesame point in each region
Observing Table 1, it is considered that for the same point of each region the simulations results calculated by the two software tools are almost the same. In most cases PVgis is giving slightly higher amount of energy rather than PVsyst 5.2 preliminary but the difference in all regions is not higher than 3.5 % and the average difference is 1.08 %. The PV energy production according to the same investigation ranged from 1230kWh/kWp in Northern Greece to 1530kWh/kWp in the islands of the Aegean’s sea.
5. Solar irradiation results using PVgis database
PVgis software provides information for each selected area; not only concerning the theoretical amount of energy that can be produced, but also concerning the global irradiation (direct or diffuse) and the ambient temperature. In order to investigate the global irradiation all over Greece, it is necessary to take a sample from each prefecture. Five (5) measurements have been taken from each site and the result after the
appropriate analysis is the average global irradiation potential in kWh/m2
. 265 measurements have been taken all over Greece and the results are presented in table 2.

International Scientific Conference eRA-8
ISSN-1791-1133 43
Table 2: Average of five points, solar irradiation in Greece according to PVgis
Figure 3: Solar irradiation map of Greece using PVgis software. Prices
are in kWh/m2
The results are presented with increasing values in terms of solar irradiation. According to the PVgis simulation software, the solar irradiation in northern Greece and specifically in Drama, Evros and Xanthi
is the lowest in the country and is approximately 1472kWh/m2
to
1516kWh/ m2
. The areas with the highest solar irradiation potential are Attica, the island of Creta and the island of Rhodes reaching higher
values, from 1802kWh/m2
up to 1922kWh/m2
. A new, more detailed irradiation map of Greece is created and presented in Figure 3, using the solar radiation values stated in table 2. This map shows the yearly sum of global irradiation per prefecture.
Prefecture Average global
irrad. in kWh/m2
Prefecture Average global
irrad. in kWh/m2
Drama 1472 Elis 1646
Evros 1512 Chalkidiki 1654
Rhodope 1512 Grevena 1660
Xanthi 1516 Kozani 1674
Kavala 1532 Achaea 1676
Serres 1540 Messenia 1690
Lefkada 1550 Pieria 1692
Arta 1554 Florina 1696
Ioannina 1556 Arcadia 1702
Preveza 1558 Kastoria 1708
Thesprotia 1576 Lakonia 1714
Kilkis 1576 Voeotia 1726
Larissa 1578 Argolis 1726
Aetolia 1586 Corinthia 1730
Karditsa 1586 Lesbos 1744
Evritania 1588 Rethymno 1746
Kefalonia 1592 Euboea 1752
Trikala 1594 Chania 1776
Thessaloniki 1596 Cyclades 1782
Pella 1604 Attica 1802
Zakynthos 1618 Samos 1810
Corfu 1628 Chios 1814
Fhthiotis 1632 Heraklion 1842
Magnesia 1632 Lasithi 1868
Limnos 1634 Dodecanese 1882
Imathia 1642 Rhodes 1922
Phocis 1644

International Scientific Conference eRA-8
ISSN-1791-1133 44
The color-scale that is used to visualise the irradiation differences
between each region is escalated every 50kWh/m2
in order to give better optical result. As expected, the prefectures located in central and north
Greece have less solar irradiation, than those located in islands or in southeastern Greece. In the central and northern regions the solar
irradiation ranges between 1450kWh/m2
-1700kWh/m2
and in
southeastern and seaside regions it ranges between 1700kWh/m2
-
1950kWh/m2
.
6. Comparison between simulation results and Real data
The energy values resulted from PVsyst 5.2 preliminary and PVgis packages are compared with the actual values derived from the Sunny Portal internet site. In this site real time energy measurements of installed and operating PV parks using SMA inverters for the transformation of DC coming out of the solar panels arrays to AC have been taken. The diagrams provide the annual energy production of each PV Park through its operational time as it seems in Figure 4 and 5.
Figure 4: Total photovoltaic energy yielded presented in diagram

International Scientific Conference eRA-8
ISSN-1791-1133 45
Figure 5: Total photovoltaic energy yielded presented in table
For the purposes of this study, data from three areas, Kilkis (in North Greece), Larissa (in Central Greece) and Lasithi (in Creta island in South Greece), are used in order to be compared with the simulation results. These three areas are selected in a manner so that to represent north, central and south Greece regions, with different solar radiation.
In order to receive a more reliable result from the real measurements, we selected nine (9) PV parks located in the region of Kilkis. According to their real data the average annual energy produced is 1510kWh/kWp. In the area of Larissa (central Greece), 1490kWh/kWp was the average annually production of four (4) photovoltaic parks that have been measured. Following the same procedure in the area of Lasithi located in Creta island (South Greece), the average annual energy produced by five PV parks is 1750kWh/kWp. According to Table 1, the theoretical average value between the two software tools of PVSyst 5.2 preliminary and PVgis is 1250kWh/kWp for the region of Kilkis, 1265kWh/kwp for Larissa and 1473kWh/kWp for Lasithi. In figure 4 there is a graphical comparison between the simulated results and the average measured values.
Figure 6: Comparison between simulated and measured energy values
The average difference concerning these three prefectures of Greece is approximately 16%. In table 3 the results are analytically presented. More specifically, between the simulated and the measured values there is a difference of 17,22% in Kilkis region, 15,10% in Larissa and 15,83% in
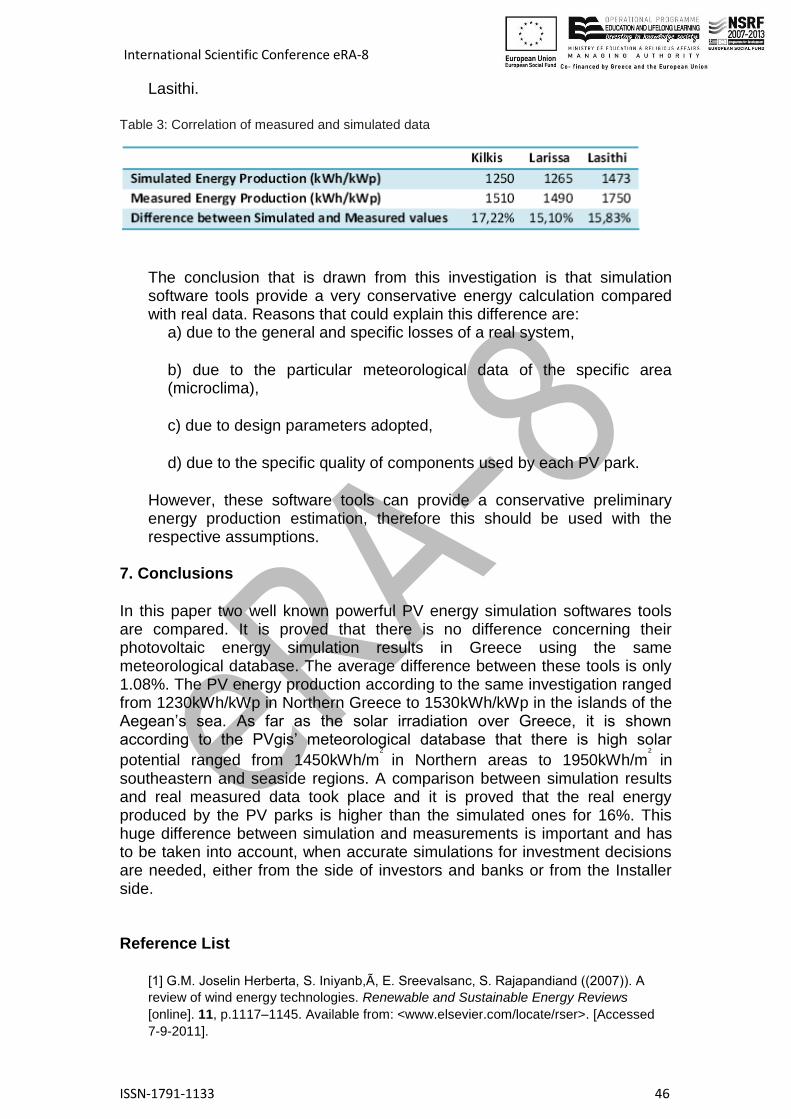
International Scientific Conference eRA-8
ISSN-1791-1133 46
Lasithi.
Table 3: Correlation of measured and simulated data
The conclusion that is drawn from this investigation is that simulation software tools provide a very conservative energy calculation compared with real data. Reasons that could explain this difference are:
a) due to the general and specific losses of a real system,
b) due to the particular meteorological data of the specific area (microclima),
c) due to design parameters adopted,
d) due to the specific quality of components used by each PV park.
However, these software tools can provide a conservative preliminary energy production estimation, therefore this should be used with the respective assumptions.
7. Conclusions
In this paper two well known powerful PV energy simulation softwares tools are compared. It is proved that there is no difference concerning their photovoltaic energy simulation results in Greece using the same meteorological database. The average difference between these tools is only 1.08%. The PV energy production according to the same investigation ranged from 1230kWh/kWp in Northern Greece to 1530kWh/kWp in the islands of the Aegean’s sea. As far as the solar irradiation over Greece, it is shown according to the PVgis’ meteorological database that there is high solar
potential ranged from 1450kWh/m2
in Northern areas to 1950kWh/m2
in southeastern and seaside regions. A comparison between simulation results and real measured data took place and it is proved that the real energy produced by the PV parks is higher than the simulated ones for 16%. This huge difference between simulation and measurements is important and has to be taken into account, when accurate simulations for investment decisions are needed, either from the side of investors and banks or from the Installer side.
Reference List
[1] G.M. Joselin Herberta, S. Iniyanb,Ã, E. Sreevalsanc, S. Rajapandiand ((2007)). A
review of wind energy technologies. Renewable and Sustainable Energy Reviews
[online]. 11, p.1117–1145. Available from: <www.elsevier.com/locate/rser>. [Accessed
7-9-2011].

International Scientific Conference eRA-8
ISSN-1791-1133 47
[2] Panwar, N., L., Kaushik, S., C., Kothari, S., 2011. Role of renewable energy
sources in environmental protection: A review. Renewable and Sustainable Energy
Reviews [online]. 15, [Accessed 10-5-2011], pp.1513–1524. Available from:
<www.elsevier.com/locate/rser>.
[3] Protogeropoulos, C., Chadjivassiliadis, J., 2004. Review on the development of
photovoltaic activities in Greece. In: 19th European Photovoltaic Solar Energy
Conference. 7 to 11 June 2004, Paris, France. pp. 3323-3326. Available from:
<http://www.cres.gr/kape/publications/papers_synedria_photovol.htm>.
[4] G.A. Vokas, G. Glinou, ―Recent developments and perspectives of Photovoltaic
applications in Greece‖, ENERGYTEC, 1st
Energy Forum and Exhibition, HELEXPO,
Athens, Greece, November 2006.
[5] Operator of Electricity Market [online]. (2012). Available from:<
http://www.lagie.gr/en/guarantees-oforigin/statistics/>. [Accessed 14-7-2013].
[6] E.Thomopoulos, C.Protogeropoulos, J.Chadjivassiliadis, G.A. Vokas, ―National
Position Paper for the Improvement of the Regulatory, Frameworks, Support Schemes
and Monitoring, Systems for Photovoltaics in Greece‖, PV Policy Group, December
2006.
[7] International Energy Agency (2009). www.iea.org/[online]. Available from:
<http://www.iea.org/policiesandmeasures/pams/greece/name,39505,en.php>.
[Accessed 13-9-2013].
[8] PVSYST, 2010. User’s guide, PVsyst Contextual Help [online]. [Accessed 15-7-
2011]. Available from: <http://files.pvsyst.com/pvsyst5.pdf>.
[9] PVGIS European Communities, 2008. Global irradiation and solar electricity
potential. Map. At: Greece. Available from: < http://www.solaire.gr/energy.php>.


![Quantum teleportation with hybrid entangled resources ...arXiv:2002.03015v1 [quant-ph] 7 Feb 2020 Quantum teleportation with hybrid entangled resources prepared from heralded quantum](https://static.fdocuments.us/doc/165x107/5e8e9e14f5150f1b1c544401/quantum-teleportation-with-hybrid-entangled-resources-arxiv200203015v1-quant-ph.jpg)