The Supply of Lard in the United States: Its Extent and Distribution

Research ArticleExtent Distribution and Causes of Soil Acidity under SubsistenceFarming System and LimeRecommendation The Case inWolaitaSouthern Ethiopia
Fanuel Laekemariam 1 and Kibebew Kibret2
1Wolaita Sodo University Department of Plant Science PO Box 138 Wolaita Sodo Ethiopia2Haramaya University School of Natural Resources Management and Environmental Sciences PO Box 138Dire Dawa Ethiopia
Correspondence should be addressed to Fanuel Laekemariam laeke2005yahoocom
Received 27 February 2021 Revised 23 July 2021 Accepted 2 September 2021 Published 26 September 2021
Academic Editor Durgesh Jaiswal
Copyright copy 2021 Fanuel Laekemariam and Kibebew Kibret +is is an open access article distributed under the CreativeCommons Attribution License which permits unrestricted use distribution and reproduction in any medium provided theoriginal work is properly cited
Soil acidity is one of themost important environmental threats to the Ethiopian highlands where the livelihood of themajority of people isreliant on agriculture Yet information regarding its extent distribution causes and lime requirement at a scale relevant to subsistencefarming systems is still lacking+is study (1) investigates the extent and spatial distribution of soil acidity (2) identifies factors attributingto soil acidification and (3) predicts the lime requirement for major crops A total of 789 soil samples were collected from arable lands inthe Wolaita area which is mainly characterized by poor soil fertility and soil degradation in southern Ethiopia Results revealed that thelandscape is characterized by a gentle slope followed by strongly sloppygtflatgthilly topographies Clay is the dominant soil textural classA soil pH map which is generated using geospatial analysis demonstrates that 33 780 and 187 of the total area were under stronglyacidic moderately acidic and neutral soil reactions respectively +e exchangeable acidity (Cmol(+)kg) varied from nil to 51 whereasexchangeable Al ranged from 14 to 199 Cmol(+)kg +e soil pH has shown a significantly (plt0001) negative association with claycontent (r minus 033) exchangeable Al (r minus 61) exchangeable acidity (r minus 058) and inorganic fertilizer application (r minus 033) Increasedrates of diammonium phosphate (DAP) (r2 091) and urea (r2 088) markedly elevated soil acidity Conversely manuring showed asignificant (plt0001) and positive relationship with pH (r 037) in which the increasing rate of manure significantly reduced acid-ification (r2 098) DAP and urea applications above 75kgha lowered soil pH units by 056 and 048 respectively lt25kgha while at thesame time farmyard manure (FYM) at 4 tha raised pH by 075 units over the unfertilized field Residue management significantly(plt0001) influenced soil pH wherein it ranged from 609 (complete residue removal) to 661 (residue incorporation) Changes in landuse cropping intensity and socioeconomic status were also significantly attributed to soil acidification To curb the effects of soil aciditythe lime requirement for common bean growing fields varied from zero to 66 tha while for maize it was between zero and 43 tha It isconcluded that soil management interventions such as maintaining and incorporating crop residues integrated use of organic andinorganic fertilizers liming and enhancing farmersrsquo awareness should be advocated to overcome soil acidification and improve soilfertility In addition introducing crops with traits that tolerate acidity and Al toxicity is also suggested
1 Introduction
Crop plants need 17 kinds of nutrients to complete the lifecycle of that 14 nutrients should be present in the soil inadequate quantity and proportion for healthy plant growth[1] However the availability of nutrients is influenced bychemical reactions like acidity or alkalinity in the soil Soil
acidity and soil calcareousness are thought to be the twomajor crop production constraints considerably threateningthe global food production system and afterward food se-curity [2]
Agriculture plays the most important share in theEthiopian economy and therefore the sector heavily de-pends on soil About 43 of cultivated lands in Ethiopia
HindawiApplied and Environmental Soil ScienceVolume 2021 Article ID 5556563 9 pageshttpsdoiorg10115520215556563
where major staple food crops are grown are affected by soilacidity [3] +e realm might probably be larger because ofthe conversion of forest and grazing lands into arable landsas a result of fast human population increment and asso-ciated poor land management practices [4] +is signifies themagnitude of how soil acidification is threatening cropproduction and thus reducing food security particularly inthe Ethiopian highlands where the area is conducive for soilacidification processes [2 3]
Soil acidity resulted from a rise in the concentration ofhydrogen ions (H+) It should occur because of natural andhuman-induced processes Acid parent materials leaching ofbasic cations (calcium (Ca2+) magnesium (Mg2+) and po-tassium (K+)) hydrolysis reactions within the soil exchangesites rainfall containing sulphuric and nitric acids cationsuptake by the crop over the long run cultivation crop residueremoval and addition of soluble salts and fertilizers into thesoil (mineral and organic) would possibly cause soil acidifi-cation [3 5ndash7] In Ethiopia though the amount of inorganicfertilizers applied was in small doses (eg [8 9]) repeated useof urea (46N-0-0) and diammonium phosphate (DAP)(18Nndash46P2O5-0) over many years was reported as a favoringfactor for soil acidification in the Northwestern and South-western highlands of Ethiopia [10 11] In general soil acidityelevates aluminum (Al3+) concentration within the soil so-lution to a level of toxicity [5] limits the availability of es-sential plant nutrients and restricts crop performance [12]+is would imply that soil acidity and associated low nutrientavailability are among the major constraints toward attainingsustainable production and achieving food security +ere-fore investigating soil acidity mapping its extent andplanning applicable management techniques are fundamentalto realize sustainable levels of agricultural production
In Ethiopia agricultural production is irresistible ofsubsistence nature According to Gebissa [13] 97 ofEthiopian agricultural activities are constituted by subsis-tence farmers Subsistence farming is a form of farming inwhich nearly all of the crops or livestock raised are used tofeed the family Generally land degradation including soilacidity is a great threat to future agricultural production inthe country [2 3 13] Varied soil management practices thatfarmers apply into their field like the use of inorganic ororganic fertilizers [5 14 15] returning of crop residue intothe soil [3] and the practice of continues cropping overmono-cropping or crop rotation 16 10 influence soil acidityMeanwhile liming is the most widely used technique tocorrect soil acidity cut back phytotoxic levels of Al and Mnand lift soil pH to the amount that is appropriate formaximum nutrient availability plant growth and crop yield[12 15] Yet the amount of lime to mitigate soil aciditydepends on the acid tolerance level of the crop [10 17] levelof soil pH soil and the lime type and the farming method[18] However empirical evidence on soil acidity and at-tributing factors and also the lime needed to reclaim acidityfor subsistence farming system is lacking +erefore thisstudy (1) assesses the extent and spatial distribution of soilacidity (2) identifies the factors attributing to soil acidifi-cation and (3) suggests the lime needed for reclamation ofsoil acidity
2 Materials and Methods
21 StudyArea +e study was conducted in three districts ofthe Wolaita zone in Southern Ethiopia +e districts (DamotGale Damot Sore and Sodo Zuria) cover 84000 hectares(ha) of land located between 037deg35prime30Prime-037deg58prime36PrimeE and06deg57prime20Prime - 07deg04prime31PrimeN +e ten-year mean annual rainfalland temperature were 1355mm and 197degC respectively+e elevation ranges from 1473 to 2873meter above sea level(masl) +e predominant soils are Nitisols [19] Generallythe soil has an acidic reaction with varying degrees [16]
Rain-fed-based agriculture is the major source of live-lihood +e major grain crops include tef (Eragrostis tef(Zucc) Trotter) maize (Zea mays L) bread wheat (Triticumaestivum L) haricot bean (Phaseolus vulgaris L) and fieldpea (Pisum sativum L) +e root and tuber crops such assweet potato (Ipomoea batatas) taro (Colocasia esculenta)potato (Solanum tuberosum) and enset (Ensete ventricosum)are also widely cultivated +e surroundings of homesteadareas are used for perennial crops Continuous cultivationwithout fallowing is common in the area Farmers com-monly apply organic fertilizer sources for perennial cropswhile they used inorganic fertilizers for annual crops +einorganic fertilizers used at the time of study include urea(46N-0-0) and diammonium phosphate (DAP)(18Nndash46P2O5-0)
22 Soil Sampling and Laboratory Analysis
221 Soil Sampling and Preparation Procedure From thethree districts 789 surface soil samples were collected air-dried ground and sieved through a 2mm mesh +esampling points were geo-referenced using geographicalpositioning system (GPS) (model Garmin GPSMAP 60Cx)+e depth of sampling for grain crops was 0ndash20 cm while forperennial crops it extended up to 50 cm Depending ontopography and observed heterogeneity 10 to 15 subsampleswere taken to form a kilogram of the composite sample
222 Soil Analysis Soil samples were analyzed for pHexchangeable acidity (EA) exchangeable Al exchangeablebases (Ca Mg K and Na) and effective cation exchangecapacity (ECEC) Soil pH was measured using a pH meterwith a ratio of 1 25 soil to water [20] +e EA was de-termined by leaching with potassium chloride (KCl) fol-lowed by titrating with 002M HCl [21] Exchangeable basesand Al were determined using the Mehlich-3 method [22]and the concentration of elements was measured using aninductively coupled plasma (ICP) spectrometer +enECEC was computed as a summation of exchangeable bases(Ca Mg K and Na) plus EA
23 Estimation of Lime Requirement (LR) Haricot beanwheat and maize are major field crops grown in the studyarea +e crops have different acid tolerance levels and werepurposively selected for lime requirement (LR) estimation+eir LR was estimated based on Taye [17] as
2 Applied and Environmental Soil Science
LR 1600(EA minus (ECEClowast PAS)) (1)
where LR is the lime rate (tonha) EA is the exchangeableacidity (cmolc kgminus 1) ECEC is the effective cation exchangecapacity (cmolc kgminus 1) and PAS is the permissible acidsaturation for a specific type of crop ()
Crop tolerance level indicates the PAS that can be tol-erated by different crops [6] +e PAS used to calculate thelime requirement for major crops grown in Ethiopia was 5for beans 10 for most annual crops (eg wheat andbarley) and 20 for maize [10 17]
24 DigitalMapping of Soil Acidity and LR Point data of soilpH EA and LR were interpolated for unsampled locationsusing Ordinary Kriging +e semivariogram is representedin equation (24) [23]
c(h) 12n
1113944
n
n1Z Xi( 1113857 minus Z Xi + h( 11138571113858 1113859
2 (2)
where n is the number of pairs of sample points separated bythe distance h and Z (xi)rsquos are the value of the characteristicunder study at ith location (i 1 2 3 n)
25 Statistical Data Analysis +e data were subjected toanalysis of variance (ANOVA) with a one-way approachusing Statistix software version 80 Whenever significantdifferences (plt 005) were detected Tukeyrsquos HSD (TukeyrsquosHonestly Significant Difference) test was performed tocompare means Furthermore the data were evaluated usingdescriptive statistics and Pearsonrsquos correlation analysis +evalues of the coefficient of variation (CV) of soil propertieswere rated as low (lt20) moderate (20ndash50) and highlyvariable (gt50) [24] Geospatial analysis mapping and limerequirements were executed using GIS software (Arc Mapversion 1041)
3 Results and Discussion
31 Extent and Distribution of Soil Acidity Soil pH wasbetween 45 and 80 with a mean pH value of 613plusmn 039(Table 1) [25] It showed low variability (CVlt 20) Fromthe total sample size 21 were strongly acidic (pHlt 55)533 moderately acidic (56ndash65) 227 neutral (66ndash73)and 306 moderately alkaline (74ndash84) [25] +e ex-changeable acidity (Cmol (+)kg) based on the sampleobservation ranges from nil to 51 whereas exchangeable Alvaried from 14 to 199 with a mean value of 902 Cmol(+)kg (Table 1) Based on geospatial analysis 33 78 and187 of the total area were qualified under strongly acidic(lt55) moderately acidic (56ndash65) and neutral (66ndash73)respectively (Figure 1 [25] Figure 1(a)) Soil pH exhibited asignificantly (ple 0001) negative correlation with ex-changeable acidity (r minus 058) and exchangeable Al(r minus 067) (Table 2)
Crops have different abilities to tolerate acid soil con-ditions [3] Nonetheless crop production is restrained at pHvalues below 55ndash65 [26] Consequently the observed values
of soil pH exchangeable acidity and exchangeable Al coulddemonstrate the presence of certain influences on nutrientavailability [16] and crop productivity [3]
32 Factors in Relation to Soil Acidification
321 Landscape Characteristics and Soil TextureLandscape which is characterized by topographic positionelevation slope and aspect did not show a significant in-fluence on the soil pH (Table 3) However a declining trendin soil pH from flat toward hilly topographic position wasrecorded Elevation in the study area ranges between 1473and 2873masl where the area is predominantly charac-terized by mid-highland (1500ndash2300 masl) agroecology [9]+us its influence on microclimate and then soil reactionmay be limited +e slope is related to soil erosion anddeposition processes Yet the majority (68) of the studyarea is within flat to gentle slope conditions and hencesignificant variation in soil pHwas less recorded+e findingagrees with Melku et al [27] who reported a statisticallynonsignificant difference in soil pH between slope classesand landscape positions in Geshy subcatchment GojebRiver Catchment Ethiopia +e authors mentioned de-creasing trend of soil pH with increasing slope classesAspect is related to the amount of solar energy received bythe slope and affects plant growth and soil water content[28] +e area is predominantly characterized by flat-gentletopography and its influence on soil pH was not foundstatistically significant (pgt 005) (Table 3)
Soil texture significantly (plt 0001) influenced soil pH(Table 3)+e mean pH value ranged from 599 in clayey soilsto 646 in silt loam soils (Table 3) Clay particles are the mostactive portions determining the soilrsquos chemical activity +ereason for the lower soil pH could be attributed to the in-fluences of higher clay content on active exchangeable andreserve acidity +is is also supported by a significant(plt 0001) and negative relationship between soil pH withclay content (r minus 033) exchangeable Al (r minus 61) and ex-changeable acidity (r minus 059) In agreement Chalsissa et al[10] reported lower soil pH on clay soils due to a relativelyhigher concentration of exchangeable acidity +e authorsalso associated the lower pH with low soil OM content
322 Soil Management Practices Application of inorganicfertilizers containing nitrogen (N) and phosphorus (P) in theform of urea (46N-0-) and diammonium phosphate (DAP)(18Nndash46P2O5-0) application has long been started 50 yearsago in Ethiopia Fields continuously managed with inorganicfertilizer showed significantly (plt 0001) lower soil pH thanunfertilized fields (Table 4) Generally the amount of in-organic fertilizers applied to soil was less than the blanketdose [9] Yet pH decline was recorded at the increasing rateof DAP and urea fertilizers (Tables 2 and 4 Figures 2 and 3 )On average application of DAP and urea above 75 kghadecreased pH by 056 and 048 units respectively comparedto applications below 25 kgha Similarly research reportsfrom western Ethiopia [10] and northwestern Ethiopia [11]indicated that the application of DAP and urea fertilizers in
Applied and Environmental Soil Science 3
333000
7480
0076
0000
7720
0078
4000
7480
0076
0000
7720
0078
4000
344000 355000 366000 377000 388000 399000
333000 344000 355000 366000 377000 388000 399000
0 425 85 17 Km
41-55 (Strongly acidic)
56-65 (Moderatly acidic)
Soil pH 66-73 (Neutral)
Sodo town
N
(a)
345000
7300
0074
0000
7500
0077
0000
7800
0076
0000
7300
0074
0000
7500
0077
0000
7800
0076
0000
354000 363000 372000 381000
345000 354000 363000 372000 381000
Exchangeable Acidity (Cmol(+)kg)
0 - 05
051 - 1
11 - 16
Sodo town
N
0 4 8 16 Km
(b)
Figure 1 (a) Extent and spatial distribution of soil pH across the study site (b) Extent and spatial distribution of exchangeable acidity (Cmol(+)kg) across the study site
Table 2 Pearsonrsquos correlation matrix between soil pH and different factors in crop lands (N 674)
pH Altitude (masl) Slope () CI no Al Cmol(+) (kg) Ex Ac Cmol (+) (kg) FYM t (ha) DAP (kgha)Altitude 003ns
Slope 000 ns 049lowastlowastCrop intensity (CI) minus 016lowastlowast minus 002ns minus 013lowastlowastAl minus 067lowastlowast 005ns 015lowastlowast 008lowastEx Ac minus 058lowastlowast minus 010lowast minus 006ns 005ns 063lowastlowastFYM 037lowastlowast 003ns minus 005ns minus 023lowastlowast minus 025lowastlowast minus 015lowastlowastDAP minus 039lowastlowast minus 014lowastlowast minus 005 014lowastlowast 020lowastlowast 020lowastlowast minus 046lowastlowastUrea minus 010lowast minus 014lowastlowast minus 006ns minus 006ns minus 001ns 001ns minus 017lowastlowast 042lowastlowast
CI cropping intensity Al aluminum ExAc exchangeable acidity FYM farmyard manure DAPDiammonium phosphate nsnot significantlowastplt 005 lowastlowastplt 001
Table 3 Effects of topographic position and soil texture on the mean value of soil pH (n 789)
Topographic position and slope pH Textural class pHF (lt4) 613 (157) Silt loam 646a (148)GS (4ndash8) 611 (382) Silt clay 614 b (98)SL (8ndash16) 609 (162) Clay 599c (543)HI (gt16) 608 (88) p value lowastlowastlowast
p value NS mdashCV () 104 CV () 992F flat GS gentle slope SL strongly sloppy HI hilly Note Numbers in the bracket refer to sample size lowastlowastlowastplt 0001 Means in a column followed by thesame letters are not significantly different at 5 level of significance CV coefficient of variation NSnot significant
Table 1 Descriptive statistics of predicted values of soil properties for maps using geostatistical analysis (point sample 789)
Soil properties Unit Mean SD Min Max CV ()pH_ point observation 611 063 45 80 104pH_ after mapping mdash 613 039 502 728 60Ex Al_ point observation Cmol (+)kg 902 201 14 199 224Ex Acidity_ point observation Cmol (+)kg 032 083 000 512 257
4 Applied and Environmental Soil Science
cultivated fields resulted in soil acidification Indeed inor-ganic fertilizers have a considerable role in yield incrementYet in yield-making processes plants uptake more cationsthan anions to neutralize organic acid synthesized andconsequently more cations than anions are removed by cropwith grain and residue [5] +is induces acidification es-pecially when crop residues are removed from the croplandlike the study area [5 29] Additionally ammonia-basedfertilizers or other conditions that produce ammonia in thesoil liberate more protons than the amount consumedduring transformations processes within the soil and af-terward generate acidification [5]
Alternatively fields that have been continuously man-aged with farmyard manure (FYM) showed significantly(plt 0001) higher soil pH than untreated fields (Tables 2 and4 Figure 4) +e average pH unit increase due to farmyardmanure application at 4 tha over the unfertilized field was075 units (Figure 4) +e result regarding the incorporationof crop residue also followed a similar pattern of FYMapplication (Table 4) +is explains that the addition oforganic fertilizersretaining crop residue renders phytotoxiclevels of Al by forming organo-Al complexes and increasesthe pH [3] Manure application due to its high base cationconcentrations alleviates acidification [14]
323 Land-Use Type Cropping Intensity and ContinuousCropping Statistically significant differences in soil pH wererecorded among land-use types (Table 5) +e average pH
unit decline between the maximum (enset field) and theminimum (grassland) was 122 units followed by 091 units(main croplands) (Figure 5) +e impact of land use on soilacidification depends on how it affects proton fluxes [5]Comparing enset fields versus main fieldgrasslands thelatter is more acidified +is was because of variable man-agement practices Management practices like organicfertilization are common on enset fields than cereal andlegume growing fields that were managed with inorganicfertilizers and rotation Additionally legumes grown as sole
Table 4 Effects of fertilizer types and crop residue management on soil pH
Field managementFertilizer types
Crop residue status pHDAP Urea FYM
Unfertilized 624a (399) 611 (687) 596b (621) Removed 609b (758)Fertilized 597 b (390) 606 (102) 666a (168) Maintained 661a (31)p value lowastlowastlowast NS lowastlowastlowast p value lowastlowastlowast
CV () 1018 1042 93 CV () 103Note Numbers in the bracket refer to sample size lowastlowastlowastplt 0001 Means in a column followed by the same letters are not significantly different at 5 level ofsignificance CV coefficient of variation NSnot significant
624
607602
568R2 = 091
550
560
570
580
590
600
610
620
630
0-25 (407) 26-50 (155) 51-75 (141) gt 75 (86)
Soil
pH
DAP (kgha) (No of samples)
P lt 0001CV ()=1004
pHLinear (pH)
y = -01728x + 64343
Figure 2 pH level on crop fields with different rates of DAPfertilizer
pHLinear (pH)
612611
591
564
550
560
570
580
590
600
610
620
0-25 (696) 26-50 (70) 51-75 (14) gt 75 (9)So
il pH
Urea (kgha) (No of samples)
y = -0164x + 6355R2 = 088
P=009CV ()=104
Figure 3 pH level on crop fields with different rates of ureafertilizer
596
658669 671
570
590
610
630
650
670
0 (621) 01 -20 (58) 21-40 (78) gt 40 (32)
Soil
pH
FYM (tha) (No of Samples)
pHPoly (pH)
plt0006CV ()=93
y = -015x2+ 0986x + 5145R2 = 098
Figure 4 pH level on crop fields that received different rates offarmyard manure
Applied and Environmental Soil Science 5
and intercrop in the main field uptake excess cation toneutralize the carboxylic groups of amino acids duringsynthesis [5] +is together with the above-mentionedmanagement practices might acidify main fields more thanensetcoffee fields
Cropping intensity refers to growing a number of crops inthe same field continuously during one agriculture year +eresult indicated that soil pH was significantly affected bycropping intensity (Table 5) Growing two successive crops ina year in the same field decreased soil pH more than mono-cropping did Plants uptake more cations than anions toneutralize organic acid synthesized It implies that the uptakewould become more under continuous cultivation [9] +ismay result in soil pH reduction In agreement with thisTesfaye et al [30] reported pH decline under continuouscultivation In the study area farmers grow two successivecrops by rotation Cereals are often rotated with legumes androot crops [9] According to Viera et al [31] leguminousspecies increased soil acidification attributed to the incrementin the removal of alkaline plant material by grain yield
324 Farmers Perspective Local Soil Types and Socioeco-nomic Status Farmers in the study area have a tradition toclassify soils and apply localized management accordingly+ey used holistic approaches such as soil color
permeability water retention capacity workability and soilfertility as assessed qualitatively +e details of perceived soilcharacteristics are found in Fanuel et al [9] Soil pH in viewof farmersrsquo soil nomenclature varied from 56 (Zorsquoo bita) to64 (Arrada bita) (Table 6 Figure 6) Zorsquoo bita literally is redcolored and nonfertile soil Subsequently farmers relativelyapply higher amounts of inorganic fertilizer compared toArrada bita (fertile soil) [9] Zorsquoo bita has a higher clayfraction (71) than Arrada bita (45) and its pH declinedsignificantly plt 0001) with an increase of clay proportion(r minus 033)
In most cases farmers apply home left wastes particu-larly wood ash and animal wastes into Arrada bita as it ismostly situated close to homestead +is might improve soilorganic matter and base cations and finally end with higherpH compared to soils located on distant fields (eg Zorsquoo bitaLada Bita Chere Bita) which are mostly subjected tocomplete crop residue removal and inorganic fertilizer useIn agreement Yihenew et al [11] reported acidic soil re-action in cultivated fields due to depletion of basic cationsthrough crop harvest and continuous use of urea and DAP[(NH4)2HPO4] fertilizers In line with this decreased soil pHfrom home fields to remote fields mostly due to differences
698a (15)673a (55)
614b(134)607b(470) 605bc (11)
576c (104)
500
550
600
650
700
750
Enset Coffee RTV CP Fallow Grass
Soil
pH
LUT
P lt 0001CV () = 97
y = -02349x + 71112R2 = 089
pHLinear (pH)
Figure 5 Soil pH along with different land-use types (notenumbers in the bracket refer to sample size) RTV root tuber andvegetable crop field CP crop field
Table 5 Field position and cropping intensity effects on the meanvalue of soil pH (N 789)
Field position pH Cropping intensity pHH 677a (104) One 631a (254)M 637b (119) Two 606b (395)D 593c (566) mdash mdashp value 00005 p value 00001CV () 92 CV () 103H homestead field Mmiddle field D distant field Note numbers inthe bracket refer to sample size lowastlowastlowastplt 0001 Means in a column followedby the same letters are not significantly different at 5 level of significanceCV coefficient of variation
Table 6 Soil pH level under farmersrsquo soil types and on fields ownedby farmers with different wealth statuses
Soil type pH Wealth pHArrada Bita 645a (261) Poorrsquos_ field 625a (143)Talla Bita 624b (94) Medium_ field 611b (423)Kereta Bita 617bc (27) Rich_ field 606b (161)Lada Bita 597cd (149) p value 00268Gobo Bita 589de (118) CV () 105Chere Bita 576ef (48)Zorsquoo Bita 560f (92)p value 00006CV () 92 105lsquoBitarsquo literally means soil Numbers in parenthesis indicate the sample sizeNote numbers in the bracket refer to sample size lowastlowastlowastplt 0001 Means in acolumn followed by the same letters are not significantly different at 5level of significance CV coefficient of variation
645624
617589 597
576560
500520540560580600620640660
AredaBita
TallaBita
KeretaBita
GoboBita
LadaBita
ChereBita
ZooBita
Soil
pH
Farmers Soil Type
y = -01318x + 65399R2= 095
pHLinear (pH)
Figure 6 Soil pH along farmerrsquos named soil types
6 Applied and Environmental Soil Science
in input levels was reported by Chikowo et al [32] +isfinding implies that understanding farmersrsquo soil typologycould be useful for site-specific soil pH and nutrientmanagement strategies
Soil pH on the resource-poor farmersrsquo field was signifi-cantly higher than the other wealthy groups (Table 6) Re-source-poor farmers own less land than wealthy farmers anduse a range of other sources of nutrients such as compost cropresidues and leaf litter compared to richer farmers who usemineral fertilizer [33] +e author also described that richerfarmers produce more manure mainly because they havelarger herds However in terms of the amount being appliedper unit of land resource-poor farmers apply more manureper hectare because they only cultivate very small areas +ismight have caused higher soil pH on resource-poor fields
Despite the fact that poor farmers have little access toorganic and inorganic nutrient sources their land is beingmanaged with better care to get more produce from it Onthe contrary wealthier farmers have a better land size andcontinuously cultivate under relatively higher applicationrates of inorganic fertilizer
33 Estimating Lime Requirement From the total area2772 ha was strongly acidic (lt55) whereas 65520 ha wasmoderately acidic (56ndash65) suggesting the need for site-specific management in order to correct soil acidity Liming
is widely considered a major option to manage soil acidityand sustaining food production It is a quick and effectiveway to neutralize acidity especially in highly acidic soils[29] In addition the growth of relatively acid-tolerant cropvarieties on slightly acid soils is also suggested +eremaining 15708 ha of the study area does not require lime
+e amount of lime estimated based on permissible acidsaturation (PAS) level for the respective crops is presented inFigures 7ndash9 It was noted that lime requirement (LR) acrosslandscapes varied depending on exchangeable acidity ex-changeable Al and soil pH +is was substantiated by thehighly significant correlation (r 099 096 088lowastlowastlowast) be-tween exchangeable acidity and LR at 5 PAS 10 PAS and20 PAS respectively +e correlation between exchange-able Al and LR was also significantly positive at 5 PAS(r 062lowastlowastlowast) 10 PAS (r 059lowastlowastlowast) and 20 PAS(r 052lowastlowastlowast) +e correlation matrix for soil pH also showeda highly significant but negative relation with LR at 5 PAS(r minus 054lowastlowastlowast) 10 PAS (r minus 050lowastlowastlowast) and 20 PAS(r minus 043lowastlowastlowast) +e strong spatial dependence of LR forsemivariograms in all PAS computation also strengthens theearlier statements (Appendix Table 1)
It was estimated that the amount of lime required toneutralizing acidity on common bean fields varied from zeroto 66 tha (Figure 7) while for maize it was between zeroand 43 tha (Figure 8) Farmers under strongly acidic soils
7400
0075
0000
7700
0078
0000
7600
00
350000 360000 370000 380000
350000 360000 370000 380000
7900
00
7400
0075
0000
7700
0078
0000
7600
0079
0000
0 35 7 14 Km
11 - 1516 - 2
21 - 66
Sodo town
LR_Haricot bean (tha)No lime
051 - 1
001 - 05
N
Figure 7 Extent and spatial distribution of lime requirement (tha)for legume (Haricot bean) production across the study site
7500
0077
0000
7800
0076
0000
345000 354000 363000 372000 381000
345000 354000 363000 372000 381000
11 - 1516 - 2
21 - 43
Sodo town
LR_Malze (tha)No lime
051 - 1
001 - 05
7400
0079
0000
7400
0075
0000
7700
0078
0000
7600
0079
0000N
0 35 7 14 Km
Figure 8 Extent and spatial distribution of lime requirement (tha)for maize production across the study site
Applied and Environmental Soil Science 7
regardless of crop types are advised to apply a maximum of64 t limeha (Figure 9) Nevertheless soil test-based ad-justment prior to a lime application every year is also rec-ommended In addition it should be stressed that limingcannot stand on its own to increase crop productivityrather it guarantees higher yield when used with an ade-quate and balanced supply of crop limiting nutrientsNonetheless liming may not be practical for resource-poorfarmers due to supply shortages or high labor and monetarycosts +us integrating chemical fertilizer with manure andencouraging farmers to retainincorporate residue to sig-nificantly alleviate soil acidification are relevant [29]
4 Conclusion
Soil acidity is identified as one of the most importantconstraints to crop production However the magnitudeand extent of acidity are location-specific which suggests theneed to have site-specific management In the study areawhere environmental and landscape characteristic systemsare mostly similar soil acidification is attributed to inherentand human-induced factors Amount of clay fertilizer typeland use management practices and socioeconomic con-ditions contributed to soil acidity Liming is suggested as aneffective way to counteract soil acidification and improvecrop yields Accordingly the digital mapping indicated site-crop-specific lime rates in which the amount varies based on
the acid sensitivity of the crops Smallholder farmers have tobe encouraged to return crop residue and integrate chemicalfertilizer with manure in order to reduce the impacts of soilacidity In addition introducing crops with traits that tol-erate both acidity and Al toxicity is suggested Finally limingalone cannot be a complete solution to increase crop yield+us it has to be integrated with an adequate and balancedsupply of crop limiting nutrients
Data Availability
+e data used to support the findings of this study areavailable from the corresponding author upon request
Conflicts of Interest
+e authors declare that there are no conflicts of interest
Authorsrsquo Contributions
All the authors collected analyzed interpreted and pre-pared the manuscript
Acknowledgments
+e authors are grateful to the Ministry of Education (MOE)and now the Ministry of Science and Higher Education(MoSHE) and Ethiopian Soil Information System (EthioSIS)at the Agricultural Transformation Agency (ATA) for fi-nancial support
Supplementary Materials
Appendix 1 model performance and semivariogram char-acteristics of soil properties of the study area (SupplementaryMaterials)
References
[1] N K Fageria M P B Filho A Moreira andC M Guimaratildees ldquoFoliar fertilization of crop plantsrdquo Journalof Plant Nutrition vol 32 no 6 pp 1044ndash1064 2009
[2] M B Hossain M H R Khan S Khanom and S A ShahidAkhtar Hossain ldquoAmelioration of soil acidity by the appli-cation of maize straw ash in mixed soilrdquo Dhaka UniversityJournal of Biological Sciences vol 30 no 2 pp 207ndash219 2021
[3] G Agegnehu C Yirga and andT Erkossa ldquo(EIAR) Addisababa Ethiopiardquo Soil Acidity Management Ethiopian Insti-tute of Agricultural Research 2019
[4] B Gurmessa Soil Acidity Challenges and the Significance ofLiming and Organic Amendments in Tropical AgriculturalLands with Reference to Ethiopia Environment Developmentand Sustainability Addis ababa Ethiopia 2020
[5] R Alvarez A Gimenez F Pagnanini et al ldquoSoil acidity in theArgentine Pampas effects of land use and managementrdquo Soiland Tillage Research vol 196 Article ID 104434 2020
[6] B Iticha and C Takele ldquoDigital soil mapping for site-specificmanagement of soilsrdquo Geoderma vol 351 pp 85ndash91 2019
[7] J L Havlin S L Tisdale W L Nelson and J D Beaton SoilFertility and Fertilizers An Introduction to Nutrient Man-agement Pearson Uper Sadle River NJ 2014
345000 354000 363000 372000 381000 390000
345000 354000 363000 372000 381000 390000
11 - 1516 - 2
21 - 64
Sodo town
LR_Most Crops (tha)No lime
051 - 1
001 - 05
7400
0076
0000
7700
0075
0000
7800
00
7400
0076
0000
7700
0075
0000
7300
0078
0000
N
0 4 8 16 Km
Figure 9 Extent and spatial distribution of lime requirement (tha)for most annual crops production across the study site
8 Applied and Environmental Soil Science
[8] E Eyasu P F Okoth and EM A Smaling ldquoExplaining breadwheat (Triticum aestivum) yield differences by soil propertiesand fertilizer rates in the highlands of Ethiopiardquo Geodermavol 339 pp 126ndash133 2019
[9] F Laekemariam K Kibret T Mamo and E KarltunldquoPhysiographical characteristics of agricultural land andfarmersrsquo soil fertility management practice in Wolaita ZoneSouthern Ethiopiardquo Environmental System Research vol 5p 24 2016
[10] C Takele B Iticha and G Sori ldquoIndexrdquo =e Anabasis ofCyrus vol 18 no 5 pp 275ndash281 2018
[11] Y Gebreselassie F Anemut and A Solomon ldquo+e effects ofland use types management practices and slope classes onselected soil physico-chemical properties in Zikre watershedNorth-Western Ethiopiardquo Springer Open Journal Environ-mental Systems Research vol 4 no 3 pp 1ndash7 2015
[12] N K Fageria and V C Baligar ldquoChapter 7 Ameliorating SoilAcidity of Tropical Oxisols by Liming For Sustainable CropProductionrdquo Advances in Agronomy vol 99 pp 345ndash3992008
[13] G Y Wendimu ldquo+e challenges and prospects of EthiopianAgriculturerdquo Cogent Food and Agriculture vol 7 p 19236192021
[14] A P Martins S E V G Andrade Costa I Anghinoni et alldquoSoil acidification and basic cation use efficiency in an inte-grated no-till crop-livestock system under different grazingintensitiesrdquo Agriculture Ecosystems amp Environment vol 195pp 18ndash28 2014
[15] S Getaneh and W Kidanemariam ldquoSoil acidity and itsmanagements a reviewrdquo International Journal of AdvancedResearch in Biological Sciences vol 8 no 3 pp 70ndash79 2021
[16] F Laekemariam and K Kibret ldquoExplaining soil fertilityheterogeneity in smallholder farms of southern EthiopiardquoApplied and Environmental Soil Science 2020
[17] T Bekele ldquoEstimation of lime requirementrdquo in TrainingManual for Regional SoilTesting Laboratory Heads andTechniciansNational soil Testing Center Ministry of Agri-culture and Rural Development Addis Ababa Ethiopia 2008
[18] K W T Goulding ldquoSoil acidification and the importance ofliming agricultural soils with particular reference to theUnited Kingdomrdquo Soil Use and Management vol 32 no 3pp 390ndash399 2016
[19] B Tesfaye Understanding farmers Explaining soil and waterconservation in Konso Wolaita and Wollo Ethiopia PhD+esis Wageningen University and Research CenterWageningen +e Netherlands 2003
[20] R Mylavarapu UFIFAS Extension Soil Testing Laboratory(ESTL) Analytical Procedures and Training Manual 2009
[21] S Sahlemedhin and B Taye ldquoProcedures for soil and plantanalysisrdquo National Soil Research Center Ethiopian Agricul-tural Research Organization Addis Abeba Ethiopia Tech-nical Paper 74 2000
[22] A Mehlich ldquoMehlich III soil test extractant a modification ofMehlich II extractantrdquo Communications in Soil Science andPlant Analysis vol 15 pp 1409ndash1416 1984
[23] C Costa E M Papatheodorou N Monokrousos andG P Stamou ldquoSpatial variability of soil organic C inorganicN and extractable P in a Mediterranean grazed areardquo LandDegradation amp Development vol 26 no 2 pp 103ndash109 2015
[24] U A Amuyou E B Eze P A Essoka J Efiong andO O Egbai ldquoSpatial variability of soil properties in the ObuduMountain region of southeastern Nigeriardquo InternationalJournal of Humanities and Social Science vol 3 no 15pp 145ndash149 2013
[25] EthioSIS Soil Fertility Status and Fertilizer RecommendationAtlas for Tigray Regional State Ethiopia EthioSIS Addisababa Ethiopia 2014
[26] J Holland P White M Glendining K Goulding andS McGrath ldquoYield responses of arable crops to liming-Anevaluation of relationships between yields and soil pH from along-term liming experimentrdquo European Journal of Agron-omy vol 105 pp 176ndash188 2019
[27] M Dagnachew A Moges and A Kebede ldquoEffects of soil andwater conservation measures on soil quality indicators thecase of Geshy subcatchment Gojeb River catchmentEthiopiardquo Applied and Environmental Soil Science vol 2020Article ID 1868792 16 pages 2020
[28] H Zhu Y Zhao F Nan Y Duan and R Bi ldquoRelative in-fluence of soil chemistry and topography on soil availablemicronutrients by structural equation modelingrdquo Journal ofSoil Science and Plant Nutrition vol 16 no 4 2016
[29] Q Zhu X Liu T Hao et al ldquoCropland acidification increasesrisk of yield losses and food insecurity in Chinardquo Environ-mental Pollution vol 256 Article ID 113145 2020
[30] W Tesfaye K Kibebew B Bobe T Melesse and E TekluldquoLong term effects of cultivation on physicochemical prop-erties of soils at metahara sugar estaterdquo American-eurasianJournal of Agricultural amp Environmental Sciences vol 18no 5 pp 246ndash257 2018
[31] F C B Viera C Bayer J Mielniczuk J Zanatta andC A Bissari ldquoLong-term acidification of a Brazilian Acrisol asaffected by no till cropping systems and nitrogen fertilizerrdquoAustralian Journal of Soil Research vol 46 pp 17ndash26 2008
[32] R Chikowo S Zingore S Snapp and A Johnston ldquoFarmtypologies soil fertility variability and nutrient managementin smallholder farming in Sub-Saharan Africardquo NutrientCycling in Agroecosystems vol 100 no 1 pp 1ndash18 2014
[33] E Elias ldquoSoil enrichment and depletion in southern Ethio-piardquo in Nutrients on the MovendashSoil Fertility Dynamics inAfrican Farming Systems T Hilhorst and F M MuchenaEds pp 65ndash82 International Institute for Environment andDevelopment London 2000
Applied and Environmental Soil Science 9
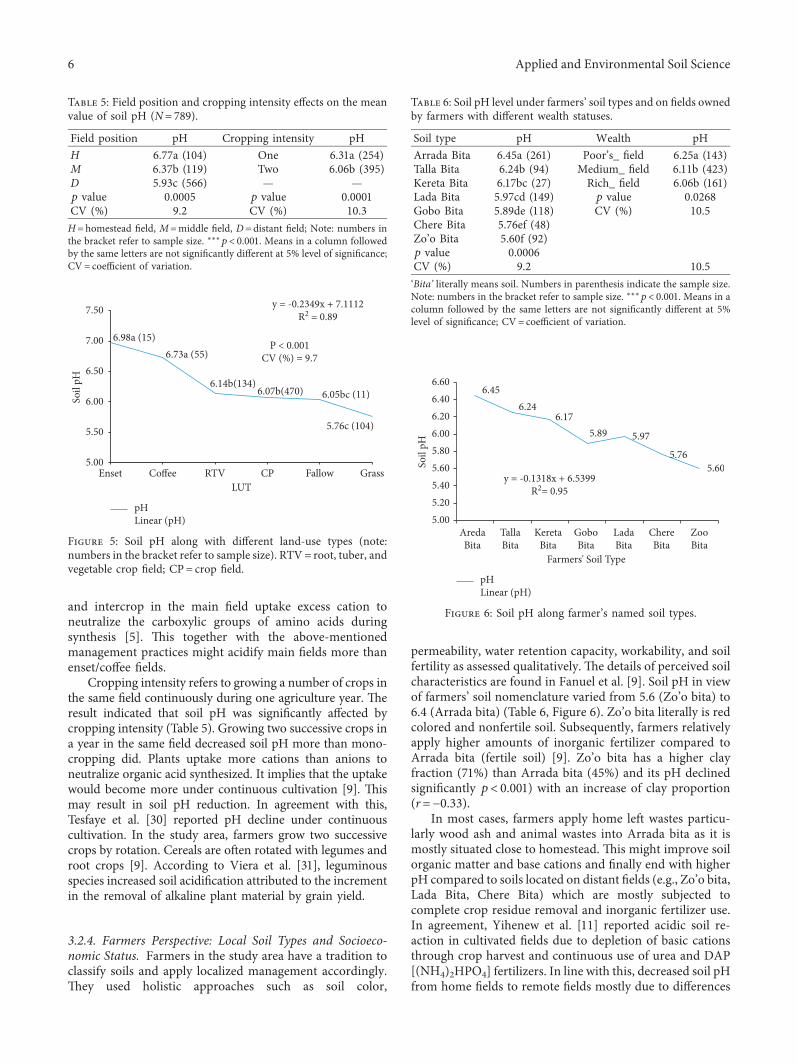
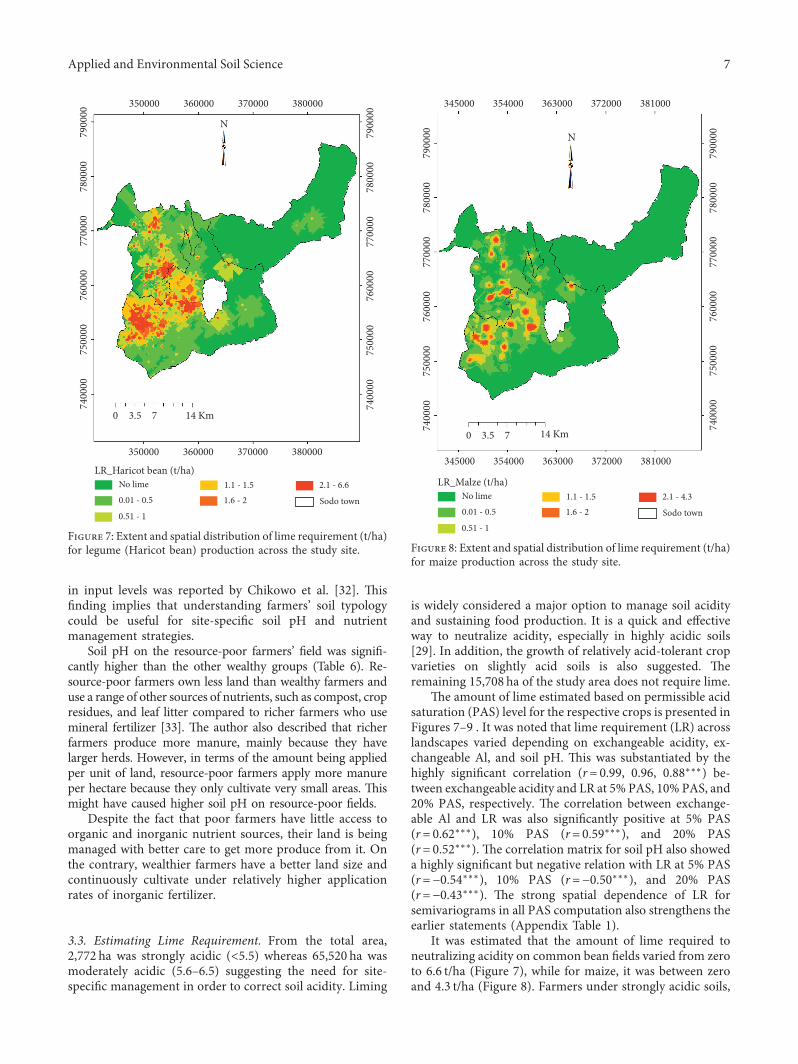
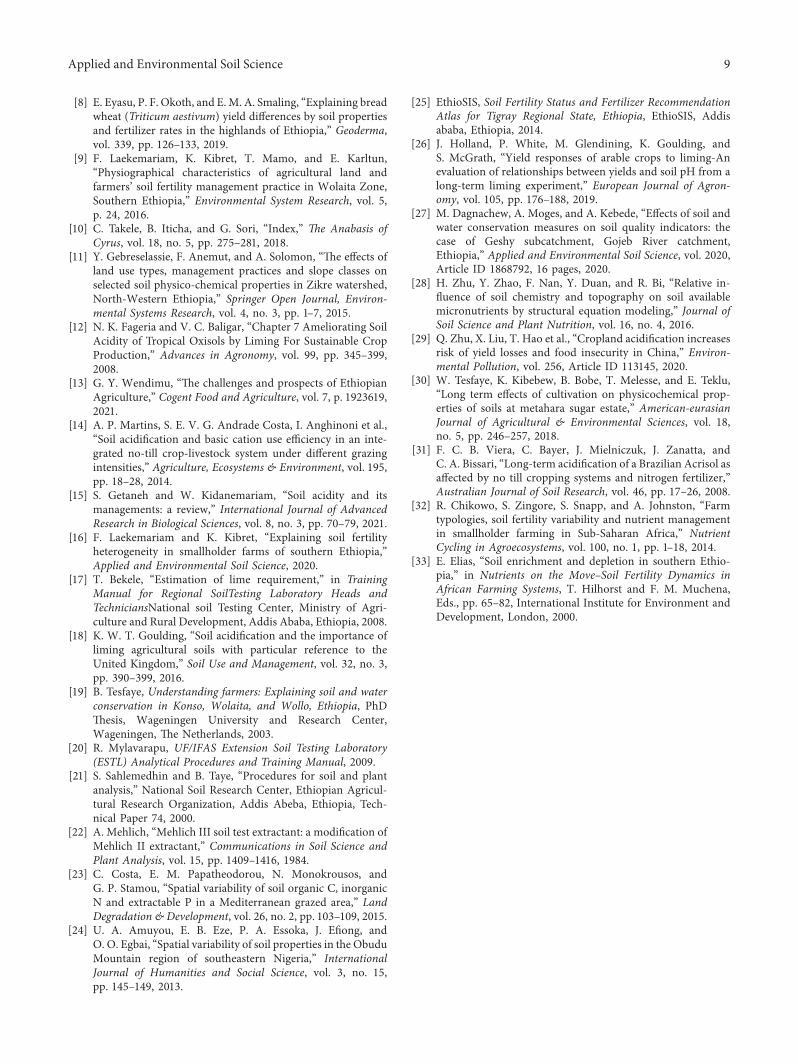