Extension and stress during continental breakup: Seismic ... · measurements of seismic anisotropy...
12
Illsley-Kemp, F., Savage, M. K., Keir, D., Hirschberg, H. P., Bull, J. M., Gernon, T. M., Hammond, J. O. S., Kendall, J. -M., Ayele, A., & Goitom, B. (2017). Extension and stress during continental breakup: Seismic anisotropy of the crust in Northern Afar. Earth and Planetary Science Letters, 477, 41- 51. https://doi.org/10.1016/j.epsl.2017.08.014 Publisher's PDF, also known as Version of record License (if available): CC BY Link to published version (if available): 10.1016/j.epsl.2017.08.014 Link to publication record in Explore Bristol Research PDF-document This is the final published version of the article (version of record). It first appeared online via Elsevier at https://doi.org/10.1016/j.epsl.2017.08.014. Please refer to any applicable terms of use of the publisher. University of Bristol - Explore Bristol Research General rights This document is made available in accordance with publisher policies. Please cite only the published version using the reference above. Full terms of use are available: http://www.bristol.ac.uk/pure/user- guides/explore-bristol-research/ebr-terms/
Transcript of Extension and stress during continental breakup: Seismic ... · measurements of seismic anisotropy...
Illsley-Kemp, F., Savage, M. K., Keir, D., Hirschberg, H. P., Bull, J. M.,Gernon, T. M., Hammond, J. O. S., Kendall, J. -M., Ayele, A., & Goitom, B.(2017). Extension and stress during continental breakup: Seismic anisotropyof the crust in Northern Afar. Earth and Planetary Science Letters, 477, 41-51. https://doi.org/10.1016/j.epsl.2017.08.014
Publisher's PDF, also known as Version of record
License (if available):CC BY
Link to published version (if available):10.1016/j.epsl.2017.08.014
Link to publication record in Explore Bristol ResearchPDF-document
This is the final published version of the article (version of record). It first appeared online via Elsevier athttps://doi.org/10.1016/j.epsl.2017.08.014. Please refer to any applicable terms of use of the publisher.
University of Bristol - Explore Bristol ResearchGeneral rights
This document is made available in accordance with publisher policies. Please cite only the publishedversion using the reference above. Full terms of use are available: http://www.bristol.ac.uk/pure/user-guides/explore-bristol-research/ebr-terms/

Earth and Planetary Science Letters 477 (2017) 41–51
Contents lists available at ScienceDirect
Earth and Planetary Science Letters
www.elsevier.com/locate/epsl
Extension and stress during continental breakup: Seismic anisotropy of
the crust in Northern Afar
Finnigan Illsley-Kemp a,∗, Martha K. Savage b, Derek Keir a,c, Hamish P. Hirschberg b, Jonathan M. Bull a, Thomas M. Gernon a, James O.S. Hammond d, J.-Michael Kendall e, Atalay Ayele f, Berhe Goitom e
a National Oceanography Centre Southampton, University of Southampton, Southampton, United Kingdomb Institute of Geophysics, Victoria University of Wellington, Wellington, New Zealandc Dipartimento di Scienze della Terra, Università degli Studi di Firenze, Florence, Italyd Department of Earth and Planetary Sciences, Birkbeck, University of London, London, United Kingdome School of Earth Sciences, University of Bristol, Bristol, United Kingdomf Institute of Geophysics, Space Science and Astronomy, Addis Ababa University, Addis Ababa, Ethiopia
a r t i c l e i n f o a b s t r a c t
Article history:Received 19 May 2017Received in revised form 2 August 2017Accepted 9 August 2017Available online xxxxEditor: R. Bendick
Keywords:Afarseismic anisotropycontinental riftingcrustal stress
Studies that attempt to simulate continental rifting and subsequent breakup require detailed knowledge of crustal stresses, however observational constraints from continental rifts are lacking. In addition, a knowledge of the stress field around active volcanoes can be used to detect sub-surface changes to the volcanic system. Here we use shear wave splitting to measure the seismic anisotropy of the crust in Northern Afar, a region of active, magma-rich continental breakup. We combine shear wave splitting tomography with modelling of gravitational and magmatic induced stresses to propose a model for crustal stress and strain across the rift. Results show that at the Ethiopian Plateau, seismic anisotropy is consistently oriented N–S. Seismic anisotropy within the rift is generally oriented NNW–SSE, with the exception of regions north and south of the Danakil Depression where seismic anisotropy is rift-perpendicular. These results suggest that the crust at the rift axis is characterized by rift-aligned structures and melt inclusions, consistent with a focusing of tectonic extension at the rift axis. In contrast, we show that at regions within the rift where extension rate is minimal the seismic anisotropy is best explained by the gravitationally induced stress field originating from variations in crustal thickness. Seismic anisotropy away from the rift is controlled by a combination of inherited crustal structures and gravitationally induced extension whereas at the Dabbahu region we show that the stress field changes orientation in response to magmatic intrusions. Our proposed model provides a benchmark of crustal stress in Northern Afar which will aid the monitoring of volcanic hazard. In addition we show that gravitational forces play a key role in measurements of seismic anisotropy, and must be considered in future studies. We demonstrate that during the final stages of continental rifting the stress field at the rift axis is primarily controlled by tectonic extension, but that gravitational forces and magmatic intrusions can play a key role in the orientation of the stress field.
© 2017 The Author(s). Published by Elsevier B.V. This is an open access article under the CC BY license (http://creativecommons.org/licenses/by/4.0/).
1. Introduction
The transition from continental rifting to seafloor spreading is a fundamental stage of plate tectonics; yet the mechanisms behind it have remained poorly constrained. Many studies which attempt to understand continental rifting have used numerical models (e.g., Brune et al., 2016); analogue models (Corti et al., 2003) or re-
* Corresponding author.E-mail address: [email protected] (F. Illsley-Kemp).
http://dx.doi.org/10.1016/j.epsl.2017.08.0140012-821X/© 2017 The Author(s). Published by Elsevier B.V. This is an open access artic
constructions of rifted passive margins (e.g., Pindell et al., 2014). Such studies require an understanding of how extension and stress are oriented across a continental rift. In recent years, studies have shown that extension migrates away from rift margins and fo-cuses at rift axes through magmatically accommodated extension (Ebinger et al., 2013). However, the orientation of extension from rift margin to rift axis in the final stages of continental breakup remains poorly constrained. In addition, continental rifts typically host considerable volcanic activity that threatens local populations (e.g., Hutchison et al., 2016). The stress field that acts on a vol-cano has a profound effect on the orientation of fissure eruptions
le under the CC BY license (http://creativecommons.org/licenses/by/4.0/).
42 F. Illsley-Kemp et al. / Earth and Planetary Science Letters 477 (2017) 41–51
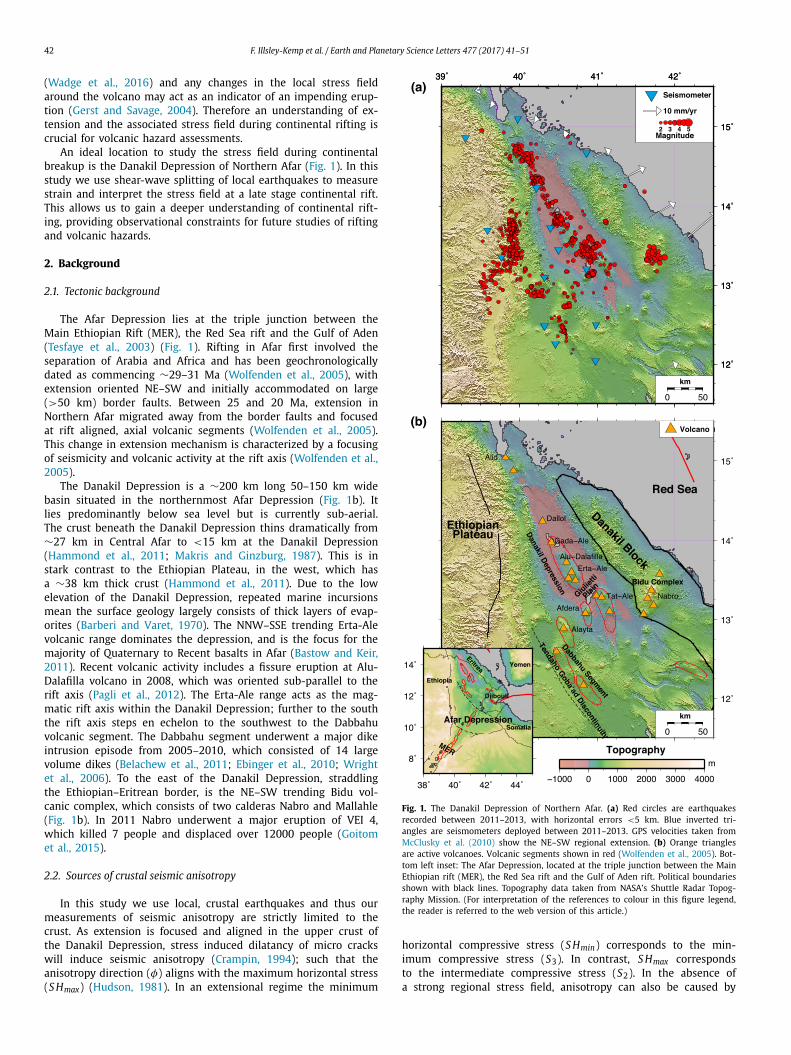
(Wadge et al., 2016) and any changes in the local stress field around the volcano may act as an indicator of an impending erup-tion (Gerst and Savage, 2004). Therefore an understanding of ex-tension and the associated stress field during continental rifting is crucial for volcanic hazard assessments.
An ideal location to study the stress field during continental breakup is the Danakil Depression of Northern Afar (Fig. 1). In this study we use shear-wave splitting of local earthquakes to measure strain and interpret the stress field at a late stage continental rift. This allows us to gain a deeper understanding of continental rift-ing, providing observational constraints for future studies of rifting and volcanic hazards.
2. Background
2.1. Tectonic background
The Afar Depression lies at the triple junction between the Main Ethiopian Rift (MER), the Red Sea rift and the Gulf of Aden (Tesfaye et al., 2003) (Fig. 1). Rifting in Afar first involved the separation of Arabia and Africa and has been geochronologically dated as commencing ∼29–31 Ma (Wolfenden et al., 2005), with extension oriented NE–SW and initially accommodated on large (>50 km) border faults. Between 25 and 20 Ma, extension in Northern Afar migrated away from the border faults and focused at rift aligned, axial volcanic segments (Wolfenden et al., 2005). This change in extension mechanism is characterized by a focusing of seismicity and volcanic activity at the rift axis (Wolfenden et al., 2005).
The Danakil Depression is a ∼200 km long 50–150 km wide basin situated in the northernmost Afar Depression (Fig. 1b). It lies predominantly below sea level but is currently sub-aerial. The crust beneath the Danakil Depression thins dramatically from ∼27 km in Central Afar to <15 km at the Danakil Depression (Hammond et al., 2011; Makris and Ginzburg, 1987). This is in stark contrast to the Ethiopian Plateau, in the west, which has a ∼38 km thick crust (Hammond et al., 2011). Due to the low elevation of the Danakil Depression, repeated marine incursions mean the surface geology largely consists of thick layers of evap-orites (Barberi and Varet, 1970). The NNW–SSE trending Erta-Ale volcanic range dominates the depression, and is the focus for the majority of Quaternary to Recent basalts in Afar (Bastow and Keir, 2011). Recent volcanic activity includes a fissure eruption at Alu-Dalafilla volcano in 2008, which was oriented sub-parallel to the rift axis (Pagli et al., 2012). The Erta-Ale range acts as the mag-matic rift axis within the Danakil Depression; further to the south the rift axis steps en echelon to the southwest to the Dabbahu volcanic segment. The Dabbahu segment underwent a major dike intrusion episode from 2005–2010, which consisted of 14 large volume dikes (Belachew et al., 2011; Ebinger et al., 2010; Wright et al., 2006). To the east of the Danakil Depression, straddling the Ethiopian–Eritrean border, is the NE–SW trending Bidu vol-canic complex, which consists of two calderas Nabro and Mallahle (Fig. 1b). In 2011 Nabro underwent a major eruption of VEI 4, which killed 7 people and displaced over 12000 people (Goitom et al., 2015).
2.2. Sources of crustal seismic anisotropy
In this study we use local, crustal earthquakes and thus our measurements of seismic anisotropy are strictly limited to the crust. As extension is focused and aligned in the upper crust of the Danakil Depression, stress induced dilatancy of micro cracks will induce seismic anisotropy (Crampin, 1994); such that the anisotropy direction (φ) aligns with the maximum horizontal stress (S Hmax) (Hudson, 1981). In an extensional regime the minimum
Fig. 1. The Danakil Depression of Northern Afar. (a) Red circles are earthquakes recorded between 2011–2013, with horizontal errors <5 km. Blue inverted tri-angles are seismometers deployed between 2011–2013. GPS velocities taken from McClusky et al. (2010) show the NE–SW regional extension. (b) Orange triangles are active volcanoes. Volcanic segments shown in red (Wolfenden et al., 2005). Bot-tom left inset: The Afar Depression, located at the triple junction between the Main Ethiopian rift (MER), the Red Sea rift and the Gulf of Aden rift. Political boundaries shown with black lines. Topography data taken from NASA’s Shuttle Radar Topog-raphy Mission. (For interpretation of the references to colour in this figure legend, the reader is referred to the web version of this article.)
horizontal compressive stress (S Hmin) corresponds to the min-imum compressive stress (S3). In contrast, S Hmax corresponds to the intermediate compressive stress (S2). In the absence of a strong regional stress field, anisotropy can also be caused by

F. Illsley-Kemp et al. / Earth and Planetary Science Letters 477 (2017) 41–51 43
Fig. 2. Structural map of the Afar Depression, showing fault traces from Central Afar (Manighetti et al., 2001) and Northern Afar. Major surface, Pliocene–Recent faults are in red. Fault traces are available in the supplementary material. (For interpreta-tion of the references to colour in this figure legend, the reader is referred to the web version of this article.)
aligned features within the crust. The alignment of crustal struc-tures such as fault zones will induce seismic anisotropy that is parallel to these faults (Boness and Zoback, 2006). Faults in the crust of Afar generally trend perpendicular to the orientation of extension, however there are local variations in the surface fault-ing, particularly in central Afar (Fig. 2).
The alignment of magmatic intrusions and melt within the crust will also produce observable seismic anisotropy (Kendall et al., 2005; Dunn et al., 2005). The Afar Depression has been the focus of repeated dike intrusions and ongoing volcanic activity (Pagli et al., 2012; Wright et al., 2006). It can therefore be ex-pected that these features will affect the seismic anisotropy in
the region. Magmatic activity is focused at the rift axis and is generally aligned with regional S Hmax . Therefore it can be dif-ficult to distinguish between anisotropy induced by the exten-sional stress field and anisotropy due to aligned magmatic fea-tures.
The presence of aligned fabrics within the basement rock of the Afar Depression may also influence the seismic anisotropy. Ex-posures of basement foliation and Proterozoic ophiolite formations have been used to suggest the presence of N to NE oriented sutures within the East African basement (Berhe, 1990). These features are not exposed within the Afar Depression, and thus interpretation of basement fabrics within the Afar Depression must be performed with caution. However, if it is assumed that the N–NE trend ob-served elsewhere in East Africa also exists in the Afar Depression, then associated seismic anisotropy would align parallel to these features (e.g., Keir et al., 2011).
Our study uses local earthquakes that are confined to the crust, and thus any measurements of seismic anisotropy originate from the crust. However, knowledge of fabrics in the mantle beneath the Afar Depression may be important for an understanding of un-derlying fabrics in the region. Hammond et al. (2014) show that anisotropy in the mantle beneath the Afar Depression is stratified into two layers. In the shallow mantle, there is little anisotropy beneath the Afar Depression, suggesting that melt has no preferen-tial alignment. In the deeper mantle, anisotropy shows a consistent NE–SW orientation, which is interpreted to represent a broad man-tle flow towards the northeast.
3. Data and methods
3.1. Seismic data
The seismic network was comprised of eleven stations in Ethiopia, active for two years between February 2011 and Febru-ary 2013. This was supplemented by a network of three stations in Eritrea active between June 2011 and October 2012 (Fig. 1a, Table 1). The resulting combined network consisted of eighteen Güralp CMG-3ESPCD instruments and four Güralp CMG-6TD in-struments that all recorded continuous seismic data at 50 Hz. Earthquakes were picked manually for both P and S waves and events were located with NonLinLoc (Lomax et al., 2000). We used a two-dimensional velocity model based on controlled source ex-periments and receiver functions (Hammond et al., 2011; Makris and Ginzburg, 1987). This resulted in a total of 4951 earthquakes, in a catalogue complete above magnitude 2.0, where magni-tudes are calculated using a region-specific local magnitude scale
Table 1Seismic anisotropy results for individual stations (Fig. 4). Circular mean anisotropy orientation (�) given in degrees clockwise from north. Standard error (±�) is the circular standard deviation. Average delay time at each station (δt) given in seconds.
Station Latitude Longitude Elev. (m)
Num. meas. �
(◦)±�
(◦)δt(s)
ABAE 13.353 39.764 1447 299 25.1 3.0 0.18AFMEa 13.204 40.858 58 178 25.9 7.4 0.33CAYE 14.862 39.305 2435 25 10.8 6.7 0.17DALE 14.229 40.218 −97 176 −17.7 4.8 0.23DOLE 15.097 39.981 88 119 50.5 4.6 0.14ERTEa 13.446 40.497 −5 110 −80.3 2.3 0.09GALE 13.725 40.394 −87 70 −35.6 7.6 0.27GULE 13.694 39.589 2025 92 −1.0 3.6 0.19HITEa 13.101 40.317 566 321 17.2 6.5 0.15IGRE 12.253 40.461 675 42 88.0 3.2 0.09KOZE 12.495 40.985 543 29 7.25 9.3 0.06SAHE 12.040 40.977 365 58 42.9 5.5 0.22TIOE 14.655 40.867 43 79 27.8 11.8 0.19TRUE 12.481 40.315 381 8 27.8 3.7 0.14
a Stations with a bipolar anisotropy distribution.

44 F. Illsley-Kemp et al. / Earth and Planetary Science Letters 477 (2017) 41–51
Fig. 3. Depth distribution of the analyzed earthquakes showing a predominance of events at depths <20 km and no clear dependance of δt with source depth. Seis-mic anisotropy results (Table 1) are therefore likely to be dominated by anisotropy within the mid to upper crust. Crustal thickness values for the Ethiopian Plateau and Danakil Depression taken from Hammond et al. (2011) and Makris and Ginzburg (1987).
(Illsley-Kemp et al., 2017). Here we show only those earthquakes with horizontal errors less than ±5 km (Fig. 1a).
3.2. Shear wave splitting
Once we have a catalogue of manually picked S-waves, we ap-ply the Multiple Filter Automatic Splitting Technique Version 2.2 (MFAST) developed by Savage et al. (2010). This method is based on the method of Silver and Chan (1991), which minimizes the eigenvalue of the covariance matrix of horizontal particle motion by performing a grid search over a range of fast directions (φ) and delay times (δt).
MFAST uses the method of Teanby et al. (2004) and devel-ops it further to allow the automatic classification of the quality of the measurement. MFAST trials a set of 14 filters over a win-dow surrounding the S-wave pick and determines the three most preferable filters by evaluating signal-to-noise ratio and the filter bandwidth. These three filters are then used to apply the Silver and Chan (1991) splitting measurement over multiple windows. This has the advantage of avoiding the additional subjectivity of window definitions. Cluster analysis is then performed on these measurements in order to select the most reliable measurement. Further to the analysis of clustering, MFAST rejects measurements from waveforms that have an unclear linearity in incoming po-larization by analyzing the smallest and largest eigenvalues. The rigorous quality analysis of MFAST removes any unintentional bias that is associated with manual methods. For further details on the MFAST method, see Savage et al. (2010).
We use the incidence angles calculated from NonLinLoc in order to restrict the earthquake raypaths we analyze to the shear-wave window. The shear-wave window is defined by the vertical cone beneath the seismic station bound by sin−1(V S/V P ). By limiting the incoming raypaths to this window we remove any potential effect of phase conversions at the surface (Booth and Crampin, 1985). We find that due to high velocity gradients near the surface, largely due to sedimentation, a high proportion of the earthquakes fulfil the shear-wave window criteria. The resulting incidence an-
Fig. 4. Rose diagrams of seismic anisotropy measurements. Only measurements graded as A quality are displayed. Average anisotropy orientation (�) scaled for average delay time (δ) plotted at each station. Table 1 gives the number of measure-ments and the average anisotropy orientations for each station. (For interpretation of the colours in this figure, the reader is referred to the web version of this article.)
gles range from 59.1◦ to 90◦ from horizontal, with an average incidence angle of 75.7◦ from horizontal. We choose to only in-terpret splitting measurements that were classed as A-grade by MFAST. This resulted in a total of 888 measurements across the network from 636 individual earthquakes (Table 1, Fig. 4). Seismic anisotropy is accrued along the raypath of the earthquake, thus measurements are taken at or above the earthquake depth. Over 78% of the analyzed earthquakes occur in the upper 20 km of the crust, thus seismic anisotropy results represent the mid to upper crust. The depth distribution of the analysed events is shown in Fig. 3.
3.3. Shear wave splitting tomography
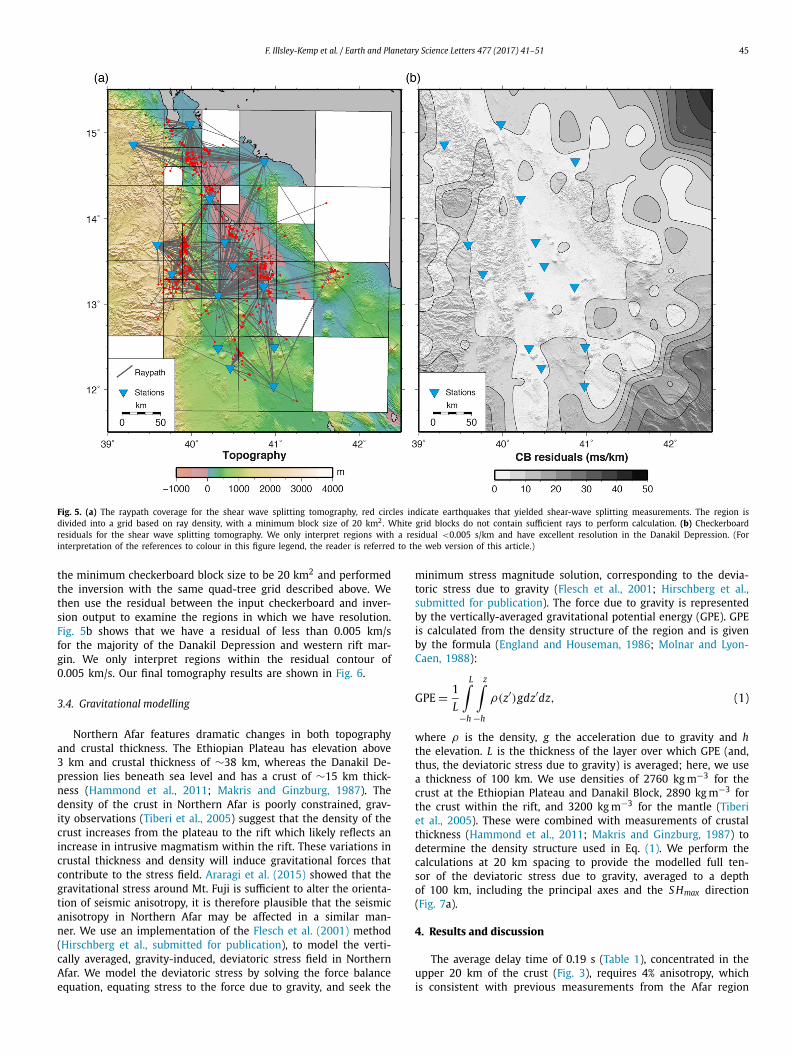
To better understand the spatial distribution of seismic aniso-tropy we use the two-dimensional splitting tomography method of Johnson et al. (2011). This method assumes that δt is accrued along the entire path length in a homogeneous sense. It also as-sumes that there is no depth dependence of anisotropy. The region is placed in an initial grid which is then iteratively divided, using a quad-tree method (Townend and Zoback, 2004), into increasingly smaller blocks based on the ray path density (Fig. 5a). We place the constraint that each block must contain at least 10 and a max-imum of 65 rays.
In order to determine the minimum scale of features that we can resolve with our dataset we performed a checkerboard test. We input a checkerboard with alternating anisotropy strength val-ues of 0.01 s/km and 0.02 s/km and adding random noise drawn from a standard normal distribution (Johnson et al., 2011). We set
F. Illsley-Kemp et al. / Earth and Planetary Science Letters 477 (2017) 41–51 45
Fig. 5. (a) The raypath coverage for the shear wave splitting tomography, red circles indicate earthquakes that yielded shear-wave splitting measurements. The region is divided into a grid based on ray density, with a minimum block size of 20 km2. White grid blocks do not contain sufficient rays to perform calculation. (b) Checkerboard residuals for the shear wave splitting tomography. We only interpret regions with a residual <0.005 s/km and have excellent resolution in the Danakil Depression. (For interpretation of the references to colour in this figure legend, the reader is referred to the web version of this article.)
the minimum checkerboard block size to be 20 km2 and performed the inversion with the same quad-tree grid described above. We then use the residual between the input checkerboard and inver-sion output to examine the regions in which we have resolution. Fig. 5b shows that we have a residual of less than 0.005 km/s for the majority of the Danakil Depression and western rift mar-gin. We only interpret regions within the residual contour of 0.005 km/s. Our final tomography results are shown in Fig. 6.
3.4. Gravitational modelling
Northern Afar features dramatic changes in both topography and crustal thickness. The Ethiopian Plateau has elevation above 3 km and crustal thickness of ∼38 km, whereas the Danakil De-pression lies beneath sea level and has a crust of ∼15 km thick-ness (Hammond et al., 2011; Makris and Ginzburg, 1987). The density of the crust in Northern Afar is poorly constrained, grav-ity observations (Tiberi et al., 2005) suggest that the density of the crust increases from the plateau to the rift which likely reflects an increase in intrusive magmatism within the rift. These variations in crustal thickness and density will induce gravitational forces that contribute to the stress field. Araragi et al. (2015) showed that the gravitational stress around Mt. Fuji is sufficient to alter the orienta-tion of seismic anisotropy, it is therefore plausible that the seismic anisotropy in Northern Afar may be affected in a similar man-ner. We use an implementation of the Flesch et al. (2001) method (Hirschberg et al., submitted for publication), to model the verti-cally averaged, gravity-induced, deviatoric stress field in Northern Afar. We model the deviatoric stress by solving the force balance equation, equating stress to the force due to gravity, and seek the
minimum stress magnitude solution, corresponding to the devia-toric stress due to gravity (Flesch et al., 2001; Hirschberg et al., submitted for publication). The force due to gravity is represented by the vertically-averaged gravitational potential energy (GPE). GPE is calculated from the density structure of the region and is given by the formula (England and Houseman, 1986; Molnar and Lyon-Caen, 1988):
GPE = 1
L
L∫
−h
z∫
−h
ρ(z′)gdz′dz, (1)
where ρ is the density, g the acceleration due to gravity and hthe elevation. L is the thickness of the layer over which GPE (and, thus, the deviatoric stress due to gravity) is averaged; here, we use a thickness of 100 km. We use densities of 2760 kg m−3 for the crust at the Ethiopian Plateau and Danakil Block, 2890 kg m−3 for the crust within the rift, and 3200 kg m−3 for the mantle (Tiberi et al., 2005). These were combined with measurements of crustal thickness (Hammond et al., 2011; Makris and Ginzburg, 1987) to determine the density structure used in Eq. (1). We perform the calculations at 20 km spacing to provide the modelled full ten-sor of the deviatoric stress due to gravity, averaged to a depth of 100 km, including the principal axes and the S Hmax direction (Fig. 7a).
4. Results and discussion
The average delay time of 0.19 s (Table 1), concentrated in the upper 20 km of the crust (Fig. 3), requires 4% anisotropy, which is consistent with previous measurements from the Afar region
46 F. Illsley-Kemp et al. / Earth and Planetary Science Letters 477 (2017) 41–51
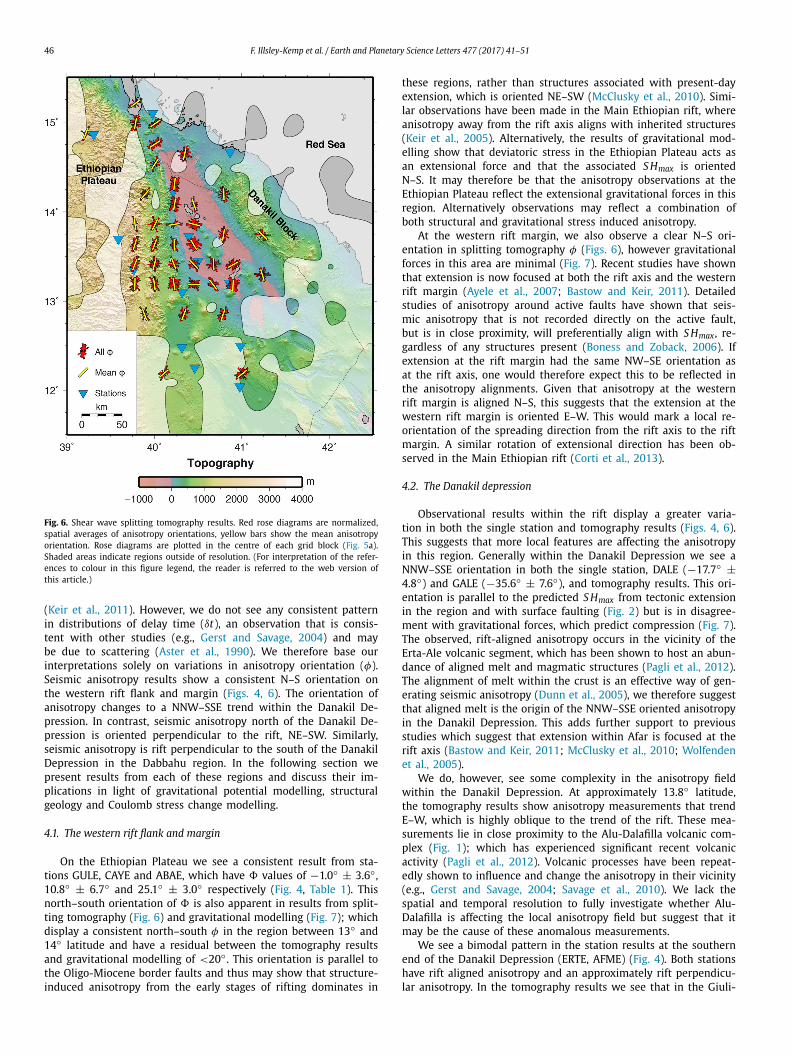
Fig. 6. Shear wave splitting tomography results. Red rose diagrams are normalized, spatial averages of anisotropy orientations, yellow bars show the mean anisotropy orientation. Rose diagrams are plotted in the centre of each grid block (Fig. 5a). Shaded areas indicate regions outside of resolution. (For interpretation of the refer-ences to colour in this figure legend, the reader is referred to the web version of this article.)
(Keir et al., 2011). However, we do not see any consistent pattern in distributions of delay time (δt), an observation that is consis-tent with other studies (e.g., Gerst and Savage, 2004) and may be due to scattering (Aster et al., 1990). We therefore base our interpretations solely on variations in anisotropy orientation (φ). Seismic anisotropy results show a consistent N–S orientation on the western rift flank and margin (Figs. 4, 6). The orientation of anisotropy changes to a NNW–SSE trend within the Danakil De-pression. In contrast, seismic anisotropy north of the Danakil De-pression is oriented perpendicular to the rift, NE–SW. Similarly, seismic anisotropy is rift perpendicular to the south of the Danakil Depression in the Dabbahu region. In the following section we present results from each of these regions and discuss their im-plications in light of gravitational potential modelling, structural geology and Coulomb stress change modelling.
4.1. The western rift flank and margin
On the Ethiopian Plateau we see a consistent result from sta-tions GULE, CAYE and ABAE, which have � values of −1.0◦ ± 3.6◦ , 10.8◦ ± 6.7◦ and 25.1◦ ± 3.0◦ respectively (Fig. 4, Table 1). This north–south orientation of � is also apparent in results from split-ting tomography (Fig. 6) and gravitational modelling (Fig. 7); which display a consistent north–south φ in the region between 13◦ and 14◦ latitude and have a residual between the tomography results and gravitational modelling of <20◦ . This orientation is parallel to the Oligo-Miocene border faults and thus may show that structure-induced anisotropy from the early stages of rifting dominates in
these regions, rather than structures associated with present-day extension, which is oriented NE–SW (McClusky et al., 2010). Simi-lar observations have been made in the Main Ethiopian rift, where anisotropy away from the rift axis aligns with inherited structures (Keir et al., 2005). Alternatively, the results of gravitational mod-elling show that deviatoric stress in the Ethiopian Plateau acts as an extensional force and that the associated S Hmax is oriented N–S. It may therefore be that the anisotropy observations at the Ethiopian Plateau reflect the extensional gravitational forces in this region. Alternatively observations may reflect a combination of both structural and gravitational stress induced anisotropy.
At the western rift margin, we also observe a clear N–S ori-entation in splitting tomography φ (Figs. 6), however gravitational forces in this area are minimal (Fig. 7). Recent studies have shown that extension is now focused at both the rift axis and the western rift margin (Ayele et al., 2007; Bastow and Keir, 2011). Detailed studies of anisotropy around active faults have shown that seis-mic anisotropy that is not recorded directly on the active fault, but is in close proximity, will preferentially align with S Hmax , re-gardless of any structures present (Boness and Zoback, 2006). If extension at the rift margin had the same NW–SE orientation as at the rift axis, one would therefore expect this to be reflected in the anisotropy alignments. Given that anisotropy at the western rift margin is aligned N–S, this suggests that the extension at the western rift margin is oriented E–W. This would mark a local re-orientation of the spreading direction from the rift axis to the rift margin. A similar rotation of extensional direction has been ob-served in the Main Ethiopian rift (Corti et al., 2013).
4.2. The Danakil depression
Observational results within the rift display a greater varia-tion in both the single station and tomography results (Figs. 4, 6). This suggests that more local features are affecting the anisotropy in this region. Generally within the Danakil Depression we see a NNW–SSE orientation in both the single station, DALE (−17.7◦ ±4.8◦) and GALE (−35.6◦ ± 7.6◦), and tomography results. This ori-entation is parallel to the predicted S Hmax from tectonic extension in the region and with surface faulting (Fig. 2) but is in disagree-ment with gravitational forces, which predict compression (Fig. 7). The observed, rift-aligned anisotropy occurs in the vicinity of the Erta-Ale volcanic segment, which has been shown to host an abun-dance of aligned melt and magmatic structures (Pagli et al., 2012). The alignment of melt within the crust is an effective way of gen-erating seismic anisotropy (Dunn et al., 2005), we therefore suggest that aligned melt is the origin of the NNW–SSE oriented anisotropy in the Danakil Depression. This adds further support to previous studies which suggest that extension within Afar is focused at the rift axis (Bastow and Keir, 2011; McClusky et al., 2010; Wolfenden et al., 2005).
We do, however, see some complexity in the anisotropy field within the Danakil Depression. At approximately 13.8◦ latitude, the tomography results show anisotropy measurements that trend E–W, which is highly oblique to the trend of the rift. These mea-surements lie in close proximity to the Alu-Dalafilla volcanic com-plex (Fig. 1); which has experienced significant recent volcanic activity (Pagli et al., 2012). Volcanic processes have been repeat-edly shown to influence and change the anisotropy in their vicinity (e.g., Gerst and Savage, 2004; Savage et al., 2010). We lack the spatial and temporal resolution to fully investigate whether Alu-Dalafilla is affecting the local anisotropy field but suggest that it may be the cause of these anomalous measurements.
We see a bimodal pattern in the station results at the southern end of the Danakil Depression (ERTE, AFME) (Fig. 4). Both stations have rift aligned anisotropy and an approximately rift perpendicu-lar anisotropy. In the tomography results we see that in the Giuli-

F. Illsley-Kemp et al. / Earth and Planetary Science Letters 477 (2017) 41–51 47
Fig. 7. (a) The gravitationally induced deviatoric stress field in the Danakil region. The high topography of the Ethiopian Plateau promotes an E–W oriented extension and compression within the Danakil Depression that rotates from E–W at the Erta-Ale segment to NE–SW at the northern Danakil Depression. (b) Residual between the modelled gravitational S Hmax and observed tomography results. We see excellent agreement on the Ethiopian Plateau and northern Danakil Depression (40◦E, 15◦N). (For interpretation of the colours in this figure, the reader is referred to the web version of this article.)
etti Plain, which lies between the Tat-Ale and Erta-Ale volcanic segments (Fig. 1), there is a clear rift perpendicular anisotropy which is accountable for the bimodal distribution at ERTE and AFME (Fig. 6). Surface faulting here shows complex orientations and suggest an interaction between the two volcanic segments (Barberi and Varet, 1970; Barberi et al., 1974) and this may ac-count for the change in anisotropy orientation. At station TIOE,which is situated within the Danakil Block, we see a large amount of variation in the orientation of anisotropy with little obvious co-herency. The Danakil Block has a complex and poorly understood tectonic and structural history (Fig. 2). We suspect that this struc-tural complexity is the origin of the variable anisotropy observed at TIOE, however further research into the structures of the Danakil Block would be required to verify this.
Further to the north, at a latitude of 15◦ , the tomography and � at DOLE (50.5◦ ± 4.6◦) show a clear clockwise rotation of anisotropy towards a rift perpendicular orientation (Figs. 4, 6). This area hosts Alid volcano, which is poorly studied but is un-derstood to be active (Duffield et al., 1997). The surface faults in this region follow a similar NNW–SSE trend to the Danakil Depres-sion (Duffield et al., 1997). We thus conclude that the observed anisotropy is not caused by such structures. Extension rate in the Danakil Depression decreases to the North, such that in the north-ernmost Danakil Depression the rate of extension is approximately zero (McClusky et al., 2010). If the stress due to tectonic exten-sion is minimal, it could be expected that the anisotropy would be controlled by gravitational stresses. The modelled gravitational stress in the northern Danakil Depression (Fig. 7a) shows com-pression and an S Hmax oriented approximately perpendicular to the rift. The modelled S Hmax orientation is in excellent agreement (residual <20◦) with the observed φ (Fig. 7b). This therefore sug-
gests that in the northern Danakil Depression, gravitational stress, and not tectonic extension, controls the stress field and acts to in-duce rift-perpendicular anisotropy in this region. Previous work by Araragi et al. (2015) has shown that the seismic anisotropy at Mt. Fuji is influenced by the gravitational stress of the volcano. Our study is the first to find that seismic anisotropy can be induced by gravitational forces which arise from crustal thickness variations.
Further to the south (<13◦ Latitude), anisotropy appears to align NNE–SSW at stations TRUE (27.8◦ ± 3.7◦) and KOZE (7.25◦± 9.3◦). In addition, measurements at station HITE that have come from the south align NNE–SSW, as shown in the tomography re-sults (Fig. 6). This orientation of anisotropy is sub-parallel with the Alayta volcanic complex and aligns with surface faulting that is associated with oblique extension between the Danakil Depres-sion and Dabbahu volcanic segment. This suggests that extension in this area is not focused NE–SW, as the majority of extension in Northern Afar is, but is oriented oblique to the spreading direc-tion, SEE–NWW. In this sense extension is transferred between the Dabbahu volcanic segment and Danakil Depression.
4.3. The Dabbahu region
Further south, in the Dabbahu region (Fig. 1), both the tomog-raphy (Fig. 6) and station results at IGRE (88.0◦ ± 3.2◦) and SAHE (42.9◦ ± 5.5◦) (Fig. 4) suggest anisotropy is oriented oblique to the rift, NE–SW. In this region we can compare our results to a previ-ous study of seismic anisotropy by Keir et al. (2011), who used seismicity data from 2008. We see an excellent agreement at the Ethiopian Plateau, where Keir et al. (2011) also show anisotropy oriented N–S, however in the rift, near the Dabbahu volcanic seg-ment, we see a stark discrepancy between the two sets of results.

48 F. Illsley-Kemp et al. / Earth and Planetary Science Letters 477 (2017) 41–51
Fig. 8. A comparison between the anisotropy results at station SAHE in 2011 (this study) and in 2008 (Keir et al., 2011). We observe a clear change in the orientation of anisotropy between the two time periods.
Keir et al. (2011) show many measurements that are aligned par-allel to the rift (NNW–SSE), however we see no evidence for rift-parallel anisotropy in either the single station results (Fig. 4) or the tomography (Fig. 6). The discrepancy in results is most clear at station SAHE, which was occupied during both studies. Keir et al. (2011) obtained an anisotropy orientation of −12◦ , whereas in our study we obtain an average orientation of 42.9◦ . To ensure that the difference in anisotropy orientation is not due to the method we recalculate the 2008 data at station SAHE (Fig. 8). We calculate an anisotropy orientation of −39.0◦ which agrees with the rift-parallel measurements that Keir et al. (2011) found in the Dabbahu region.
The seismic data used by Keir et al. (2011) was obtained from 2005–2008, during this time period the Dabbahu volcanic seg-ment underwent a series of dike intrusions (Belachew et al., 2011; Ebinger et al., 2010; Wright et al., 2006). The initiation of volcanic activity at Dabbahu was marked by seismic swarms and a fissure eruption on 26 September 2005 which was associated with the in-trusion of a ∼60 km long dike which induced opening of up to 8 m (Wright et al., 2006). From 2005 through to 2010 a further 13 dikes intruded in the rift segment, three of which were asso-ciated with basaltic fissure eruptions (Ebinger et al., 2010; Ham-ling et al., 2009). Volcanic intrusions have been shown to change the local seismic anisotropy (Gerst and Savage, 2004; Johnson et al., 2011), so it is possible that the Dabbahu dike intrusions will have influenced the seismic anisotropy measured by Keir et al. (2011).
In order to test this hypothesis we perform Coulomb stress change modelling using the package of Lin and Stein (2004) and Toda et al. (2005). We use this to calculate the induced maximum horizontal stress (S Hmax) from the Dabbahu dike sequence and test whether this influenced the anisotropy measurements of Keir et al. (2011). We use constraints on dike geometry and opening from geodetic and seismicity observations (Belachew et al., 2011; Ham-ling et al., 2009; Wright et al., 2006). The results of the Coulomb
stress change modelling show that the results of Keir et al. (2011), and the recalculated result at SAHE, can be accurately explained by the modelled, induced stress field, with an average residual in φ of 27◦ ± 17◦ (Fig. 9). We therefore suggest that the previous rift parallel anisotropy orientations from the Dabbahu region are not necessarily representative of the long term anisotropy, rather the anisotropy results of Keir et al. (2011) represent the stress field around the actively intruding Dabbahu volcanic segment. If this is the case, we can further suggest that the results presented in this study represent the background stress field in the Dabbahu re-gion. In this sense, the stress field in the Dabbahu region changes orientation episodically with the occurrence of magma intrusions. This lends observational support to numerical models which sug-gest that the stress field around magmatic segments in continental rifts changes between magmatic and amagmatic periods of exten-sion (Beutel et al., 2010).
The reason behind the NEE–SWW orientation of anisotropy (IGRE, SAHE) in the Dabbahu region is unclear. The southern extent of the Dabbahu volcanic segment extends into central Afar, a re-gion that is postulated to be the location of the Afar triple junction (Tesfaye et al., 2003). The stress field is therefore expected to be extremely complex here. The surface faulting in central Afar is gen-erally oriented NW–SE, consistent with the Red Sea rift (Fig. 2). As the anisotropy measurements do not align with these structures, one can infer that the anisotropy is either originating from deeper structural fabrics, or it is representative of the stress field in the region. The NE–SW orientation of the anisotropy is sub-parallel to the trend of the Main Ethiopian rift, it may be that the anisotropy is therefore originating from either deep structures in central Afar related to the Main Ethiopian rift, or that the stress field related to Main Ethiopian rift extension is currently dominant in central Afar. Alternatively the rift perpendicular orientation of anisotropy is predicted by the gravitational modelling (Fig. 7), therefore it may be that the anisotropy in the Dabbahu region is influenced by the gravitational stress due to crustal thickness variations.

F. Illsley-Kemp et al. / Earth and Planetary Science Letters 477 (2017) 41–51 49
Fig. 9. Coulomb stress change modelling of the Dabbahu dike intrusions from 2005–2008. Small black lines are the modelled S Hmax , thick black lines are anisotropy measurements from Keir et al. (2011) measured between 2005–2008, and the recalculated result at station SAHE. (For interpretation of the colours in this figure, the reader is referred to the web version of this article.)
4.4. Summary
Our results present the first detailed observations of crustal strain in Northern Afar. We use these observations to propose a model for the stress field in the crust during the final stages of continental breakup. Seismic anisotropy at the rift axis is oriented perpendicular to tectonic extension, suggesting that the rift axis is the current locus for extension. We show that extension changes orientation from NE–SW at the rift axis to a W–E orientation at the rift margin. We also show that the stress field can change dramatically within the rift, such that north of the Danakil De-pression, gravitational forces due to gradients in crustal thickness are sufficient to influence the anisotropy within a continental rift. Further, through Coulomb stress change modelling of the Dabbahu dike intrusions we show that the stress field in this region changes periodically through time and that during times of no active intru-sions, the extensional stress field is not observed in the seismic anisotropy.
The observation of rift-aligned seismic anisotropy at the axis of continental rifts is in agreement with previous studies of con-tinental rifts (Keir et al., 2011) and ocean ridge segments (Dunn et al., 2005). We suggest that the anisotropy within the Danakil Depression originates from rift-aligned melt within the crust. This adds further support to the suggestion that magmatic extension focuses at the rift axis during continental rifting and that this per-
sists through to seafloor spreading (e.g., Wolfenden et al., 2005). However, we demonstrate that the orientation of the stress field away from the rift axis is more complex than previously thought and is heavily influenced by gravitational forces and magmatic ac-tivity. Our results are amongst the first observations of gravity induced seismic anisotropy and shows that variations in crustal thickness is an important consideration in studies of crustal seis-mic anisotropy in continental rifts. We also note that gravitational forces act to induce compression within the rift such that S Hmax
is oriented perpendicular to the rift (Fig. 7). Several studies of sur-face geology in Northern Afar have noted the presence of cross-rift structures (e.g., Barberi et al., 1974) and Afar hosts dike intrusions and volcanic chains that do not align with S Hmax induced by re-gional extension (Wadge et al., 2016). We show that gravitational forces due to variations in crustal thickness act to induce a stress field that is highly-oblique to the stress field due to tectonic exten-sion. It may be that this induced gravitational force is the origin of the observed cross-rift structures and volcanism.
In addition to gravitational influence on the stress field, we also demonstrate that magmatic intrusions can dramatically alter the orientation of the stress field. We use Coulomb stress change mod-elling of dike intrusions at the Dabbahu volcanic segment to show that previous measurements of rift aligned anisotropy are best explained by the induced stress field from the actively intruding dikes (Keir et al., 2011) (Fig. 9). Seismic anisotropy measurements presented in this study are not influenced by active intrusions and display a rift-perpendicular orientation in the Dabbahu region. This suggests that the current stress field in the Dabbahu region is not characterized by the regional NE–SW extension of the Danakil De-pression.
5. Conclusions
We present the first detailed study of the seismic anisotropy of the Danakil Depression of Northern Afar through automated shear wave splitting, shear wave splitting tomography and forward mod-elling of both the gravitational and magmatically induced stress fields. This enables us to propose a model for the crustal stress field in the region and we draw the following conclusions:
1. Seismic anisotropy on the Ethiopian Plateau is controlled by gravitationally induced extension and/or preexisting structures inherited from initial Miocene rifting.
2. Seismic anisotropy within the Danakil Depression, at the rift axis, is controlled by the NW–SE oriented extension in the re-gion, suggesting that extension is currently focused at the rift axis through rift-aligned magmatic intrusions and structures. There is also an increase in variability of anisotropy direction within the rift, implying that local effects such as volcanic ac-tivity are affecting the local stress field.
3. At the actively extending western rift margin seismic aniso-tropy is oriented N–S, oblique to the inferred extension direc-tion at the rift axis. This suggests that there is a rotation in the extension direction from the rift axis to the rift margin, such that extension at the western rift margin is oriented E–W.
4. At the northern termination of the Danakil Depression, aniso-tropy rotates towards a rift-perpendicular orientation which is coincident with a decrease in extension rate. We propose that the stress field due to the regional extension becomes minimal in this area and that stress induced by gravitational forces now control anisotropy. These gravitational forces cause an S Hmax
orientation that is perpendicular to the rift. This is amongst the first observation of gravitational forces inducing seismic anisotropy.
5. Through Coulomb stress change modelling of the Dabbahu dike intrusions we show that the anisotropy south of the
50 F. Illsley-Kemp et al. / Earth and Planetary Science Letters 477 (2017) 41–51
Danakil Depression, in the vicinity of the Dabbahu segment, changes temporally. Previous measurements of anisotropy record the stress field around an actively intruding segment, however since the cessation of intrusions the stress field has re-oriented to a background, rift perpendicular orientation.
We envisage that our results will have great importance for numerical and analogue models of continental rifts and for re-constructions of rifted margins. We show that the distribution and orientation of crustal stress and strain during continental rifting is more complex than previously thought and that this is an impor-tant consideration for future studies. In addition, our results will aid the monitoring of volcanic hazards in Northern Afar by pro-viding a benchmark of anisotropy measurements, against which to test any temporal changes.
Acknowledgements
We thank SEIS-UK for use of the instruments and their com-puting facilities. The facilities of SEIS-UK are supported by the Natural Environment Research Council (NERC) under agreement R8/H10/64. FIK is funded through NERC studentship NE/L002531/1 and a grant to GSNOCS from Roy Franklin O.B.E. BG is funded through a PhD scholarship by the University of Bristol and En-gineering and Physical Sciences Research Council (EPSRC: Grant Number DTG EP/L504919/1). DK is supported by NERC grant NE/L013932. Funding for fieldwork is from BHP Billiton. We also acknowledge assistance from Addis Ababa University and the Afar National Regional State Government. The MFAST package is available for download at http://mfast-package.geo.vuw.ac.nz. The TESSA package is available for download at https://sites.google.com/site/jessicahelenjohnson/tessa. Codes for calculating the gravi-tational deviatoric stress are available at http://github.com/hamishhirschberg/stress-modelling.
Appendix A. Supplementary material
Supplementary material related to this article can be found on-line at http://dx.doi.org/10.1016/j.epsl.2017.08.014.
References
Araragi, K.R., Savage, M.K., Ohminato, T., Aoki, Y., 2015. Seismic anisotropy of the upper crust around Mount Fuji, Japan. J. Geophys. Res. 120 (4), 2739–2751.
Aster, R.C., Shearer, P.M., Berger, J., 1990. Quantitative measurements of shear wave polarizations at the Anza seismic network, southern California: implications for shear wave splitting and earthquake prediction. J. Geophys. Res. 95 (B8), 12449–12473.
Ayele, A., Stuart, G., Bastow, I., Keir, D., 2007. The August 2002 earthquake sequence in north Afar: insights into the neotectonics of the Danakil microplate. J. Afr. Earth Sci. 40, 70–79.
Barberi, F., Bonatti, E., Marinelli, G., Varet, J., 1974. Transverse tectonics during the split of a continent: data from the Afar rift. Tectonophysics 23 (1–2), 17–29.
Barberi, F., Varet, J., 1970. The Erta Ale volcanic range (Danakil depression, northern Afar, Ethiopia). Bull. Volcanol. 34 (4), 848–917.
Bastow, I., Keir, D., 2011. The protracted development of the continent–ocean tran-sition in Afar. Nat. Geosci. 4, 248–250.
Belachew, M., Ebinger, C., Coté, D., Keir, D., Rowland, J., Hammond, J., Ayele, A., 2011. Comparison of dike intrusions in an incipient seafloor-spreading segment in Afar, Ethiopia: seismicity perspectives. J. Geophys. Res. 116 (B6).
Berhe, S., 1990. Ophiolites in northeast and East Africa: implications for Proterozoic crustal growth. J. Geol. Soc. 147 (1), 41–57.
Beutel, E., van Wijk, J., Ebinger, C., Keir, D., Agostini, A., 2010. Formation and stability of magmatic segments in the Main Ethiopian and Afar rifts. Earth Planet. Sci. Lett. 293 (3), 225–235.
Boness, N.L., Zoback, M.D., 2006. Mapping stress and structurally controlled crustal shear velocity anisotropy in California. Geology 34 (10), 825–828.
Booth, D., Crampin, S., 1985. Shear-wave polarizations on a curved wavefront at an isotropic free surface. Geophys. J. R. Astron. Soc. 83 (1), 31–45.
Brune, S., Williams, S.E., Butterworth, N.P., Müller, R.D., 2016. Abrupt plate accelera-tions shape rifted continental margins. Nature 536 (7615), 201–204.
Corti, G., Bonini, M., Conticelli, S., Innocenti, F., Manetti, P., Sokoutis, D., 2003. Ana-logue modelling of continental extension: a review focused on the relations between the patterns of deformation and the presence of magma. Earth-Sci. Rev. 63 (3), 169–247.
Corti, G., Philippon, M., Sani, F., Keir, D., Kidane, T., 2013. Re-orientation of the exten-sion direction and pure extensional faulting at oblique rift margins: comparison between the Main Ethiopian Rift and laboratory experiments. Terra Nova 25 (5), 396–404.
Crampin, S., 1994. The fracture criticality of crustal rocks. Geophys. J. Int. 118, 428–438.
Duffield, W.A., Bullen, T., Clynne, M., Fournier, R., Janik, C., Lanphere, M., Lowenstern, J., Smith, J.G., Giorgis, L., Kahsai, G., et al., 1997. Geothermal Potential of the Alid Volcanic Center, Danakil Depression, Eritrea. Tech. Rep., US Geological Survey.
Dunn, R.A., Lekic, V., Detrick, R.S., Toomey, D.R., 2005. Three-dimensional seismic structure of the Mid-Atlantic Ridge (35 N): evidence for focused melt supply and lower crustal dike injection. J. Geophys. Res. 110 (B9).
Ebinger, C., Ayele, A., Keir, D., Rowland, J., Yirgu, G., Wright, T., Belachew, M., Ham-ling, I., 2010. Length and timescales of rift faulting and magma intrusion: the Afar rifting cycle from 2005 to present. Annu. Rev. Earth Planet. Sci. 38, 439–466.
Ebinger, C.J., van Wijk, J., Keir, D., 2013. The time scales of continental rifting: im-plications for global processes. Spec. Pap., Geol. Soc. Am. 500, 371–396.
England, P., Houseman, G., 1986. Finite strain calculations of continental deforma-tion, 2: comparison with the India–Asia collision zone. J. Geophys. Res. 91 (B3), 3664–3676.
Flesch, L.M., Haines, A.J., Holt, W.E., 2001. Dynamics of the India–Eurasia collision zone. J. Geophys. Res. 106 (B8), 16435–16460.
Gerst, A., Savage, M.K., 2004. Seismic anisotropy beneath Ruapehu volcano: a possi-ble eruption forecasting tool. Science 306 (5701), 1543–1547.
Goitom, B., Oppenheimer, C., Hammond, J.O.S., Grandin, R., Barnie, T., Donovan, A., Ogubazghi, G., Yohannes, E., Kibrom, G., Kendall, J.-M., Carn, S., Fee, D., Seal-ing, C., Keir, D., Ayele, A., Blundy, J., Hamlyn, J., Wright, T., Berhe, S., 2015. First recorded eruption of Nabro volcano, Eritrea, 2011. Bull. Volcanol. 77 (10), 1–21.
Hamling, I., Ayele, A., Bennati, L., Calais, E., Ebinger, C., Keir, D., Lewi, E., Wright, T., Yirgu, G., 2009. Geodetic observations of the ongoing Dabbahu rifting episode: new Dyke intrusions in 2006 and 2007. Geophys. J. Int. 178 (2), 989–1003.
Hammond, J.O.S., Kendall, J.-M., Stuart, G., Keir, D., Ebinger, C., Ayele, A., Belachew, M., 2011. The nature of the crust beneath the Afar triple junction: evidence from receiver functions. Geochem. Geophys. Geosyst. 12 (12).
Hammond, J., Kendall, J.-M., Wookey, J., Stuart, G., Keir, D., Ayele, A., 2014. Differ-entiating flow, melt, or fossil seismic anisotropy beneath Ethiopia. Geochem. Geophys. Geosyst. 15 (5), 1878–1894.
Hirschberg, H.P., Lamb, S., Savage, M.K, submitted for publication. Calculation of the lithospheric and crustal stress and viscosity fields in the New Zealand plate boundary zone. J. Geophys. Res.
Hudson, J.A., 1981. Wave speeds and attenuation of elastic waves in material con-taining cracks. Geophys. J. Int. 64 (1), 133–150.
Hutchison, W., Pyle, D.M., Mather, T.A., Yirgu, G., Biggs, J., Cohen, B.E., Barfod, D.N., Lewi, E., 2016. The eruptive history and magmatic evolution of Aluto volcano: new insights into silicic peralkaline volcanism in the Ethiopian rift. J. Volcanol. Geotherm. Res. 328, 9–33.
Illsley-Kemp, F., Keir, D., Bull, J.M., Ayele, A., Hammond, J.O., Kendall, J.-M., Gallacher, R.J., Gernon, T., Goitom, B., 2017. Local earthquake magnitude scale and b-value for the Danakil region of northern Afar. Bull. Seismol. Soc. Am. 107 (2), 521–531.
Johnson, J.H., Savage, M.K., Townend, J., 2011. Distinguishing between stress-induced and structural anisotropy at Mount Ruapehu Volcano, New Zealand. J. Geophys. Res. 116, B12303. http://dx.doi.org/10.1029/2011JB008308.
Keir, D., Belachew, M., Ebinger, C., Kendall, J.-M., Hammond, J.O.S., Stuart, G.W., Ayele, A., Rowland, J., 2011. Mapping the evolving strain field during continental breakup from crustal anisotropy in the Afar Depression. Nat. Commun. 2, 285.
Keir, D., Kendall, J.-M., Ebinger, C.J., Stuart, G.W., 2005. Variations in late syn-rift melt alignment inferred from shear-wave splitting in crustal earthquakes beneath the Ethiopian rift. Geophys. Res. Lett. 32 (23). http://dx.doi.org/10.1029/2005GL024150.
Kendall, J.-M., Stuart, G., Ebinger, C., Bastow, I., Keir, D., 2005. Magma assisted rifting in Ethiopia. Nature 433, 146–148.
Lin, J., Stein, R.S., 2004. Stress triggering in thrust and subduction earthquakes and stress interaction between the southern San Andreas and nearby thrust and strike-slip faults. J. Geophys. Res. 109 (B2).
Lomax, A., Virieux, J., Volant, P., Berge-Thierry, C., 2000. Probabilistic earthquake location in 3D and layered models. In: Advances in Seismic Event Location. Springer, pp. 101–134.
Makris, J., Ginzburg, A., 1987. The Afar Depression: transition between continental rifting and sea floor spreading. Tectonophysics 141, 199–214.
Manighetti, I., Tapponnier, P., Courtillot, V., Gallet, Y., Jacques, E., Gillot, P.-Y., 2001. Strain transfer between disconnected, propagating rifts in Afar. J. Geophys. Res. 106 (B7), 13613–13665.
McClusky, S., Reilinger, R., Ogubazghi, G., Amleson, A., Healeb, B., Vernant, P., Sholan, J., Fisseha, S., Asfaw, L., Bendick, R., Kogan, L., 2010. Kinematics of the southern Red Sea–Afar Triple Junction and implications for plate dynamics. Geophys. Res. Lett. 37 (5).

F. Illsley-Kemp et al. / Earth and Planetary Science Letters 477 (2017) 41–51 51
Molnar, P., Lyon-Caen, H., 1988. Some simple physical aspects of the support, struc-ture, and evolution of mountain belts. Spec. Pap., Geol. Soc. Am. 218, 179–208.
Pagli, C., Wright, T.J., Ebinger, C.J., Yun, S.-H., Cann, J.R., Barnie, T., Ayele, A., 2012. Shallow axial magma chamber at the slow-spreading Erta Ale Ridge. Nat. Geosci. 5 (4), 284–288.
Pindell, J., Graham, R., Horn, B., 2014. Rapid outer marginal collapse at the rift to drift transition of passive margin evolution, with a Gulf of Mexico case study. Basin Res. 26 (6), 701–725.
Savage, M.K., Wessel, A., Teanby, N.A., Hurst, A.W., 2010. Automatic measure-ment of shear wave splitting and applications to time varying anisotropy at Mount Ruapehu volcano, New Zealand. J. Geophys. Res. 115, B12321. http://dx.doi.org/10.1029/2010JB007722.
Silver, P., Chan, G., 1991. Shear wave splitting and subcontinental mantle deforma-tion. J. Geophys. Res. 96 (B10), 16429–16454.
Teanby, N., Kendall, J.-M., Van der Baan, M., 2004. Automation of shear-wave splitting measurements using cluster analysis. Bull. Seismol. Soc. Am. 94 (2), 453–463.
Tesfaye, S., Harding, D., Kusky, T., 2003. Early continental breakup boundary and migration of the Afar triple junction, Ethiopia. Geol. Soc. Am. Bull. 115 (9), 1053–1067.
Tiberi, C., Ebinger, C., Ballu, V., Stuart, G., Oluma, B., 2005. Inverse models of gravity data from the Red Sea–Aden–East African rifts triple junction zone. Geophys. J. Int. 163 (2), 775–787.
Toda, S., Stein, R.S., Richards-Dinger, K., Bozkurt, S.B., 2005. Forecasting the evolu-tion of seismicity in southern California: animations built on earthquake stress transfer. J. Geophys. Res. 110 (B5).
Townend, J., Zoback, M., 2004. Regional tectonic stress near the San Andreas fault in central and southern California. Geophys. Res. Lett. 31 (15).
Wadge, G., Biggs, J., Lloyd, R., Kendall, J.-M., 2016. Historical volcanism and the state of stress in the East African Rift System. Front. Earth Sci. 4.
Wolfenden, E., Ebinger, C., Yirgu, G., Renne, P., Kelley, S., 2005. Evolution of a vol-canic rifted margin: southern Red Sea, Ethiopia. Bull. Geol. Soc. Am. 117 (7–8), 846–864.
Wright, T., Ebinger, C., Biggs, J., Ayele, A., Yirgu, G., Keir, D., Stork, A., 2006. Magma-maintained rift segmentation at continental rupture in the 2005 Afar dyking episode. Nature 442 (7100), 291–294.