Extending the Industry Evolution Management Flight ... · Extending the Industry Evolution...
27
Extending the Industry Evolution Management Flight Simulators: Premium Golf Club and Solar Panel Industries John Lyneis, Matthew Forrester, Joe C. Hsueh and John D. Sterman 1 Abstract The Industry Evolution Management Flight Simulator (MFS) was developed at the MIT Sloan School of Management for use in the MBA Strategic Management curriculum. The simulator portrays a generic firm and industry structure that is then adapted to various industries to illustrate different strategic environments. Earlier applications include the salt industry and video game console industry. Here, we summarize this work and present two new applications, both tested in a spring 2007 MBA elective course. The first is a simulator of the premium golf club industry. This simulator allows students to experience typical boom and bust dynamics following the introduction of a new consumer durable and experiment with strategies related to price, R&D and marketing. The second new application portrays the solar photovoltaic panel industry. In addition to introducing students to the potential for profit and growth in this emerging and socially relevant industry, this MFS gives users the opportunity to experience how learning curves and knowledge spillovers can affect their choice of strategy when introducing a new technology. 1 Sloan School of Management, Massachusetts Institute of Technology Please direct correspondence to John Lyneis ([email protected] ) or John Sterman ([email protected] ) Financial support provided by the Project on Innovation in Markets and Organizations at the MIT Sloan School of Management. We thank Rebecca Henderson, Christopher Wheat, Pierre Azoulay, and Ezra Zuckerman for contributions to game design and for their willingness to use the games in their classes, and Nick Hofmeister and Joel Conkling for helpful feedback.
Transcript of Extending the Industry Evolution Management Flight ... · Extending the Industry Evolution...
Extending the Industry Evolution Management Flight Simulators: Premium Golf
Club and Solar Panel Industries
John Lyneis, Matthew Forrester, Joe C. Hsueh and John D. Sterman1
Abstract
The Industry Evolution Management Flight Simulator (MFS) was developed at the MIT
Sloan School of Management for use in the MBA Strategic Management curriculum.
The simulator portrays a generic firm and industry structure that is then adapted to
various industries to illustrate different strategic environments. Earlier applications
include the salt industry and video game console industry. Here, we summarize this work
and present two new applications, both tested in a spring 2007 MBA elective course. The
first is a simulator of the premium golf club industry. This simulator allows students to
experience typical boom and bust dynamics following the introduction of a new
consumer durable and experiment with strategies related to price, R&D and marketing.
The second new application portrays the solar photovoltaic panel industry. In addition to
introducing students to the potential for profit and growth in this emerging and socially
relevant industry, this MFS gives users the opportunity to experience how learning curves
and knowledge spillovers can affect their choice of strategy when introducing a new
technology.
1 Sloan School of Management, Massachusetts Institute of Technology Please direct correspondence to John Lyneis ([email protected]) or John Sterman ([email protected]) Financial support provided by the Project on Innovation in Markets and Organizations at the MIT Sloan School of Management. We thank Rebecca Henderson, Christopher Wheat, Pierre Azoulay, and Ezra Zuckerman for contributions to game design and for their willingness to use the games in their classes, and Nick Hofmeister and Joel Conkling for helpful feedback.
INTRODUCTION
The Industry Evolution Management Flight Simulator (MFS), developed by the System
Dynamics group at the MIT Sloan School of Management, is currently used in the MBA
Strategic Management curriculum as a complement to more traditional teaching methods
(Hsueh, Dogan, & Sterman 2006). The industry evolution MFS portrays a generic firm
and industry structure that is then adapted to represent various industries and strategic
environments. Hsueh et al. 2006 provides an overview of the generic structure employed
and describes two such applications: the salt industry, where players compete and make
decisions only on price, to illustrate classic competitive dynamics in concentrated
industries, and the video game console industry, where additional feedbacks through
network externalities and complementary assets are central to success.
Here, we describe two new applications that were used in the spring 2007 MBA elective
“Technology Strategy” at the MIT Sloan School of Management. Both simulators
introduce students to new strategic environments and decision making challenges that
extend the lessons of the salt and video game simulators. The first extension portrays the
premium golf club industry, based on the experience of Callaway Golf during the 1990s.
Callaway experienced tremendous growth following the introduction of its innovative
“Big Bertha” driver, only to succumb to the typical “boom and bust” pattern as the
market saturated. The Callaway simulator challenges students to explore growth and
market saturation in the presence of learning curves and strong brand equity effects.
Second, we present a MFS of the photovoltaic solar panel industry, based on the case of
the SunPower Corporation, a relatively small technology leader in this growing market.
Players must decide how aggressively to price and how much to invest in R&D and
process technology so as to capture benefits from learning and process improvement,
while also recognizing the importance of knowledge spillovers. In addition, the
simulator allows students to experience the potential for profit and growth in an industry
that is important to issues of energy and global sustainability.
Management Flight Simulators have several advantages over traditional case study
methods of teaching strategy. Although case discussions do allow students to experience
a situation similar to an actual board room, they do not provide the opportunity to test
hypotheses or formulate strategies over the range of a company’s lifetime. As a result,
students may fail to appreciate the complex feedback environment in which decisions
must inevitably be placed. Furthermore, without the ability to test hypotheses students
may be vulnerable to various judgmental biases including hindsight bias, overconfidence,
or confirmation bias (Simon 1979, Kahneman, Slovic and Tversky 1982, Plous 1993).
By allowing controlled experimentation and providing feedback on the long term and
distal consequences of decisions, management flight simulators overcome some of these
limitations and provide a valuable tool for management education.
The Industry Evolution Management Flight simulator has two main goals. The first is to
develop the strategic thinking skills of students by allowing them to formulate strategies
and test hypotheses across a broad range of strategic environments. Second, by
experiencing such a range of environments, students can build specific industry
knowledge and learn to appreciate how context may shape the strategies that they choose.
For example, strategies may differ greatly depending upon whether the product is a
commodity (salt), whether network externalities exist (video games), whether the product
is durable or consumed, and whether functionality can be improved (golf clubs), and
whether knowledge spillovers are strong (solar). To allow for such a wide range of
applications, a the underlying model has a broad model boundary and generates many
industry dynamics with few exogenous variables. In addition, the model itself is generic
and can be easily adapted by changing parameters and adjusting the relative strength of
feedback loops. (If necessary, entire sections can be made inactive for particular industry
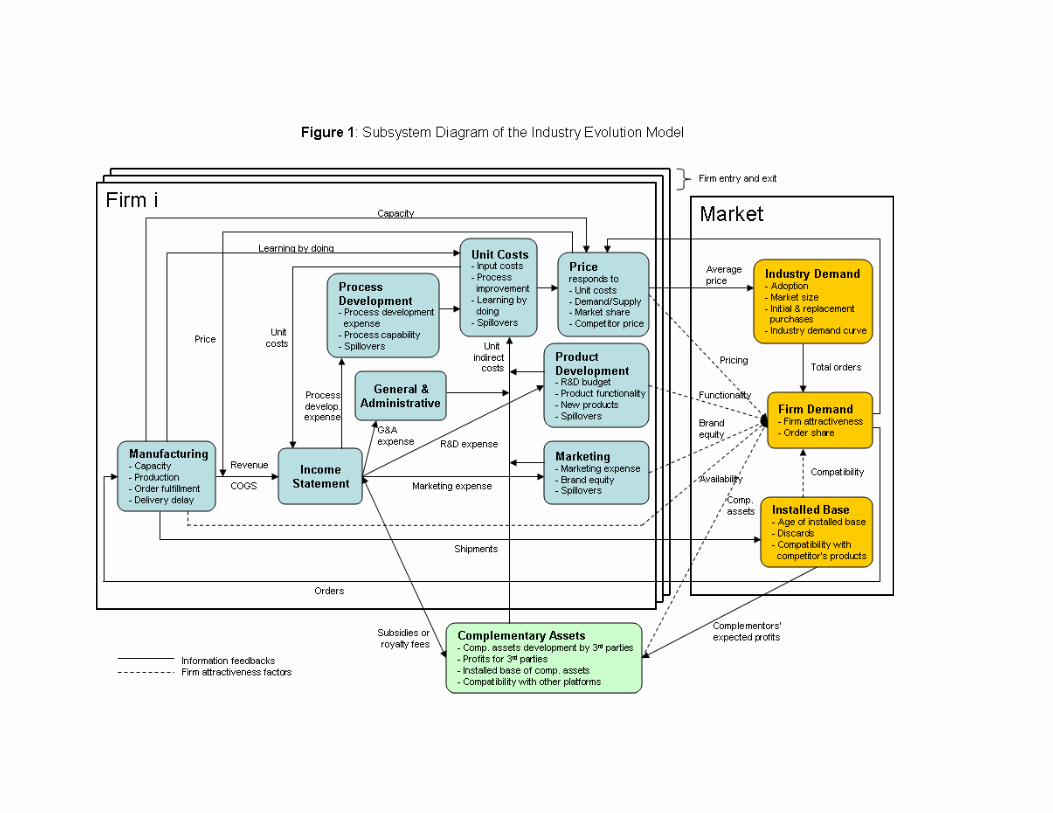
applications.) Table 1, repeated from Hsueh, Dogan & Sterman (2006) provides an
overview of the model boundary. Similarly, Figure 1 describes the structure of the
generic model. (For more details on the generic structure see Hsueh et al. 2006).
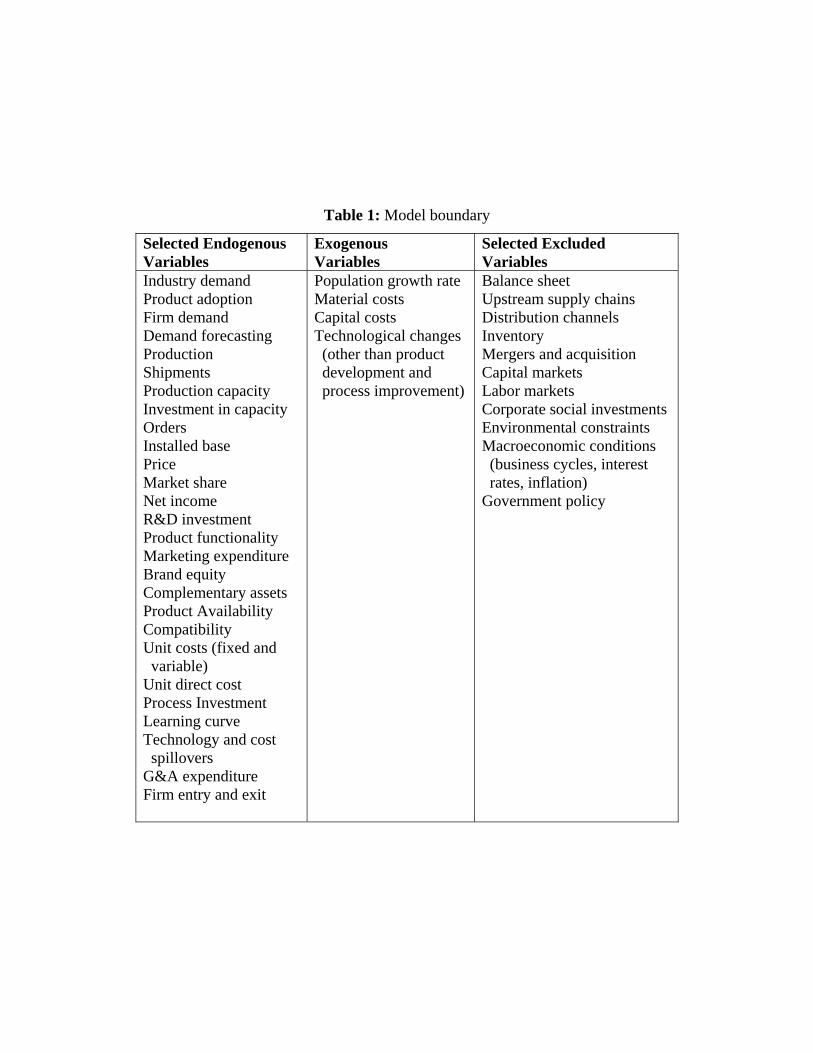
Table 1: Model boundary
Selected Endogenous Variables
Exogenous Variables
Selected Excluded Variables
Industry demand Product adoption Firm demand Demand forecasting Production Shipments Production capacity Investment in capacity Orders Installed base Price Market share Net income R&D investment Product functionality Marketing expenditure Brand equity Complementary assets Product Availability Compatibility Unit costs (fixed and variable) Unit direct cost Process Investment Learning curve Technology and cost spillovers G&A expenditure Firm entry and exit
Population growth rate Material costs Capital costs Technological changes (other than product development and process improvement)
Balance sheet Upstream supply chains Distribution channels Inventory Mergers and acquisition Capital markets Labor markets Corporate social investments Environmental constraints Macroeconomic conditions (business cycles, interest rates, inflation) Government policy
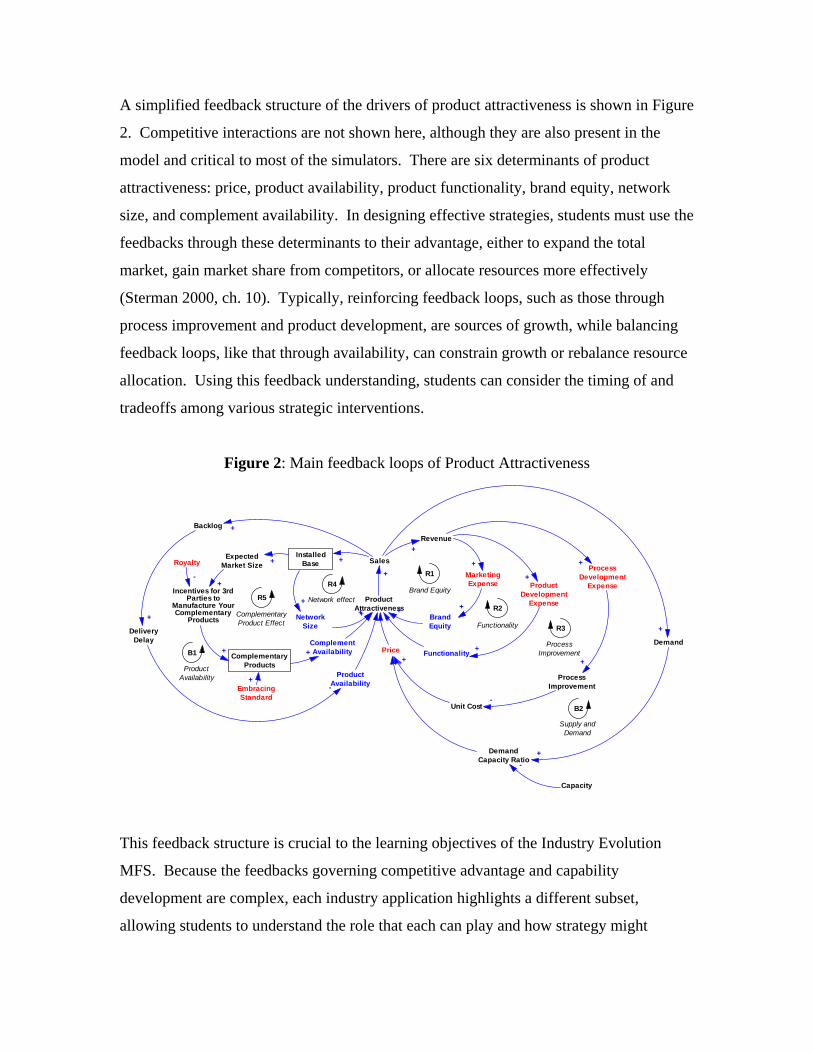
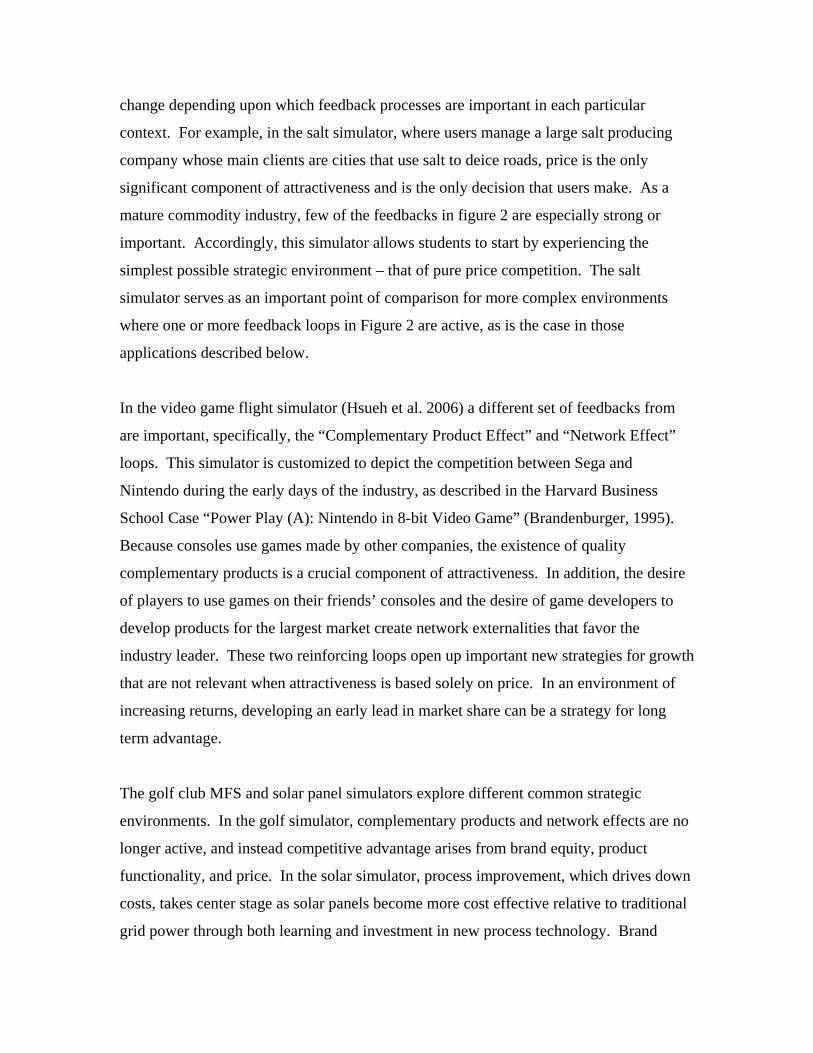
A simplified feedback structure of the drivers of product attractiveness is shown in Figure
2. Competitive interactions are not shown here, although they are also present in the
model and critical to most of the simulators. There are six determinants of product
attractiveness: price, product availability, product functionality, brand equity, network
size, and complement availability. In designing effective strategies, students must use the
feedbacks through these determinants to their advantage, either to expand the total
market, gain market share from competitors, or allocate resources more effectively
(Sterman 2000, ch. 10). Typically, reinforcing feedback loops, such as those through
process improvement and product development, are sources of growth, while balancing
feedback loops, like that through availability, can constrain growth or rebalance resource
allocation. Using this feedback understanding, students can consider the timing of and
tradeoffs among various strategic interventions.
Figure 2: Main feedback loops of Product Attractiveness
Sales
Revenue
MarketingExpense
+
+
+
R1R4 Product
DevelopmentExpense
ProcessDevelopment
Expense+
ProductAttractiveness
+
+
+
+
BrandEquity
Functionality
Unit Cost
ProcessImprovement
Price
-
-
+
++ R2
R3
InstalledBase
NetworkSize
ExpectedMarket Size
Incentives for 3rdParties to
Manufacture YourComplementary
Products
ComplementaryProducts
+
++
+
+
+ComplementAvailability+
+
R5
Backlog
DeliveryDelay
ProductAvailability
+
+ +
-
B1
Royalty
-
EmbracingStandard
+
Brand Equity
Functionality
ProcessImprovement
Network effect
ComplementaryProduct Effect
ProductAvailability
Capacity
DemandCapacity Ratio-
Demand
+
+
B2
Supply andDemand
+
This feedback structure is crucial to the learning objectives of the Industry Evolution
MFS. Because the feedbacks governing competitive advantage and capability
development are complex, each industry application highlights a different subset,
allowing students to understand the role that each can play and how strategy might
change depending upon which feedback processes are important in each particular
context. For example, in the salt simulator, where users manage a large salt producing
company whose main clients are cities that use salt to deice roads, price is the only
significant component of attractiveness and is the only decision that users make. As a
mature commodity industry, few of the feedbacks in figure 2 are especially strong or
important. Accordingly, this simulator allows students to start by experiencing the
simplest possible strategic environment – that of pure price competition. The salt
simulator serves as an important point of comparison for more complex environments
where one or more feedback loops in Figure 2 are active, as is the case in those
applications described below.
In the video game flight simulator (Hsueh et al. 2006) a different set of feedbacks from
are important, specifically, the “Complementary Product Effect” and “Network Effect”
loops. This simulator is customized to depict the competition between Sega and
Nintendo during the early days of the industry, as described in the Harvard Business
School Case “Power Play (A): Nintendo in 8-bit Video Game” (Brandenburger, 1995).
Because consoles use games made by other companies, the existence of quality
complementary products is a crucial component of attractiveness. In addition, the desire
of players to use games on their friends’ consoles and the desire of game developers to
develop products for the largest market create network externalities that favor the
industry leader. These two reinforcing loops open up important new strategies for growth
that are not relevant when attractiveness is based solely on price. In an environment of
increasing returns, developing an early lead in market share can be a strategy for long
term advantage.
The golf club MFS and solar panel simulators explore different common strategic
environments. In the golf simulator, complementary products and network effects are no
longer active, and instead competitive advantage arises from brand equity, product
functionality, and price. In the solar simulator, process improvement, which drives down
costs, takes center stage as solar panels become more cost effective relative to traditional
grid power through both learning and investment in new process technology. Brand
equity, functionality, and availability are also active here. Both of these new simulators
are described in more detail below.
1. Golf Industry Simulator
1.1 Golf Case
The golf MFS is based on the experience of Callaway Golf, beginning immediately
following Callaway’s introduction of the Big Bertha driver in 1991. As described in a
case study developed by Professor Rebecca Henderson (Henderson and Nanda, 2003),
the Big Bertha was an important innovation in the golf industry, allowing players to hit
the ball both straighter and longer compared to traditional drivers. Though priced very
high compared to traditional clubs, the Big Bertha enjoyed immediate success and
Callaway rose from a small entrant to become a prominent player in the premium golf
club market. By 1997, only six years after the introduction of the Big Bertha, revenue
had reached approximately $840 million, sales were growing at a rate of 19% per year in
the US, and Callaway’s share of the golf club market had grown to over 25% (Henderson
and Nanda, 2003; Callaway 1998 Annual Report). In addition, Callaway boasted a strong
brand and a successful record of innovation in product design.
Yet Callaway soon faced significant challenges. Competitors quickly developed similar
products, eating into Callaway’s market share. In addition, around 1998 the market
began to saturate. As is typical with new consumer durables, once the population of
potential adopters purchases a product, sales must eventually decline to the replacement
rate. Callaway was no exception, and the Big Bertha experienced a typical boom and
bust pattern of behavior (Paich and Sterman 1993, Sterman, Henderson, Beinhocker and
Newman 2007). Revenue for 1998 fell 17 percent relative to 1997, Callaway
experienced a net loss for the year (Callaway 1999 Annual Report), and Callaway’s stock
fell 75% (See Figure 3). Although Callaway survived, its days as a high-growth industry
leader were over.
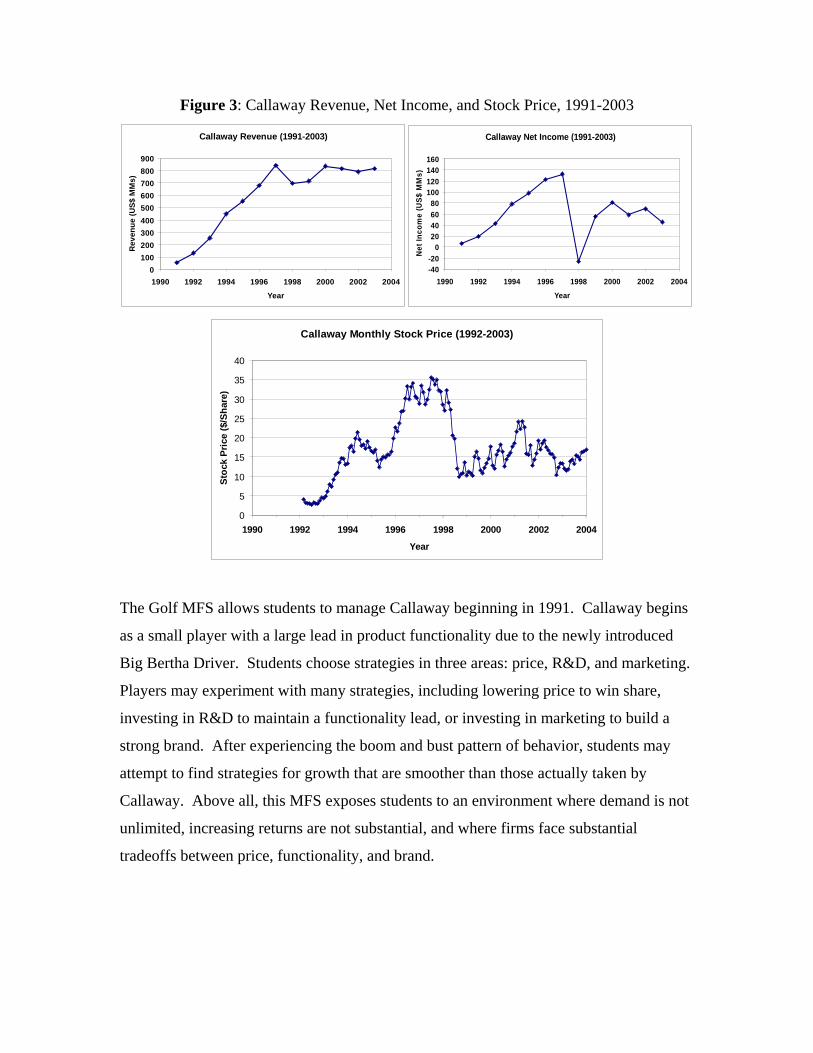
Figure 3: Callaway Revenue, Net Income, and Stock Price, 1991-2003
Callaway Revenue (1991-2003)
0100200300400500600700800900
1990 1992 1994 1996 1998 2000 2002 2004
Year
Rev
enue
(US$
MM
s)Callaway Net Income (1991-2003)
-40-20
020406080
100120140160
1990 1992 1994 1996 1998 2000 2002 2004
Year
Net
Inco
me
(US$
MM
s)
Callaway Monthly Stock Price (1992-2003)
0
5
10
15
20
25
30
35
40
1990 1992 1994 1996 1998 2000 2002 2004
Year
Stoc
k Pr
ice
($/S
hare
)
The Golf MFS allows students to manage Callaway beginning in 1991. Callaway begins
as a small player with a large lead in product functionality due to the newly introduced
Big Bertha Driver. Students choose strategies in three areas: price, R&D, and marketing.
Players may experiment with many strategies, including lowering price to win share,
investing in R&D to maintain a functionality lead, or investing in marketing to build a
strong brand. After experiencing the boom and bust pattern of behavior, students may
attempt to find strategies for growth that are smoother than those actually taken by
Callaway. Above all, this MFS exposes students to an environment where demand is not
unlimited, increasing returns are not substantial, and where firms face substantial
tradeoffs between price, functionality, and brand.
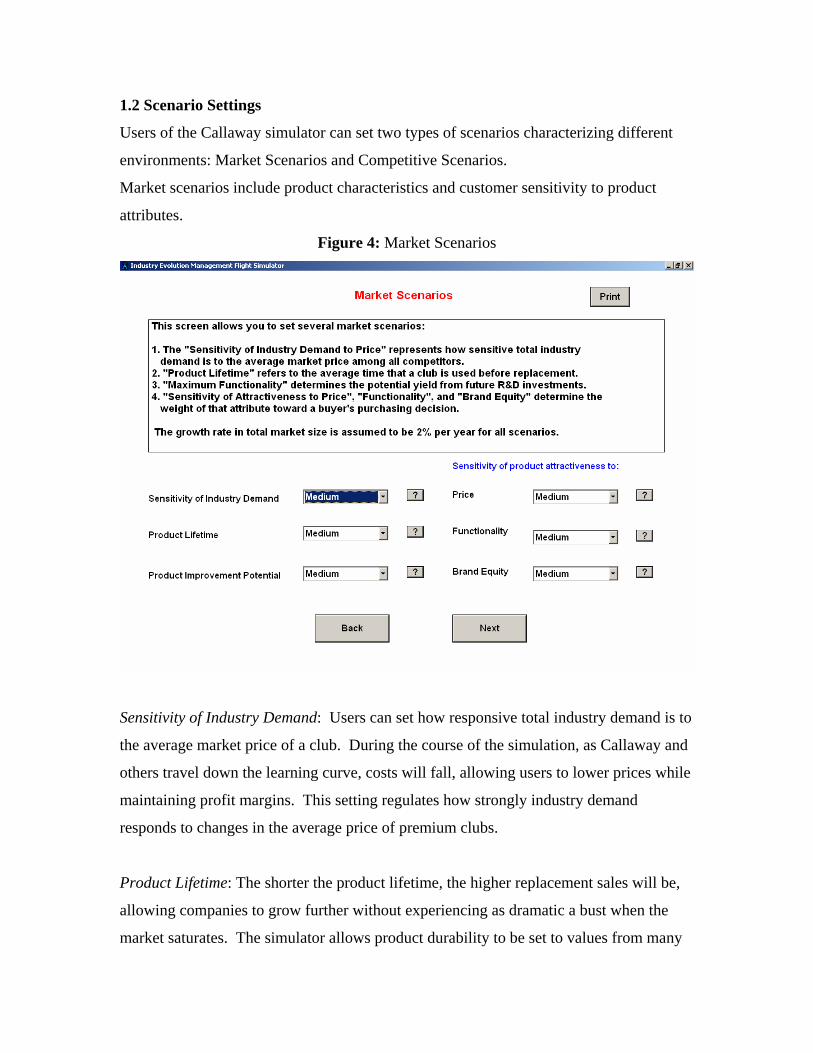
1.2 Scenario Settings
Users of the Callaway simulator can set two types of scenarios characterizing different
environments: Market Scenarios and Competitive Scenarios.
Market scenarios include product characteristics and customer sensitivity to product
attributes.
Figure 4: Market Scenarios
Sensitivity of Industry Demand: Users can set how responsive total industry demand is to
the average market price of a club. During the course of the simulation, as Callaway and
others travel down the learning curve, costs will fall, allowing users to lower prices while
maintaining profit margins. This setting regulates how strongly industry demand
responds to changes in the average price of premium clubs.
Product Lifetime: The shorter the product lifetime, the higher replacement sales will be,
allowing companies to grow further without experiencing as dramatic a bust when the
market saturates. The simulator allows product durability to be set to values from many
years to “18 holes”—while unrealistic, the short lifetime lets students compare how the
dynamics of durables differ from those of consumable products.
Product Improvement Potential: If improvement potential is high R&D investment can
yield new innovations in product functionality; if consumers value such improvements,
investments in R&D can build competitive advantage. On the other hand, if
improvement potential is low, R&D investment is not likely to be of much benefit.
Although the Big Bertha was an important innovation that introduced substantial new
functionality, in general the improvement potential of golf clubs is limited.
Sensitivity of Product Attractiveness to Price, Functionality & Brand Equity: These three
parameters allow students to change consumer preferences and thus the response of
market share to these key drivers of product attractiveness. The relative weights of price,
functionality and brand equity in consumers’ buying decisions may influence where
companies should invest.
Competitive scenarios include competitor strategies and the strength of functionality
spillovers. Many innovations in the premium golf market were rapidly imitated by
competitors, including the large head, exotic materials (Titanium, carbon fiber shafts,
etc.).
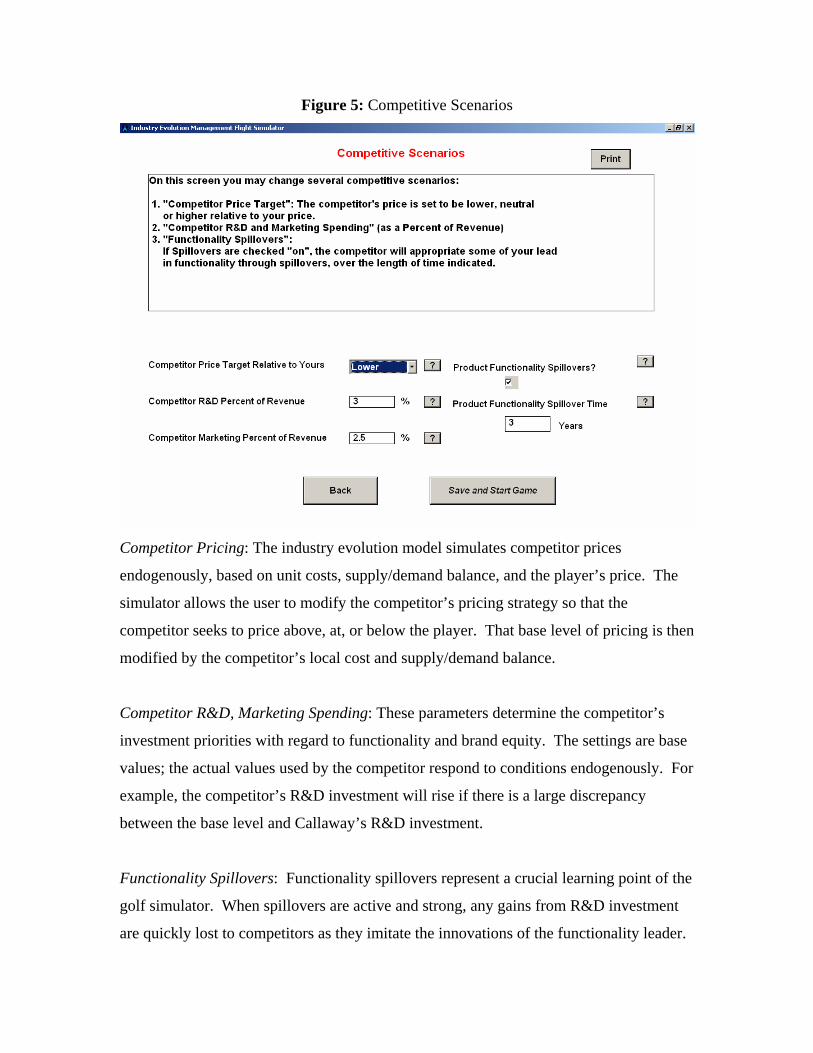
Figure 5: Competitive Scenarios
Competitor Pricing: The industry evolution model simulates competitor prices
endogenously, based on unit costs, supply/demand balance, and the player’s price. The
simulator allows the user to modify the competitor’s pricing strategy so that the
competitor seeks to price above, at, or below the player. That base level of pricing is then
modified by the competitor’s local cost and supply/demand balance.
Competitor R&D, Marketing Spending: These parameters determine the competitor’s
investment priorities with regard to functionality and brand equity. The settings are base
values; the actual values used by the competitor respond to conditions endogenously. For
example, the competitor’s R&D investment will rise if there is a large discrepancy
between the base level and Callaway’s R&D investment.
Functionality Spillovers: Functionality spillovers represent a crucial learning point of the
golf simulator. When spillovers are active and strong, any gains from R&D investment
are quickly lost to competitors as they imitate the innovations of the functionality leader.
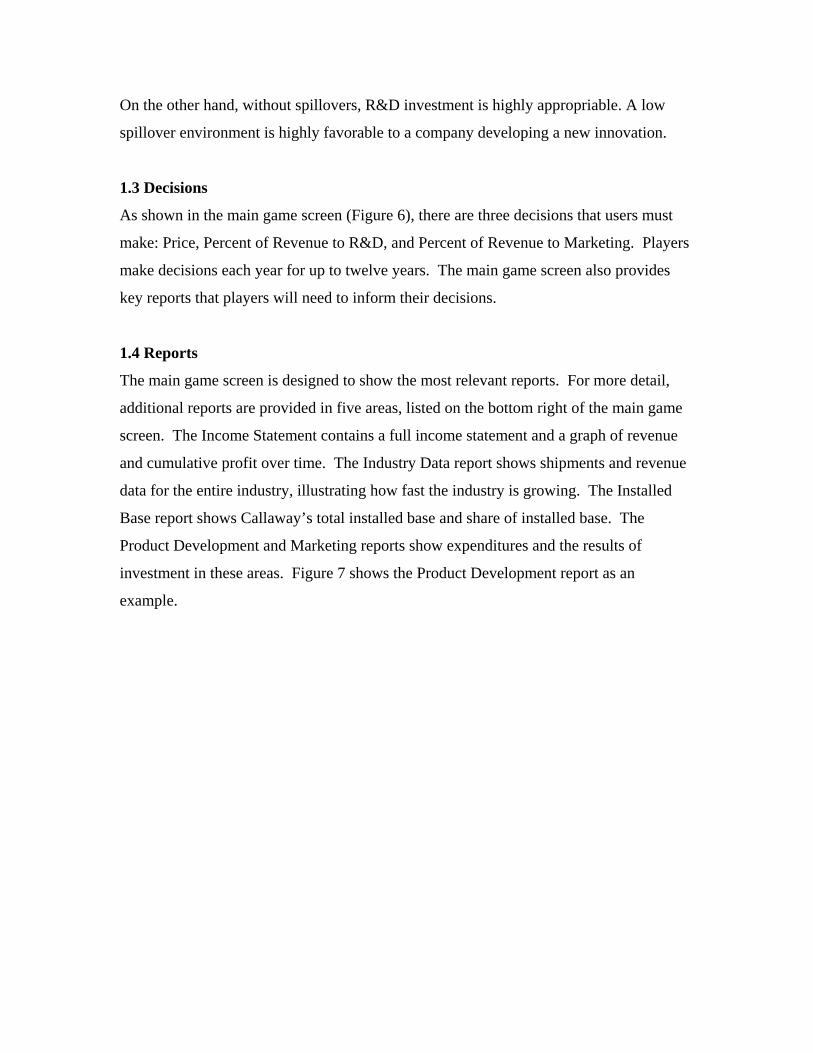
On the other hand, without spillovers, R&D investment is highly appropriable. A low
spillover environment is highly favorable to a company developing a new innovation.
1.3 Decisions
As shown in the main game screen (Figure 6), there are three decisions that users must
make: Price, Percent of Revenue to R&D, and Percent of Revenue to Marketing. Players
make decisions each year for up to twelve years. The main game screen also provides
key reports that players will need to inform their decisions.
1.4 Reports
The main game screen is designed to show the most relevant reports. For more detail,
additional reports are provided in five areas, listed on the bottom right of the main game
screen. The Income Statement contains a full income statement and a graph of revenue
and cumulative profit over time. The Industry Data report shows shipments and revenue
data for the entire industry, illustrating how fast the industry is growing. The Installed
Base report shows Callaway’s total installed base and share of installed base. The
Product Development and Marketing reports show expenditures and the results of
investment in these areas. Figure 7 shows the Product Development report as an
example.
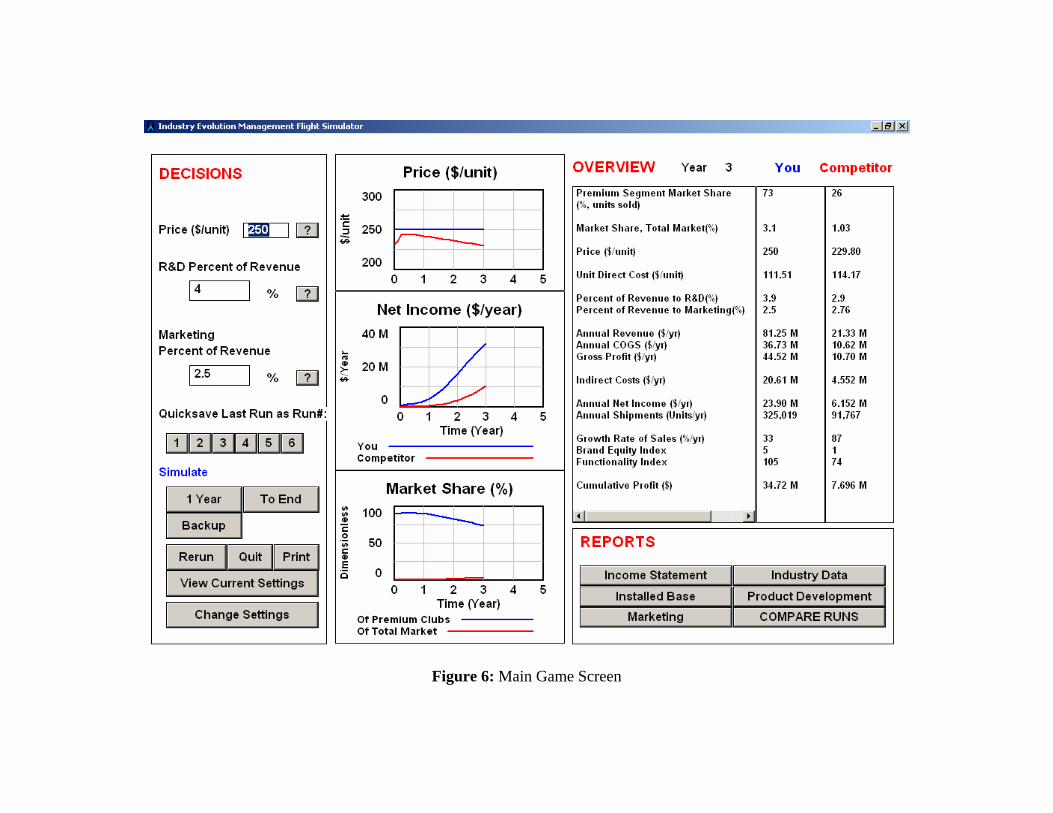
Figure 6: Main Game Screen
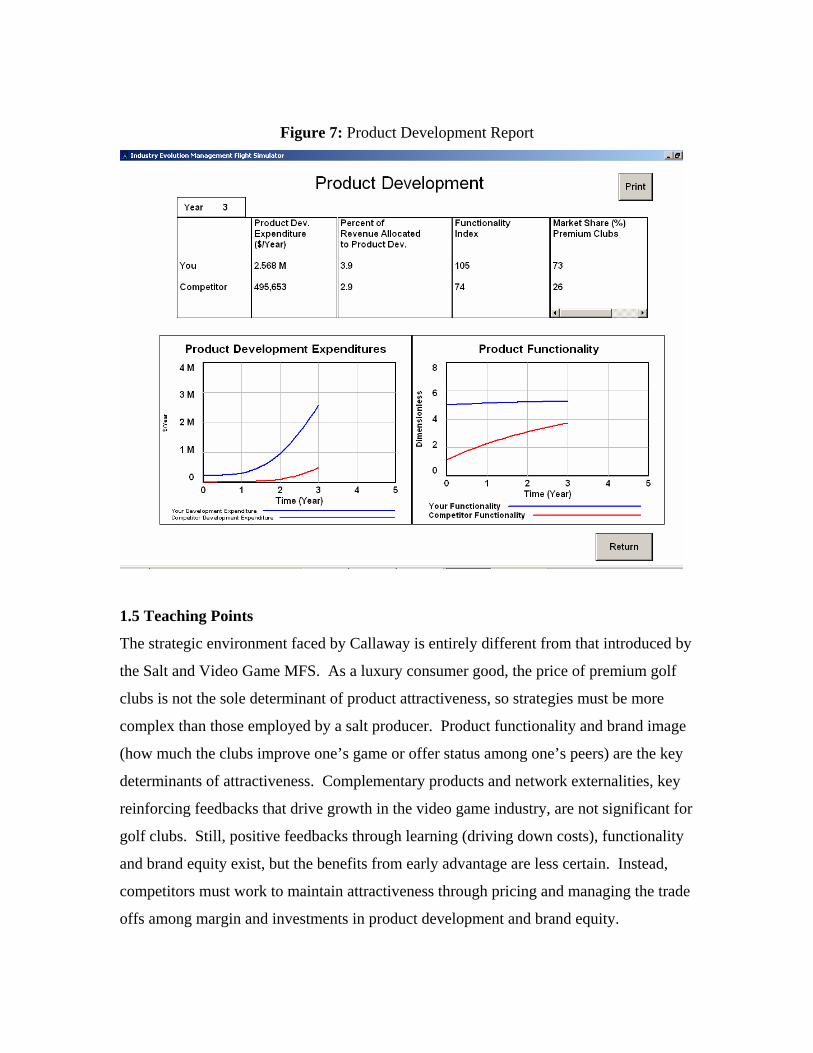
Figure 7: Product Development Report
1.5 Teaching Points
The strategic environment faced by Callaway is entirely different from that introduced by
the Salt and Video Game MFS. As a luxury consumer good, the price of premium golf
clubs is not the sole determinant of product attractiveness, so strategies must be more
complex than those employed by a salt producer. Product functionality and brand image
(how much the clubs improve one’s game or offer status among one’s peers) are the key
determinants of attractiveness. Complementary products and network externalities, key
reinforcing feedbacks that drive growth in the video game industry, are not significant for
golf clubs. Still, positive feedbacks through learning (driving down costs), functionality
and brand equity exist, but the benefits from early advantage are less certain. Instead,
competitors must work to maintain attractiveness through pricing and managing the trade
offs among margin and investments in product development and brand equity.
The Golf MFS also offers important lessons regarding the management of a new
technological innovation. Players can experiment with scenarios and strategies that
might mitigate the extent of the boom and bust dynamics characteristic of popular
durable goods. For example, less aggressive pricing or investment in brand or
functionality may slow initial growth and lessen the magnitude of the eventual sales
slump. When the product lifetime is long or the potential for new functionality is low,
students will see that the potential for a large sales bust is even greater. Finally, in this
simulator students can learn how various product characteristics, including improvement
potential and the strength of spillovers, can influence the choice of strategy regarding
R&D investment. When spillovers are strong, students may choose to focus investments
more in other areas or improve margins.
Ultimately, in recreating the experience of Callaway during the 1990s, some degree of
boom and bust may be unavoidable. Specialty golf clubs are relatively long-lived,
diffuse in a well-defined market with modest overall growth, and have low improvement
potential with high vulnerability to innovation spillovers. In such an environment, the
returns to R&D investment are not likely to be large, and growth past the initial boom
years may well be difficult. Recognizing these facts is an important lesson for students,
and one that could lead to more robust strategies surrounding the introduction of new
products.
2. Solar Industry Simulator
2.1 Solar Case
The Solar Photovoltaic MFS is designed to highlight the dynamics of learning curves and
knowledge spillovers in a rapidly growing industry. The simulator is designed around an
original case study focusing on SunPower Corp. (Henderson, Conkling and Roberts
2007). SunPower was founded in 1987 by a Stanford engineering professor, and
originally focused on solar concentrator technology before switching to flat panel
designs. Following the formation of a partnership with Cypress semiconductor,
commercial production began in late 2004 and the company went public in 2005.
SunPower has grown substantially, with sales rising from $6 million in 2004 to more than
$220 million in 2006. A large part of this success can be attributed to SunPower’s
industry leading technology: based on its earlier expertise in solar concentrator
technology, the company currently has the most efficient panels in the industry
(efficiency is defined as the proportion of solar energy converted into electricity).
SunPower’s unique technology also gives its panels an appealing ‘all black’ aesthetic.
Unlike the Callaway simulator, where students replay the events of history, in this case
decisions are made starting in 2007. Students experience the same uncertainty facing
industry executives today. For SunPower, these strategic challenges are numerous.
Despite the company’s current technology lead, as industry profitability increases and
growth continues this lead may become vulnerable to improvements by much larger
competitors or by further innovations from new entrants (Henderson, Conkling &
Roberts, 2007). A number of formidable competitors exist today, including Sharp (26%
of the market), Q-Cells, REC Group, and First Solar. In addition, SunPower’s
technology lead also brings with it the disadvantage of a more complex and costly
manufacturing process, placing an increased importance on process investment. Faced
with all of these challenges, SunPower must devise a strategy to convert its technology
lead into a sustainable competitive advantage.
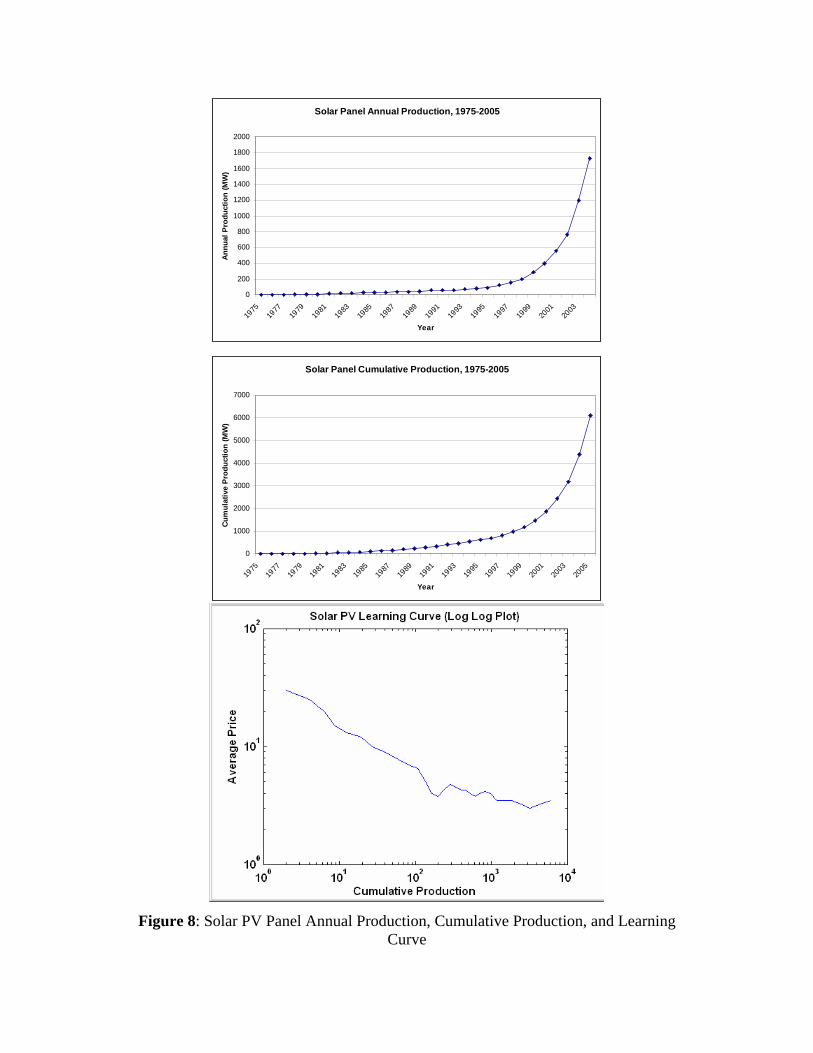
In addition to posing an interesting strategic challenge, the Solar MFS also serves to
introduce students to an industry that is socially relevant. The threat of global warming is
well known, and solar panels present a promising alternative to traditional carbon-based
energy production. Although historically solar panels have been used mainly in remote,
“off the grid” locations due to their high cost, rapidly declining costs make solar
competitive with grid power in more and more traditional applications, and there now
exists a realistic possibility that solar power will become cost competitive with grid
power. Solar PV production worldwide is growing at roughly 30%/year, and the solar
PV industry learning curve is estimated to generate a 20% reduction in unit costs with
each doubling of cumulative production (See Figure 8). As costs fall and demand for
solar power rises,
Solar Panel Annual Production, 1975-2005
0
200
400
600
800
1000
1200
1400
1600
1800
2000
1975
1977
1979
1981
1983
1985
1987
1989
1991
1993
1995
1997
1999
2001
2003
Year
Annu
al P
rodu
ctio
n (M
W)
Solar Panel Cumulative Production, 1975-2005
0
1000
2000
3000
4000
5000
6000
7000
1975
1977
1979
1981
1983
1985
1987
1989
1991
1993
1995
1997
1999
2001
2003
2005
Year
Cum
ulat
ive
Prod
uctio
n (M
W)
Figure 8: Solar PV Panel Annual Production, Cumulative Production, and Learning
Curve
all producers of solar panels stand to gain. Thus, in addition to exploring SunPower’s
individual fate, by using the Solar MFS students will develop an understanding of the
dynamics facing the industry as a whole, including the huge potential for profit and the
possible social benefits that this industry will bring.
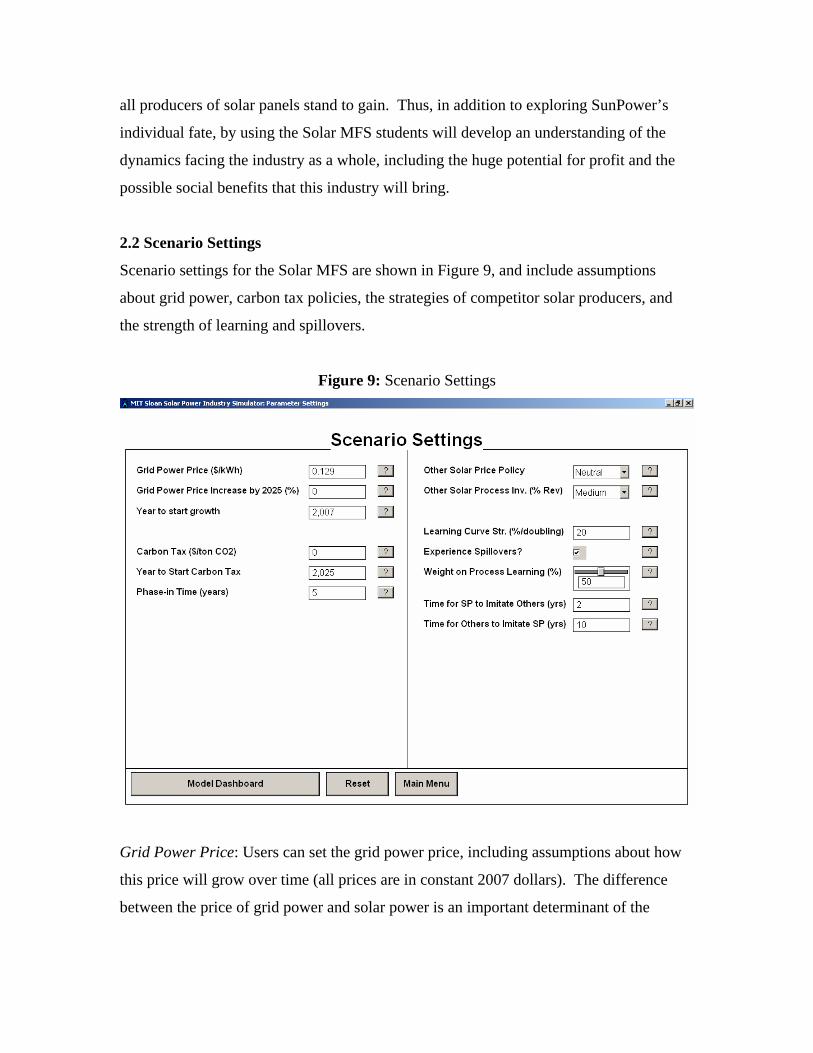
2.2 Scenario Settings
Scenario settings for the Solar MFS are shown in Figure 9, and include assumptions
about grid power, carbon tax policies, the strategies of competitor solar producers, and
the strength of learning and spillovers.
Figure 9: Scenario Settings
Grid Power Price: Users can set the grid power price, including assumptions about how
this price will grow over time (all prices are in constant 2007 dollars). The difference
between the price of grid power and solar power is an important determinant of the

demand for solar panels, and achieving grid parity is seen as a major milestone for the
industry.
Carbon Tax Policy: It is likely that carbon-based energy will become more costly as
policies to reduce greenhouse gas emissions come into force. Such policies include cap-
and-trade programs or carbon taxes. For simplicity, we represent all such policies via a
carbon tax (the cost increase in traditional electricity caused by any cap and trade
program has the same impact on the competitiveness of solar PV as a tax). Users can test
various assumptions regarding the implementation of carbon taxes, including the amount
of the tax, the year that it starts, and the duration of any phase-in time. Clearly, a carbon
tax will help the solar industry by raising the price of grid power.
Competitive Scenarios: Users set two key aspects governing the behavior of the
competitors SunPower faces: pricing strategy, and investment in process improvement.
First, how aggressively do the competitors price relative to their costs (that is, how
aggressively to the competitors pursue learning curve pricing to gain market share)?
Second, how much do competitors invest in process improvement that can speed cost
reduction over and above the rate at which costs decline through learning-by-doing. The
strategy of SunPower’s competitors can influence SunPower’s strategy: in particular,
SunPower may choose to avoid a price war if competitors are pricing aggressively, or
seek to move down the learning curve first if they are not.
Learning and Spillovers: The strength of the learning curve refers to how much unit
production costs fall with each doubling of cumulative experience. In addition, a certain
percentage of firm learning comes from direct process investment (this decision is made
each year from the simulator dashboard). Finally, the presence and strength of
knowledge spillovers can be adjusted by setting the relevant time constants. All together,
these scenarios influence how much investment in direct process improvement SunPower
may want to make.
2.3 Decisions

The simulator dashboard is shown in Figure 10. Users make two decisions each period
(year): price and the percentage of revenue allocated to process investment. Price can be
set either manually, or by using a decision rule. The decision rules allow the game to be
played rapidly. The two decision rules set price at a certain markup over unit costs or
over the average competitor’s price. These rules allow the player to explore rapidly the
effectiveness of different pricing strategies, including aggressive learning-curve pricing
based on unit costs, aggressive responses to competitors to protect market share, or
pricing to protect gross margins and provide funds for investment in process technology.
As in the Callaway simulator, the dashboard also contains the most relevant reports.
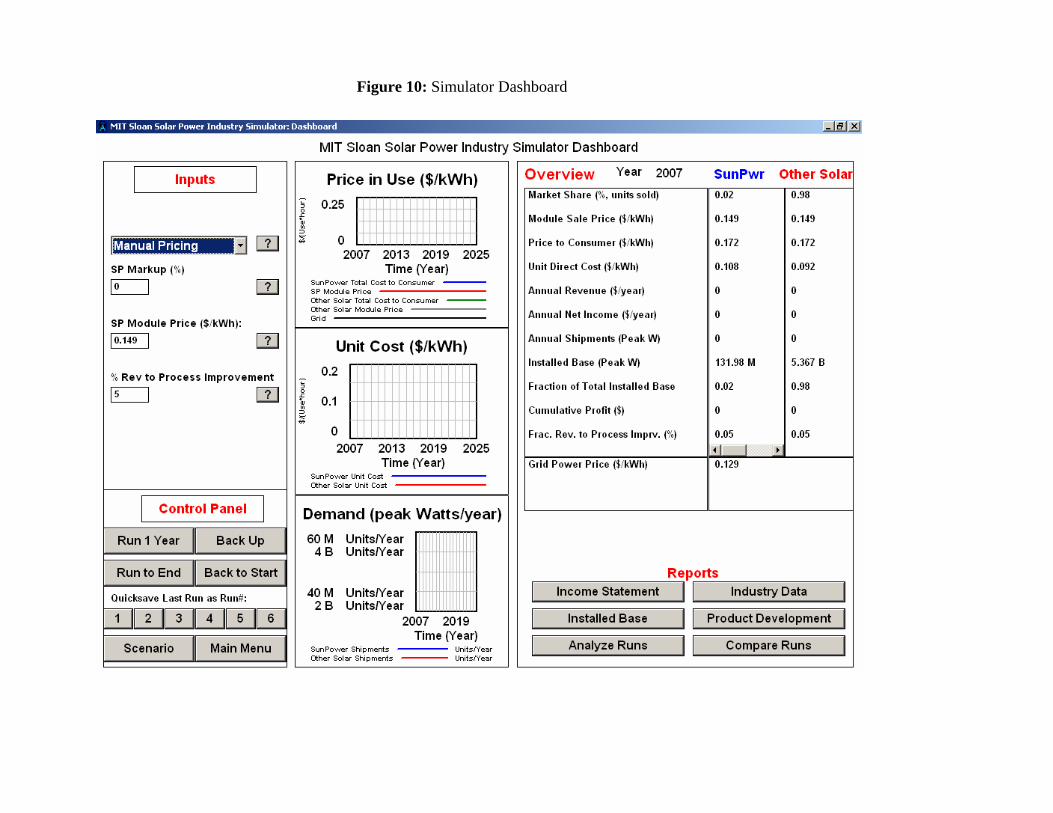
Figure 10: Simulator Dashboard
2.4 Reports
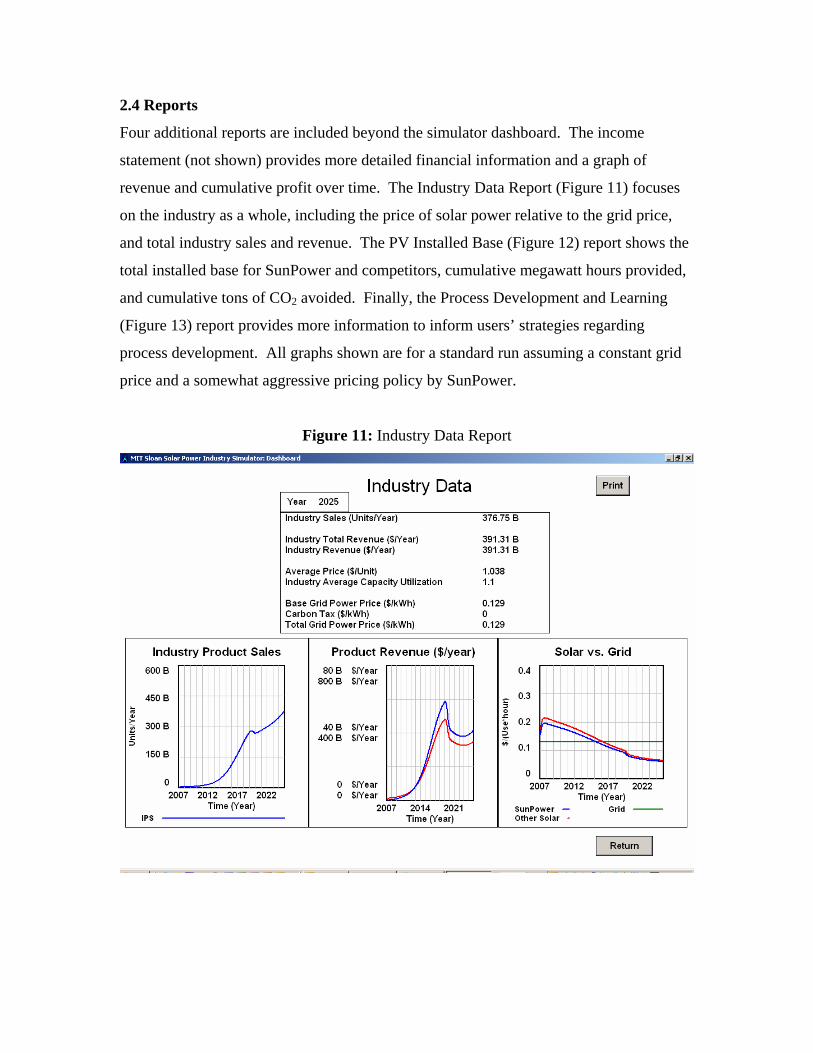
Four additional reports are included beyond the simulator dashboard. The income
statement (not shown) provides more detailed financial information and a graph of
revenue and cumulative profit over time. The Industry Data Report (Figure 11) focuses
on the industry as a whole, including the price of solar power relative to the grid price,
and total industry sales and revenue. The PV Installed Base (Figure 12) report shows the
total installed base for SunPower and competitors, cumulative megawatt hours provided,
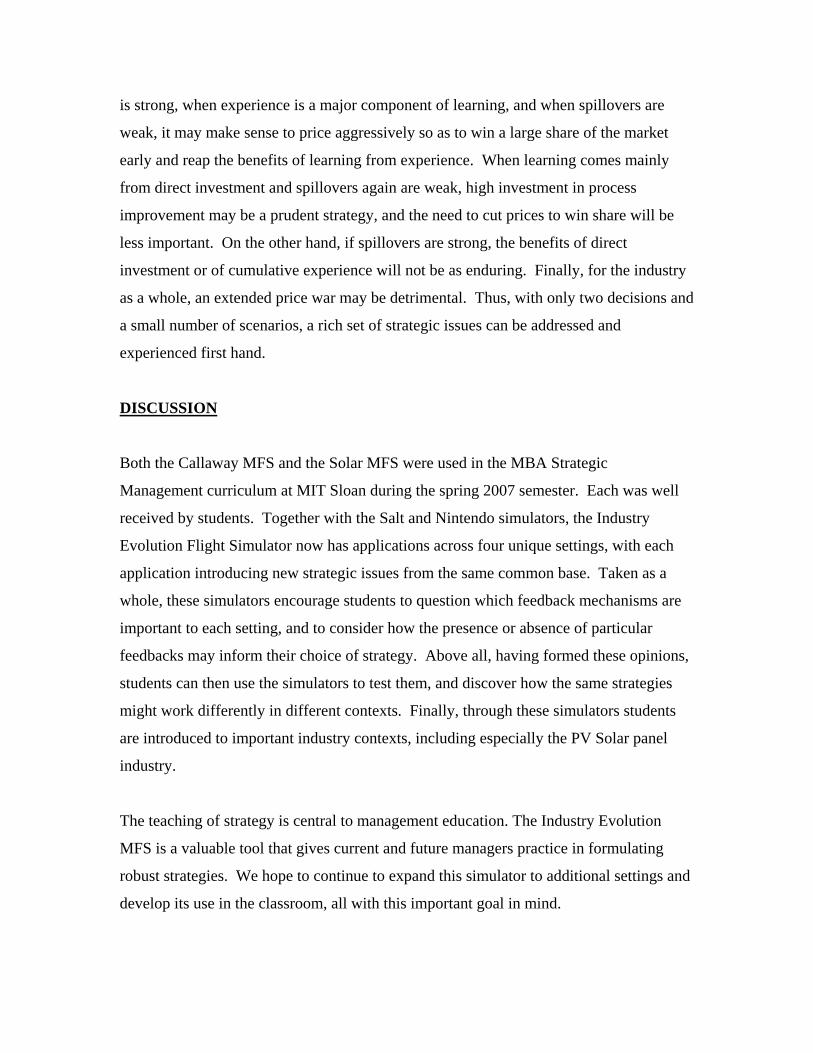
and cumulative tons of CO2 avoided. Finally, the Process Development and Learning
(Figure 13) report provides more information to inform users’ strategies regarding
process development. All graphs shown are for a standard run assuming a constant grid
price and a somewhat aggressive pricing policy by SunPower.
Figure 11: Industry Data Report
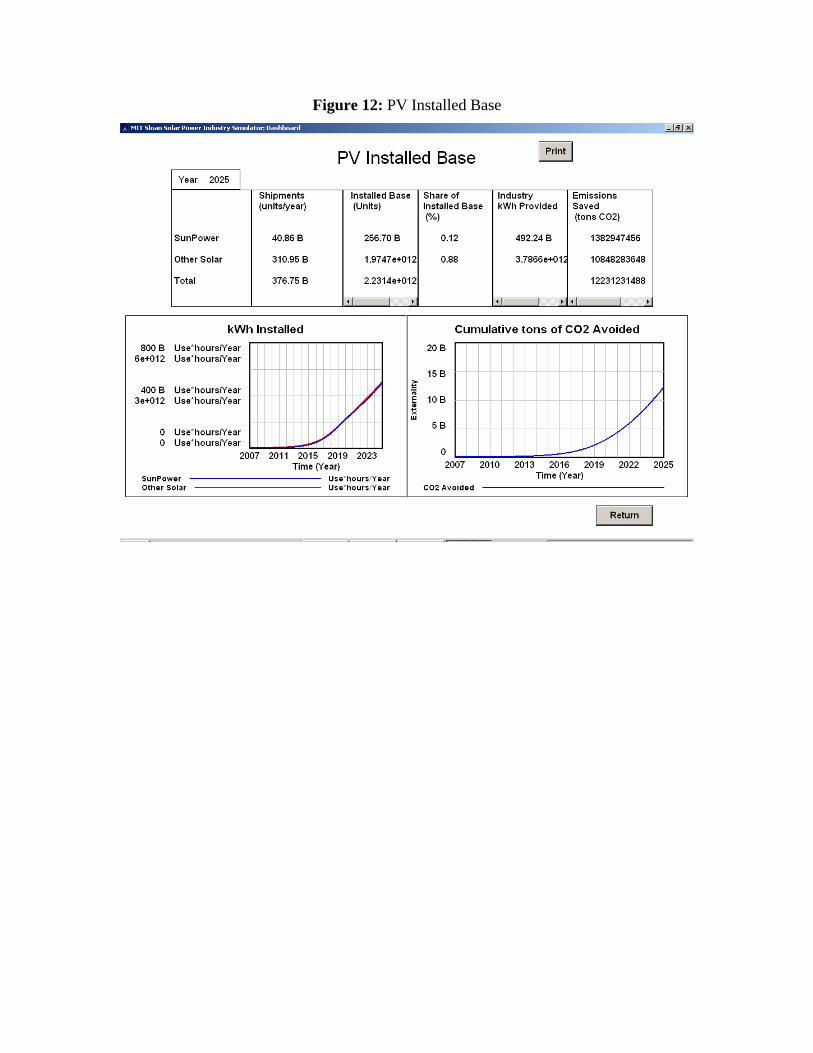
Figure 12: PV Installed Base
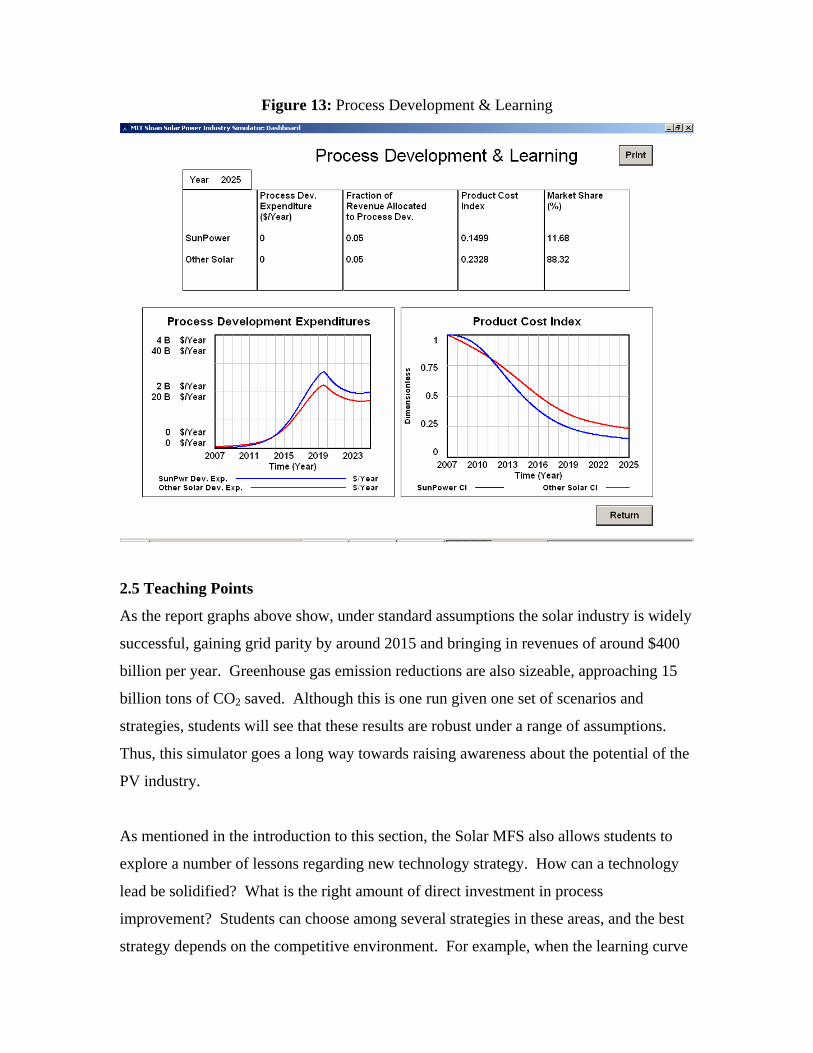
Figure 13: Process Development & Learning
2.5 Teaching Points
As the report graphs above show, under standard assumptions the solar industry is widely
successful, gaining grid parity by around 2015 and bringing in revenues of around $400
billion per year. Greenhouse gas emission reductions are also sizeable, approaching 15
billion tons of CO2 saved. Although this is one run given one set of scenarios and
strategies, students will see that these results are robust under a range of assumptions.
Thus, this simulator goes a long way towards raising awareness about the potential of the
PV industry.
As mentioned in the introduction to this section, the Solar MFS also allows students to
explore a number of lessons regarding new technology strategy. How can a technology
lead be solidified? What is the right amount of direct investment in process
improvement? Students can choose among several strategies in these areas, and the best
strategy depends on the competitive environment. For example, when the learning curve
is strong, when experience is a major component of learning, and when spillovers are
weak, it may make sense to price aggressively so as to win a large share of the market
early and reap the benefits of learning from experience. When learning comes mainly
from direct investment and spillovers again are weak, high investment in process
improvement may be a prudent strategy, and the need to cut prices to win share will be
less important. On the other hand, if spillovers are strong, the benefits of direct
investment or of cumulative experience will not be as enduring. Finally, for the industry
as a whole, an extended price war may be detrimental. Thus, with only two decisions and
a small number of scenarios, a rich set of strategic issues can be addressed and
experienced first hand.
DISCUSSION
Both the Callaway MFS and the Solar MFS were used in the MBA Strategic
Management curriculum at MIT Sloan during the spring 2007 semester. Each was well
received by students. Together with the Salt and Nintendo simulators, the Industry
Evolution Flight Simulator now has applications across four unique settings, with each
application introducing new strategic issues from the same common base. Taken as a
whole, these simulators encourage students to question which feedback mechanisms are
important to each setting, and to consider how the presence or absence of particular
feedbacks may inform their choice of strategy. Above all, having formed these opinions,
students can then use the simulators to test them, and discover how the same strategies
might work differently in different contexts. Finally, through these simulators students
are introduced to important industry contexts, including especially the PV Solar panel
industry.
The teaching of strategy is central to management education. The Industry Evolution
MFS is a valuable tool that gives current and future managers practice in formulating
robust strategies. We hope to continue to expand this simulator to additional settings and
develop its use in the classroom, all with this important goal in mind.
References
Brandenburger, Adam (1995). Power Play (A): Nintendo in 8-bit Video Games, Harvard Business School Case 9-795-102. Henderson, Rebecca and Nanda, Ramana (January, 2005). Case Study: Callaway Golf and the Big Bertha, MIT Mimeo. Henderson, Rebecca, Conkling, Joel and Roberts, Scott (2007). SunPower: Focused on the Future of Solar Power, MIT Mimeo. Hsueh, Joe, Gokhan Dogan and John D. Sterman (2006). Teaching Strategic Management with the Industry Evolution Flight Simulator. Proceedings of the 2006 International Conference of the System Dynamics Society. Kahneman, D., Slovic, P. and Tversky, A. (1982). Judgment Under Uncertainty Heuristics and Biases, Cambridge University Press, Cambridge, MA. Paich, M. and J. D. Sterman (1993). "Boom, Bust, and Failures to Learn in Experimental Markets." Management Science 39(12): 1439-1458. Plous, Scott (1993). The Psychology of Judgment and Decision Making. McGaw-Hill. Simon, H. A. (1979). Rational Decision-making in Business Organizations, American Economic Review, 69: 493-513. Sterman, J. (2000). Business Dynamics: Systems Thinking for a Complex World. Irwin/McGraw-Hill. Sterman, J. D., R. Henderson, E. Beinhocker, L. Newman (2007). "Getting Big Too Fast: Strategic Dynamics with Increasing Returns and Bounded Rationality." Management Science 53(4): 683-696.