Extended Producer Responsibility Schemes and their ...€¦ · more difficult to disassemble, ......
103
Project co‐funded by European Union funds (ERDF, IPA) www.interreg‐danube.eu/moveco Extended Producer Responsibility Schemes and their influence on innovation in the TransDanube region MOVECO PROJECT Mobilising Institutional Learning for Better Exploitation of Research and Innovation for the Circular Economy Deliverable: D.3.1.3 Date: December 2017 Prepared by Antonia Bozic Cerar, CCIS and Tina Krošelj, MESP
Transcript of Extended Producer Responsibility Schemes and their ...€¦ · more difficult to disassemble, ......

Projectco‐fundedbyEuropeanUnionfunds(ERDF,IPA)www.interreg‐danube.eu/moveco
Extended Producer Responsibility
Schemes and their influence on
innovation in the TransDanube region
MOVECO PROJECT
Mobilising Institutional Learning for
Better Exploitation of Research and
Innovation for the Circular Economy
Deliverable: D.3.1.3
Date: December 2017
Prepared by Antonia Bozic Cerar, CCIS and Tina Krošelj, MESP

2Projectco‐fundedbyEuropeanUnionfunds(ERDF,IPA)www.interreg‐danube.eu/moveco
2
Acknowledgement: This report was prepared on the basis of the national reports
prepared by MOVECO project partners: Chamber of Commerce and Industry of
Slovenia, Chamber of Commerce and Industry Bistrita-Nasaud, Slovak University of
Agriculture in Nitra Ministry of the Environment and Spatial Planning of the Republic
of Slovenia, Tera Tehnopolis Ltd. Croatia, Bulgarian Chamber of Commerce and
Industry, Slovak Business Agency, Europa Consortium Regional Development Non-
profit Ltd., Business Upper Austria, Cluster of Environmental Technology Bavaria,
Bavarian Research Alliance GmbH and Institute Mihajlo Pupin Serbia
Disclaimer: The information and views set out in this publication are those of the
project partners of the MOVECO project and do not necessarily reflect the official
opinion of the European Union/Danube Transnational Programme. Neither the
European Union/Danube Transnational Programme institutions and bodies nor any
person acting on their behalf may be held responsible for the use, which may be
made of the information contained therein.
3Projectco‐fundedbyEuropeanUnionfunds(ERDF,IPA)www.interreg‐danube.eu/moveco
3
Contents
Executive summary ............................................................................................................................................................. 6
Introduction ........................................................................................................................................................................... 19
Methodology .......................................................................................................................................................................... 22
EU characteristics and legislation for extended producer responsibility ........................... 26
Current legislation ........................................................................................................................................................ 26
Proposed future legislation .................................................................................................................................. 31
Environment and Innovation indicators ......................................................................................................... 37
Country characteristics.................................................................................................................................................. 52
Existing EPR schemes, practice and their effect on innovation in Group 1 ............... 53
Existing EPR schemes, practice and their effect on innovation in group 2 ................ 67
Existing EPR schemes, practice and their effect on innovation in group 3 ................ 83
References ......................................................................................... Fehler! Textmarke nicht definiert.
Annex I…………………………………………………………………………………………………………………………………………………………………….97

4Projectco‐fundedbyEuropeanUnionfunds(ERDF,IPA)www.interreg‐danube.eu/moveco
4
Abbreviations B&A Batteries and Accumulators
B2B Business to Business
BMUB German Federal Ministry for the Environment, Nature Conservation,
Building and Nuclear Safety
DE Domestic extraction
DfE Design for Environment or eco-design
DMC Domestic Material Consumption
DMI Direct Material Input
DR Danube Region
DTP Danube Transnational Programme
EC European Community
EEA European Environmental Agency
EEE Electrical and Electronic Equipment
EEE Electrical and electronic equipment
EIR Environmental Implementation Review
EMEPA Enterprise for Management of Environmental Protection activities
EPR Extended Producer Responsibility
ERA Elektro Recycling Austria GmbH
EU European Union
EW-MFA Economy-wide material flow accounts
GDP Gross Domestic Product
NTCA Customs Administration of Hungary
NTCA National Tax and Customs Administration of Hungary
OECD Organisation for Economic Co-operation and Development
OEM Original Equipment Manufacturers
PPW Packaging and Packaging Waste
PRO Producer Responsibility Organisation
R&D Research and Development

5Projectco‐fundedbyEuropeanUnionfunds(ERDF,IPA)www.interreg‐danube.eu/moveco
5
REACH Registration, Evaluation, Authorisation of Chemicals
RoHS Restriction of Hazardous Substances
SDI Sustainable Development Indicators
SME Small and Medium-Sized Enterprise
WEEE Waste Electronic and Electrical Equipment
6Projectco‐fundedbyEuropeanUnionfunds(ERDF,IPA)www.interreg‐danube.eu/moveco
6
Executive summary There is no doubt that existing EU legislation has enforced an increase in collection
and recycling rates of common, predominantly consumer induced waste streams
such as packaging waste, electrical and electronic equipment, batteries and
accumulators. Despite improved management and successful implementation of
waste management legislation, it is not a match for the rise in new products, differing
in format, material or combinations of materials and formats, which are increasingly
more difficult to disassemble, reuse and recycle, by design.
Extended producer responsibility (EPR), a strategy to support better design for
managing post-consumer waste streams has fallen short of this objective, with no
incentives to support better product design for better resource management, in line
with the proposed new circular economy legislative package currently under
discussion at EU level.
After over twenty years, extended producer responsibility has again fallen under the
scrutiny of the European commission, as an opportunity and measure to support
better design, innovation and eco-innovation. This should support the transition
towards a more sustainable economy, where material resources are kept in the
economy as long as possible, through greater product longevity and durability,
material and component reuse and recycling and phasing out of disposal, either
through landfill or incineration.
The new, draft legislative package currently being discussed in EU institutions,
supporting the transition towards a more circular way of production and
consumption offers some ground rules, which address some common problems that
have been identified in a number of studies on EPR and the shortcomings of this
approach.
A general observation of the EPR systems existing in the Danube region is that the
system seems to be less complicated and more straightforward for electrical and
7Projectco‐fundedbyEuropeanUnionfunds(ERDF,IPA)www.interreg‐danube.eu/moveco
7
electronic equipment, while the approach to packaging EPR systems is more
diversified. Eco-design for electronic and electrical equipment is supported by the
eco-design directive, which enforces some technical eco-design measures and
requirements through its implementation acts. The Waste Electronic and Electrical
Equipment (WEEE) directive and the Restriction of Hazardous Substances (RoHS)
directive have been reviewed and updated recently, enforcing more unified
approaches, which ensure greater consistency and predictability of how the systems
work in each member state.
The packaging directive on the other hand is quite old (1994) and seems not to have
kept up with the evolving packaging market and rapid development of new
materials and packaging solutions. The EU has announced it will present a plastics’
strategy to address some of the main environmental issues regarding plastics and
plastic packaging by the end of 2017.
The EPR systems are evolving to include separate registration and coordination
points i.e. clearing houses to coordinate and manage the flow of materials and
money through the collective, competitive producer responsibility organisations as
well as compliance of companies.
It is surprising that in the age of the internet, it can be very difficult to get adequate
information on the workings of individual country schemes. There are some
examples of good practice within the DR in this regard, with the Eko-kom scheme
for packaging and packaging waste from the Czech Republic, which is an exception
to the rule and offers the most transparency with regard to requirements producers,
must fulfil and how its system operates. In Hungary, the system has just been
overhauled, and it is very difficult to get information in English, to inform small and
medium enterprises (SMEs), wishing to enter the market from other countries of their
obligations and the potential costs to fulfil these obligations. Without our project
partner in Hungary, it would have been more difficult to obtain information. This
implies that SMEs wishing to enter the market would also need good partners in
Hungary to inform them of their obligations and help them comply with them. This
8Projectco‐fundedbyEuropeanUnionfunds(ERDF,IPA)www.interreg‐danube.eu/moveco
8
is an observation, which is more or less valid also in other Danube region countries.
Business support organisations can offer valuable guidance on legislation to SMEs; a
good example is the information on legislative requirements offered on the website
of the Austrian Chamber of Commerce.
Even where information is provided in English, it may be the safest bet for SMEs to
work with state licensed producer responsibility organisations in order to be sure all
administrative requirements are being fulfilled; i.e. in Croatia where the EPR system
works through the environmental fund. Though a lot of information is provided in
English on the Fund’s website, some of the more practical details are still missing.
Two organisations, which cannot legally obtain status as Producer Responsibility
Organisations (PRO), due to legislation, offer services to ensure SMEs can be sure of
their compliance.
The different systems from country to country can certainly be perceived as an
obstacle for SMEs wishing to expand their business within the region. The
overwhelming administrative demands can overshadow any incentives for eco-
design or design for the circular economy.
According to a recent publicationi prepared by the European Environmental Agency,
titled Monitoring progress towards a circular economy, there is, at present, no
recognised way of measuring how effective the EU, a country or even a company is
in making the transition towards a circular economy, nor are there holistic
monitoring tools for supporting such a process.
In this overview, we looked at indicators used in the EU Environmental
Implementation Review (EIR) packageii, such as Domestic Material Consumption
(DMC), resource productivity, waste generation and waste management.
For innovation we referred to the innovation and eco-innovation scoreboards.

9Projectco‐fundedbyEuropeanUnionfunds(ERDF,IPA)www.interreg‐danube.eu/moveco
9
Fig. 4 Innovation ranking published in 2017iii.
The innovation scoreboard prepared in 2017 ranked Germany amongst innovation
leaders, Austria and Slovenia amongst strong innovators, with the Czech republic
being ranked at the top of moderate innovators, followed by Slovakia, Hungary,
Serbia and Croatia. Bulgaria and Romania were ranked as modest innovators.
Unfortunately, all the indexes were not available for all the countries covered in this
report or were not updated with the latest data for all DTP countries.
During our investigation, the eco-innovation index has proven to be a good mirror of
how eco-design and eco-innovation is perceived in the individual countries. Where
the index for eco-innovation is higher, this correlates with country stakeholder
recognising eco-innovation as more of an economic opportunity and advantage.

10Projectco‐fundedbyEuropeanUnionfunds(ERDF,IPA)www.interreg‐danube.eu/moveco
10
Fig. 6 eco-innovation scoreboard for 2016iv
According to the eco-innovation scoreboard for 2016, Germany has been ranked
Eco-I leader, Austria, Slovenia and the Czech Republic are ranked as average Eco-I
performers, one under another, just above the EU average. Slovakia is also ranked as
average Eco-1 performer. Croatia, Romania, Hungary and Bulgaria are ranked as
countries catching up to Eco-I.
11Projectco‐fundedbyEuropeanUnionfunds(ERDF,IPA)www.interreg‐danube.eu/moveco
11
In the report, we focused on data for municipal waste management indicators, as
the objective of extended producer responsibility is focused on fast moving
consumer goods ending in household waste streams.
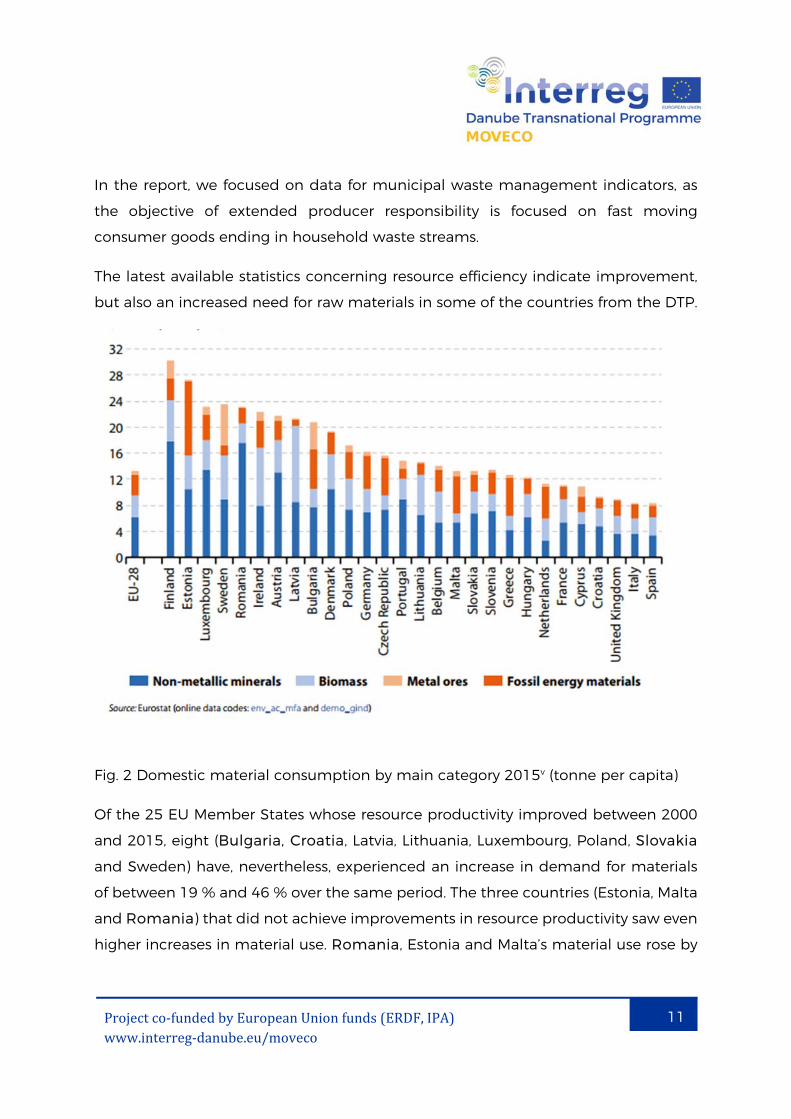
The latest available statistics concerning resource efficiency indicate improvement,
but also an increased need for raw materials in some of the countries from the DTP.
Fig. 2 Domestic material consumption by main category 2015v (tonne per capita)
Of the 25 EU Member States whose resource productivity improved between 2000
and 2015, eight (Bulgaria, Croatia, Latvia, Lithuania, Luxembourg, Poland, Slovakia
and Sweden) have, nevertheless, experienced an increase in demand for materials
of between 19 % and 46 % over the same period. The three countries (Estonia, Malta
and Romania) that did not achieve improvements in resource productivity saw even
higher increases in material use. Romania, Estonia and Malta’s material use rose by
12Projectco‐fundedbyEuropeanUnionfunds(ERDF,IPA)www.interreg‐danube.eu/moveco
12
168 %, 104 % and 60 %, respectively (Eurostat, 2016b). In general, policies and targets
for reducing overall material use are far less common than those aimed at increasing
resource productivity.
In the report, we focused on data for municipal waste management indicators, as
the objective of extended producer responsibility is focused on fast moving
consumer goods ending in household waste streams.
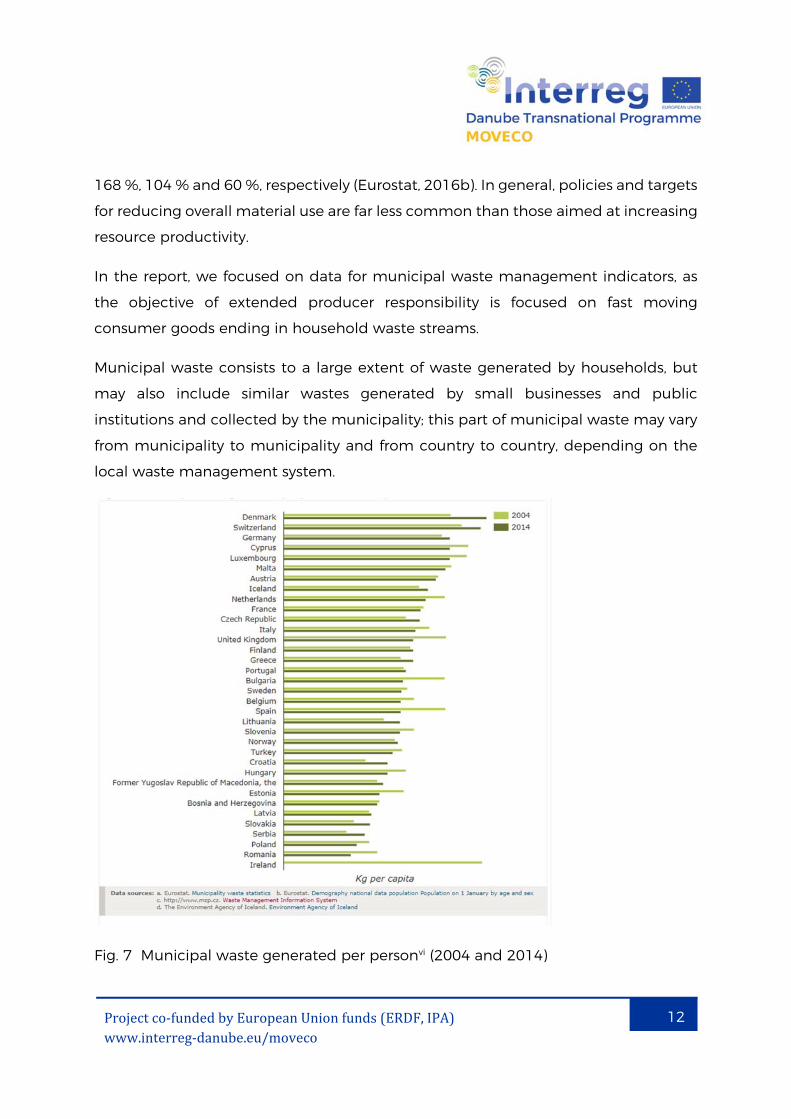
Municipal waste consists to a large extent of waste generated by households, but
may also include similar wastes generated by small businesses and public
institutions and collected by the municipality; this part of municipal waste may vary
from municipality to municipality and from country to country, depending on the
local waste management system.
Fig. 7 Municipal waste generated per personvi (2004 and 2014)
13Projectco‐fundedbyEuropeanUnionfunds(ERDF,IPA)www.interreg‐danube.eu/moveco
13
According to the ten year period presented, generated municipal waste has
increased in Croatia, Serbia, Slovakia, Germany and the Czech Republic and
decreased in Romania, Austria, Bulgaria, Slovenia and Hungary.
A depiction of the main municipal waste management operations are presented for
each country in their country group. The diagrams are taken from the last
Environmental Implementation Review.
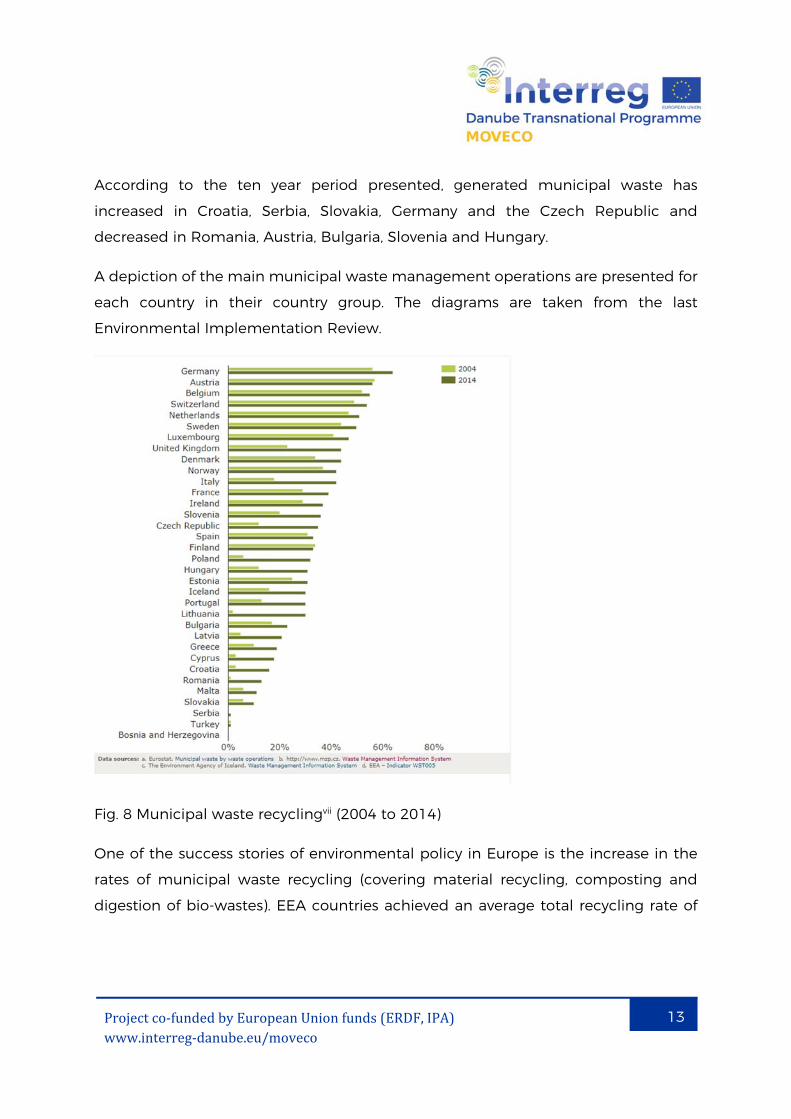
Fig. 8 Municipal waste recyclingvii (2004 to 2014)
One of the success stories of environmental policy in Europe is the increase in the
rates of municipal waste recycling (covering material recycling, composting and
digestion of bio-wastes). EEA countries achieved an average total recycling rate of
14Projectco‐fundedbyEuropeanUnionfunds(ERDF,IPA)www.interreg‐danube.eu/moveco
14
33 % in 2014, compared with 23 % in 2004 (EU-27: 31 % to 44 % over the same time
period) (Eurostat, 2016a).
Germany, Austria, Belgium, Switzerland, the Netherlands and Sweden
recycled at least half of their municipal waste in 2014.
The highest increase in recycling rates between 2004 and 2014 was reported
in Lithuania, Poland, Italy, the United Kingdom and the Czech Republic
(increase of 20–29 percentage points).
Overall, in 15 out of 32 countries, the increase in recycling rates was at least
10 percentage points over this period.
However, in seven countries, the proportion of recycled municipal waste
barely changed and in two countries, it even decreased slightly.
Increasing recycling rates and declining rates of landfilling are clearly linked. Usually,
landfilling declines much faster than the growth in recycling, as waste management
strategies mostly move from landfill towards a combination of recycling and
incineration, and in some cases also mechanical–biological treatment (EEA, 2013).
The recycling rates for generated municipal waste per capita in 2016 for our DTP
countries were highest in Germany, where they recycled 300 kg per capita of
municipal waste, followed by Slovenia with 199 kg of municipal waste recycled per
capita. Both values are well above the EU28 average value of 140 kg per capita. In
Hungary 102 kg of municipal waste was recycled per capita, Bulgaria 92 kg per
capita, The Czech Republic 91 kg per capita, Austria 85 kg per capita, Croatia 77 kg
per capita, Romania 14 kg per capita and Serbia 1 kg per capita.
The rate of municipal waste landfilling for the 32 EEA member countries fell from
49 % in 2004 to 34 % in 2014. The performance of individual countries varied. In
Austria, Belgium, Denmark, Germany, the Netherlands, Norway, Sweden and
Switzerland, virtually no municipal waste is sent to landfill. On the other hand,

15Projectco‐fundedbyEuropeanUnionfunds(ERDF,IPA)www.interreg‐danube.eu/moveco
15
Cyprus, Croatia, Greece, Latvia, Malta and Turkey still landfill more than three quarters
of their municipal waste.
Overall, the rates of landfilling decreased in 27 out of 32 countries. Between 2004
and 2014, the largest decreases occurred in Estonia (57 percentage points), Finland
(41 percentage points), Slovenia (41 percentage points) and the United Kingdom (41
percentage points).
The amount of municipal waste landfilled and incinerated in 2014 ranged from
102 kg/person in Slovenia to 480 kg/person in Malta, with an average of
270 kg/person in Europe (32 European countries).
According to the latest data for landfilling in 2016viii Germany and Austria have
phased out landfilling, Slovenia landfilled 38 kg of waste per capita in 2016. The
Czech Republic sent 169 kg of municipal waste per capita to landfill, Croatia 309 kg
per capita. Slovakia 228 kg per capita, Hungary 192 kg per capita, Bulgaria 260 kg
per capita, and Serbia 211 kg per capita in 2016, while Romania sent 178 kg per
capita and Montenegro 488 kg per capita to landfill in 2015.
Digitalisation potential to improve reuse, recycling has not yet been recognised
practically, though the basic principle of digitalisation are similar to the principle to
implement circular economy business models. A study by the German Federal
Ministry for the Environment, Nature Conservation, Building and Nuclear Safety
indicates that no other lead market in the environmental sector stands to benefit
from digitalisation more than the circular economy. The study prepared by the
Wuppertal Institute concludes that though Germany is still a world leader when it
comes to exporting technologies for the circular economy, this advantage will be
seriously threatened, if Germany does not start to make major investments in the
digitalisation of its own circular economy soonix.
A general observation made in most of the region is, that inconsistencies exist
between overlapping product legislation relevant for product and consumer safety,
food safety requirements, chemical and waste legislation for a transition towards a

16Projectco‐fundedbyEuropeanUnionfunds(ERDF,IPA)www.interreg‐danube.eu/moveco
16
more circular economy and that a common approach should be developed at EU
level to resolve these issues.
In the countries where waste targets are yet to be achieved and infrastructure and
legislation are still lagging, more effort is understandably being invested in the waste
end of the product cycle, with less priority to the design phase of product life. This
indicates that these countries are still evolving through the initial demands of waste
management, with most focus on infrastructure.
Stakeholders mentioned that though it would be easier to introduce local initiatives
to reduce environmental impacts, especially for short distance food packaging, there
is very small demand for such measures in local markets, while companies report
that global competition provides increased incentive for increased environmental
measures. Green public procurement could support more environmental design.
A report prepared by the Institute for European Environmental Policy published in
the beginning of November 2017 on EPR in the EU Plastics Strategy and the Circular
Economy: states: ”A focus on plastic packaging, has ascertained that EPR has a yet
unexploited potential to induce better design for the environment and strengthen
financial incentives for eco-design. Some existing design features prevent more
efficient recycling due to additives and components, which have no additional value
for the consumers and could be removed with better information on product design
features inhibiting better recycling.”
The legislative circular economy package presented by the European Commission
at the end of 2015 has recognised the potential for EPR schemes to support more
efficient design and has included subsequent supporting measures in the new
proposals for waste legislation.
The package currently under discussion at EU level has identified most of the
drawbacks of the existing EPR experience as there seems to be as many complex
approaches to extended producer responsibility as there are countries and waste
streams.

17Projectco‐fundedbyEuropeanUnionfunds(ERDF,IPA)www.interreg‐danube.eu/moveco
17
Though the legislative proposal securing the transition towards a circular economy
has focused on waste, this transition should not be viewed as solely as an
environmental initiative, but also as an economic one with opportunities to improve
resource productivity.
Potential to exploit these opportunities in the Danube region lie within the four
pillars addressing the major issues emphasised in the action plan proposed by EU
Strategy for the Danube Region. These comprise of ensuring better resource and
energy sustainability, through the development of a knowledge society, through
research, education and information technologies, supporting competitiveness of
enterprises, including cluster development, investing in people and skills and
stepping up institutional capacity and cooperation.
Action at EU level will drive investments and create a level playing field, remove
obstacles stemming from European legislation or inadequate enforcement, deepen
the single market, and ensure favourable conditions for innovation and the
involvement of all stakeholders.
The MOVECO project has forged a strong transnational partnership to prepare a
transnational strategy for the transition towards the Circular Economy within the DR
and roadmaps for their implementation in different innovation regions. The project
partners are supporting new business models and research – business cooperation
along value chains, with new services and tools for eco-design and eco-innovation.
The partnership comprises of representatives of all target groups, policy makers,
business support organisations, Research & Development institutions as well as civil
society organisations. The partnership is committed to unleash the potential of the
Circular Economy in the Danube Region, boosting competitiveness and ensuring
security of supply; required for economic growth and new jobs.
The objective of this overview is to ascertain, if any links exist between the extended
producer responsibility schemes established in the Danube region and product

18Projectco‐fundedbyEuropeanUnionfunds(ERDF,IPA)www.interreg‐danube.eu/moveco
18
design, with emphasis on eco-design and design supporting innovation for transition
towards a circular economy.

19Projectco‐fundedbyEuropeanUnionfunds(ERDF,IPA)www.interreg‐danube.eu/moveco
19
Introduction Extended producer responsibility (EPR) is a concept first formally introduced in
Sweden by Thomas Lindhqvist. It is an environmental protection strategy to decrease
total environmental impact of a product, by making the manufacturer of the product
responsible for the entire life cycle of the product and especially for the take-back,
recycling and final disposal.
In the 2016 OECD guidance on extended producer responsibility, it was estimated
that over 400 EPR schemes operate globally for different waste streams. Small
consumer electronic equipment accounts for more than one third of EPR systems
followed by packaging and tyres. Though the strategy seems straightforward, it is
practically impossible to compare various EPR schemes as they differ not only on
waste streams but also within individual waste streams with regard to fees,
geographical areas covered, service coverage, management, roles of public waste
services, collection and recycling possibilities to name a few.
The MOVECO project titled Mobilising Institutional Learning for Better Exploitation
of Research and Innovation for the Circular Economy, addresses the links between
currently functioning EPR schemes in the Danube Region (DR) and innovation
required for the transition towards a more circular economy. MOVECO's objective is
to improve the framework conditions and policy instruments for eco innovation and
the transition to a Circular Economy, fostering smart and sustainable growth and
reducing disparities in the Danube Region (DR). The objective corresponds with the
legislative proposals on waste and action plan for a circular economy launched by
the European Commission on 2015.
The legislative proposals on waste, prepared by the European Commission together
with EU action plan for the circular economy focuses on waste legislation, including
long-term targets to reduce landfilling and to increase preparation for reuse and
recycling of key waste streams such as municipal waste and packaging waste.

20Projectco‐fundedbyEuropeanUnionfunds(ERDF,IPA)www.interreg‐danube.eu/moveco
20
Further measures are proposed to make implementation clear and simple, promote
economic incentives and improve extended producer responsibility schemes. The
action plan includes It includes comprehensive commitments on ecodesign, the
development of strategic approaches on plastics and chemicals, a major initiative to
fund innovative projects under the umbrella of the EU's Horizon 2020 research
programme, and targeted action in areas such as plastics, food waste, construction,
critical raw materials, industrial and mining waste, consumption and public
procurement.
The Commission is also proposing to encourage better product design by
differentiating the financial contribution paid by producers under extended
producer responsibility schemes on the basis of the end-of-life costs of their
products. This should create a direct economic incentive to design products that can
be more easily recycled or reused.
Economic actors, such as business and consumers, are key in driving this process.
Local, regional and national authorities are enabling the transition, but the EU also
has a fundamental role to play in supporting it.
The aim is to ensure that the right regulatory framework is in place for the
development of the circular economy in the single market, and to give clear signals
to economic operators and society at large on the way forward with long term waste
targets as well as a concrete, broad and ambitious set of actions, to be carried out
before 2020.
Action at EU level will drive investments and create a level playing field, remove
obstacles stemming from European legislation or inadequate enforcement, deepen
the single market, and ensure favourable conditions for innovation and the
involvement of all stakeholders.
The MOVECO project has forged a strong transnational partnership to prepare a
transnational strategy for the transition towards the Circular Economy within the DR
and roadmaps for their implementation in different innovation regions. The project

21Projectco‐fundedbyEuropeanUnionfunds(ERDF,IPA)www.interreg‐danube.eu/moveco
21
partners are supporting new business models and research – business cooperation
along value chains, with new services and tools for eco-design and eco-innovation.
The partnership comprises of representatives of all target groups, policy makers,
business support organisations, Research & Development institutions as well as civil
society organisations. The partnership is committed to unleash the potential of the
Circular Economy in the Danube Region, boosting competitiveness and ensuring
security of supply; required for economic growth and new jobs.
The objective of this overview is to ascertain, if any links exist between the extended
producer responsibility schemes established in the Danube region and product
design, with emphasis on eco-design and design supporting innovation for transition
towards a circular economy.
Though several studies have been conducted on this subject, very limited
information can be obtained from them, on how EPR requirements are
implemented within the Danube region.
The scope of the study is centred on extended producer responsibility schemes for
packaging and packaging waste, waste electronic and electrical equipment and
batteries and accumulators.
The study gives a general overview and a chapter with more detailed description of
current practices and EPR characteristics for each partner country. Each national
chapter is concluded by a good practice example relevant to EPR schemes and
innovation and eco-design for the circular economy. The good practices are
accessible in the national studies and in the project brochure “Your trash is my
treasure”
The transnational study is structured as follows:
‐ The first chapter provides a basic overview with a presentation of EU
legislation

22Projectco‐fundedbyEuropeanUnionfunds(ERDF,IPA)www.interreg‐danube.eu/moveco
22
‐ The second chapter presents an overview of indicators monitored by Eurostat
and the European Environmental Agency that have been used in other
reports to track the shift towards a more circular economy such as the
innovation and eco-innovation indexes, the resource efficiency index and
member state municipal waste management statistics regarding waste
generation, recycling and disposal.
‐ A separate chapter is dedicated to each partner country and Moldova,
providing basic information concerning legislation, the number of
stakeholders involved and their characteristics, a good practice case and
conclusion.
Methodology Each partner conducted a desk research of relevant legislation with literature review
to establish the main characteristics of implemented waste legislation relevant to
extended producer responsibility within their region, identifying regional activities
supporting a transition towards a circular economy
Quite a few studies have been prepared on the roles and workings of EPR schemes
at both EU and global level. Beginning with the background EU studies published
in 2014 at the launch of the first legislative package for a circular economy, followed
by the Zerowaste study on Redesigning producer responsibility and global level, with
an updated guidance on extended producer responsibility having been published
in 2016. This study exposes flaws in existing collective EPR schemes, one of which is
that they have had only limited impact on eco-design, which was one of the main
drivers behind their creation. Though the legislative package was focused on waste
and includes minimum requirements for the working of EPR schemes, the
Zerowaste study determines that » In order for a product to be reused, repaired,
rebuilt, refurbished, refinished, resold, recycled or composted, this needs to be
considered in the initial design phase of the product. Work should be done at the
23Projectco‐fundedbyEuropeanUnionfunds(ERDF,IPA)www.interreg‐danube.eu/moveco
23
front-end of the production process to design waste out of the system and reinforced
Extended Producer Responsibility (EPR) has to be part of the bridge between waste
and products policies.
This was followed by a mapping exercise to determine potential organisations from
the target groups within the partner region
Target groups
o producers (electrical and electronic equipment and/or components,
B&A, packaging and packaging waste – the electrical and electronic as
well as the B&A industry are subject to packaging requirements, so the
packaging aspects could be verified with WEEE and B&A, therefore
more insight on packaging and packaging waste could be gained
through interviews in the food and beverage sector i.e. , where
packaging presents a substantial cost) /20 to 30 visits, the final number
is determined on the basis of regional characteristics which each
partner describes briefly for each target group
o producers of materials applied in WEEE, packaging, B&A (for example
plastics)
o producer responsibility organisations (all dealing with WEEE, PPW,
B&A), the final number is determined on the basis of regional
characteristics which each partner describes briefly for each target
group. Where PROs do not exist or their role is performed by one (state)
body, this body should be referred to as a PRO
o waste management entities the final number is determined on the
basis of regional characteristics which each partner describes briefly for
each target group
o recyclers and
o collectors / public and private),
o local and state/regional public authorities (municipalities/local
governments, ministries

24Projectco‐fundedbyEuropeanUnionfunds(ERDF,IPA)www.interreg‐danube.eu/moveco
24
Partners performed in depth interviews with representatives of each the target
group. The final number of each stakeholder was determined by each partner on the
basis of regional characteristics which they described briefly for each target group
A guidance template provided the basic content of the in depth interviews. The
template was not meant to serve as a strict questionnaire but a list of the most
important topics to be covered with possible answers for the in depth interview to
proceed smoothly. The template, supplemented as annex 1 to this report, is divided
into three parts covering general aspects of the organisation, their cooperation with
PRO and environmental priorities. Many of the general questions are closed
questions, which are elaborated more with regard to environmental aspects and
circular economy in the other parts of the template
The guidance template primarily targeted producers, importers, but the topics could
be adapted according to the practices and needs of other organisations, PROs can
be dealing with one or more material waste stream, they may have different
environmental practices and objectives, which may support innovation and eco-
design, this is true also for waste management activities…
Before the interview, the interviewer was instructed to prepare and gather general
information about the interviewed organisation available from company websites
and other public records. This will help the interviewer answer some of the
organisation profile questions and prepare on which topics they need to focus on
more during the interview.
Some partners opted to obtain answers through the organisation of focus group
meetings / round tables, which initiated dialogue and exchange of views amongst
relevant stakeholders. In this case, the template was adapted according to the
method of discussion and the target groups participating.
After the partners prepared their national reports, the facts were double-checked,
via desk study, and communication with the individual partners, to prepare this
report in a harmonised and uniform manner. Due to the diversified characteristics of
25Projectco‐fundedbyEuropeanUnionfunds(ERDF,IPA)www.interreg‐danube.eu/moveco
25
national approaches implementing extended producer responsibility and the lack
of concise information in English on the websites of the stakeholders involved in EPR,
straightforward answers were not always easily obtained.
A final draft version of this report was sent to all the partners for additional feedback
and correction.
The best practice cases included in the national partner reports have been compiled
into a best practice brochure, “Your trash is our treasure” and are not included in this
report.

26Projectco‐fundedbyEuropeanUnionfunds(ERDF,IPA)www.interreg‐danube.eu/moveco
26
EU characteristics and legislation for
extended producer responsibility
Current legislation
Waste framework directive 2008/98/EC
Article 8. of the existing waste framework directive defines extended producer
responsibility target groups.
1. In order to strengthen the re-use and the prevention, recycling and other
recovery of waste, Member States may take legislative or non-legislative
measures to ensure that any natural or legal person who professionally
develops, manufactures, processes, treats, sells or imports products (producer
of the product) has extended producer responsibility.
Such measures may include an acceptance of returned products and of the
waste that remains after those products have been used, as well as the
subsequent management of the waste and financial responsibility for such
activities. These measures may include the obligation to provide publicly
available information as to the extent to which the product is re-usable and
recyclable.
2. Member States may take appropriate measures to encourage the design of
products in order to reduce their environmental impacts and the generation
of waste in the course of the production and subsequent use of products, and
in order to ensure that the recovery and disposal of products that have
become waste take place in accordance with Articles 4 and 13.
Such measures may encourage, inter alia, the development, production and
marketing of products that are suitable for multiple use, that are technically
27Projectco‐fundedbyEuropeanUnionfunds(ERDF,IPA)www.interreg‐danube.eu/moveco
27
durable and that are, after having become waste, suitable for proper and safe
recovery and environmentally compatible disposal.
3. When applying extended producer responsibility, Member States shall take
into account the technical feasibility and economic viability and the overall
environmental, human health and social impacts, respecting the need to
ensure the proper functioning of the internal market.
4. The extended producer responsibility shall be applied without prejudice to
the responsibility for waste management as provided for in Article 15(1) and
without prejudice to existing waste stream specific and product specific
legislation.
Directive on packaging and packaging waste 94/62/EC
Article 4, second paragraph regarding prevention determines, that preventive
measures may consist of national projects to introduce producer responsibility to
minimise the environmental impact of packaging or similar actions adopted, if
appropriate in consultation with economic operators, and designed to bring
together and take advantage of the many initiatives taken within Member States as
regards prevention. They shall comply with the two main objectives of the directive,
to reduce the impact of packaging on the environment and to support the
functioning of the internal market.
Article 9 determines the essential requirements for packaging. The essential
requirements are specified in annex II of the directive, where they are categorised
according to requirements specific to the:
o Manufacturing and composition of packaging
o Reusable nature of packaging
o Recoverable nature of packaging with packaging recoverable in the
form of:

28Projectco‐fundedbyEuropeanUnionfunds(ERDF,IPA)www.interreg‐danube.eu/moveco
28
o Material recycling
o Energy recovery
o Composting and
o Biodegradable packaging.
Article 11 of the directive defines concentration levels of heavy metals present in
packaging. These should not exceed 100 ppm by weight except for specified lead
crystal glass.
Directive 2012/19/EU on waste electrical and electronic equipment (WEEE)
Article 4 Product design, member states shall encourage cooperation between
producers, recyclers and measures to promote design and production of EEE,
notably in view of facilitating re-use, dismantling and recovery of WEEE, its
components and materials. Eco-design requirements for reuse and treatment of
WEEE must be applied and producers do not prevent through specific design
features or manufacturing processes present overriding advantages.
Article 7 on collection rates implements the producer responsibility principle.
Article 15 information for treatment facilities requires producers provide information
free of charge about preparation for re-use and treatment.
Directive 2011/65/EU on the restriction of the use of certain hazardous substances in
electrical and electronic equipment (RoHS‐2)
The second RoHS directive, which is currently under revision, provides the framework
for the gradual extension of the requirements to all electrical and electronic
equipment (EEE), including cables and spare parts. It introduces restrictions of new
substances and presents a methodology for the assessment of new hazardous
substances in EEE with restrictions mainly based on waste-related criteria. It provides
a review of the list of restricted substances, new substance restrictions and clearer,
more transparent rules for granting, renewing or revoking exemptions, with the
obligation of manufacturers to apply for exemptions and to carry out the necessary

29Projectco‐fundedbyEuropeanUnionfunds(ERDF,IPA)www.interreg‐danube.eu/moveco
29
assessment. Annex 2 to the directive sets limit values by weight for homogeneous
materials for contents of Mercury (Hg: 0.1 %), Cadmium (Cd:0.01 %), Lead (Pb:0,1 %),
Chromium VI (Cr6+: 0,1%), polybrominated biphenyls (PBB: 0.1 %), and
polybrominated diphenyl ethers (PBDE: 0.1 %). Annex III contains a list of exemptions
to this requirement.
Directive 2009/125/EC establishing a framework for the setting of eco‐design
requirements for energy‐related products.
Eco-design is defined as the integration of environmental aspects into product
design with the aim of improving the environmental performance of a product
throughout its whole lifecycle.
The directive refers to generic and specific eco-design requirements; generic
requirements are requirements originating from the environmental profile of the
product without set limit values for particular environmental aspects, while specific
eco-design requirements are quantified requirements relating to a particular
environmental aspect of a product, such as energy consumption during use,
calculated for a given unit output performance.
A list of generic eco-design requirements is published in annex I based on phases of
the product life cycle. Amongst the requirements contained in the list are: ease for
reuse and recycling through the number of materials and components used, use of
standard components, time necessary for disassembly, complexity of tools necessary
for disassembly, use of component and material coding standards for the
identification of components and materials suitable for reuses and recycling
(including marking of plastic parts in accordance with ISO standards), use of easily
recyclable materials, easy access to valuable and other recyclable components and
materials; easy access to components and materials containing hazardous
substances together with incorporation of used components, avoidance of
hazardous substances detrimental to reuse and recycling, lifetime extension
implementing availability of spare parts, modularity, upgradeability, reparability,
30Projectco‐fundedbyEuropeanUnionfunds(ERDF,IPA)www.interreg‐danube.eu/moveco
30
reference to chemical legislation with regard to hazardous substances; all of which
resonate with the design requirements for transition towards a circular economy.
Item 14 of Article 1 of the directive defines reuse as any operation by which a product
or its components, having reached the end of their first use, are used for the same
purpose for which they were conceived, including the continued use of a product
which is returned to a collection point, distributor, recycler or manufacturer, as well
as reuse of a product following refurbishment. Part 2 of this annex determines
information which must be supplied to consumers on maintenance, extended life
expectancy measures, end-of-life measures and information for treatment facilities
concerning disassembly, recycling or disposal at end-of-life.
Directive 2006/66/EC on batteries and accumulators and waste batteries and
accumulators repealing Directive 91/157/EEC
Article 4. Prohibition of batteries or accumulators on the market containing more
than:
o 0,0005 % Hg by weight, except for button cells where the limit is 2 % by
weight
o 0,002 % Cd by weight, except for emergency and alarm systems, including
emergency lighting, medical equipment or cordless power tools.
Article 11 requires Member States shall ensure that manufacturers design appliances
in such a way that waste batteries and accumulators can be readily removed.
Appliances into which batteries and accumulators are incorporated shall be
accompanied by instructions showing how they can be removed safely and, where
appropriate, informing the end-user of the type of the incorporated batteries and
accumulators. These provisions shall not apply where, for safety, performance,
medical or data integrity reasons, continuity of power supply is necessary and
requires a permanent connection between the appliance and the battery or
accumulator.

31Projectco‐fundedbyEuropeanUnionfunds(ERDF,IPA)www.interreg‐danube.eu/moveco
31
Fulfilment of extended producer responsibility requirement through collection
schemes is defined in article 8 of the directive, with free take back requirements. The
schemes can run together with schemes for waste electrical and electronic
equipment where this is feasible. Collection targets of 45 % until 26. September
2016. Treatment and recycling are defined in article 12, and detailed in annex III of
the directive.
Article 20. details required information for end-users with regard to awareness
raising, available collection and recycling schemes, meaning of symbols regarding
recycling and chemical contents.
This is continued in article 21 with labelling and marking requirement laid out in
paragraph 3 stating compulsory marking with the chemical symbols Hg, Cd or Pb
for batteries, accumulators and button cells containing more than 0,0005 % of
Mercury (Hg), more than 0,002 % Cadmium (Cd) or more than 0,004 % of lead (Pb).
Proposed future legislation
Draft for new waste framework directive in 2015
Amends article 8 to be more binding and introduces article 8.a with minimal
requirements extended producer responsibility schemes / product responsibility
organisations must fulfil. Article 8 is amended as follows:
(a) in paragraph 1, the following sub-paragraph is added:
'Such measures may also include the establishment of extended producer
responsibility schemes defining specific operational and financial obligations for
producers of products.'
(b) the second sentence of paragraph 2 is replaced by the following:
'Such measures may encourage, inter alia, the development, production and
marketing of products that are suitable for multiple use, that are technically durable
and that are, after having become waste, suitable for preparation for re-use and
recycling in order to facilitate proper implementation of the waste hierarchy. The
32Projectco‐fundedbyEuropeanUnionfunds(ERDF,IPA)www.interreg‐danube.eu/moveco
32
measures should take into account the impact of products throughout their life
cycle.'
(c) the following paragraph 5 is added:
'5. The Commission shall organise an exchange of information between Member
States and the actors involved in producer responsibility schemes on the practical
implementation of the requirements defined in Article 8a and on best practices to
ensure adequate governance and cross-border cooperation of extended producer
responsibility schemes. This includes, inter alia, exchange of information on the
organisational features and the monitoring of producer responsibility organisations,
the selection of waste management operators and the prevention of littering. The
Commission shall publish the results of the exchange of information.'
Subsequently a new Article 8a is inserted:
'Article 8a
General requirements for extended producer responsibility schemes
1. Member States shall ensure that extended producer responsibility schemes
established in accordance with Article 8, paragraph 1:
– define in a clear way the roles and responsibilities of producers of
products placing goods on the market of the Union, organisations
implementing extended producer responsibility on their behalf, private
or public waste operators, local authorities and, where appropriate,
recognised preparation for re-use operators;
– define measurable waste management targets, in line with the waste
hierarchy, aiming to attain at least the quantitative targets relevant for
the scheme as laid down in this Directive, Directive 94/62/EC, Directive
2000/53/EC, Directive 2006/66/EC and Directive 2012/19/EU;

33Projectco‐fundedbyEuropeanUnionfunds(ERDF,IPA)www.interreg‐danube.eu/moveco
33
– establish a reporting system to gather data on the products placed on
the Union market by the producers’ subject to extended producer
responsibility. Once these products become waste, the reporting
system shall ensure that data is gathered on the collection and
treatment of that waste specifying, where appropriate, the waste
material flows;
– ensure equal treatment and non-discrimination between producers of
products and with regards to small and medium enterprises.
2. Member States shall take the necessary measures to ensure that the waste
holders targeted by the extended producer responsibility schemes
established in accordance with Article 8, paragraph 1, are informed about the
available waste collection systems and the prevention of littering. Member
States shall also take measures to create incentives for the waste holders to
take part in the separate collection systems in place, notably through
economic incentives or regulations, when appropriate.
3. Member States shall take the necessary measures to ensure that any
organisation set up to implement extended producer responsibility
obligations on behalf of a producer of products:
(a) has a clearly defined geographical, product and material coverage;
(b) has the necessary operational and financial means to meet its extended
producer responsibility obligations;
(c) puts in place an adequate self-control mechanism, supported by regular
independent audits to appraise:
– the organisation's financial management, including the
compliance with the requirements laid down in paragraph
4(a) and (b);
34Projectco‐fundedbyEuropeanUnionfunds(ERDF,IPA)www.interreg‐danube.eu/moveco
34
– the quality of data collected and reported in accordance
with paragraph 1, third indent, and the requirements of
Regulation (EC) No 1013/2006.
(d) makes publicly available the information about:
– its ownership and membership;
– the financial contributions paid by the producers;
– the selection procedure for waste management operators.
4. Member States shall take the necessary measures to ensure that the financial
contributions paid by the producer to comply with its extended producer
responsibility obligations:
(a) cover the entire cost of waste management for the products it puts on the
Union market, including all the following:
– costs of separate collection, sorting and treatment
operations required to meet the waste management targets
referred to in paragraph 1, second indent, taking into
account the revenues from re-use or sales of secondary raw
material from their products;
– costs of providing adequate information to waste holders in
accordance with paragraph 2;
– costs of data gathering and reporting in accordance with
paragraph 1, third indent.
(b) are modulated on the basis of the real end-of-life cost of individual
products or groups of similar products, notably by taking into account their
re-usability and recyclability;

35Projectco‐fundedbyEuropeanUnionfunds(ERDF,IPA)www.interreg‐danube.eu/moveco
35
(c) are based on the optimised cost of the services provided in cases where
public waste management operators are responsible for implementing
operational tasks on behalf of the extended producer responsibility scheme.
5. Member States shall establish an adequate monitoring and enforcement
framework with the view to ensure that the producers of products are
implementing their extended producer responsibility obligations, the
financial means are properly used, and all actors involved in the
implementation of the scheme report reliable data.
Where, in the territory of a Member State, multiple organisations implement
extended producer responsibility obligations on behalf of the producers,
Member State shall establish an independent authority to oversee the
implementation of extended producer responsibility obligations.
6. Member States shall establish a platform to ensure a regular dialogue
between the stakeholders involved in the implementation of extended
producer responsibility, including private or public waste operators, local
authorities and, where applicable, recognised preparation for re-use
operators.'
7. Member States shall take measures to ensure that extended producer
responsibility schemes that have been established before comply with the
provisions of this article within twenty-four months of that date.’
Proposal for a DIRECTIVE OF THE EUROPEAN PARLIAMENT AND OF THE COUNCIL
amending Directive 94/62/EC on packaging and packaging waste
Article 4, such measures may consist of national programmes, incentives through
extended producer responsibility schemes to minimise the environmental impact
of packaging or similar actions adopted, if appropriate in consultation with
economic operators, and designed to bring together and take advantage of the
many initiatives taken within Member States as regards prevention. They shall

36Projectco‐fundedbyEuropeanUnionfunds(ERDF,IPA)www.interreg‐danube.eu/moveco
36
comply with the two main objectives of the directive, to reduce the impact of
packaging on the environment and to support the functioning of the internal
market.
The proposal defines targets for preparation for reuse and recycling, while the
currently valid directive speaks of recovery, re-use and recycling. With this rewording
the definitions are more aligned with the definitions from the waste framework
directive.
Proposal for a Directive of the European Parliament and of the Council amending Directives 2000/53/EC on end‐of‐life vehicles, 2006/66/EC on batteries and accumulators
and waste batteries and accumulators, and 2012/19/EU on waste electrical and electronic
equipment
The proposal amends implementation reporting requirements for member states
and sets new targets for recycling and preparation for reuse.
37Projectco‐fundedbyEuropeanUnionfunds(ERDF,IPA)www.interreg‐danube.eu/moveco
37
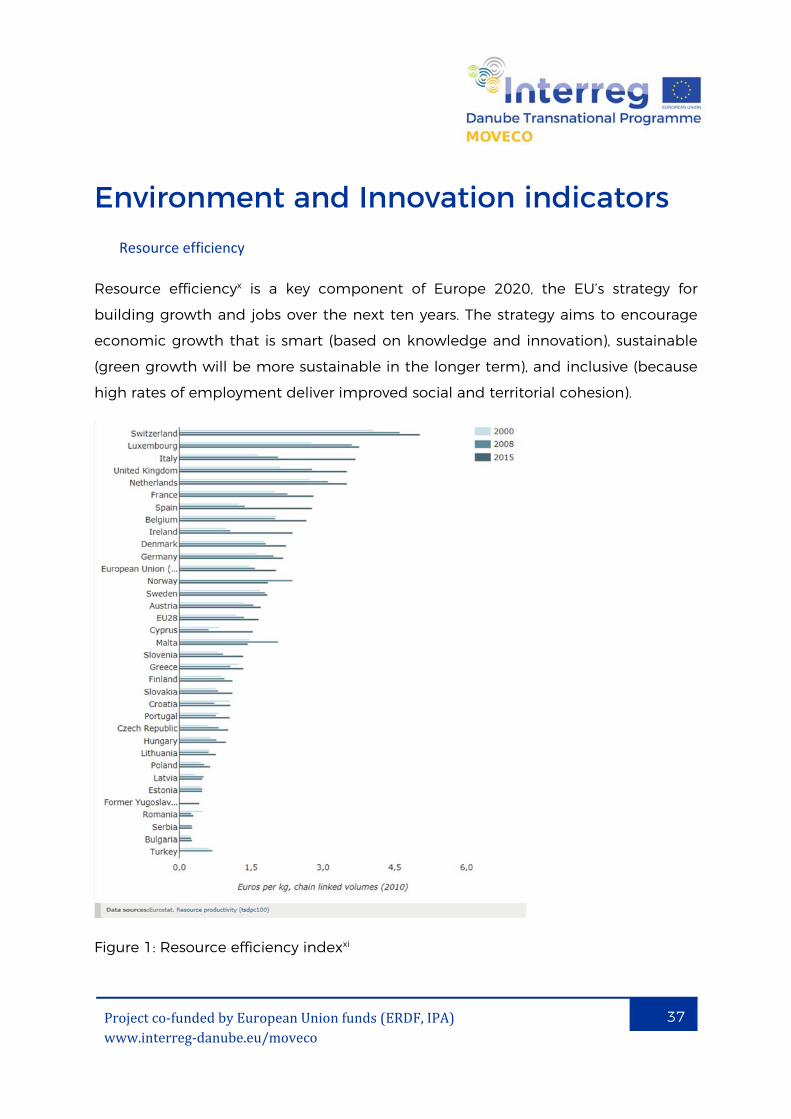
Environment and Innovation indicators Resource efficiency
Resource efficiencyx is a key component of Europe 2020, the EU’s strategy for
building growth and jobs over the next ten years. The strategy aims to encourage
economic growth that is smart (based on knowledge and innovation), sustainable
(green growth will be more sustainable in the longer term), and inclusive (because
high rates of employment deliver improved social and territorial cohesion).
Figure 1: Resource efficiency indexxi

38Projectco‐fundedbyEuropeanUnionfunds(ERDF,IPA)www.interreg‐danube.eu/moveco
38
Resource productivity is calculated from domestic material consumption and
national GDP. The domestic material consumption (DMC) measures the total
amount of material directly used by an economy. This indicator is defined as the
direct material input (DMI) minus all physical exports. The DMI measures the direct
input of materials for the use in the economy and equals to domestic extraction (DE)
plus all physical imports. DMC is based on the economy-wide material flow accounts
(EW-MFA). DMC in tonnes per capita provides an indication of the comparable
material consumption of nations normalised with the population.
The indicator is available for each EU Member State, EU-28 aggregate, EFTA
countries and some candidate countries. It is important to note that the term
"consumption" as used in DMC denotes apparent consumption and not final
consumption. DMC does not include upstream hidden flows related to imports and
exports of raw materials and products
The indicator is a Sustainable Development Indicators (SDI). It has been chosen for
the assessment of the progress towards the objectives and targets of the EU
Sustainable Development Strategy.
Resource productivity measures the quantity of economic output produced using a
certain amount of extracted resources; it is used as a proxy for resource efficiency by
the European Commission. It effectively measures the decoupling of material use
from economic growth. However, under conditions of relative decoupling, overall
material use can increase despite an increase in resource productivity.
Resource productivity varies between countries by a factor of nearly 20. This variation
is not a sign of more efficient industry in one country compared with another, but
rather a reflection of the types of material resources available in the country and its
economic structures. Countries with service-based economies will tend to have
higher resource productivity than economies with a high proportion of heavy
industry, since service industries typically have a lower demand for material inputs
(EEA, 2013).
39Projectco‐fundedbyEuropeanUnionfunds(ERDF,IPA)www.interreg‐danube.eu/moveco
39
Improving resource productivity has not necessarily led to reduced overall material
use. EU-28xii resource productivity increased from 1.47 EUR/kg in 2000 to 2.07 EUR/kg
in 2016, an increase of 41 %. This was not a steady increase: in particular the financial
and economic crisis marked a change in 2008 (see Figure 1). Indeed, resource
productivity reported a steady but modest increase from 2000 to 2008 (7.9 %). From
2008 to 2016 resource productivity surged from 1.59 to 2.07 EUR/kg, despite a dip
in 2011. During this period annual growth was highest in 2009 (8.6 %) and 2012
(7.3 %).
An analysis of the resource productivity components helps to explain these
developments. During the period from 2000 to 2007, GDP and DMC grew in parallel
and there was no apparent decoupling between economic and environmental
variables. Between 2007 and 2009 there was a relative decoupling of GDP from DMC,
while an absolute decoupling of GDP from DMC was apparent in most years
between the low point of the financial and economic crisis and the latest period for
which data are available, in other words from 2009 to 2016.
40Projectco‐fundedbyEuropeanUnionfunds(ERDF,IPA)www.interreg‐danube.eu/moveco
40
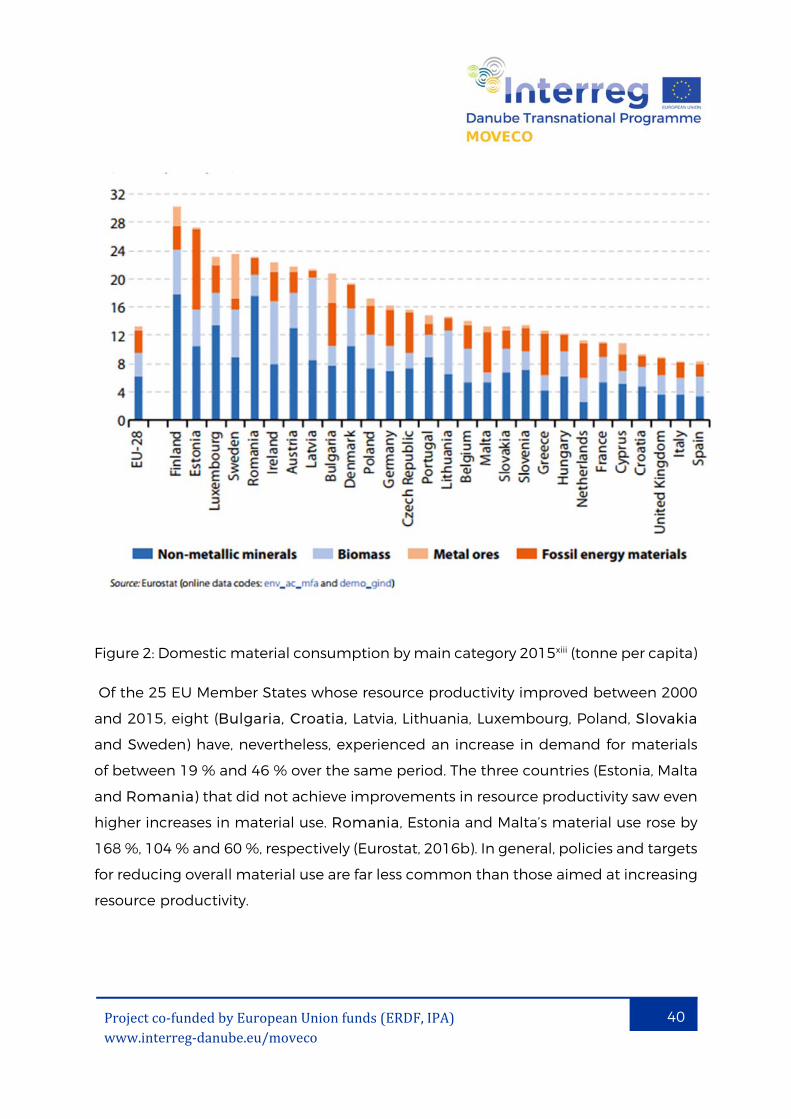
Figure 2: Domestic material consumption by main category 2015xiii (tonne per capita)
Of the 25 EU Member States whose resource productivity improved between 2000
and 2015, eight (Bulgaria, Croatia, Latvia, Lithuania, Luxembourg, Poland, Slovakia
and Sweden) have, nevertheless, experienced an increase in demand for materials
of between 19 % and 46 % over the same period. The three countries (Estonia, Malta
and Romania) that did not achieve improvements in resource productivity saw even
higher increases in material use. Romania, Estonia and Malta’s material use rose by
168 %, 104 % and 60 %, respectively (Eurostat, 2016b). In general, policies and targets
for reducing overall material use are far less common than those aimed at increasing
resource productivity.

41Projectco‐fundedbyEuropeanUnionfunds(ERDF,IPA)www.interreg‐danube.eu/moveco
41
Figure 3: Resource productivity EU average including data for 2016xiv
According to the data for resource productivity for 2016xv illustrated below, in the
following table, Slovenia has an index of 177,5, followed by the Czech Republic 172,5,
Hungary 155,3, Slovakia 151,5; Germany 137, Serbia 133, Austria 122,5, Bulgaria 120,
Croatia 102,5 and Romania 64,4.; while the EU average is 141.

42Projectco‐fundedbyEuropeanUnionfunds(ERDF,IPA)www.interreg‐danube.eu/moveco
42
Table 1. Latest published resource productivity (2016) by countryxvi

43Projectco‐fundedbyEuropeanUnionfunds(ERDF,IPA)www.interreg‐danube.eu/moveco
43
Innovation and eco‐innovation
European innovation scoreboard 2017
Figure 4: Innovation ranking published in 2017xvii.
44Projectco‐fundedbyEuropeanUnionfunds(ERDF,IPA)www.interreg‐danube.eu/moveco
44
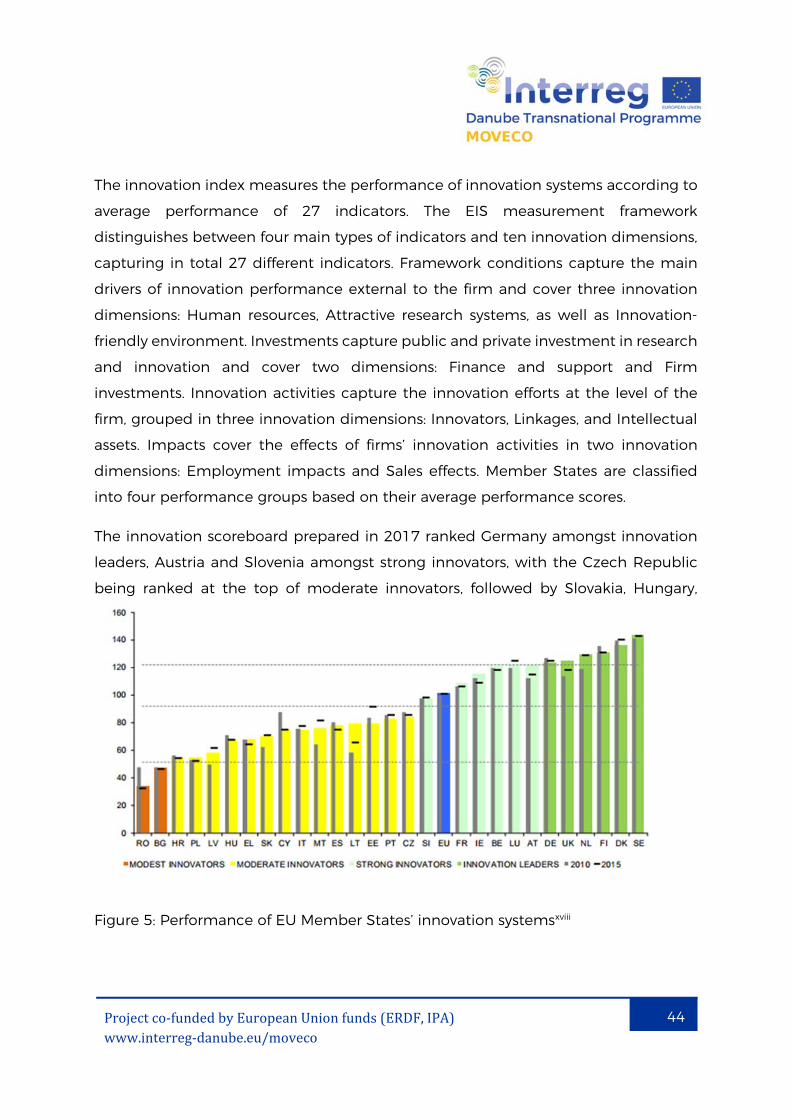
The innovation index measures the performance of innovation systems according to
average performance of 27 indicators. The EIS measurement framework
distinguishes between four main types of indicators and ten innovation dimensions,
capturing in total 27 different indicators. Framework conditions capture the main
drivers of innovation performance external to the firm and cover three innovation
dimensions: Human resources, Attractive research systems, as well as Innovation-
friendly environment. Investments capture public and private investment in research
and innovation and cover two dimensions: Finance and support and Firm
investments. Innovation activities capture the innovation efforts at the level of the
firm, grouped in three innovation dimensions: Innovators, Linkages, and Intellectual
assets. Impacts cover the effects of firms’ innovation activities in two innovation
dimensions: Employment impacts and Sales effects. Member States are classified
into four performance groups based on their average performance scores.
The innovation scoreboard prepared in 2017 ranked Germany amongst innovation
leaders, Austria and Slovenia amongst strong innovators, with the Czech Republic
being ranked at the top of moderate innovators, followed by Slovakia, Hungary,
Figure 5: Performance of EU Member States’ innovation systemsxviii
45Projectco‐fundedbyEuropeanUnionfunds(ERDF,IPA)www.interreg‐danube.eu/moveco
45
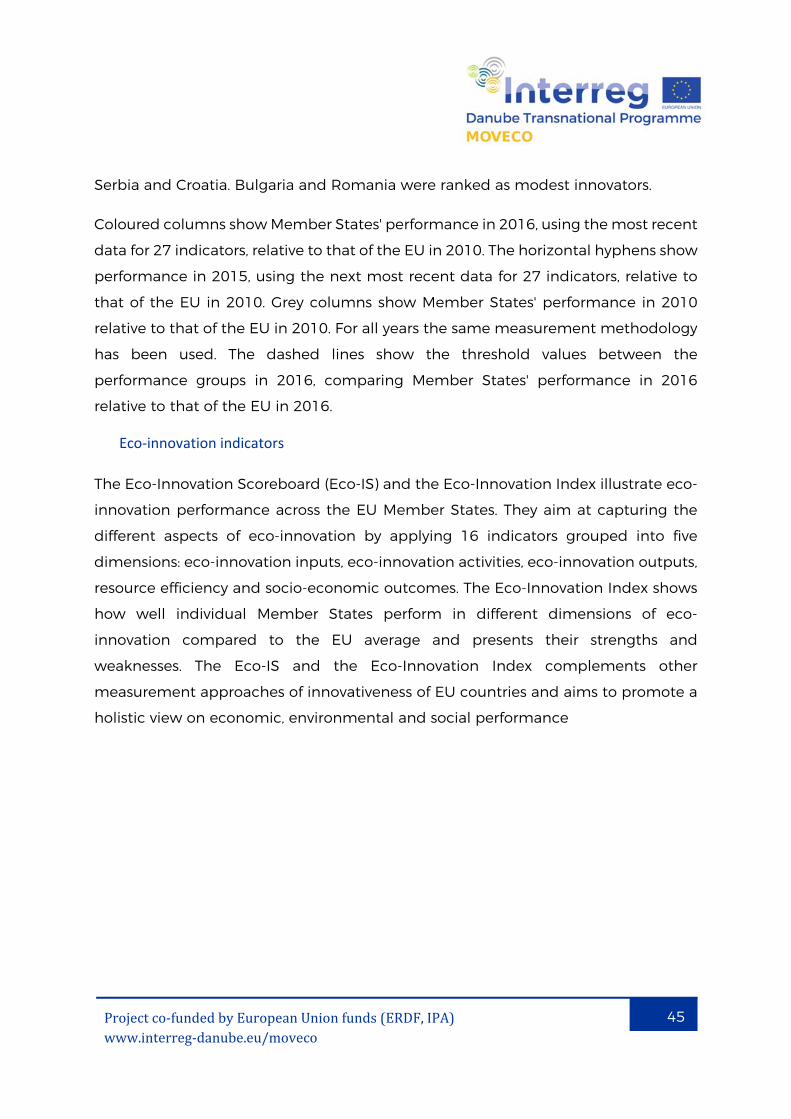
Serbia and Croatia. Bulgaria and Romania were ranked as modest innovators.
Coloured columns show Member States' performance in 2016, using the most recent
data for 27 indicators, relative to that of the EU in 2010. The horizontal hyphens show
performance in 2015, using the next most recent data for 27 indicators, relative to
that of the EU in 2010. Grey columns show Member States' performance in 2010
relative to that of the EU in 2010. For all years the same measurement methodology
has been used. The dashed lines show the threshold values between the
performance groups in 2016, comparing Member States' performance in 2016
relative to that of the EU in 2016.
Eco‐innovation indicators
The Eco-Innovation Scoreboard (Eco-IS) and the Eco-Innovation Index illustrate eco-
innovation performance across the EU Member States. They aim at capturing the
different aspects of eco-innovation by applying 16 indicators grouped into five
dimensions: eco-innovation inputs, eco-innovation activities, eco-innovation outputs,
resource efficiency and socio-economic outcomes. The Eco-Innovation Index shows
how well individual Member States perform in different dimensions of eco-
innovation compared to the EU average and presents their strengths and
weaknesses. The Eco-IS and the Eco-Innovation Index complements other
measurement approaches of innovativeness of EU countries and aims to promote a
holistic view on economic, environmental and social performance
46Projectco‐fundedbyEuropeanUnionfunds(ERDF,IPA)www.interreg‐danube.eu/moveco
46
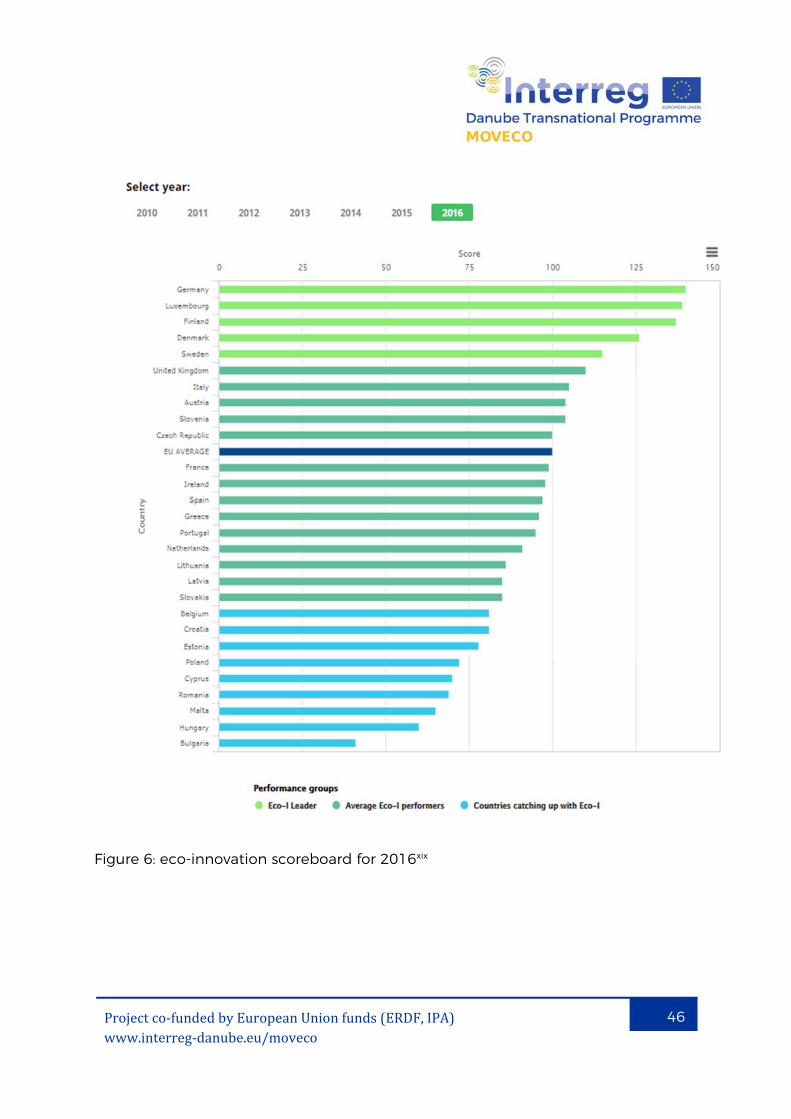
Figure 6: eco-innovation scoreboard for 2016xix

47Projectco‐fundedbyEuropeanUnionfunds(ERDF,IPA)www.interreg‐danube.eu/moveco
47
The latest eco-innovation scoreboard rank Germany as leader, Austria, Slovenia and
Czech Republic are ranked in this same order just above the EU average as average
eco I performers. Slovakia is ranked as the last country in this category, below EU
average. The other EU partner countries are ranked as countries catching up with
Eco I, with Croatia with the highest rank, followed by Romania, Hungary and Bulgaria,
as last on the list.
Municipal waste indicators
In the report, we focused on data for municipal waste management indicators, as
the objective of extended producer responsibility is focused on fast moving
consumer goods ending in household waste streams.
Municipal waste consists to a large extent of waste generated by households, but
may also include similar wastes generated by small businesses and public
institutions and collected by the municipality; this part of municipal waste may vary
from municipality to municipality and from country to country, depending on the
local waste management system.
In this report, we chose indicators concerning municipal waste generation, recycling
and landfill.
Total municipal waste generation in the EEA countries declined by 3 % in absolute
terms and average generation per person by 7 % from 2004 to 2014. However, there
has been no uniform trend across countries, with an increase in municipal waste
generation per person in 16 and a decrease in 19 countries

48Projectco‐fundedbyEuropeanUnionfunds(ERDF,IPA)www.interreg‐danube.eu/moveco
48
Figure 7: Municipal waste generated per personxx (2004 and 2014)
Total municipal waste generationxxi in the EEA countries declined by 3 % in absolute
terms and average generation per person by 7 % from 2004 to 2014. However, there
has been no uniform trend across countries, with an increase in municipal waste
generation per person in 16 and a decrease in 19 countries

49Projectco‐fundedbyEuropeanUnionfunds(ERDF,IPA)www.interreg‐danube.eu/moveco
49
According to the ten year period presented, generated municipal waste has
increased in Croatia, Serbia, Slovakia, Germany and the Czech Republic and
decreased in Romania, Austria, Bulgaria, Slovenia and Hungary.
Figure 8: Municipal waste recyclingxxii (2004 to 2014)
50Projectco‐fundedbyEuropeanUnionfunds(ERDF,IPA)www.interreg‐danube.eu/moveco
50
One of the success stories of environmental policy in Europe is the increase in the
rates of municipal waste recycling (covering material recycling, composting and
digestion of bio-wastes). EEA countries achieved an average total recycling rate of
33 % in 2014, compared with 23 % in 2004 (EU-27: 31 % to 44 % over the same time
period) (Eurostat, 2016a).
Germany, Austria, Belgium, Switzerland, the Netherlands and Sweden
recycled at least half of their municipal waste in 2014.
The highest increase in recycling rates between 2004 and 2014 was reported
in Lithuania, Poland, Italy, the United Kingdom and the Czech Republic
(increase of 20–29 percentage points).
Overall, in 15 out of 32 countries, the increase in recycling rates was at least
10 percentage points over this period.
However, in seven countries, the proportion of recycled municipal waste
barely changed and in two countries, it even decreased slightly.
Increasing recycling rates and declining rates of landfilling are clearly linked. Usually,
landfilling declines much faster than the growth in recycling, as waste management
strategies mostly move from landfill towards a combination of recycling and
incineration, and in some cases also mechanical–biological treatment (EEA, 2013).
The recycling rates for generated municipal waste per capita in 2016 for our DTP
countries were highest in Germany, where they recycled 300 kg per capita of
municipal waste, followed by Slovenia with 199 kg of municipal waste recycled per
capita. Both values are well above the EU28 average value of 140 kg per capita. In
Hungary 102 kg of municipal waste was recycled per capita, Bulgaria 92 kg per
capita, The Czech Republic 91 kg per capita, Austria 85 kg per capita, Croatia 77 kg
per capita, Romania 14 kg per capita and Serbia 1 kg per capita.
The rate of municipal waste landfilling for the 32 EEA member countries fell from
49 % in 2004 to 34 % in 2014. The performance of individual countries varied. In

51Projectco‐fundedbyEuropeanUnionfunds(ERDF,IPA)www.interreg‐danube.eu/moveco
51
Austria, Belgium, Denmark, Germany, the Netherlands, Norway, Sweden and
Switzerland, virtually no municipal waste is sent to landfill. On the other hand,
Cyprus, Croatia, Greece, Latvia, Malta and Turkey still landfill more than three quarters
of their municipal waste.
Overall, the rates of landfilling decreased in 27 out of 32 countries. Between 2004
and 2014, the largest decreases occurred in Estonia (57 percentage points), Finland
(41 percentage points), Slovenia (41 percentage points) and the United Kingdom (41
percentage points).
The amount of municipal waste landfilled and incinerated in 2014 ranged from
102 kg/person in Slovenia to 480 kg/person in Malta, with an average of
270 kg/person in Europe (32 European countries). xxiii According to the latest data for
landfilling in 2016xxiv Germany and Austria have phased out landfilling, Slovenia
landfilled 38 kg of waste per capita in 2016. The Czech Republic sent 169 kg of
municipal waste per capita to landfill, Croatia 309 kg per capita. Slovakia 228 kg per
capita, Hungary 192 kg per capita, Bulgaria 260 kg per capita, and Serbia 211 kg per
capita in 2016, while Romania sent 178 kg per capita and Montenegro 488 kg per
capita to landfill in 2015.

52Projectco‐fundedbyEuropeanUnionfunds(ERDF,IPA)www.interreg‐danube.eu/moveco
52
Country characteristics We distributed the findings from the national EPR reports into three summaries
according to the ranking on the innovation and eco-innovation scoreboards and
geographic location, grouping together
Germany, Austria and Slovenia; subsequently referred to as G1.
Slovakia, the Czech Republic, Hungary, and Croatia; subsequently referred to
as G2.
Bulgaria, Romania, Serbia, Montenegro and Moldova; subsequently referred to
as G3.
For each group an overview was conducted regarding:
Innovation ranking
Eco-innovation ranking
Resource productivity
Municipal waste generation per capita, recycling rates for municipal waste per
capita and municipal waste quantities per capita being sent to landfill
How the EPR and supporting systems work for packaging and packaging
waste
How the EPR and supporting systems work for electronic and electrical
equipment, accumulators and batteries
Stakeholder perception on conditions for innovation and eco-innovation and
the opportunities for improvement in these areas arising from digitalisation
for each of the observed waste streams covered by EPR

53Projectco‐fundedbyEuropeanUnionfunds(ERDF,IPA)www.interreg‐danube.eu/moveco
53
Existing EPR schemes, practice and their effect on innovation
in Group 1
GROUP 1: Germany, Austria and Slovenia
The innovation scoreboard prepared in 2017 ranked Germany amongst innovation
leaders, Austria and Slovenia amongst strong innovators, The latest eco-innovation
scoreboard rank Germany as leader, Austria and Slovenia ranked in this same order
just above the EU average as average eco I performers.
Figure 9: Resource productivity Austriaxxv
The resource productivity index for Austria was 122,5, while the EU average was
141.
54Projectco‐fundedbyEuropeanUnionfunds(ERDF,IPA)www.interreg‐danube.eu/moveco
54
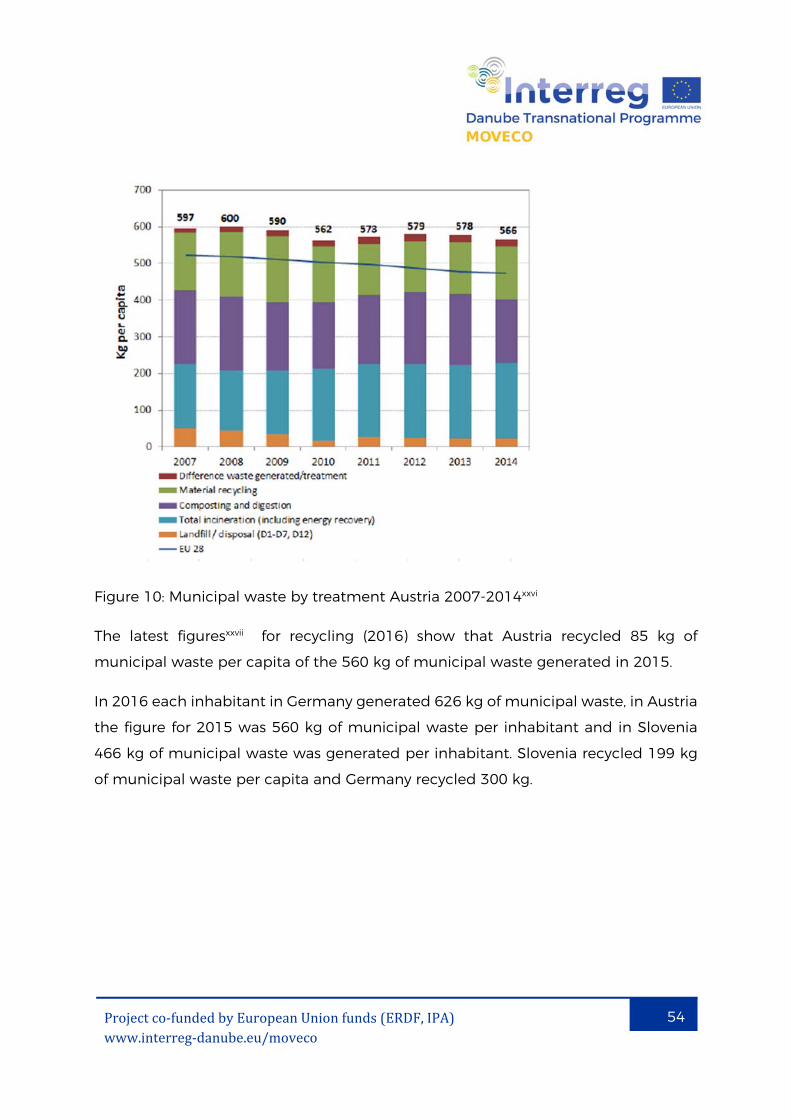
Figure 10: Municipal waste by treatment Austria 2007-2014xxvi
The latest figuresxxvii for recycling (2016) show that Austria recycled 85 kg of
municipal waste per capita of the 560 kg of municipal waste generated in 2015.
In 2016 each inhabitant in Germany generated 626 kg of municipal waste, in Austria
the figure for 2015 was 560 kg of municipal waste per inhabitant and in Slovenia
466 kg of municipal waste was generated per inhabitant. Slovenia recycled 199 kg
of municipal waste per capita and Germany recycled 300 kg.
55Projectco‐fundedbyEuropeanUnionfunds(ERDF,IPA)www.interreg‐danube.eu/moveco
55
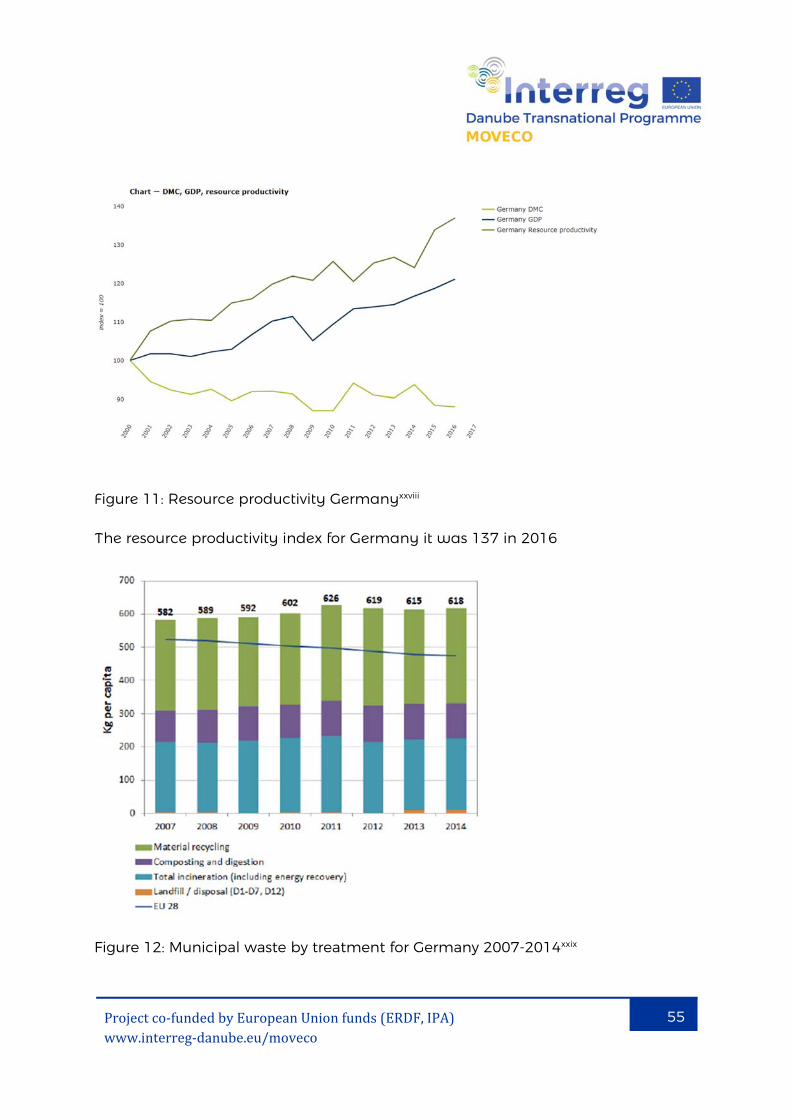
Figure 11: Resource productivity Germanyxxviii
The resource productivity index for Germany it was 137 in 2016
Figure 12: Municipal waste by treatment for Germany 2007-2014xxix
56Projectco‐fundedbyEuropeanUnionfunds(ERDF,IPA)www.interreg‐danube.eu/moveco
56
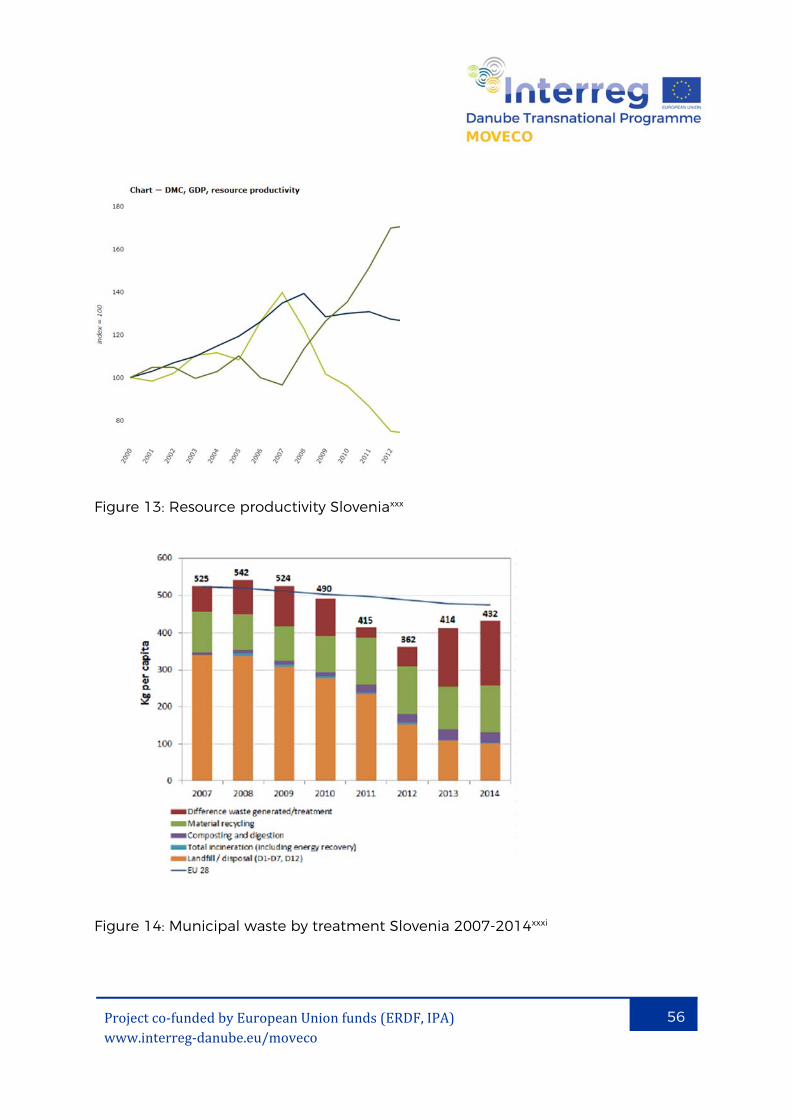
Figure 13: Resource productivity Sloveniaxxx
Figure 14: Municipal waste by treatment Slovenia 2007-2014xxxi
57Projectco‐fundedbyEuropeanUnionfunds(ERDF,IPA)www.interreg‐danube.eu/moveco
57
According to the Environmental Implementation Reviewxxxii published in the
beginning of February 2017 by the European Commission, Germany no longer
performs any waste landfill of municipal waste, with waste management procedures
consisting of incineration, composting and material recycling. The situation is similar
in Austria, with relatively small quantities of municipal waste being transferred to
landfills or other options for treatment. In Slovenia the share of waste being landfilled
is decreasing annually with the current rate of landfilling falling below 20 %, the rates
of incineration are small, while the share of composting is increasing, as is the
quantity of waste being treated by other methods. The level of material recycling is
also increasing. In 2016, Slovenia only landfilled 38 kg of municipal waste per capita
of the 466 kg of municipal waste generated per capita that year, reducing landfilling
below 10 %. All three countries have achieved their targets for EPR covered waste
streams.
The EPR schemes in each country situated in group 1, recognise multiple
competitive producer responsibility organisations or/and multiple competitive
recovery operators in all waste streams. The details of how the systems work in each
country are quite complicated and all of the details could not by covered in our
report.
How the systems apply to packaging and packaging waste
Austria and Germany have a dual model for packaging and packaging waste, where
industry has full operational and financial responsibility over collection, sorting and
recycling. There is a separate collection system designated to local authorities but
their influence is minimal. In Slovenia, the responsibility is shared between industry
and the local authorities based on common agreements regarding collection.
Municipalities are responsible for collection and perform sorting, though the level
and quality of this sorting differs from municipality to municipality. To date only
Austria has established two separate clearing houses for packaging and for electronic
and electrical equipment, to ensure that each PRO does its fair share, with the
Verpackungskoordinierungsstelle gemeinnützige GmbH or VKS or

58Projectco‐fundedbyEuropeanUnionfunds(ERDF,IPA)www.interreg‐danube.eu/moveco
58
Verpackungskoordinierungsstelle gemeinnützige GmbH for packaging and waste
packaging and the Elektro Recycling Austria GmbH or ERA for electrical and
electronic waste. Germany has a clearing house for electronic and electrical waste
and another one, planned for packaging, to be established in the second half of
2018,
Germany published a new packaging act in the beginning of July 2017, which will
continue to support the operation of multiple, competitive producer responsibility
organisations for packaging waste. The new act will also establish modulated fees
for packaging waste management according to recyclability. The Act shall come
into force on the 1st of January 2019, while producers and other stakeholders
obliged to fulfil packaging and packaging waste requirements will be required to
register with the newly formed clearing house in 2018.
Slovenia is planning a registration procedure for packaging. The initial registration
shall be done by obligated companies, regardless of packaging quantities placed on
the market, by the end of January 2018.
Both the German and Austrian legislation distinguish between consumer or
household packaging on the one hand and commercial, industrial packaging on the
other hand. Packaging waste determined as household waste requires producers
offering packaged goods on the market to comply with EPR obligations through
cooperation with a producer responsibility organisation.
A lot of comprehensive information on how the system works in Austria is available
at the website of the Austrian Chamber of Commerce.
With regard to commercial or industrial packaging, producers are left with more
leeway on how they handle it, when it becomes waste. This signals that this waste is
a positive commodity of value, though companies may choose to execute B2B
packaging obligations through the PRO together with their consumer, i.e. household
packaging.
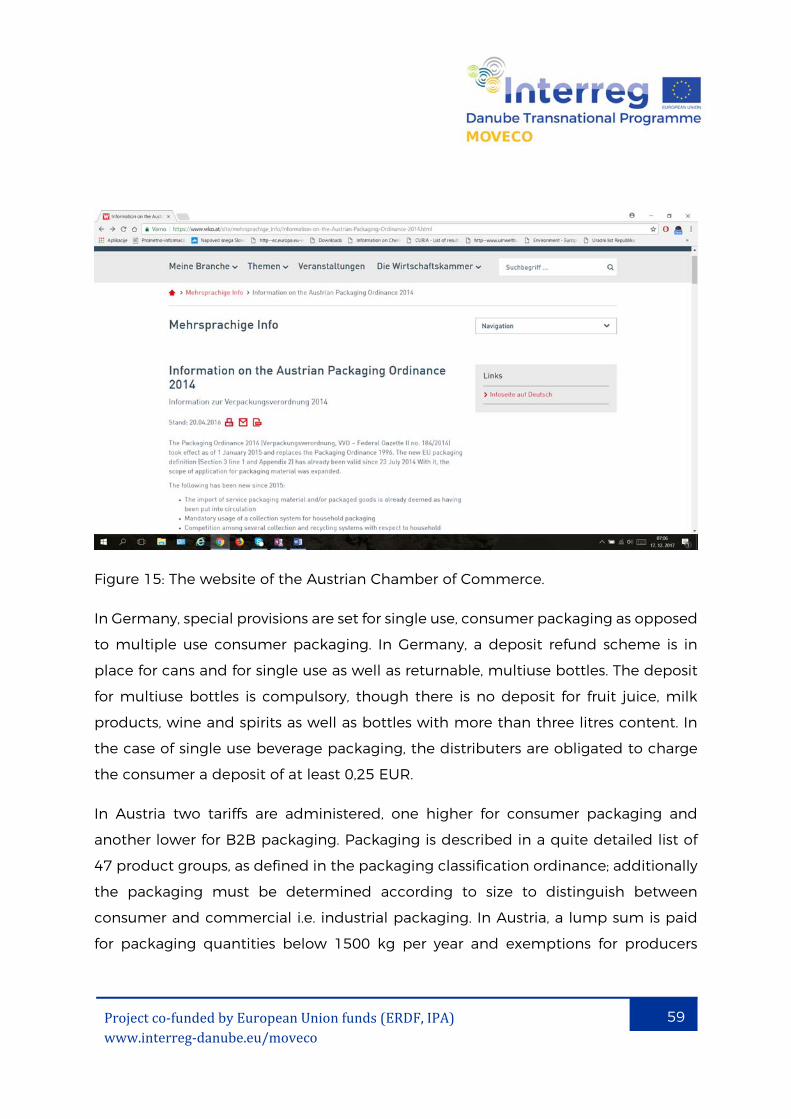
59Projectco‐fundedbyEuropeanUnionfunds(ERDF,IPA)www.interreg‐danube.eu/moveco
59
Figure 15: The website of the Austrian Chamber of Commerce.
In Germany, special provisions are set for single use, consumer packaging as opposed
to multiple use consumer packaging. In Germany, a deposit refund scheme is in
place for cans and for single use as well as returnable, multiuse bottles. The deposit
for multiuse bottles is compulsory, though there is no deposit for fruit juice, milk
products, wine and spirits as well as bottles with more than three litres content. In
the case of single use beverage packaging, the distributers are obligated to charge
the consumer a deposit of at least 0,25 EUR.
In Austria two tariffs are administered, one higher for consumer packaging and
another lower for B2B packaging. Packaging is described in a quite detailed list of
47 product groups, as defined in the packaging classification ordinance; additionally
the packaging must be determined according to size to distinguish between
consumer and commercial i.e. industrial packaging. In Austria, a lump sum is paid
for packaging quantities below 1500 kg per year and exemptions for producers

60Projectco‐fundedbyEuropeanUnionfunds(ERDF,IPA)www.interreg‐danube.eu/moveco
60
placing small packaging quantities on the market and additional thresholds per
material flow determine which producers may be exempt from the requirements for
packaging. Entitiesxxxiii putting minor quantities into circulation are merely obligated
to take back the packaging material put into circulation by them at the request of
their customers and convey it to a recycling system. Entities putting only minor
quantities into circulation have the option to avail themselves of a simplified disposal
at a collection and recycling system for commercial packaging. The quantities for
which exemptions apply are 300 kg per annum of paper board, cardboard,
corrugated cardboard; 800 kg of glass, 100 kg of metal packaging, 100 kg of plastic
packaging, 100 kg of wooden packaging and for all other packaging materials the
limit for exemption if 50 kg per annum.
In Slovenia the threshold for exemption of EPR obligations is 15 000 kg per annum,
entities having to comply with EPR obligations must do so for both types of
packaging or obtain an individual permit to manage their own, industrial packaging
waste from the State Environmental Agency.
In all cases, costs are administered per tonne according to packaging material with
additional specifications for reuse. There are no incentives for improved design for
recyclability, reparability, disassembly or biodegradability. Austria and Germany’s
pricelists published on the web distinguish higher prices for consumer packaging,
typically primary, smaller packaging, which is expected to end up in household
collection due to consumer consumption.
While pricelists are publicly available, final costs for packaging waste collection and
treatment are determined at PRO – company level in Slovenia, due to competition
between the multiple PROs.
How the systems apply to electronic and electric waste, batteries and accumulators
As both waste streams are often encountered and subsequently also managed
together, at least in regard to small portable batteries, we shall include them in the
report within the same heading. As with packaging and packaging waste, several

61Projectco‐fundedbyEuropeanUnionfunds(ERDF,IPA)www.interreg‐danube.eu/moveco
61
competitive PRO exist to manage waste electronic and electrical equipment as well
as batteries and accumulators. Some of the service providers in Germany and
Slovenia are specialised to cater to the requirements of specific waste streams such
as lighting equipment or industrial batteries and accumulators.
All three countries have established public registers where producers entering each
individual market must register. Registration in each country is the initial measure
required before products may be placed on the individual markets.
The total number of service providers in Germany is not known, but estimated to be
around a few dozen. The costs for waste management are differentiated into product
categories and then administered according to weight.
Elektroaltgeräte koordinierungstelleElektro Recycling Austria GmbH is the clearing
house for electronic and electrical waste in Austria.
Figure 16: The elektro-ade websitexxxiv
The Elektro-ade websitexxxv offers information concerning repair, collection and
recovery of electronic and electrical appliances and their waste in Austria.

62Projectco‐fundedbyEuropeanUnionfunds(ERDF,IPA)www.interreg‐danube.eu/moveco
62
The German national register for electronic and electrical equipment (Stiftung EAR)
Elektro- Altgeräte Register), was founded by producers, and acts as their clearing
house, taking care of registration, authorisation and provision of collection and
equipment for collection at municipal collection sites.
Slovenia has no clearing house. The registration for electronic and electrical
equipment is managed by the national environmental agency. As mentioned in the
information for Slovenia on packaging, a similar registration process for packaging
must be initiated and completed by the end of January 2018. By all producer placing
packaging or packaged goods on the market regardless of quantities.. The
environmental agency’s website also contains a list of drop off collection sites
managed by each scheme and information on further waste management.
Slovenia has an environmental tax for both packaging and electrical and electronical
equipment being put on the market, which is collected by the Customs Office. The
value of the taxes is not high, as they were envisioned for state bookkeeping, most
companies complain that the reporting is time consuming ensuing administrative
costs in work hours lost to prepare the required reports the taxation is based on.
General characteristics of stakeholder perception along the extended producer
responsibility waste streams
Innovation in general
Though innovation is regarded as an important aspect of modern business, the
ability and willingness of businesses to tap into its potential differs from sector to
sector. Innovation does not necessarily imply eco-innovation, though companies
systematically comply with environmental legislative requirements when designing
a new product or process. Companies feel they are not rewarded enough for eco-
design, i.e. eco-innovation. Additionally many requirements need to be fulfilled
regarding consumer safety and absolute traceability of material composition in order
to ensure there are no hazardous substances in the reused and recycled materials,
which hinder their use both for packaging, especially food packaging and the

63Projectco‐fundedbyEuropeanUnionfunds(ERDF,IPA)www.interreg‐danube.eu/moveco
63
production of electrical and electronic equipment. Not enough experience has been
gained yet with the use of new bio-based materials and/or new additional measures
and costs would be needed to verify their applicability and practical implementation.
The final product acceptance or non-acceptance of the product by consumers is
considered a risk for companies, which does not validate the risk of costs incurred.
Without increased consumer awareness, producers are hesitant to risk changes,
which could increase the price of the final product. There is a lack of incentives and
support for a wider use of bio-based or recycled materials with additional legislative
barriers in consumer and safety regulations, which cause extra costs and technical
uncertainties for wider application. Though in theory knowledge exists that better
product design is a key factor for the transition towards a circular economy, but
companies, especially SMEs, feel there are still too may barriers and risks involved
and no real incentives.
Innovation & Digitalisation
Digitalisation shares many common guiding principles with the circular economy,
such as systems thinking, innovation, collaboration, value optimisation and
transparency. The transition towards both digitalisation and circular economy is
quite complex, requiring knowledge, resources and support from top management,
which is not yet in place. The interviewees were usually not people directly involved
in digitalisation processes.
They track waste transport digitally together with issued procurement and sale
processes. Most stakeholders digitally manage administrative actions linked to
finances, sales and procurement. Many interviewees reported that digital tracking
ceased within the organisation, with waste handling onsite, though general input
and output of waste is tracked though waste transfer notes, that are registered in
the state waste information system. The private sectors seem to have more
experience with digitalisation than public ones. Larger companies and original
equipment manufacturers (OEM) are more aware of digitalisation, and the need to
reassess their operations in light of it. A study by the German Federal Ministry for the

64Projectco‐fundedbyEuropeanUnionfunds(ERDF,IPA)www.interreg‐danube.eu/moveco
64
Environment, Nature Conservation, Building and Nuclear Safety (BMUB) indicates
that no other lead market in the environmental sector stands to benefit from
digitalisation more than the circular economy. The study prepared by the Wuppertal
Institutexxxvi concludes that though Germany is still a world leader when it comes to
exporting technologies for the circular economy, this advantage will be seriously
threatened, if Germany does not start to make major investments in the digitalisation
of its own circular economy soon.
Innovation opportunities and challenges for packaging and packaging waste
The key role of packaging is to protect the product within the packaging. New
materials need to be adapted to production processes and fulfil product protection
demands requiring additional efforts and costs.
New bio-based materials are usually more expensive than conventional materials,
while final waste management costs or cooperation in PROs, do not reflect easier or
cheaper waste management, as fees are determined according to average costs per
material of all companies cooperating within a PRO.
Recycled materials require additional verification and testing, to ensure that they are
not contaminated with any hazardous or dangerous substances. Recycled packaging
materials may not be applicable for food packaging due to lingering smell or other
characteristics, which could have a negative effect on the organoleptic properties of
the food or beverage in the packaging. Traceability of incoming waste materials used
as material input and the contents of undesirable components is still difficult to
ensure.
Collectors and recyclers of packaging waste are wary of new materials due to their
influence of the recyclability of more widely used materials, such as PE, where
existing collection and treatment is supported by economy of scale. With the
65Projectco‐fundedbyEuropeanUnionfunds(ERDF,IPA)www.interreg‐danube.eu/moveco
65
increase of different forms of small-scale packaging and an increasing range of
packaging materials, collection and recycling is more difficult and expensive.
Due to safety regulations for packaging coming into contact with foods, new
materials must comply with food protection guidelines and traceability protocols
which must be adapted to the specifics of new materials.
Innovation opportunities and challenges for waste electrical and electronic equipment & waste batteries and accumulators
The WEEE, ROHS and eco-design directives have a strong influence on the
production of electrical and electronic equipment, which exceeds the influence of
EPR fees. There is concern that repair and preparation for reuse of waste electrical
and electronic equipment may have a negative impact on the sales of new
equipment (market cannibalism), with the possible handicap of equipment which
is repaired or prepared for reuse not living up to equipment safety standards.
Producers, which produce components that are installed into the production line of
original equipment manufacturers, do not feel in control of design in order to make
changes to support a circular economy. Technical constraints prevent the wider use
of recycled materials, especially plastic materials. Despite the RoHS directive
minimising or forbidding the use of certain hazardous substances in the production
of electrical and electronic equipment as well as batteries and accumulators, these
substances will remain in the material streams for some time before they will have
been diluted and eradicated. This will require long-term efforts and protocols to
ensure traceability and verify the actual composition of recycled materials and
components designated for reuse. Some countries have legislation forbidding the
reuse of salvaged components in new products or as spare parts. EPR requirements
do not support design for disassembly, reuse or recyclability with additional barriers
to enhance the use of some recycled materials due to higher contents of hazardous
substances in old appliances entering the material waste streams and requirements
imposed by chemical legislation – REACH (Registration, Evaluation, Authorisation of
Chemicals). Some aspects of design exist to protect intellectual property, such as
66Projectco‐fundedbyEuropeanUnionfunds(ERDF,IPA)www.interreg‐danube.eu/moveco
66
difficulty for disassembly and repair can be in direct opposition with the goals of a
circular economy.
Conclusions for Group 1
To support the transition towards a circular economy and enhanced innovation
incentives need to:
Reflect the cost of waste management and provide incentives for products
that are easier to disassemble, repair or upgrade,
Compensate costs for waste management and awareness raising, especially
for plastic packaging, with regard to its littering potential
Determine a compromise or intermediate solution to bridge the gap between
the opposing demands of waste legislation and product safety requirements
without endangering consumers.
It is necessary to understand the hazardous substances will be present in
circulating material waste streams for quite some time, due to their higher
contents in existing products, which are still entering the waste streams.
Awareness campaigns need to elevate consumer sensitivity.
Organisations, with emphasis on SMEs need additional assistance and
incentives to overcome technical, financial and knowledge barriers for the
introduction of new bio-based or improved recycled materials.
Incentives need to be provided for the design of products that present a lesser
burden on natural resources and society in general.
The draft of the circular economy legislative package currently under discussion at
EU level has determined most of the drawbacks of the existing EPR experience as
there seems to be as many approaches to EPR as there are countries and waste
streams.

67Projectco‐fundedbyEuropeanUnionfunds(ERDF,IPA)www.interreg‐danube.eu/moveco
67
Existing EPR schemes, practice and their effect on innovation
in group 2
GROUP 2: The Czech Republic, Slovakia, Croatia and Hungary,
The innovation scoreboard prepared in 2017 ranked the Czech Republic ranked at
the top of moderate innovators, followed by Slovakia, Hungary and Croatia, which
fall under the same category of innovators.
The latest eco-innovation scoreboard ranked the Czech Republic just above the EU
average as an average eco I performer. Slovakia is ranked as the last country in this
category, below EU average. Croatia and Hungary are ranked as catching up with
Eco I.
Of the 25 EU Member States whose resource productivity improved between 2000
and 2015 Croatia, was mentioned together with the countries which have, also
experienced an increase in demand for materials.
Figure 17: Resource productivity Croatiaxxxvii

68Projectco‐fundedbyEuropeanUnionfunds(ERDF,IPA)www.interreg‐danube.eu/moveco
68
Figure 18: Municipal waste by treatment Croatia 2007-2014xxxviii
In 2016 Croatia,xxxix at 402 kg of generated municipal waste per capita, noted an
increase in municipal waste generation. Of the municipal waste generated 309 kg
per capita was sent to landfill and 77 kg per capita was recycled.
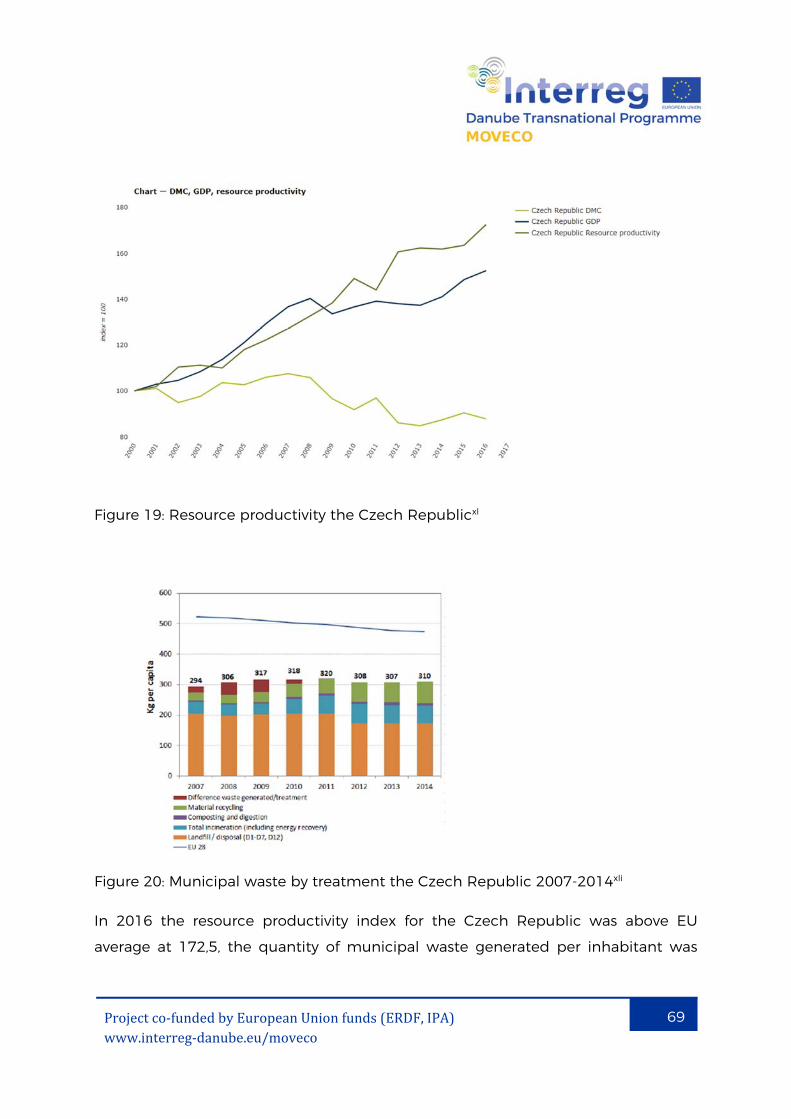
69Projectco‐fundedbyEuropeanUnionfunds(ERDF,IPA)www.interreg‐danube.eu/moveco
69
Figure 19: Resource productivity the Czech Republicxl
Figure 20: Municipal waste by treatment the Czech Republic 2007-2014xli
In 2016 the resource productivity index for the Czech Republic was above EU
average at 172,5, the quantity of municipal waste generated per inhabitant was
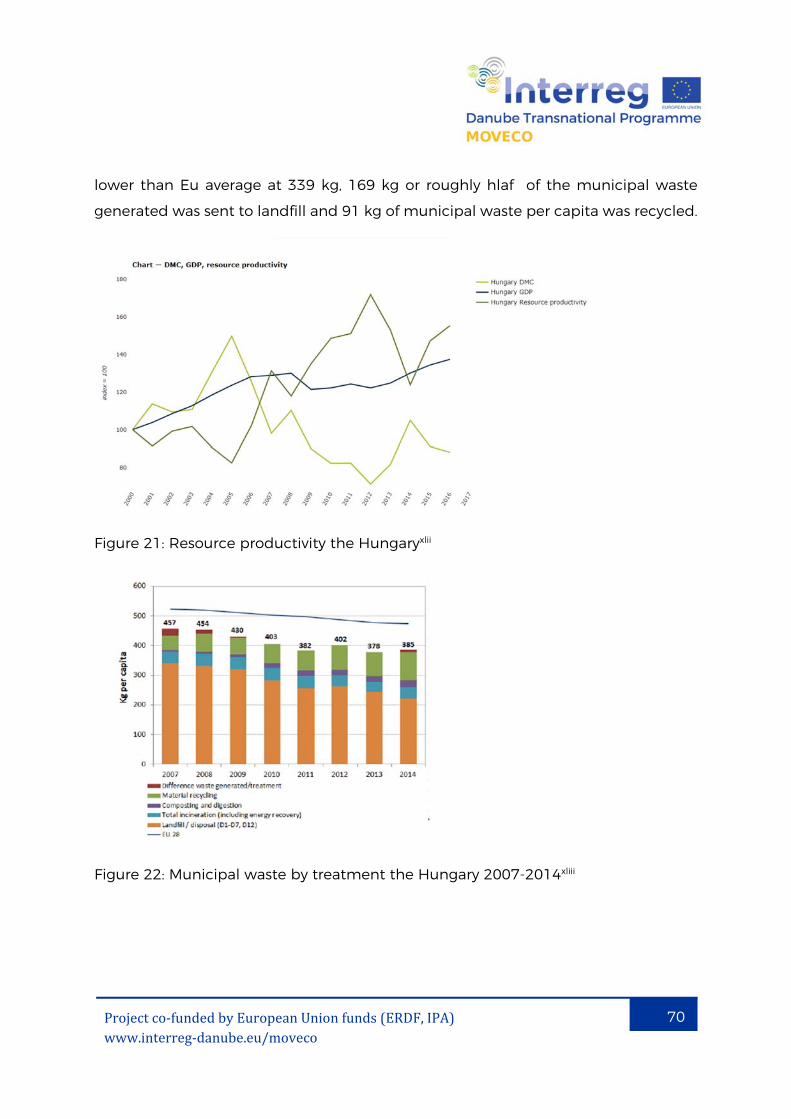
70Projectco‐fundedbyEuropeanUnionfunds(ERDF,IPA)www.interreg‐danube.eu/moveco
70
lower than Eu average at 339 kg, 169 kg or roughly hlaf of the municipal waste
generated was sent to landfill and 91 kg of municipal waste per capita was recycled.
Figure 21: Resource productivity the Hungaryxlii
Figure 22: Municipal waste by treatment the Hungary 2007-2014xliii
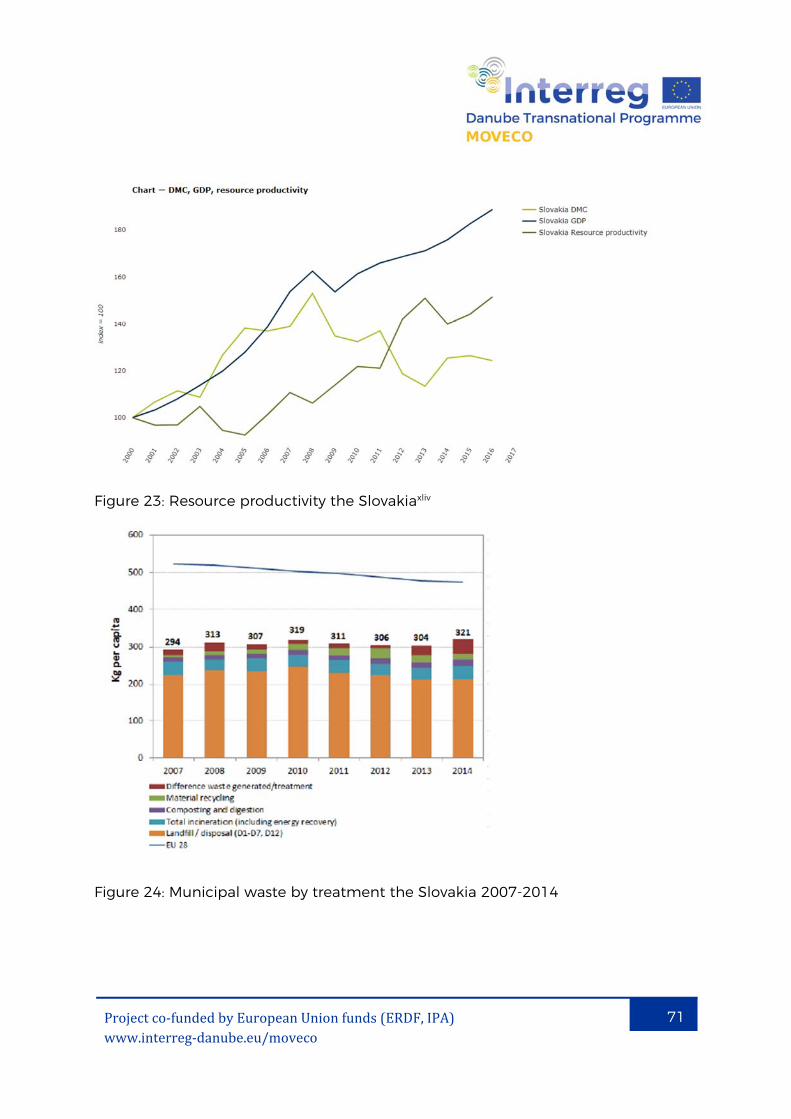
71Projectco‐fundedbyEuropeanUnionfunds(ERDF,IPA)www.interreg‐danube.eu/moveco
71
Figure 23: Resource productivity the Slovakiaxliv
Figure 24: Municipal waste by treatment the Slovakia 2007-2014

72Projectco‐fundedbyEuropeanUnionfunds(ERDF,IPA)www.interreg‐danube.eu/moveco
72
According to the latest municipal waste management Figureures for Slovakiaxlv, 348
kg of municipal waste was generated per capita in 2016, of this 228 kg was sent to
landfill and 54 kg of municipal waste per capita was recycled.
According to the Environmental Implementation Reviewxlvi published in the
beginning of February 2017, by the EU Commission, all four countries still landfill
more than half of the municipal waste generated in each country, with Croatia
transferring almost 75 % of their generated municipal waste to landfill. On average
the quantity of municipal waste generated per capita is lower than in other EU
countries by around 20%. Of all four countries, the share of material recycling is
lowest in Slovakia. With the exception of Croatia, incineration presents roughly over
10% of the municipal waste treatment.
The last published Environmental Implementation Reviewxlvii mentions, Hungary,
and Slovakia have been incurring difficulties in attaining their designated waste
targets.
In contrast to the EPR schemes presented in group 1, which were operating in
competitive conditions, the circumstances in group 2 countries are more varied. The
systems fluctuate between multiple PROs competing for clients in Slovakia; a system
combining one prevailing PRO for packaging and multiple competitor PROs for
WEEE in the Czech Republic; a state owned organisation in Hungary, implementing
EPR through product tax and an environmental fund, responsible for the
management of several financial programmes, actions and initiatives, being the
single organisation enforcing EPR in Croatia.
The producer responsibility scheme in Hungary was abolished in 2012 with the
implementation of a product charge law, which ceased the system operated by the
EPR schemes and put the management of recyclable waste into the hands of the
state. The most significant amendment of the regulation was that environmental
obligations and recycling targets prescribed for producers (packaging waste,
electronic waste) cannot be achieved via a coordinating organisation.

73Projectco‐fundedbyEuropeanUnionfunds(ERDF,IPA)www.interreg‐danube.eu/moveco
73
In Slovakia a new waste Act approved in 2015 came into force in 2016. With 11 PROs
managing packaging and packaging waste till 2017, 11 PROs managing waste
electrical and electronic equipment, and 7 PROs for batteries and accumulators the
PROs are subject to competition for every waste stream. According to the waste act,
these PROs must be non-profit. The new Act has legally defined the conditions for
a clearing house per EPR waste stream.
The Czech Republic has one PRO for packaging and packaging waste, 16 PROs for
waste electric and electronic equipment and two for batteries and accumulators.
Similarly to Hungary, Croatia has one umbrella PRO for all the mentioned EPR waste
streams. There was no mention of any clearing houses in any of the countries, except
Slovakia, where a coordination centre has been established for every waste stream,
though there is a yet, little practical experience to talk of.
How the systems work for packaging and packaging waste
In Hungary Packaging, electronic and electrical equipment, batteries and
accumulators are all subject to the environmental product fee, The Product Fee Act
actually applies to a variety of product categories which exceed the WEEE, battery
and packaging producer responsibility waste streams. In addition to EEE, batteries
and a range of packaging materials, the tax obligation also applies to tires, crude oil
products, chemical products (such as soap, deodorants and hair and beauty
products), certain plastic products, office paper and paper-based advertising
materials.
The Product Fee rates vary per kilogram placed on the Hungarian market, and taxed
product quantities are self-assessed. Data reporting and payment of the product fee
must be submitted quarterly to the tax authority, the National Tax and Customs
Authority, which also carries out product fee inspections. The amount relating to the
environmental product fee for each type of product is defined in the Act, with
separate rates applying to the various types of packaging materials. The
Environmental Product Fee Act enables companies to opt for a flat rate, in which

74Projectco‐fundedbyEuropeanUnionfunds(ERDF,IPA)www.interreg‐danube.eu/moveco
74
case they can perform their obligations on an annual basis provided, that they do
not exceed the relevant statutory thresholds.
The Environmental Product Fee Act not only imposes a payment obligation, but also
subjects companies to other types of obligations as well. Firstly, within 15 days of
starting their activities (in the case of non-Hungarian companies, this is most likely
the first sale to Hungary), the companies concerned must register themselves at the
National Tax and Customs Administration of Hungary (NTCA). Companies that fail to
register themselves within the above deadline lose the right to opt for the flat rate
product fee. Producers not registering or not qualifying for the flat rate must report
and pay on a quarterly basis.
Since 1 April 2016 the state owned, National Organizer of Waste and Asset
Management has been in charge of coordinating the public waste management
services at the national level, collecting the public service fees from the population
and paying the service fee to the public service operators for their activity. The
standard fee is to guarantee coverage of the actual costs of waste management
In Slovakia the fees for packaging are determined according to the weight and type
of different packaging materials being placed on the market and the average cost
for their waste management. No incentives exist for packaging which is easier to
collect, reuse, prepare for reuse or recycle.
In the Czech Republic, the sole PRO for packaging is Eko-kom, which operates a
nationwide system that provides take back and recovery of packaging waste. The
Eko‑kom System is based on the cooperation of industrial enterprises (clients), towns
and villages. The system ensures that waste from packaging used by the consumer
is sorted, transported by refuse collecting vehicles, finally sorted and used as a
secondary raw material. The cost to manage primary packaging, in contact with
products, which is most liable to end up in household collection bins is roughly 10
times the cost of secondary, transport and packaging ending up on industrial
locations through B2B transactions.
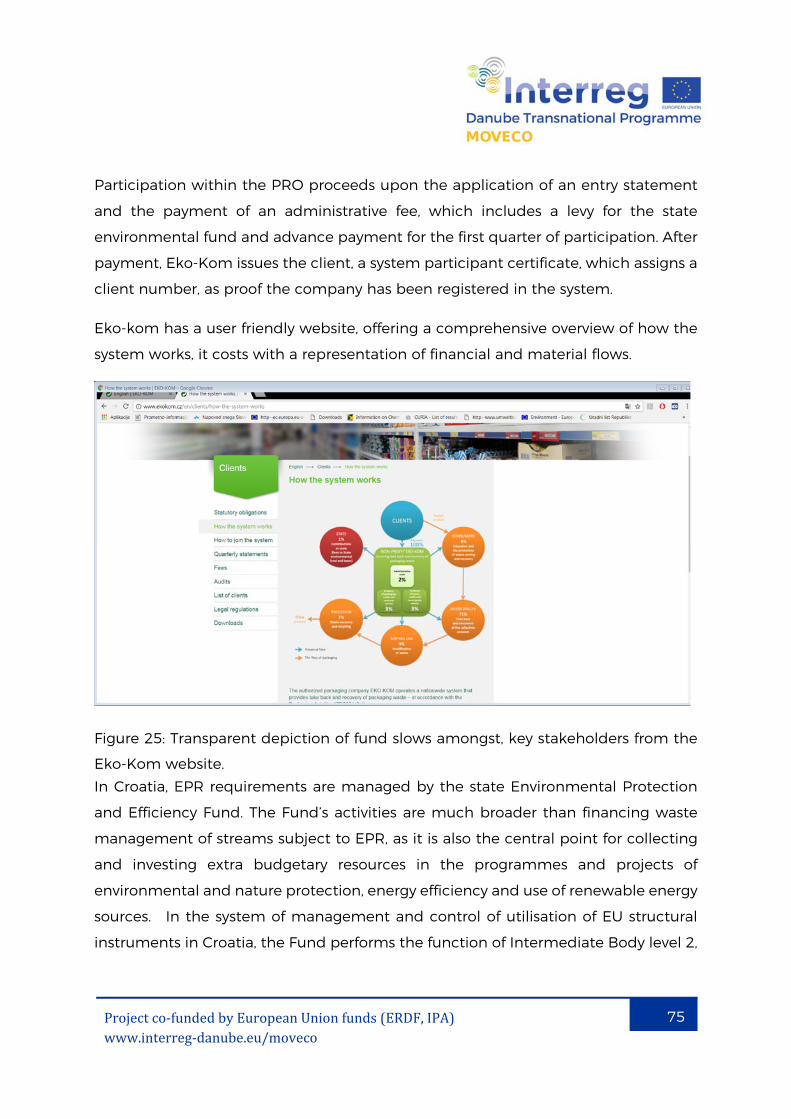
75Projectco‐fundedbyEuropeanUnionfunds(ERDF,IPA)www.interreg‐danube.eu/moveco
75
Participation within the PRO proceeds upon the application of an entry statement
and the payment of an administrative fee, which includes a levy for the state
environmental fund and advance payment for the first quarter of participation. After
payment, Eko-Kom issues the client, a system participant certificate, which assigns a
client number, as proof the company has been registered in the system.
Eko-kom has a user friendly website, offering a comprehensive overview of how the
system works, it costs with a representation of financial and material flows.
Figure 25: Transparent depiction of fund slows amongst, key stakeholders from the
Eko-Kom website. In Croatia, EPR requirements are managed by the state Environmental Protection
and Efficiency Fund. The Fund’s activities are much broader than financing waste
management of streams subject to EPR, as it is also the central point for collecting
and investing extra budgetary resources in the programmes and projects of
environmental and nature protection, energy efficiency and use of renewable energy
sources. In the system of management and control of utilisation of EU structural
instruments in Croatia, the Fund performs the function of Intermediate Body level 2,

76Projectco‐fundedbyEuropeanUnionfunds(ERDF,IPA)www.interreg‐danube.eu/moveco
76
for the specific objectives in the field of environmental protection and sustainability
of resources, climate change, energy efficiency and renewable energy sources.
The prices for packaging and packaging waste are published in the countries official
journal. The highest rates are paid per tonne for plastic bags (almost 200 EUR) and
general multi-layered packaging (100 EUR), while the cost for beverage multi-layered
packaging is just over 55 EUR. Additional fees for packaging of beverages exceeding
0,2l include a waste disposal fee of 0,013 EUR and deposit of 0,065 EUR per
packaging unit. Producers placing small quantities of packaging on the market are
exempt (between 50 kg of plastic and 300 kg of glass). Producers are obliged to
report to Fund quarterly and annually.
The Environmental Fund offers quite a lot of information on its website in English.
Nevertheless, a lot of practical information on how the process works, costs…are not
in English. Two PRO type organisations, Eko-Ozra and Interseroh, as the legislation is
missing for them to obtain PRO status, offer their consulting services to companies
to help them navigate through the different financial and administrative
requirements.
How the systems work for electronic and electric waste, batteries and accumulators
As mentioned in the packaging section, electronic and electrical equipment,
batteries and accumulators are all subject to the environmental product fee in
Hungary. A special decree stipulates the obligation to take back waste equipment
from the consumer, under the concept of like for like. WEEE can be collected door-
to-door and from waste collection yards.
The Slovak Waste Act (79/2015) introduced the obligation for producers of consumer
electrical and electronic equipment (EEE) to display the costs associated to the
recycling of their products. This Waste Act was published in March 2015; however,
the obligations for producers to display the Visible Recycling Fee have only been
mandatory since 1 January 2016. Prices for waste management are suggested by

77Projectco‐fundedbyEuropeanUnionfunds(ERDF,IPA)www.interreg‐danube.eu/moveco
77
compliance schemes per appliance unit in relevance to the WEEE category the
appliance falls under. The Ministry is responsible for registration and the public
register is accessible.
In the Czech Republic the registration body for the List of producers is the Waste
Management Department at the Ministry of the Environment of the Czech Republic,
Obligated producers must apply for registration with the List of Producers at the
Ministry of the Environment. For producers participating in collective schemes, the
application for registration in the List of producers is usually submitted by their
agents (collective scheme) on their behalf. A list of the collective schemes in the
Czech Republic is published on the ministries site. It is possible to obtain a permit
for an individual scheme, but an additional fee must be then paid to the collective
scheme for “historic” household electrical and electronic equipment, which was on
the market before the WEEE legislation was enforced.
Quarterly statements are required, declaring products placed onto the market.
Obligated producers can comply individually by setting up a collection and recovery
system at their own cost, through a system set up by two or more producers, or
through a Government authorised scheme (known as a collective scheme).
Membership of a collective system is generally recommended as much of the
administrative and legal burden associated with compliance will be offset. It is also
considered a cheaper option than the alternatives. If a producer chooses to comply
individually or through a combined system, the producer must apply for registration
with the List of Producers at the Ministry of the Environment directly. Distributors
must take back waste items from their customers on a “like for like” one for one basis,
regardless of where the waste product was originally purchased. Foreign companies
must also appoint an Authorised Representative in the Czech Republic to act as a
point of contact for the Czech authorities and take on their legal obligations.
Electronic and electrical waste, as well as waste batteries and accumulators in
Croatia are also managed by the Environmental Fund. The Fund is a legal entity

78Projectco‐fundedbyEuropeanUnionfunds(ERDF,IPA)www.interreg‐danube.eu/moveco
78
performing activities in the field of EE waste management coordination. The Fund
collects all information related to producers, collection operators and recovery
operators. The Fund annually forwards the collected data to the Agency which
prepares annual reports on EE waste management. The obligations of producers,
collectors, recovery operators are also determined in a special regulation published
in the national official journal. Reporting of quantities placed on the market is
monthly, though obligated companies are required to report annually to the State
Environmental Agency. The regulation published on the OJ website stipulates
electronic and electrical equipment must not contain hazardous substances, must
be disassembled easily and fit for reuse and recycling of both material and
components, while recycled materials must have use priority. The register for
producers of electrical and electronic equipment, batteries and accumulators is not
yet publicly accessible through the Fund website. The costs for waste electrical and
electronic equipment is 0,3 EUR per kg per category of electrical and electronic
equipment and 1,11 EUR per kg for portable batteries and accumulators.
General characteristics of stakeholder perception along the extended producer
responsibility waste streams
Innovation in general
In Hungary, innovation culture is present and usually linked to improvement of
existing products. There is a high perception that environmental innovation and
improvements are linked to higher costs, which cannot be validated in market prices,
limiting efforts to make products and production greener than the benchmark set
by technical regulation and legislative obligations.
Though Slovakia has a high share of high-technology exports, primarily due to
multinational companies operating in the country, the number of research centres
is low, as is the number of Slovak SMEs innovating in-house.
Stakeholders emphasize that due to foreign ownership, producing companies have
little influence on the design of the final product. Financial and personnel resources
79Projectco‐fundedbyEuropeanUnionfunds(ERDF,IPA)www.interreg‐danube.eu/moveco
79
are low, as is the availability of highly qualified R&D workers. The market demand for
eco-innovative products is low.
Although environmental issues or eco-innovation initiatives were not recognised as
a key innovation driver, the investigation revealed that a number of companies are
aware of the concept of eco-design, new materials and circular economy principles.
Similarly as in group 1, the stakeholder mentioned barriers limiting eco-innovation
efforts such as inconsistent legislation and insufficient information regarding the use
of recycled/new materials.
The Czech Republic has a good ranking on the eco-innovation scoreboard.
According to stakeholder perception, EPR schemes motivate companies during the
final stage of the product life cycle.
Due to increased emphasis on innovation during the waste management phase, the
collective schemes for WEEE have launched an initiative to focus producer attention
also on the design stage.
Stakeholders also mentioned that they recognised increased motivation for eco-
innovation from the strengthening of consumer environmental awareness, linking
entrepreneurial success with improving company reputation and upholding core
social values.
Stakeholders stressed a lack of funding for advanced, environmental technologies.
In Croatia there is an elevated interest in the opportunities being recognised in the
bio-based economy and recycled materials.
Croatian stakeholders stressed a lack of cooperation between economic operators
and research institutions
Digitalisation & Innovation
In Hungary, companies are aware of the importance of digitalisation, linking it
primarily to innovation having the potential to reduce costs for logistic operations.
80Projectco‐fundedbyEuropeanUnionfunds(ERDF,IPA)www.interreg‐danube.eu/moveco
80
"Public waste collectors are looking into new logistics solutions, RFID systems, apps
and other digital opportunities to increase public awareness on waste issues.
In Slovakia and in the Czech Republic, the importance of digitalisation was
recognised and linked as a driver to the development of new business models,
delivering services instead of products. Waste collection services have begun
inserting sensors into waste containers supporting real-time monitoring and
optimizing waste collection. Digitalisation is also a good tool to improve logistical
operation. Private organisations seem to have more experience with digitalisation
than public ones and digitalisation is no only an important factor supporting
innovation, but also an instrument providing daily operational support in companies.
Innovation opportunities and challenges for packaging and packaging waste
As in the previous group, the complexity of circular economy principals was
emphasised as an obstacle linked to the conflicting requirements of different
legislative aspects to circular economy goals. A typical example is product safety and
functionality, which producers must adhere to, i.e. biodegradable packaging coming
into contact with food, must correspond to food safety requirements and provide
food protection. Consumer preferences were also mentioned as a limiting factor.
In Slovakia, stakeholders felt that the opportunities to reuse packaging were more or
less limited to local markets, due to high collection costs for packaging waste and
its preparation for reuse.
In case of new/recycled materials, the Slovak and Czech stakeholders mentioned the
higher prices of these materials, as well as concerns related to their reliability and
material purity, hindering their wider use. PROs and recyclers also emphasised the
negative influence of bio-based plastic material on the quality of recycled plastic if
the entered the wrong waste stream at end-of-life.
81Projectco‐fundedbyEuropeanUnionfunds(ERDF,IPA)www.interreg‐danube.eu/moveco
81
In Croatia, stakeholders stressed that the current system for packaging places too
much emphasis on plastic beverage bottles and the operation of a deposit scheme.
The system is disproportional allocating roughly 75 % of the financing to treat 1/3 of
the waste stream consisting of beverage packaging and the other 25 % for financing
to treat the remaining 2/3 of the packaging waste stream. The current system does
not stimulate companies to innovate, recycle or develop technologically.
A glass recycler in Croatia stressed lack of incoming glass packaging waste, which
could be attributed also to inadequate waste separation in households, which
should pay more if the rate of mixed waste from individual households is higher.
Innovation opportunities and challenges for waste electrical and electronic equipment & waste batteries and accumulators
The concern for conflicting circular economy opportunities and product safety was
especially highlighted in the case of electrical and electronic equipment with
reference to the use of new materials, especially bio-based ones and reduced
functional characteristics of recycled materials (plastics)
Conclusions for Group 2
The group is highly diverse with regard to how the challenges and opportunities
presented by eco-design and design for a transition towards a more circular
economy are perceived. The eco-innovation index has clearly registered a shift
towards eco-design in the Czech Republic, while Hungary and Croatia are listed
towards the bottom of the eco-innovation scoreboard for 2016.
Stakeholders highlighted that in order to support the application of circular
economy principles, raising environmental awareness and thus increasing demand
for eco-innovation is crucial.
The perception of the stakeholder with regard to opportunities available through
focus and introduction on eco-design, mirror the eco-innovation scoreboardxlviii, with
Hungary dropping down to the second last, or 27th of the 28 countries ranked.
82Projectco‐fundedbyEuropeanUnionfunds(ERDF,IPA)www.interreg‐danube.eu/moveco
82
Foreign ownership was mentioned as a deterrent for eco-innovation as, research and
development units are located elsewhere, redirecting innovation and eco-innovation
activities from the countries with a high rate of foreign owned business organisations.
Due to this, innovation is more oriented towards smaller incremental measures,
which can be observed and implemented with lesser resources.
Conflicting legislative requirements at EU level were also noted in this group of
countries, emphasising a need to find a common approach to reconcile opposing
requirements to avoid potential market barriers, due to different prevailing criteria
from country to country.
Most of this group of countries still have issues with high rates of municipal waste
still being directed to landfills, which is also reflected in the efforts invested mainly
in the waste end of the product cycle, with less priority on the design phase of
product life.

83Projectco‐fundedbyEuropeanUnionfunds(ERDF,IPA)www.interreg‐danube.eu/moveco
83
Existing EPR schemes, practice and their effect on innovation
in group 3
GROUP 3: Bulgaria, Romania, Serbia, Montenegro and Moldova
The innovation scoreboard prepared in 2017 ranked Serbia amongst moderate
innovators. Bulgaria and Romania were ranked as modest innovators. Romania and
Bulgaria were ranked as countries catching up with Eco I on the latest Eco-
innovation scoreboard. No additional information was found for Serbia, Moldavia and
Montenegro with regard to these categories.
According to the Environmental Implementation Reviewxlix published in the
beginning of February 2017, by the EU Commission, Bulgaria and Romania exhibited
the least resource productivity, with the highest share of GDP in EURO per kg of
resource. Serbia was ranked between Bulgaria and Romania.
Figure 26: Resource productivityl (GDP/DMC), participating countries and EU-28
(2000, 2007 and 2014)

84Projectco‐fundedbyEuropeanUnionfunds(ERDF,IPA)www.interreg‐danube.eu/moveco
84
Both Bulgaria and Serbia have made progress according to the 2016 EU datali with
regard to resource efficiency. Romania remains at the bottom of the list. The latest
data, from 2015 and 2016 reveal resource productivity indexes still below the EU
average of 141. Serbia has a resource productivity index of 133, Bulgaria 120 and
Romania far below with an index of 64,4. Similar indexes were not available yet for
Montenegro and Moldavia.
The Environmental Implementation Reviewlii reported over half of the municipal
waste ending up in landfills in Bulgaria, almost 2/3 of generated municipal waste
ending up in landfill in Romania, around 20 % of municipal waste is recycled in
Bulgaria and extremely low recycling levels in Romania.
The EPR schemes in each country situated in group 3
Figure 27: Resource productivity Bulgarialiii
The quantity of generate municipal waste was below EU average for Bulgaria with
404 kg of generated municipal waste per capita in 2016, Romania with 247 kg of
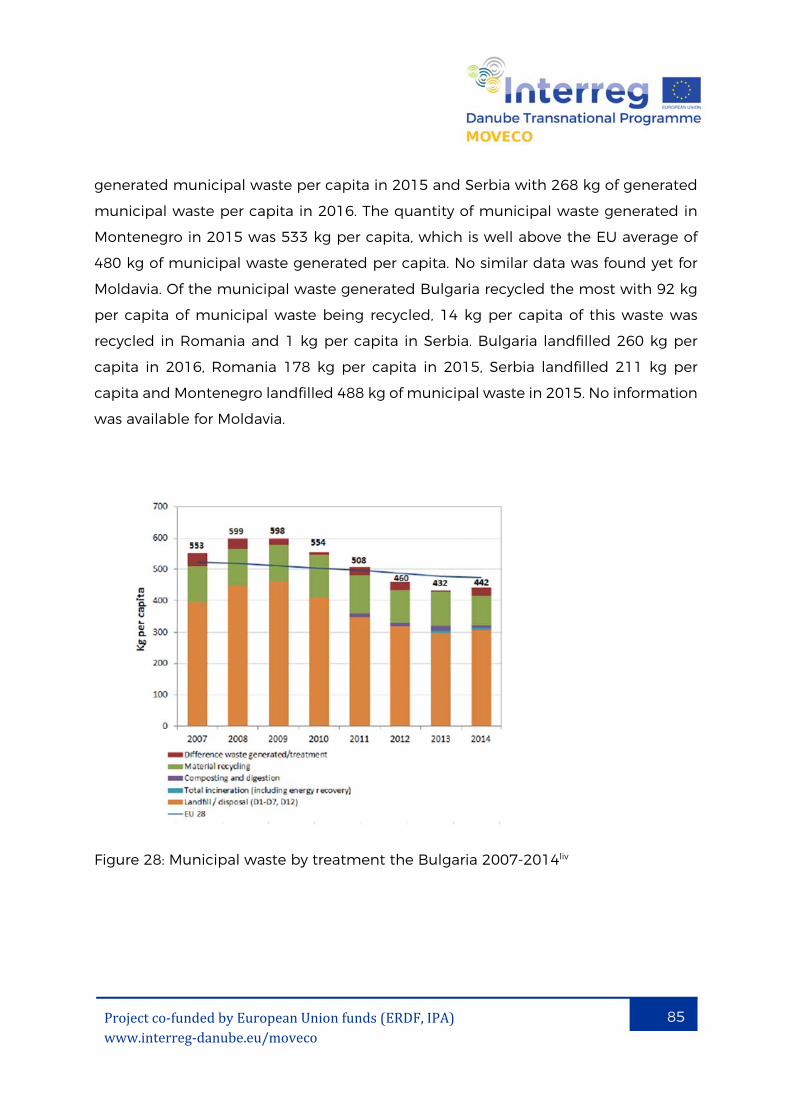
85Projectco‐fundedbyEuropeanUnionfunds(ERDF,IPA)www.interreg‐danube.eu/moveco
85
generated municipal waste per capita in 2015 and Serbia with 268 kg of generated
municipal waste per capita in 2016. The quantity of municipal waste generated in
Montenegro in 2015 was 533 kg per capita, which is well above the EU average of
480 kg of municipal waste generated per capita. No similar data was found yet for
Moldavia. Of the municipal waste generated Bulgaria recycled the most with 92 kg
per capita of municipal waste being recycled, 14 kg per capita of this waste was
recycled in Romania and 1 kg per capita in Serbia. Bulgaria landfilled 260 kg per
capita in 2016, Romania 178 kg per capita in 2015, Serbia landfilled 211 kg per
capita and Montenegro landfilled 488 kg of municipal waste in 2015. No information
was available for Moldavia.
Figure 28: Municipal waste by treatment the Bulgaria 2007-2014liv

86Projectco‐fundedbyEuropeanUnionfunds(ERDF,IPA)www.interreg‐danube.eu/moveco
86
Figure 29: Resource productivity Romanialv
Figure 30: Municipal waste by treatment the Romania 2007-2014lvi

87Projectco‐fundedbyEuropeanUnionfunds(ERDF,IPA)www.interreg‐danube.eu/moveco
87
The EPR schemes in each country situated in group 3
This group is most difficult to compare, as it is difficult to find relevant, common
indicators for the whole group and the legislation of current non EU members is still
evolving. In Romania and Bulgaria, a number of producer responsibility
organisations provide their services under competitive conditions. Both national
reports state that the introduction of PRO systems has been beneficial for waste
management and especially increased recycling. In Bulgaria, the legislation was
updated in 2013 and 2015 with the expectation that waste management will
improve. The data collected by Eurostat for 2016 notes there has been an
improvement in the country’s resource efficiency index, while 260 kg of municipal
waste was still reported as being sent to landfill. State strategic documents up to
2020 draw measures for Bulgaria to join the “moderate innovator” group during this
period.
Serbia, Montenegro and Moldova, still on the threshold to the EU, are not included
in most of the index ratings and comparisons available to EU countries for
benchmarking. All three countries are investing efforts in activities to lay the
foundation for compliance with EU waste legislation demands, such as determining
industrial and municipal waste quantities, required infrastructure for municipal
waste collection and treatment, diversion from landfill, capacity building and
legislation alignment.
The legal framework on waste management is partially aligned in Montenegro. In
order to further align with the acquis, amendments to the law on waste
management were adopted in 2015 and 2016. Considerable efforts are needed to
ensure implementation of the national strategy for waste management until 2030
and the 2015-2020 national waste management plans. Special attention needs to
be given to the implementation of local waste management plans, to waste separate
collection and recycling as well as to the strengthening of financial and
administrative capacities at local/municipal level. Implementation of the waste law
must be strengthened, in particular in the area of illegal waste disposal and

88Projectco‐fundedbyEuropeanUnionfunds(ERDF,IPA)www.interreg‐danube.eu/moveco
88
temporary disposal siteslvii. From the national report received from Montenegro it
appears a lot of efforts are being invested into municipal infrastructure for collection
in order to support the implementation of extended producer responsibility.
Regarding waste management, there is a good level of alignment with the EU’s
principal waste directives in Serbia, with recent progress made regarding the waste
framework, landfill and industrial emissions directives. Implementation remains at
an early stage, with some progress noted in increased rates of municipal waste
collection and sanitary landfilling. The national waste management strategy and
municipal waste management plans need to be updated to reflect the new legal
provisions on e.g. waste minimisation and waste separation at source, and to include
quantitative targets for waste recovery and recycling. Increased efforts are needed to
close Serbia’s non-compliant landfills more quickly and invest in waste separation
and recycling. A national integrated waste management plan and additional
economic instruments for special waste streams need to be developedlviii. In Serbia
six PROs for packaging and packaging waste operate under competitive conditions.
PROs for electrical and electronic equipment are not yet established. Quantities of
electrical and electronic equipment, batteries and accumulators placed on the
market in Serbia must be reported to the Environmental Protection Agency, while
fees for these products are paid into the Green Fund.
Moldova is in the process of establishing a legislative and infrastructural framework
to support better alignment with EU acquis demands. The waste management
strategy of the Republic of Moldova for 2013-2017 contains goals to implement EPR
compliance schemes for five waste streams, including packaging and packaging
waste, waste electronic and electric equipment, batteries and accumulators.
A waste law was put in place in 2016. Nineteen product categories are subject to
environmental tax set as a percentage of the product price. Plastic packaging,
including polyethylene and PVC (bulk), paper, cardboard, tetrapack packaging (bulk),
batteries, lead-containing products and electric bulbs. The plastic packaging tax is
very broadly interpreted by the Customs service and is levied on all kinds of

89Projectco‐fundedbyEuropeanUnionfunds(ERDF,IPA)www.interreg‐danube.eu/moveco
89
packaging regardless of size. The OECD report states Moldova’s system of
environmental product taxes is that it does not target or affect producer or consumer
behaviour but essentially serves to generate revenue for the National Environmental
Fund. The tax on packaging bears a very high administrative cost but no real impact.
It does not stimulate a shift to imported products using less packaging. Though
competitive schemes exist for each waste stream, where extended producer
responsibility is being enforced, no clearing houses exist yet.
Extended producer responsibility has a strong connotation with waste management.
Probably due to the increased efforts these countries are investing to improve waste
infrastructure and waste management in general.
How the systems work for packaging and packaging waste
In Serbia producer responsibility organisations have been established for packaging.
Six PROs for packaging and packaging waste operate under competitive conditions.
Quantities of electrical and electronic equipment, batteries and accumulators
placed on the market in Serbia must be reported to the Environmental Protection
Agency, while fees for these products are paid into the Green Fund that became
operational on the 1st January 2017, as a body within the Environmental
Ministry. The Green Fund is envisioned as a budgetary fund serving to finance the
preparations, implementation and development of programs, projects and other
activities in the field of preservation, sustainable use, protection and improvement of
the environment. The Green Fund will help in financing the recycling industry
Up to 80 % of raw materials for the recycling industry, scrap paper, iron, PVC, bottles,
batteries has been collected until now, by unregistered collectors of secondary raw
materials. The national platform plan to include these of collectors and incorporate
them in the legal business system by local self-governments during 2017.
Companies with obligations to manage packaging and packaging waste can decide
to transfer their responsibility to one of the six PROs, and submit an annual report to
the Environmental Protection Agency. Costs are based according to material type
90Projectco‐fundedbyEuropeanUnionfunds(ERDF,IPA)www.interreg‐danube.eu/moveco
90
and quantity. The price is roughly 0.0084 EUR per kg, with a 50% higher price per kg
of plastic, a roughly 10 % lower price for paper and cardboard and an approximately
10 % higher price for glass, metal and wood per kg.
Companies in Serbia can also opt to organize their packaging waste management
individually and submit a report to the Environmental Protection Agency.
Companies may also choose to submit their annual report to the Environmental
Protection Agency and pay a fee to the Ministry responsible for environmental
protection.
A similar system seems to be in place in Bulgaria for packaging. PRO members are
exempt from paying a product fee. A company may choose to manage waste
through an individual scheme or it can pay a product fee to the state Enterprise for
Management of Environmental Protection activities (EMEPA). Reporting to EMEPA,
regarding quantities placed on the market, if the company has joined a collective
producer responsibility organisation, reporting to EMEPA is part of the service
provided by the organisation. The fee paid directly to EMEPA is published in the
official state journal, and is usually higher than the costs paid to a collective PRO for
packaging waste management.
The Ministry for Environment may decide to arrange an audit in any stakeholder
organisation along the waste value chain. Usually companies generating smaller
amounts of packaging waste choose to pay the product fee to EMEPA, so this can
be perceived almost as a lump sum arrangement for companies, where packaging
quantities put on the market are erratic and low. Incomes generated by EMEPA are
small and are used to improve local municipal infrastructure. The product fee is paid
according to the weight of individual packaging materials put on the market and is
highest for plastic and composite materials. PROs must collect and treat packaging
waste quantities in accordance with their market share. Collective and individual
PROs are monitored and controlled by the Executive Environmental Agency and 16
regional Inspectorates for Environment and Water. PROs send technical and
91Projectco‐fundedbyEuropeanUnionfunds(ERDF,IPA)www.interreg‐danube.eu/moveco
91
financial reports, which are audited by independent certifies auditors annually. The
Executive Environmental Agency manages the National Waste information Systems,
which include several waste registers. With regard to packaging there is a register of
entities placing plastic bags on the market. From the 1st of January the National
Waste Information System will be available online.
Romania enforces extended producer responsibility through competitive PROs. In
addition to EPR requirements, a tax is paid for packaged good placed on the market.
An Eco-tax is also demanded for plastic bags, amounting to 0,1 EURO per bag.
Currently 12 collective extended producer responsibility schemes have been
approved for packaging and packaging waste in Romania. The websites of each PRO
provide general information concerning their services, while the final details are only
available to partners. PROs also offer services to help companies optimize packaging
waste management. The Ministry for Environmental and Forestry performs
monitoring and enforcement in collaboration with the Environmental Agency,
Inspectorate and Environmental Fund.
How the systems work for electronic and electric waste, batteries and accumulators
In Bulgaria, all the existing PROs for waste electrical and electronic equipment and
batteries and accumulators operate collective schemes under competitive
conditions supported by contracts. Both the PROs for packaging and for electrical
and electronic equipment are non-profit. In Romania, all the existing PROs for waste
electrical and electronic equipment and batteries and accumulators operate
collective schemes under competitive conditions
In Romania a tax is collected for portable batteries and accumulators, when they are
placed on the market.
In Serbia, PROs for waste electronic and electrical equipment have not been
implemented, though private companies are taking initiative and have begun
collecting waste electrical and electronic equipment so it can be treated
appropriately.

92Projectco‐fundedbyEuropeanUnionfunds(ERDF,IPA)www.interreg‐danube.eu/moveco
92
In Moldova a bilateral pilot project is being carried out with Slovakia to develop an
EPR scheme for waste electronic and electrical equipment. A collective scheme
would imply the establishment on a voluntary basis. An agreement would be signed
between producers in a collective scheme, through a producer responsibility
organisation and municipalities on the conditions and financing of WEEE collection.
Producers of the PRO would also be responsible for offering take-back points in
stores selling electric and electronic products. The government’s role would be
limited to monitoring and enforcement by the State Environmental Inspectorate.
General characteristics of stakeholder perception along the extended producer
responsibility waste streams
Innovation in general
The stakeholders in Bulgaria stressed the need for measures and incentives to
support eco-innovation, suggesting reduced taxation, additional funding, green
public procurement. The stakeholders also recognised the need for increased
transparency of PRO operation to ensure financial and material flows are congruent.
They also proposed the introduction of pay as you throw fees and fees for waste,
which would motivate business to reduce, re-use, recycle etc. Current fees to manage
waste are applied according to property value.
In Romania, eco-design does not seem to be a primary driver. Companies facing
strong global competition state that this has a greater influence on eco-design than
extended producer responsibility.
Innovation & Digitalisation
Economic operators are aware of the importance of digitalisation, but there is not
enough support for its broader implementation. There is a lack of R&D organisations
able to support the process.

93Projectco‐fundedbyEuropeanUnionfunds(ERDF,IPA)www.interreg‐danube.eu/moveco
93
Innovation opportunities and challenges for packaging and packaging waste
The stakeholders in Romania alerted to existing issues that still need to be resolved
in order to improve the operation of the system. The issues are lack of infrastructure
for selective collection and complicated legislation, which is difficult to understand.
In the case of glass packaging, recyclers pointed out that the costs to collect the
waste glass is the same, as the costs of the finished product, so evidently the fees
collected by PRO, do not finance the costs for recycling.
All countries stated lack of infrastructure to support the efficient operation of waste
management. Due to this, there is a higher focus on waste and its management than
on eco-design.
In addition to the lack of waste management infrastructure and in some cases also
of supporting legislation, there is also a lack of knowledge, know-how, and awareness
raising to incentivize citizens, while appropriate financial support is also a large
problem.
Innovation opportunities and challenges for waste electrical and electronic equipment & waste batteries and accumulators
In Romania a problem of illegal collection and disassembly of waste electrical and
electronic equipment.
All countries stated lack of infrastructure to support the efficient operation of waste
management. Due to this, there is a higher focus on waste and its management than
on eco-design.
In addition to the lack of waste management infrastructure and in some cases also
of supporting legislation, there is also a lack of knowledge, know-how, and awareness
raising to incentivize citizens, while appropriate financial support is also a large
problem.
94Projectco‐fundedbyEuropeanUnionfunds(ERDF,IPA)www.interreg‐danube.eu/moveco
94
Conclusions for Group 3
The countries in group 3 still lack the infrastructural and/or legislative framework for
the extended producer responsibility schemes to work efficiently. It is no surprise
that the focus of all the stakeholders is more centred on waste management than
on the design at the beginning of the product cycle.
In addition to the lack of waste management infrastructure and in some cases also
of supporting legislation, there is also a lack of knowledge, know-how, awareness
raising to incentivize citizens, while appropriate financial support is also a large
problem.
PROs working for profit are more interested in the end phase of product life and
waste management than stimulating eco-design to minimize waste.
References i https://www.eea.europa.eu/publications/circular-economy-in-europe/at_download/file ii http://ec.europa.eu/environment/eir/index_en.htm iii http://ec.europa.eu/growth/industry/innovation/facts-figures/scoreboards_sl iv https://ec.europa.eu/environment/ecoap/indicators/index_en vhttp://ec.europa.eu/eurostat/documents/3217494/7827738/KS-EI-16-001-EN-N.pdf/bbb5af7e-2b21-45d6-8358-9e130c8668ab vi https://www.eea.europa.eu/soer-2015/countries-comparison/waste vii https://www.eea.europa.eu/soer-2015/countries-comparison/waste

95Projectco‐fundedbyEuropeanUnionfunds(ERDF,IPA)www.interreg‐danube.eu/moveco
95
viii http://ec.europa.eu/eurostat/tgm/refreshTableAction.do?tab=table&plugin=1&pcode=tsdpc240&language=en ix BMUB 2016; Digitalisierung der GreenTech-Branche lohnt sich, Pressemittelung Nr. 297/16, berlin x http://ec.europa.eu/environment/resource_efficiency/documents/factsheet_en.pdf xihttps://www.eea.europa.eu/airs/2016/resource-efficiency-and-low-carbon-economy/resource-efficiency xiihttp://ec.europa.eu/eurostat/statistics-explained/index.php/Material_flow_accounts_and_resource_productivity xiiihttp://ec.europa.eu/eurostat/documents/3217494/7827738/KS-EI-16-001-EN-N.pdf/bbb5af7e-2b21-45d6-8358-9e130c8668ab xivhttps://www.eea.europa.eu/data-and-maps/daviz/dmc-gdp-resource-productivity-population-1#tab-chart_1_filters=%7B%22rowFilters%22%3A%7B%7D%3B%22columnFilters%22%3A%7B%22pre_config_category%22%3A%5B%22DMC%22%3B%22GDP%22%3B%22Resource%20productivity%22%5D%3B%22pre_config_ugeo%22%3A%5B%22European%20Union%20(28%20countries)%22%5D%7D%7D xvhttps://www.eea.europa.eu/data-and-maps/daviz/dmc-gdp-resource-productivity-population-1#tab-chart_1_filters=%7B%22rowFilters%22%3A%7B%7D%3B%22columnFilters%22%3A%7B%22pre_config_category%22%3A%5B%22DMC%22%3B%22GDP%22%3B%22Resource%20productivity%22%5D%3B%22pre_config_ugeo%22%3A%5B%22European%20Union%20(28%20countries)%22%5D%7D%7D xvihttp://ec.europa.eu/eurostat/statistics-explained/images/1/1b/Resource_productivity_-_GDP_DMC_by_country%2C_2000-16_%28Index_2000_%3D_100%29.png xvii http://ec.europa.eu/growth/industry/innovation/facts-figures/scoreboards_sl xviii file:///C:/Users/cerar/Downloads/EIS2017_Executive_summmary_en.pdf xix https://ec.europa.eu/environment/ecoap/indicators/index_en xx https://www.eea.europa.eu/soer-2015/countries-comparison/waste xxihttps://www.eea.europa.eu/themes/waste/municipal-waste/municipal-waste-management-across-european-countries xxii https://www.eea.europa.eu/soer-2015/countries-comparison/waste xxiii https://www.eea.europa.eu/themes/waste/municipal-waste/municipal-waste-management-across-european-countries xxiv ttp://ec.europa.eu/eurostat/tgm/refreshTableAction.do?tab=table&plugin=1&pcode=tsdpc240&language=en

96Projectco‐fundedbyEuropeanUnionfunds(ERDF,IPA)www.interreg‐danube.eu/moveco
96
xxv https://www.eea.europa.eu/data-and-maps/daviz/dmc-gdp-resource-productivity-population-1#tab-chart_1_filters=%7B%22rowFilters%22%3A%7B%7D%3B%22columnFilters%22%3A%7B%22pre_config_category%22%3A%5B%22DMC%22%3B%22GDP%22%3B%22Resource%20productivity%22%5D%3B%22pre_config_ugeo%22%3A%5B%22European%20Union%20(28%20countries)%22%5D%7D%7D xxvi http://ec.europa.eu/environment/eir/index_en.htm xxvii http://ec.europa.eu/eurostat/web/waste/municipal-waste-generation-and-treatment-by-treatment-method xxviii https://www.eea.europa.eu/data-and-maps/daviz/dmc-gdp-resource-productivity-population-1#tab-chart_1_filters=%7B%22rowFilters%22%3A%7B%7D%3B%22columnFilters%22%3A%7B%22pre_config_category%22%3A%5B%22DMC%22%3B%22GDP%22%3B%22Resource%20productivity%22%5D%3B%22pre_config_ugeo%22%3A%5B%22European%20Union%20(28%20countries)%22%5D%7D%7D xxix Eurostat, Municipal waste and treatment, by type of treatment method, accessed October 2016 xxx https://www.eea.europa.eu/data-and-maps/daviz/dmc-gdp-resource-productivity-population-1#tab-chart_1_filters=%7B%22rowFilters%22%3A%7B%7D%3B%22columnFilters%22%3A%7B%22pre_config_category%22%3A%5B%22DMC%22%3B%22GDP%22%3B%22Resource%20productivity%22%5D%3B%22pre_config_ugeo%22%3A%5B%22European%20Union%20(28%20countries)%22%5D%7D%7D xxxi http://ec.europa.eu/environment/eir/index_en.htm xxxii http://ec.europa.eu/environment/eir/index_en.htm xxxiii https://www.wko.at/site/mehrsprachige_info/Information-on-the-Austrian-Packaging-Ordinance-2014.html xxxiv https://www.elektro-ade.at/impressum/ xxxv https://www.elektro-ade.at/impressum/ xxxvi BMUB 2016; Digitalisierung der GreenTech-Branche lohnt sich, Pressemittelung Nr. 297/16, berlin xxxvii https://www.eea.europa.eu/data-and-maps/daviz/dmc-gdp-resource-productivity-population-1#tab-chart_1_filters=%7B%22rowFilters%22%3A%7B%7D%3B%22columnFilters%22%3A%7B%22pre_config_category%22%3A%5B%22DMC%22%3B%22GDP%22%3B%22Resource%20productivity%22%5D%3B%22pre_config_ugeo%22%3A%5B%22European%20Union%20(28%20countries)%22%5D%7D%7D xxxviii http://ec.europa.eu/environment/eir/index_en.htm

97Projectco‐fundedbyEuropeanUnionfunds(ERDF,IPA)www.interreg‐danube.eu/moveco
97
xxxix http://ec.europa.eu/eurostat/web/waste/municipal-waste-generation-and-treatment-by-treatment-method xl https://www.eea.europa.eu/data-and-maps/daviz/dmc-gdp-resource-productivity-population-1#tab-chart_1_filters=%7B%22rowFilters%22%3A%7B%7D%3B%22columnFilters%22%3A%7B%22pre_config_category%22%3A%5B%22DMC%22%3B%22GDP%22%3B%22Resource%20productivity%22%5D%3B%22pre_config_ugeo%22%3A%5B%22European%20Union%20(28%20countries)%22%5D%7D%7D xli http://ec.europa.eu/environment/eir/index_en.htm xlii https://www.eea.europa.eu/data-and-maps/daviz/dmc-gdp-resource-productivity-population-1#tab-chart_1_filters=%7B%22rowFilters%22%3A%7B%7D%3B%22columnFilters%22%3A%7B%22pre_config_category%22%3A%5B%22DMC%22%3B%22GDP%22%3B%22Resource%20productivity%22%5D%3B%22pre_config_ugeo%22%3A%5B%22European%20Union%20(28%20countries)%22%5D%7D%7D xliii http://ec.europa.eu/environment/eir/index_en.htm xliv https://www.eea.europa.eu/data-and-maps/daviz/dmc-gdp-resource-productivity-population-1#tab-chart_1_filters=%7B%22rowFilters%22%3A%7B%7D%3B%22columnFilters%22%3A%7B%22pre_config_category%22%3A%5B%22DMC%22%3B%22GDP%22%3B%22Resource%20productivity%22%5D%3B%22pre_config_ugeo%22%3A%5B%22European%20Union%20(28%20countries)%22%5D%7D%7D xlv http://ec.europa.eu/eurostat/web/waste/municipal-waste-generation-and-treatment-by-treatment-method xlvi http://ec.europa.eu/environment/eir/index_en.htm xlvii http://ec.europa.eu/environment/eir/index_en.htm xlviii https://ec.europa.eu/environment/ecoap/indicators/index_en xlix http://ec.europa.eu/environment/eir/index_en.htm l http://ec.europa.eu/environment/eir/index_en.htm li https://www.eea.europa.eu/data-and-maps/daviz/dmc-gdp-resource-productivity-population-1#tab-chart_1_filters=%7B%22rowFilters%22%3A%7B%7D%3B%22columnFilters%22%3A%7B%22pre_config_category%22%3A%5B%22DMC%22%3B%22GDP%22%3B%22Resource%20productivity%22%5D%3B%22pre_config_ugeo%22%3A%5B%22European%20Union%20(28%20countries)%22%5D%7D%7D lii http://ec.europa.eu/environment/eir/index_en.htm liii https://www.eea.europa.eu/data-and-maps/daviz/dmc-gdp-resource-productivity-population-1#tab-
98Projectco‐fundedbyEuropeanUnionfunds(ERDF,IPA)www.interreg‐danube.eu/moveco
98
chart_1_filters=%7B%22rowFilters%22%3A%7B%7D%3B%22columnFilters%22%3A%7B%22pre_config_category%22%3A%5B%22DMC%22%3B%22GDP%22%3B%22Resource%20productivity%22%5D%3B%22pre_config_ugeo%22%3A%5B%22European%20Union%20(28%20countries)%22%5D%7D%7D liv http://ec.europa.eu/environment/eir/index_en.htm lv https://www.eea.europa.eu/data-and-maps/daviz/dmc-gdp-resource-productivity-population-1#tab-chart_1_filters=%7B%22rowFilters%22%3A%7B%7D%3B%22columnFilters%22%3A%7B%22pre_config_category%22%3A%5B%22DMC%22%3B%22GDP%22%3B%22Resource%20productivity%22%5D%3B%22pre_config_ugeo%22%3A%5B%22European%20Union%20(28%20countries)%22%5D%7D%7D lvi http://ec.europa.eu/environment/eir/index_en.htm lviihttps://ec.europa.eu/neighbourhood-enlargement/sites/near/files/pdf/key_documents/2016/20161109_report_montenegro.pdf lviiihttps://ec.europa.eu/neighbourhood-enlargement/sites/near/files/pdf/key_documents/2016/20161109_report_serbia.pdf

99Projectco‐fundedbyEuropeanUnionfunds(ERDF,IPA)www.interreg‐danube.eu/moveco
99
Annex 1
The interview template and interview instructions
The template is primarily targeted at producers, importers, but the topics may be
adapted according to the practices and needs of other organisations, PROs can be
dealing with one or more material waste stream, they may have different
environmental practices and objectives that may support innovation and eco-design,
this is true also for waste management activities.
Before the interview the interviewer should prepare and gather general information
about the interviewed organisation available from company websites and other
public records. This will help the interviewer answer some of the organisation profile
questions and prepare on which topics they need to focus on more during the
interview.
After the interview, a short report linked to the template guideline and answers
needs to be prepared.
Some partners opted to obtain answers through the organisation of focus group
meetings / round tables, which initiated dialogue and exchange of views amongst
relevant stakeholders. In this case, the template should be adapted according to the
method of discussion and the target groups participating. After the event, a short
recap report linked to the guideline should be prepared.
GENERAL NAME OF ORGANISTATION ADDRESS SIZE: µ S M L ORGANISATION TYPE: PRODUCER / IMPORTER
PRO WASTE COLLECTOR
WASTE RECOVERY OPERATOR
OTHER: (specify)
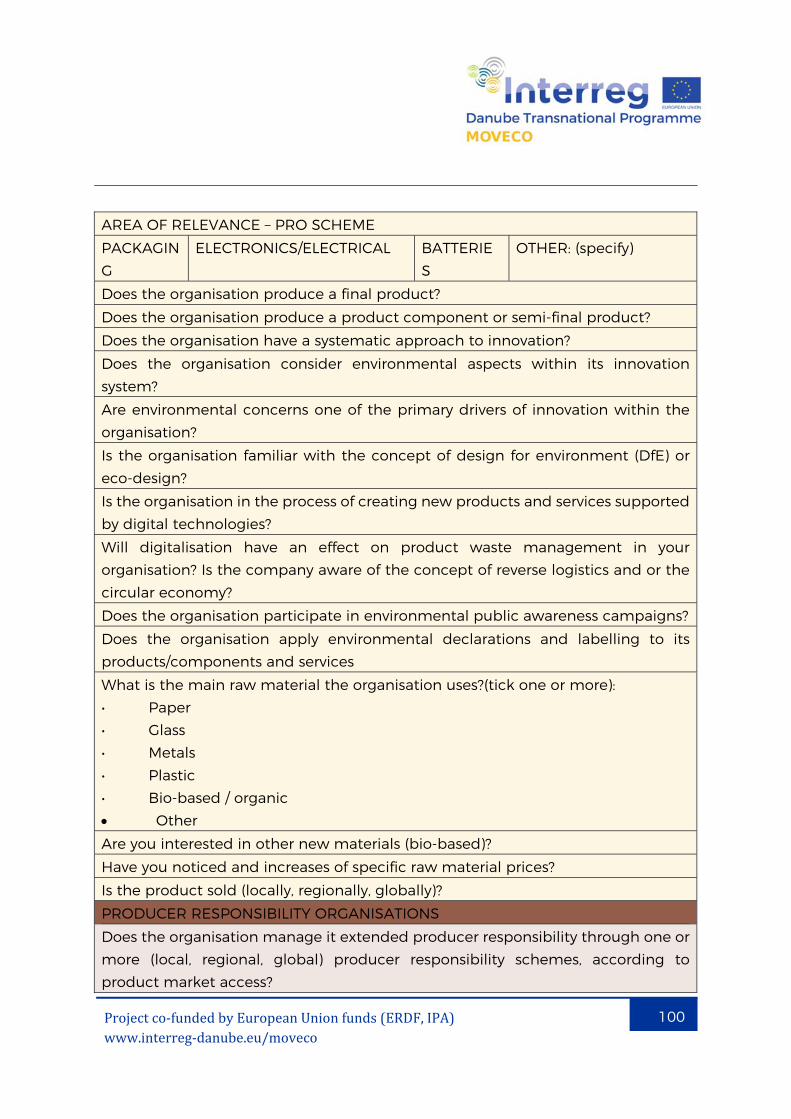
100Projectco‐fundedbyEuropeanUnionfunds(ERDF,IPA)www.interreg‐danube.eu/moveco
100
AREA OF RELEVANCE – PRO SCHEME PACKAGING
ELECTRONICS/ELECTRICAL BATTERIES
OTHER: (specify)
Does the organisation produce a final product? Does the organisation produce a product component or semi-final product? Does the organisation have a systematic approach to innovation? Does the organisation consider environmental aspects within its innovation system? Are environmental concerns one of the primary drivers of innovation within the organisation? Is the organisation familiar with the concept of design for environment (DfE) or eco-design? Is the organisation in the process of creating new products and services supported by digital technologies? Will digitalisation have an effect on product waste management in your organisation? Is the company aware of the concept of reverse logistics and or the circular economy? Does the organisation participate in environmental public awareness campaigns?Does the organisation apply environmental declarations and labelling to its products/components and services What is the main raw material the organisation uses?(tick one or more): • Paper • Glass • Metals • Plastic • Bio-based / organic Other Are you interested in other new materials (bio-based)? Have you noticed and increases of specific raw material prices? Is the product sold (locally, regionally, globally)? PRODUCER RESPONSIBILITY ORGANISATIONS Does the organisation manage it extended producer responsibility through one or more (local, regional, global) producer responsibility schemes, according to product market access?
101Projectco‐fundedbyEuropeanUnionfunds(ERDF,IPA)www.interreg‐danube.eu/moveco
101
According to the organisation’s understanding, the objective of extended producer responsibility is (tick one or more):
To cover costs of waste collection and treatment To improve product design (DfE) and support innovation To minimise the financial burden of waste products for public waste
services and municipalities To organise collection and recycling and redirect product waste streams
away from public waste services and municipalities To improve waste collection and treatment To support transition to a circular economy
Is the cost to participate in the producer responsibility scheme (tick one or more):: uniform with no consideration for environmental design modified to consider product waste impacts through environmental
design paid after waste management – purchasing of tradable credits for recycled
materials partially covered through consumer deposit with purchase (advanced
consumer disposal fee)? Limited to recycling and recovery (any additional costs for transport and
sorting are an extra charge Do the PRO offer awareness raising, training or consultancy on DfE? Is the organisation aware of product component/material and financial flow once they have put the product on the market i.e. transferred their EPR to PRO, and or after the product has been classified as waste? Tick one or more of the following statements on how the PRO charges product waste management costs:
According to product weight According to number of products placed on the market According to raw material type According to current product waste management costs According to anticipated future product waste management costs According to product dismantlement and recyclability Extra costs are charged for auxiliary components/materials that have a
negative effect on product recyclability
102Projectco‐fundedbyEuropeanUnionfunds(ERDF,IPA)www.interreg‐danube.eu/moveco
102
Extra costs are charged for multilayer materials which are difficult to disassemble and/or recycle
I do not know Tick one or more of the following statements on possible savings which can reduce waste management costs: Costs for PROs fee may be reduced (discounts are available) if:
recycled materials are incorporated into the product/component design
the product/component is easily dismantled to encourage preparation for reuse and recycling
the product/component contains less harmful substances (harmful substances are removed/substituted)
bio-based raw materials are used to produce the product/component preparation for reuse and recycling is available locally the product/component can circulate within a scheme supporting its
multiple usage before it’s classified as waste the product materials are easily recycled the recycled materials have a positive market value the company incorporates eco design measures into production I do not know
Tick one or more of the following statements on what full cost internalisation for extended producer responsibility currently includes and in the future should include:
Waste collection Waste sorting and preparation for recycling Waste treatment/recycling Awareness raising campaigns Enforcement and monitoring R&D investment in DfE (Design for Environment or eco-design) Reduced cost according to recycled material value and circulation
ENVIRONMENTAL PRIORITIES Has the organisation ever prepared an environmental life cycle assessment for any of its products/components or services?

103Projectco‐fundedbyEuropeanUnionfunds(ERDF,IPA)www.interreg‐danube.eu/moveco
103
If the organisation is placing packaged goods on the market, which packaging standards from the PWP directive do they apply? If the organisation is placing EEE goods on the market, which EEE standards from the WEEE directive do they apply? If yes, do the standards have any influence on innovation within the organisation with reference to DfE? Which aspects of eco-design on a scale of 1 to 10 are most important to the company, with 1 being most important and 10 least important. The organisation does not need to rate all of the aspects from 1 to 10, and the marks may be repeated for different environmental aspects
‐ Substitution, removal of hazardous substances from products ‐ Reducing product weight through more efficient use of raw materials ‐ Reducing energy consumption in production processes ‐ Reducing energy consumption through product use stages ‐ Using recycled materials in products ‐ Using locally available raw materials ‐ Efficient/Easy product disassembly at lifecycle end ‐ Reuse and circulation of product components and/or packaging ‐ Participation in a product scheme, which supports reuse and preparation
for reuse (i.e. pallets, IBC containers, electrical components…) ‐ Cooperation along the product value chain to ensure material reuse and
circulation ‐ Reducing the product carbon footprint ‐ Reducing environmental impacts throughout the product lifecycle ‐ Production of durable (longer life) products/components ‐ Production of recyclable products Comments/observations
i.e.: Has the organisation mentioned any services that would help improve innovation and/or make a transition towards a circular economy (and could be provided by business support organisations)?