Exposure of Arabidopsis thaliana to Hypobaric Environments: Implications for Low-Pressure...
17
ASTROBIOLOGY Volume 6, Number 6, 2006 © Mary Ann Liebert, Inc. Research Paper Exposure of Arabidopsis thaliana to Hypobaric Environments: Implications for Low-Pressure Bioregenerative Life Support Systems for Human Exploration Missions and Terraforming on Mars JEFFREY T. RICHARDS, 1 KENNETH A. COREY, 2 ANNA-LISA PAUL, 3 ROBERT J. FERL, 3 RAYMOND M. WHEELER, 4 and ANDREW C. SCHUERGER 5 ABSTRACT Understanding how hypobaria can affect net photosynthetic (P net ) and net evapotranspira- tion rates of plants is important for the Mars Exploration Program because low-pressured en- vironments may be used to reduce the equivalent system mass of near-term plant biology ex- periments on landers or future bioregenerative advanced life support systems. Furthermore, introductions of plants to the surface of a partially terraformed Mars will be constrained by the limits of sustainable growth and reproduction of plants to hypobaric conditions. To ex- plore the effects of hypobaria on plant physiology, a low-pressure growth chamber (LPGC) was constructed that maintained hypobaric environments capable of supporting short-term plant physiological studies. Experiments were conducted on Arabidopsis thaliana maintained in the LPGC with total atmospheric pressures set at 101 (Earth sea-level control), 75, 50, 25 or 10 kPa. Plants were grown in a separate incubator at 101 kPa for 6 weeks, transferred to the LPGC, and acclimated to low-pressure atmospheres for either 1 or 16 h. After 1 or 16 h of ac- climation, CO 2 levels were allowed to drawdown from 0.1 kPa to CO 2 compensation points to assess P net rates under different hypobaric conditions. Results showed that P net increased as the pressures decreased from 101 to 10 kPa when CO 2 partial pressure (pp) values were be- low 0.04 kPa (i.e., when ppCO 2 was considered limiting). In contrast, when ppCO 2 was in the nonlimiting range from 0.10 to 0.07 kPa, the P net rates were insensitive to decreasing pres- sures. Thus, if CO 2 concentrations can be kept elevated in hypobaric plant growth modules or on the surface of a partially terraformed Mars, P net rates may be relatively unaffected by hypobaria. Results support the conclusions that (i) hypobaric plant growth modules might be operated around 10 kPa without undue inhibition of photosynthesis and (ii) terraforming ef- forts on Mars might require a surface pressure of at least 10 kPa (100 mb) for normal growth of deployed plant species. Key Words: Low-pressure plant growth—Hypobaria—Hypoxia— Photorespiration—Advanced life support systems—Mars. Astrobiology 6, 851–866. 851 1 Dynamac Corporation; 4 NASA Biological Research and Life Support Office; and 5 Department of Plant Pathology, University of Florida, Space Life Sciences Laboratory, Kennedy Space Center, Florida. 2 Kent School, Kent, Connecticut. 3 USA Program in Plant Cellular and Molecular Biology, Horticultural Sciences Department, University of Florida, Gainesville, Florida.
Transcript of Exposure of Arabidopsis thaliana to Hypobaric Environments: Implications for Low-Pressure...

ASTROBIOLOGYVolume 6, Number 6, 2006© Mary Ann Liebert, Inc.
Research Paper
Exposure of Arabidopsis thaliana to HypobaricEnvironments: Implications for Low-Pressure
Bioregenerative Life Support Systems for HumanExploration Missions and Terraforming on Mars
JEFFREY T. RICHARDS,1 KENNETH A. COREY,2 ANNA-LISA PAUL,3 ROBERT J. FERL,3RAYMOND M. WHEELER,4 and ANDREW C. SCHUERGER5
ABSTRACT
Understanding how hypobaria can affect net photosynthetic (Pnet) and net evapotranspira-tion rates of plants is important for the Mars Exploration Program because low-pressured en-vironments may be used to reduce the equivalent system mass of near-term plant biology ex-periments on landers or future bioregenerative advanced life support systems. Furthermore,introductions of plants to the surface of a partially terraformed Mars will be constrained bythe limits of sustainable growth and reproduction of plants to hypobaric conditions. To ex-plore the effects of hypobaria on plant physiology, a low-pressure growth chamber (LPGC)was constructed that maintained hypobaric environments capable of supporting short-termplant physiological studies. Experiments were conducted on Arabidopsis thaliana maintainedin the LPGC with total atmospheric pressures set at 101 (Earth sea-level control), 75, 50, 25 or10 kPa. Plants were grown in a separate incubator at 101 kPa for 6 weeks, transferred to theLPGC, and acclimated to low-pressure atmospheres for either 1 or 16 h. After 1 or 16 h of ac-climation, CO2 levels were allowed to drawdown from 0.1 kPa to CO2 compensation pointsto assess Pnet rates under different hypobaric conditions. Results showed that Pnet increasedas the pressures decreased from 101 to 10 kPa when CO2 partial pressure (pp) values were be-low 0.04 kPa (i.e., when ppCO2 was considered limiting). In contrast, when ppCO2 was in thenonlimiting range from 0.10 to 0.07 kPa, the Pnet rates were insensitive to decreasing pres-sures. Thus, if CO2 concentrations can be kept elevated in hypobaric plant growth modulesor on the surface of a partially terraformed Mars, Pnet rates may be relatively unaffected byhypobaria. Results support the conclusions that (i) hypobaric plant growth modules might beoperated around 10 kPa without undue inhibition of photosynthesis and (ii) terraforming ef-forts on Mars might require a surface pressure of at least 10 kPa (100 mb) for normal growthof deployed plant species. Key Words: Low-pressure plant growth—Hypobaria—Hypoxia—Photorespiration—Advanced life support systems—Mars. Astrobiology 6, 851–866.
851
1Dynamac Corporation; 4NASA Biological Research and Life Support Office; and 5Department of Plant Pathology,University of Florida, Space Life Sciences Laboratory, Kennedy Space Center, Florida.
2Kent School, Kent, Connecticut.3USA Program in Plant Cellular and Molecular Biology, Horticultural Sciences Department, University of Florida,
Gainesville, Florida.

INTRODUCTION
SUSTAINING A LONG-TERM human presence in alunar or martian settlement may require the
use of plant-based bioregenerative advanced lifesupport (ALS) systems for regeneration of oxy-gen, potable water, and food (Ming and Hen-ninger, 1989; Eckart, 1996; Wheeler et al., 2001).Such bioregenerative ALS systems are likely toreduce the cost of food resupplied from Earth, re-duce the mass of launched atmospheric gases re-quired for maintaining a human presence on theMoon or Mars, and may add a level of self-suffi-ciency and redundancy to the physicochemicalair and water regeneration systems (Clawson,2000; Wheeler et al., 2001). Thus, addition of biore-generative ALS systems to human explorationmissions might extend the length of planetary ex-plorations and, thereby, increase the scientific re-turn of these missions. However, substantial en-gineering constraints exist that argue against thedeployment of rigid plant growth structures thatwould operate under human-rated atmosphericpressures (Bucklin et al., 2000; Corey and Fowler,2000; Lacey et al., 2000; Sandy and Cadogen,2000). For example, a sea-level Earth pressure of101 kPa within an ALS system would precludethe use of transparent materials (Boston, 1981)and might significantly raise the cost-effective-ness of such systems measured as the equivalentsystem mass (ESM) (Drysdale et al., 1999; Ewertet al., 2001). The ESM of a space-based system isa metric used to compare diverse life support sys-tems taking into account all parameters that willcontribute to the construction, launch, deploy-ment, and operation of such a system (Drysdaleet al., 1999; Ewert et al., 2001). Utilization of lowatmospheric pressures for plant production sys-tems could lower the ESM of plant-based ALSsystems by reducing gas leakage and, hence, re-supply costs, and potentially reduce structuralmass associated with maintaining higher pres-sure gradients (Corey et al., 2002; Ferl et al., 2002;He et al., 2003). Furthermore, by reducing inter-nal operating pressures, the potential would thenexist to incorporate mass-saving, inflatable, andtransparent structures that can be compressedtightly into smaller payloads, and, therefore, de-ployed more easily or automatically on the Moonor Mars (Clawson, 2000).
Hypobaric effects on plant biology and physi-ology are also critical for understanding how touse higher plants in any future terraforming ef-
fort on Mars. Currently, the Mars surface pres-sure is approximately 0.7 kPa (7 mb), and the at-mosphere is composed of 95.3% CO2, 2.7% N2,1.6% Ar, and the remainder as trace gases (Owen,1992). In recent reviews on terraforming the mar-tian surface (Fogg, 1995; McKay and Marinova,2001; Graham, 2004), the authors have describeda series of stepwise introductions of terrestrial lifeforms as the atmosphere thickens, warms, andchanges in composition. However, concrete rec-ommendations are not possible at this time be-cause very few empirical data are available on thedirect and indirect effects of hypobaria on thewide range of terrestrial life proposed for ter-raforming Mars. It is presumed that introductionsof terrestrial life will begin by deploying micro-bial species into appropriate niches, followed bythe sequential introductions of lichens, lowerplants, insects, higher plants, and then largemetazoan animal species. However, before a ter-raforming process for Mars can be outlined withany greater precision than presented in these re-views (Fogg, 1995; McKay and Marinova, 2001;Graham, 2004), a thorough understanding of howhypobaria affects the wide range of proposedspecies must be developed.
A number of studies (Gale, 1973; Andre andMassimino, 1992; Daunicht and Brinkjans, 1992;Iwabuchi et al., 1995; Corey et al., 1996, 2002; Gotoet al., 1996; Iwabuchi and Kurata, 2003) havedemonstrated that a wide range of plant speciescan show altered net photosynthesis (Pnet) andnet evapotranspiration (Enet) rates under condi-tions of low pressure. In general, these findingssuggest that Pnet and Enet increase as the pres-sures decrease. Additional studies explored theeffects of low pressure on plant gene expression(Paul et al., 2004), seed germination (Musgrave etal., 1988; Schwartzkopf and Mancinelli, 1991;Goto et al., 2002), plant growth and development(Goto et al., 1995, 2002; Iwabuchi et al., 1996;Spanarkel and Drew, 2002), fruit ripening (Burgand Burg, 1966; Stenvers and Bruinsma, 1975),fruit abscission (Cooper and Horanic, 1973), eth-ylene production (He et al., 2003), and respiration(Musgrave et al., 1988; Corey et al., 1997;Spanarkel and Drew, 2002). However, most stud-ies were conducted on plants subjected to pres-sures between 25 and 101 kPa, with a strong biasfor pressures greater than 50 kPa. However, a fewstudies exposed plants to pressures below 25 kPa(Schwartzkopf and Mancinelli, 1991; Andre andMassimino, 1992; Goto et al., 1996, 2002; Mas-
RICHARDS ET AL.852
simino and Andre, 1999; Paul et al., 2004). Resultsfrom these experiments indicate that even downto 10 kPa, plants were able to survive with littleor no ill effects (Goto et al., 1996; Goto, 1997; Mas-simino and Andre, 1999), and Pnet and Enet con-tinued to increase as pressure decreased (Goto etal., 1996). However, growth of wheat was signif-icantly reduced below 10 kPa (Schwartzkopf andMancinelli, 1991). In addition, gene expressionwas dramatically affected by exposure of Ara-bidopsis thaliana (L.) Heynh (henceforth termedArabidopsis) plants to 10 kPa compared with 101kPa atmospheres with over 200 genes either sig-nificantly up- or down-regulated at 10 kPa (Paulet al., 2004).
The observed increases in Pnet at low pressuresdiscussed above have led many of these authorsto suggest that carbon fixation, and, thus, plantgrowth might be enhanced at low pressures(Gale, 1973; Iwabuchi et al., 1995; Corey et al.,1996, 2002; Goto et al., 1996; Iwabuchi and Kurata,2003). However, several studies have demon-strated that short-term effects of low pressure onplants (i.e., increased levels of Pnet and Enet) mightnot yield long-term benefits, and, thus, plantsmay undergo diverse adaptations to low pres-sures, which would result in little or no differ-ences in plant biometric measurements followinglong-term growth of plants under hypobaric con-ditions (Goto et al., 1995, 2002; Iwabuchi et al.,1996; Iwabuchi and Kurata, 2003).
Several physical and metabolic processes havebeen proposed to explain the effects of low-pres-sure environments on plant biology and physiol-ogy. First, theoretical considerations on gas dif-fusion rates at low pressures (Corey et al., 1996,2002; Gale, 1972, 1973) have suggested that underhypobaric conditions the increased rates of gasdiffusion for both CO2 and O2 contribute to en-hanced movement of these gases in and out ofplant leaves, thus increasing CO2 assimilation.Second, low partial pressure (pp) O2 or highppO2/ppCO2 ratios may induce changes in keybiochemical pathways or enzymatic activitiesthat could lead to changes in photosynthetic rates(Spanarkel and Drew, 2002; Corey et al., 1997).Third, changes in boundary layer effects mightlead to changes in leaf conductance at low pres-sures, and may enhance Pnet by reducing the re-sistance to the diffusion of gases at the leaf sur-face (Iwabuchi and Kurata, 2003). Fourth, theinhibition of photorespiration under hypobaricconditions has been suggested as a reason for the
enhanced rates of Pnet at low pressure in C3 plants(Iwabuchi et al., 1995, 1996; Corey et al., 1996,1997, 2002; Goto et al., 1996), and, thus, changesin Pnet might be largely explained by changes inthe ppO2 under hypobaric conditions rather thanlow pressure directly (Iwabuchi et al., 1995). Thisis supported by studies that demonstrate that Pnetcan be enhanced in C3 plants under anoxia atstandard sea-level pressures (101 kPa) because ofthe inhibition of the energetically inefficientprocess of photorespiration (Quebedeaux andHardy, 1976; Zelitch, 1992). However, no studiesto date have shown that the suppression of pho-torespiration occurs under reduced atmosphericpressures at pressures lower than 70 kPa (Coreyet al., 1997), as this requires CO2 drawdowncurves down to CO2 compensation points. Fur-thermore, few studies have attempted measuringbasic physiological functions such as CO2 assim-ilation, evapotranspiration, and dark respirationbelow 25 kPa.
In this study, we utilized a low-pressuregrowth chamber (LPGC) to maintain precise hy-pobaric environments down to 10 kPa (i.e., 1/10Earth sea-level pressure). Short-term studies wereinitiated to investigate low-pressure gas ex-change characteristics of Arabidopsis, a C3 plant,to measure Pnet and Enet rates from 101 to 10 kPa.Furthermore, we sought to explore the role ofphotorespiration in Arabidopsis to determinewhether the effects of low pressure on Pnet andEnet rates were due to hypoxia alone or a combi-nation of hypoxia and hypobaria.
MATERIALS AND METHODS
Propagation and growth of plant material
A coarse-grained 20–30-mesh silica sand wasautoclaved at 121°C and 1.1 kg cm�1 for 30 min,cooled to 24°C, and wetted with a one-quarter-strength complete nutrient solution (Schuergerand Mitchell, 1992) prior to sowing seeds. The nu-trient solution was mixed from reagent-gradesalts (Sigma-Aldrich Chemicals, St. Louis, MO) toprovide the following concentrations per ion (in-dicated as mg/L): N (175), P (31), K (175), Ca(180), Mg (40), S (53), Fe (5), Mn (0.4), B (0.4), Zn(0.3), Cu (0.2), and Mo (0.005); the pH was ad-justed to 5.5. The wetted silica sand was dis-pensed into GA7-3 magenta vessels (Sigma-Aldrich Chemicals), which were modified with
HYPOBARIC PLANT GROWTH AND TERRAFORMING MARS 853
holes drilled through the bottoms to allow forboth watering and drainage. Seeds of A. thalianavar. Wassilewskija were double planted (twoseeds in each of five positions) onto the uppersurface of the sand to assure a full and uniformcanopy. The magenta vessels were capped withsemiclear polypropylene covers, and seeds werevernalized for 24 h at 4°C. Following vernaliza-tion, the magenta vessels were transferred into a1-m2 controlled environmental growth chamber(model M-12, EGC, Chagrin Falls, OH) at atmo-spheric pressure (101 kPa) and set to the follow-ing parameters: 22°C, 75% relative humidity (%),400 �mol mol�1 CO2 (400 ppm at 101 kPa), anda day/night photoperiod of 12 h/12 h. Plantcanopies were illuminated with four 400-W metalhalide lamps, adjusted to yield 150 �mol m�2 s�1
of photosynthetically active radiation (PAR)(400–700 nm) as measured by a LI-COR handheldquantum meter (model LI-250, LI-COR, Inc., Lin-coln, NE). After 14 days of growth, the coverswere removed from the magenta vessels, andseedlings were thinned to five plants per vessel.
LPGC
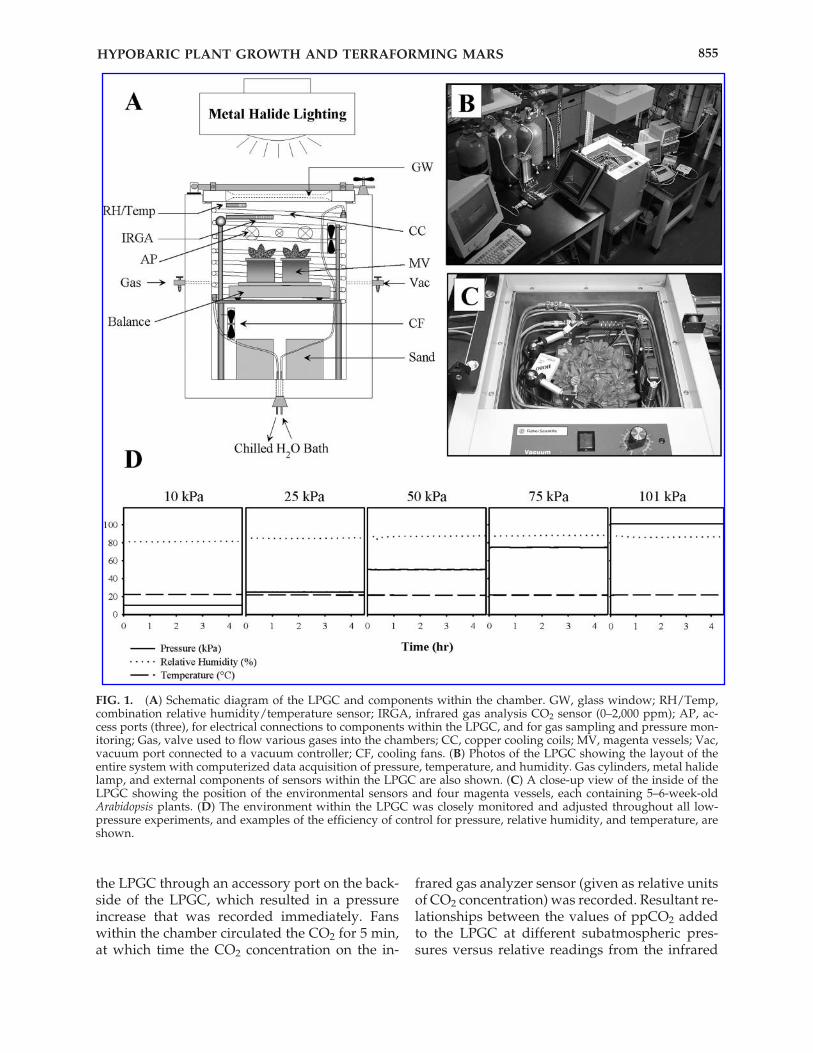
A 45-L low-pressure oven (Fig. 1) (model 285,Fisher Scientific, Pittsburgh, PA) was modifiedwith sealed high vacuum ports for insertion ofenvironmental sensors that monitored the at-mospheric conditions within the LPGC duringlow-pressure and hypoxic experiments (Rygalovet al., 2002). Components for environmental con-trol and data acquisition are shown to the rightand left of the LPGC (Fig. 1B) as well as a close-up of the upper portion of the LPGC with sen-sors and copper tubing used for temperature con-trol (Fig. 1C). Total atmospheric pressure wascontrolled to �0.1% of setpoints by a pressuresensor (model M370, SETRA, Boxborough, MA)and a vacuum pump controller (model UN840-3pump and model PU842 vacuum pump con-troller from KNF Neuberger, Inc., Trenton, NJ).Relative humidity and temperature were moni-tored with a single probe (model HMP 230,Vaisala, Woburn, MA), and temperature was con-trolled to � 0.5°C by circulating chilled waterthrough 20 m of copper tubing lining the innersurface of the LPGC. Relative humidity was notactively controlled but remained within the rangeof 80–85% because of condensate production onthe chilled water coil. A series of four fans, twoin the upper zone of the chamber and two in the
lower zone, created an efficient circulation of airaround the inside of the LPGC. A digital balance(model M-DI-4KD, Denver Instruments Co., Ar-vada, CO) was added to track evapotranspirativewater loss. Environmental data from various sen-sors were acquired on a PC-driven, in-house-de-signed system, which recorded readouts from thesensors at 5-min intervals. The CO2 gas compo-sition was monitored with a pressure-calibrated0–2,000 ppm infrared gas analyzer sensor (modelGMP 222, Vaisala) and controlled to within 5% ofsetpoints using a relay-actuated microsolenoidvalve that added small quantities of pure CO2into the LPGC as required. Oxygen content wasnot actively monitored throughout these short-term studies as ppO2 sensors capable of operat-ing at low pressures were not available. However,gas chromatography analysis of the atmosphericcomposition during several independent experi-ments indicated that O2 levels remained at 21%during the course of individual tests in low-pres-sure environments (data not shown). Light withinthe LPGC was supplied from a single 400-Wmetal halide lamp that was positioned directlyover the glass window (Fig. 1) and adjusted todeliver 150 �mol m�2 s�1 of PAR to the uppersurfaces of plant canopies within the LPGC. TheLPGC was capable of maintaining total atmo-spheric pressures down to 2.5 kPa with low leakrates (�0.5% chamber volume/h at 10 kPa).
CO2 sensor calibration
Prior to initiating physiological measurementsthat involved CO2 drawdown studies, the CO2sensor was calibrated for linearity through arange of various total pressures to create standardcurves necessary for adjustments of the ppCO2within the LPGC. Calibration of the CO2 sensorfor each total pressure environment was requiredbecause changes in pressure affect the width ofthe CO2 infrared absorption bands, which re-sulted in a reduction of CO2 absorption at lowerpressures, and, thus, a loss of sensitivity in thesensor at low pressure (Parkinson and Legg, 1978;Goto et al., 1991). First, the total pressure of theLPGC was adjusted to 101, 75, 50, 25, or 10 kPaat 22°C. The LPGC (containing equipment only)was flushed several times with pure N2 gas to re-duce the ppCO2 content in the chamber to belowdetection limits. Using a gas-tight syringe (VICIPrecision Sampling, Inc., Baton Rouge, LA), exactvolumes of pure CO2 gas were added back into
RICHARDS ET AL.854
the LPGC through an accessory port on the back-side of the LPGC, which resulted in a pressureincrease that was recorded immediately. Fanswithin the chamber circulated the CO2 for 5 min,at which time the CO2 concentration on the in-
frared gas analyzer sensor (given as relative unitsof CO2 concentration) was recorded. Resultant re-lationships between the values of ppCO2 addedto the LPGC at different subatmospheric pres-sures versus relative readings from the infrared
HYPOBARIC PLANT GROWTH AND TERRAFORMING MARS 855
FIG. 1. (A) Schematic diagram of the LPGC and components within the chamber. GW, glass window; RH/Temp,combination relative humidity/temperature sensor; IRGA, infrared gas analysis CO2 sensor (0–2,000 ppm); AP, ac-cess ports (three), for electrical connections to components within the LPGC, and for gas sampling and pressure mon-itoring; Gas, valve used to flow various gases into the chambers; CC, copper cooling coils; MV, magenta vessels; Vac,vacuum port connected to a vacuum controller; CF, cooling fans. (B) Photos of the LPGC showing the layout of theentire system with computerized data acquisition of pressure, temperature, and humidity. Gas cylinders, metal halidelamp, and external components of sensors within the LPGC are also shown. (C) A close-up view of the inside of theLPGC showing the position of the environmental sensors and four magenta vessels, each containing 5–6-week-oldArabidopsis plants. (D) The environment within the LPGC was closely monitored and adjusted throughout all low-pressure experiments, and examples of the efficiency of control for pressure, relative humidity, and temperature, areshown.

gas analyzer CO2 sensor were subsequently plot-ted (Fig. 2). The CO2 sensor response varied de-pending upon the atmospheric pressure withinthe LPGC; the lower the total pressure within theLPGC, the lower the response range of the in-frared gas analyzer CO2 sensor. All pressures re-ported herein are calibrated pressures of CO2,and, thus, represent the actual ppCO2 within theLPGC for specific operations.
Gas exchange measurements of Arabidopsisunder low-pressure atmospheres
Four magenta vessels, each with 5–6-week-oldmature canopies (20 plants in total) of Arabidop-sis, were placed on the weighing platform of thetop-loading balance and sealed within the LPGC2 h after the start of the diurnal lighting cycle. To-tal pressure was randomly selected and set at 101,75, 50, 25, or 10 kPa. The ppCO2 was adjusted to0.1 kPa, and the water bath temperature was ad-justed to give 22 � 0.5°C inside the LPGC. Oncethe designated total atmospheric pressure andppCO2 stabilized, the vacuum pumping systemwas disengaged. Transient pressure effects wereavoided by allowing a 1-h equilibration phase be-fore measurements of gas exchange. The data-logging of CO2 removal due to photosynthesis began at approximately 0.1 kPa ppCO2 and con-tinued until no further reduction in the ppCO2was measured.
Similar procedures were used to derive theCO2 drawdown curves from Arabidopsis plantsacclimated for 16 h at 101, 75, 50, 25, or 10 kPa.The acclimation procedure involved placing the6-week-old plants into the LPGC, activating thepressure control system to achieve total atmo-spheric pressures of 101, 75, 50, 25, or 10 kPa, andsetting the ppCO2 at 0.1 kPa for the duration ofthe 16-h equilibration phase. The normal 12-hday/12-h night photoperiod was maintainedthroughout the 16-h equilibration experiment inthe LPGC to prevent possible diurnal effects onCO2 assimilation, i.e., drawdown tests werestarted at the same time into the photoperiod forall tests. CO2 drawdowns on 1- or 16-h acclimatedplants were repeated four times at each pressuretreatment (n � 4), each time with a new set of 6-week-old plants.
CO2 drawdowns were plotted as a function oftime for each pressure treatment (Wheeler, 1992;Corey et al., 1996, 1997, 2002). Atmospheric leak-age rates from the LPGC were �0.5% of chambervolume/h and, hence, were considered insignif-icant. Enet data were derived from weight lossduring the course of the experiments, as mea-sured with the top-loading scale within theLPGC.
Dark-cycle respiration (RD) measurements in-volved placing 6-week-old plants into a darkenedLPGC, while still in the dark phase of their diur-nal cycle. The pressure control system was acti-vated to achieve total atmospheric pressures of101, 50, or 10 kPa, and the CO2 control systemwas disengaged. Once all environmental set-points stabilized, usually within 1–2 h, rises in theppCO2 were logged for approximately 4 h. RDrates are expressed on a per unit area of plantcanopy cover (Wheeler et al., 1992; Corey et al.,1996, 1997, 2002).
Photorespiration on CO2 assimilation inArabidopsis plants at low pressures
To study the role of photorespiration in Ara-bidopsis (a C3 plant with an operational photores-piratory pathway), several experiments were con-ducted at different pressures and ppO2. CO2 gasexchange characteristics with Arabidopsis were ex-amined at (1) normoxic conditions (21 kPa ppO2)at normal atmospheric pressures (101 kPa), (2)hypoxic conditions (2.1 kPa ppO2) under low at-mospheric pressures (10 kPa), and (3) hypoxicconditions (2.1 kPa ppO2) under normal atmo-
RICHARDS ET AL.856
FIG. 2. Linear models between ppCO2 added to theLPGC adjusted to total pressures of 101, 75, 50, 25, or 10kPa versus relative CO2 readings from the infrared gasanalysis CO2 sensor. Linear models for the five pressuresare as follows: 101 kPa, y � 9306x � 7.1, r2 � 0.99; 75 kPa,y � 8068x � 15.5, r2 � 0.99; 50 kPa, y � 7177x � 32.9, r2 �0.99; 25 kPa, 4982x � 10, r2 � 0.99; 10 kPa, y � 3517x �2.7, r2 � 0.99. All CO2 values reported herein thus repre-sent the actual ppCO2 within the LPGC.
spheric pressures (101 kPa). To obtain hypoxicconditions at normal atmospheric pressure, acommercial tank gas mix (Boggs Gases, Titusville,FL) of 2.1 kPa ppO2 and 97.9 kPa ppN2 wasflushed through the LPGC for 20 min at 4 L/minand then set at 0.5 L/min throughout the stabi-lization period of 1 h. The ppCO2 was kept con-stant at 0.1 kPa during the stabilization phase. Allgas flows were stopped before measurements ofCO2 assimilation rates. CO2 concentration andevapotranspirative water loss were logged untilthe CO2 compensation point was reached. The ex-periment was conducted four times (n � 4).
Differential expression patterns of several keyenzymes of the photorespiratory pathway were an-alyzed using the 8K Affymetrix GeneChip® array(Affymetrix, Santa Clara, CA) to further elucidateany hypobaria-induced up- or down-regulation ofgenes in Arabidopsis plants grown at 101, 75, 50, 25,or 10 kPa. The genes for the following photorespi-ratory enzymes were analyzed: ribulose-1,5-bis-phosphate carboxylase (RuBISCo) (accession num-ber X14564), glycolate oxidase (U91509), catalase(cat3; cat1) (AF021937), bac clone with catalase(AL022023), alanine:glyoxylate aminotransferase(AF063901), alanine:glyoxylate aminotransferase 2homolog (AF166351), and hydroxypyruvate re-ductase. The enzymes glycolate-p-phosphatase andglutamate-glyoxylate aminotransferase (both im-portant in photorespiration) were not representedon the 8K chip, and, thus, were not measured. Ara-bidopsis plants were grown for 6 weeks in the 1-m2
controlled environmental growth chamber (modelM-12, EGC) at conditions previously described.Four magenta vessels, each containing five plantsof Arabidopsis, were then transferred to the LPGC.Low-pressure atmospheres were maintained at101, 75, 50, 25, or 10 kPa total pressure, 0.1 kPa(�5%) ppCO2, 22 � 0.1°C, and light intensity at 150�mol m�2 s�1 PAR, as previously described. Plantswere maintained at these conditions for 24 h, afterwhich time the LPGC was repressurized to 101 kPa.Shoot materials were excised, placed into 25-mlpolypropylene tubes, and immediately frozen inliquid nitrogen prior to storage at –80°C. Microar-ray sample preparations were completed accord-ing to the procedure of Paul et al. (2004).
Statistical analyses
Statistical analyses were conducted with ver-sion 8.0 of the PC-based Statistical Analysis Sys-tem (SAS) (SAS Institute, Inc., Cary, NC). Linear
regression models (P � 0.05) for Pnet, Enet, and RDdata in Figs. 4 and 5 were analyzed using PROCREG in SAS. Gene array data in Fig. 6 were analyzed with analysis of variance procedures(PROC GLM) and protected least-squares meanseparation tests (P � 0.05).
RESULTS
Short-term exposure of Arabidopsis plants tohypobaric environments for up to 24 h resultedin no visible plant stress symptoms being ob-served during these experiments (e.g., no chloro-sis, wilting, or premature leaf abscission). Plantsremained turgid throughout all of the tests andappeared visually unaffected by the exposures tohypobaric conditions.
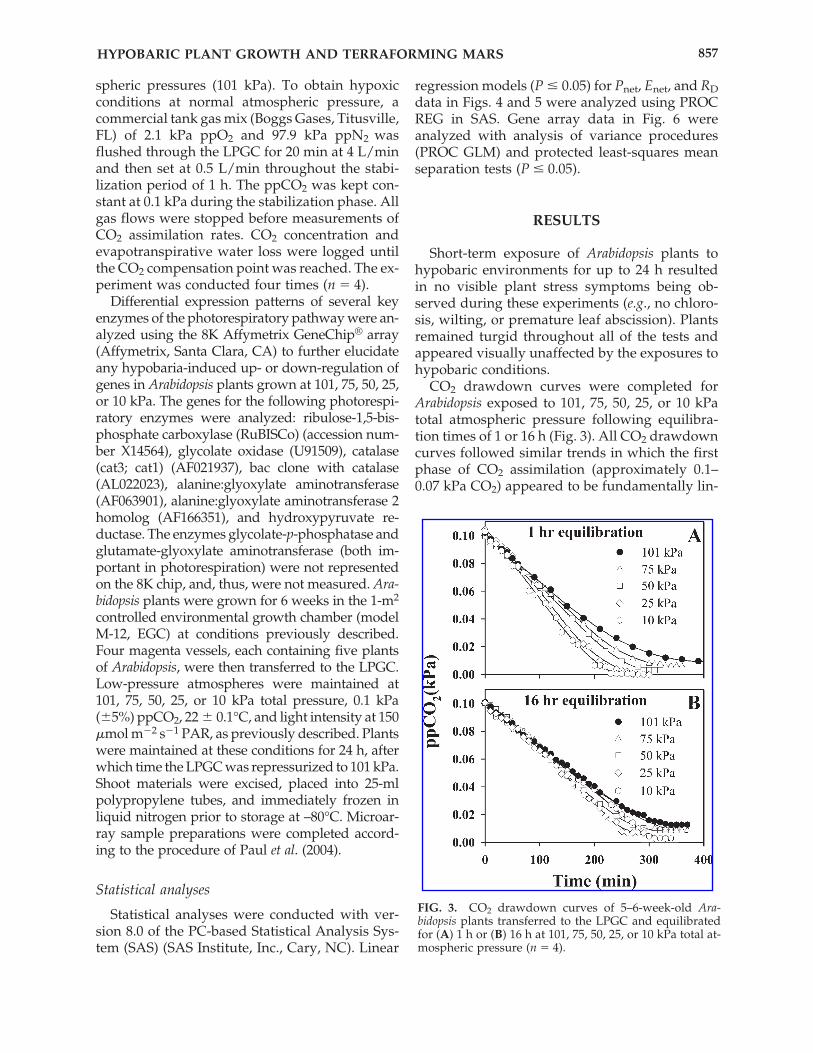
CO2 drawdown curves were completed forArabidopsis exposed to 101, 75, 50, 25, or 10 kPatotal atmospheric pressure following equilibra-tion times of 1 or 16 h (Fig. 3). All CO2 drawdowncurves followed similar trends in which the firstphase of CO2 assimilation (approximately 0.1–0.07 kPa CO2) appeared to be fundamentally lin-
HYPOBARIC PLANT GROWTH AND TERRAFORMING MARS 857
FIG. 3. CO2 drawdown curves of 5–6-week-old Ara-bidopsis plants transferred to the LPGC and equilibratedfor (A) 1 h or (B) 16 h at 101, 75, 50, 25, or 10 kPa total at-mospheric pressure (n � 4).
ear with no apparent difference among treat-ments. Below about 0.07 kPa, drawdown rates at50, 75, and 101 kPa began to slow, especially formeasurements taken after only 1 h of equilibra-tion (Fig. 3A). Drawdown rates remained roughlysimilar for 10 and 25 kPa treatments, after both1-h and 16-h equilibration times. Eventually allCO2 drawdown curves became asymptotic at dif-ferent levels of CO2, which indicates that the CO2compensation points were different for Arabidop-sis plants incubated among the different treat-ments. Complete CO2 drawdown at the 101 kPawith 21 kPa of ppO2 lasted approximately 400min; complete CO2 drawdown at 10 kPa with 2.1kPa of ppO2 lasted about 220 min. Plants equili-brated for 1 h (Fig. 3A) at 25 or 10 kPa were ableto completely scrub all CO2 from the chamber,while plants incubated at higher pressures withhigher ppO2 reached their CO2 compensationpoints at higher ppCO2. After an equilibrationphase of 16 h (Fig. 3B) at 101, 75, 50, 25, or 10 kPatotal pressure, the plants exhibited an adaptationresponse to the low-pressure environments, withdifferences in CO2 assimilation between treat-ments becoming less evident. First, plants incu-bated at 101 and 75 kPa exhibited nearly identi-cal CO2 drawdown curves after 16 h, whichdiffered from the responses in the 1-h equilibra-tion tests in which the 75 kPa-treated plants ex-hibited slightly faster CO2 assimilation rates thanplants at 101 kPa. Second, after a 1-h equilibra-tion, both the 25 kPa- and 10 kPa-exposed plantswere able to completely scrub CO2 from theLPGC atmosphere. In contrast, after a 16-h equi-libration within the LPGC, only the 10 kPa-ex-posed plants were able to completely remove CO2from the atmosphere.
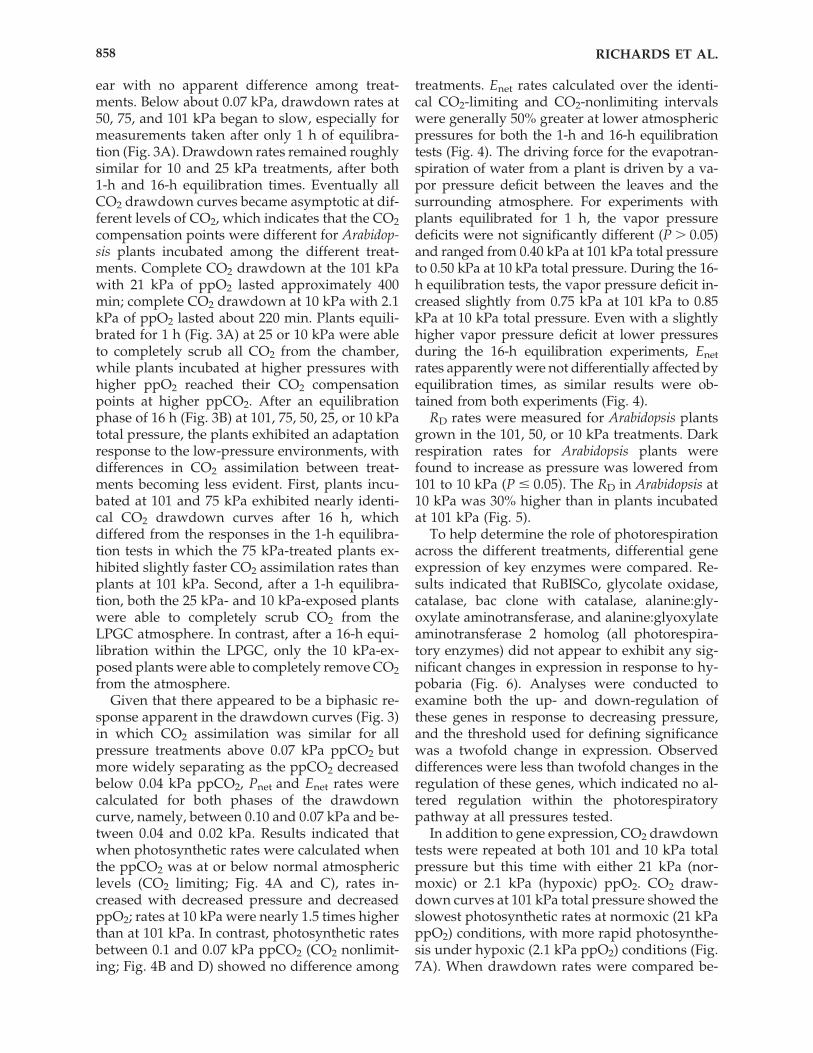
Given that there appeared to be a biphasic re-sponse apparent in the drawdown curves (Fig. 3)in which CO2 assimilation was similar for allpressure treatments above 0.07 kPa ppCO2 butmore widely separating as the ppCO2 decreasedbelow 0.04 kPa ppCO2, Pnet and Enet rates werecalculated for both phases of the drawdowncurve, namely, between 0.10 and 0.07 kPa and be-tween 0.04 and 0.02 kPa. Results indicated thatwhen photosynthetic rates were calculated whenthe ppCO2 was at or below normal atmosphericlevels (CO2 limiting; Fig. 4A and C), rates in-creased with decreased pressure and decreasedppO2; rates at 10 kPa were nearly 1.5 times higherthan at 101 kPa. In contrast, photosynthetic ratesbetween 0.1 and 0.07 kPa ppCO2 (CO2 nonlimit-ing; Fig. 4B and D) showed no difference among
treatments. Enet rates calculated over the identi-cal CO2-limiting and CO2-nonlimiting intervalswere generally 50% greater at lower atmosphericpressures for both the 1-h and 16-h equilibrationtests (Fig. 4). The driving force for the evapotran-spiration of water from a plant is driven by a va-por pressure deficit between the leaves and thesurrounding atmosphere. For experiments withplants equilibrated for 1 h, the vapor pressuredeficits were not significantly different (P � 0.05)and ranged from 0.40 kPa at 101 kPa total pressureto 0.50 kPa at 10 kPa total pressure. During the 16-h equilibration tests, the vapor pressure deficit in-creased slightly from 0.75 kPa at 101 kPa to 0.85kPa at 10 kPa total pressure. Even with a slightlyhigher vapor pressure deficit at lower pressuresduring the 16-h equilibration experiments, Enetrates apparently were not differentially affected byequilibration times, as similar results were ob-tained from both experiments (Fig. 4).
RD rates were measured for Arabidopsis plantsgrown in the 101, 50, or 10 kPa treatments. Darkrespiration rates for Arabidopsis plants werefound to increase as pressure was lowered from101 to 10 kPa (P � 0.05). The RD in Arabidopsis at10 kPa was 30% higher than in plants incubatedat 101 kPa (Fig. 5).
To help determine the role of photorespirationacross the different treatments, differential geneexpression of key enzymes were compared. Re-sults indicated that RuBISCo, glycolate oxidase,catalase, bac clone with catalase, alanine:gly-oxylate aminotransferase, and alanine:glyoxylateaminotransferase 2 homolog (all photorespira-tory enzymes) did not appear to exhibit any sig-nificant changes in expression in response to hy-pobaria (Fig. 6). Analyses were conducted toexamine both the up- and down-regulation ofthese genes in response to decreasing pressure,and the threshold used for defining significancewas a twofold change in expression. Observeddifferences were less than twofold changes in theregulation of these genes, which indicated no al-tered regulation within the photorespiratorypathway at all pressures tested.
In addition to gene expression, CO2 drawdowntests were repeated at both 101 and 10 kPa totalpressure but this time with either 21 kPa (nor-moxic) or 2.1 kPa (hypoxic) ppO2. CO2 draw-down curves at 101 kPa total pressure showed theslowest photosynthetic rates at normoxic (21 kPappO2) conditions, with more rapid photosynthe-sis under hypoxic (2.1 kPa ppO2) conditions (Fig.7A). When drawdown rates were compared be-
RICHARDS ET AL.858
tween 101 and 10 kPa with hypoxic (2.1 kPappO2) conditions at both pressures, drawdownrates were similar (Fig. 7B). These results are con-sistent with the findings from the initial draw-down series (Fig. 3) and suggest that differencesin photosynthetic drawdown rates for Arabidop-sis in these tests were due largely to differencesin ppO2 effects on photorespiration and not dueto hypobaria.
DISCUSSION
Plant physiological interpretations
Previous research reported either increased, orno change, in Pnet rates for different plant species
exposed to hypobaric conditions (Iwabuchi et al.,1995; Goto et al., 1996; Corey et al., 1997; Iwabuchiand Kurata, 2003). These studies were conductedunder a wide range of different ppCO2 and ppO2values, as either short-term or long-term tests, un-der situations in which the plants were exposedto hypobaric conditions just prior to the photo-synthesis measurements or after various periodsof acclimation to the pressure environments.Thus, it is difficult to develop a clear conclusionon pressure effects from the plant photosyntheticgas exchange rates. Like CO2 uptake, water lossfrom plants (i.e., evapotranspiration) has alsoshown increases, or no change, in response to hy-pobaric conditions (Daunicht and Brinkjans, 1992;Iwabuchi et al., 1995; Goto et al., 1996; Iwabuchiand Kurata, 2003). Our approach of using a full
HYPOBARIC PLANT GROWTH AND TERRAFORMING MARS 859
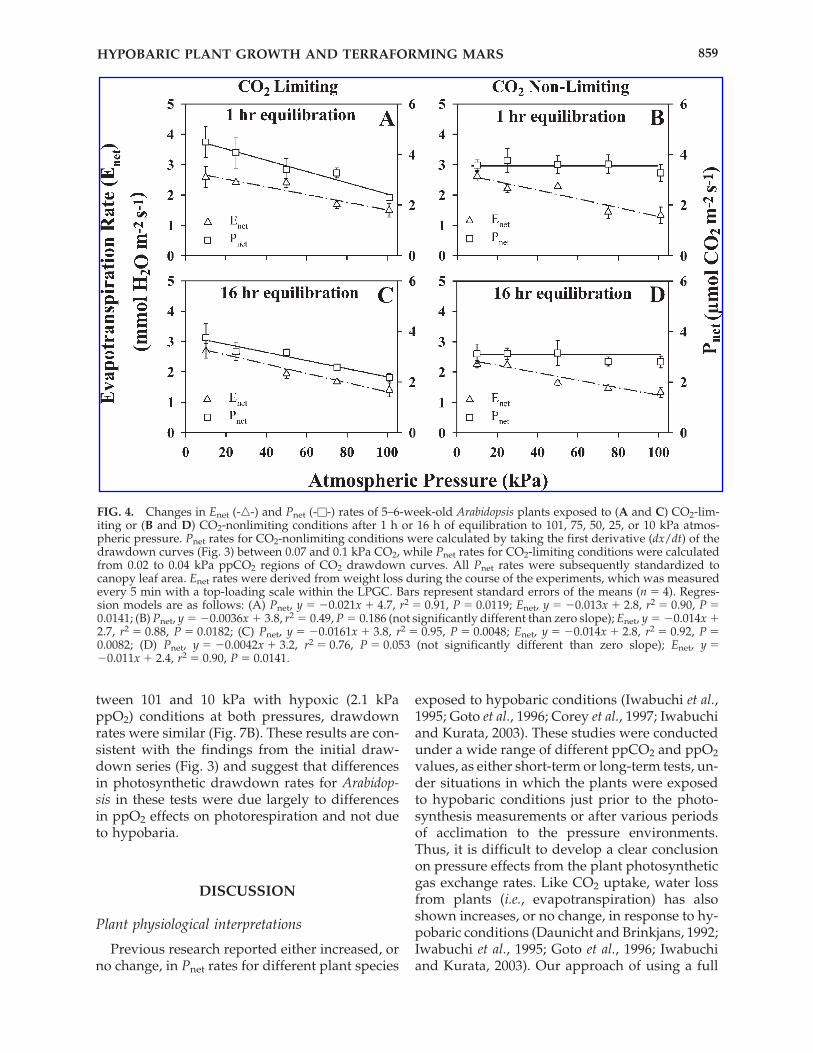
FIG. 4. Changes in Enet (-�-) and Pnet (-�-) rates of 5–6-week-old Arabidopsis plants exposed to (A and C) CO2-lim-iting or (B and D) CO2-nonlimiting conditions after 1 h or 16 h of equilibration to 101, 75, 50, 25, or 10 kPa atmos-pheric pressure. Pnet rates for CO2-nonlimiting conditions were calculated by taking the first derivative (dx/dt) of thedrawdown curves (Fig. 3) between 0.07 and 0.1 kPa CO2, while Pnet rates for CO2-limiting conditions were calculatedfrom 0.02 to 0.04 kPa ppCO2 regions of CO2 drawdown curves. All Pnet rates were subsequently standardized tocanopy leaf area. Enet rates were derived from weight loss during the course of the experiments, which was measuredevery 5 min with a top-loading scale within the LPGC. Bars represent standard errors of the means (n � 4). Regres-sion models are as follows: (A) Pnet, y � �0.021x � 4.7, r2 � 0.91, P � 0.0119; Enet, y � �0.013x � 2.8, r2 � 0.90, P �0.0141; (B) Pnet, y � �0.0036x � 3.8, r2 � 0.49, P � 0.186 (not significantly different than zero slope); Enet, y � �0.014x �2.7, r2 � 0.88, P � 0.0182; (C) Pnet, y � �0.0161x � 3.8, r2 � 0.95, P � 0.0048; Enet, y � �0.014x � 2.8, r2 � 0.92, P �0.0082; (D) Pnet, y � �0.0042x � 3.2, r2 � 0.76, P � 0.053 (not significantly different than zero slope); Enet, y ��0.011x � 2.4, r2 � 0.90, P � 0.0141.

CO2 drawdown technique allowed us to assessphotosynthetic CO2 uptake rates from a CO2-sat-urated range all the way to a CO2 compensationpoint (Wheeler, 1992). These measurements couldbe taken after short (1-h) or longer (16-h) periodsof acclimation. The results showed that, at ppCO2nonlimiting conditions (i.e., when ppCO2 valueswere �0.07 kPa), there was no significant differ-ence in photosynthetic uptake among any of thepressures (Figs. 3 and 4), whereas when ppCO2values were limiting (i.e., �0.04 kPa), photosyn-thetic rates increased as pressure dropped (Figs. 3and 4). After 16 h of acclimation, the relative dif-ferences between the fastest (at lower pressures)and slowest (at higher pressures) photosyntheticrates had noticeably diminished (Figs. 3 and 4).
When gas exchange measurements are com-pared between different plant canopies, totalcanopy (ground) cover must be consistent betweentreatments to eliminate any possible effects of light-ing (Wheeler, 1992; Corey et al., 1997). For exam-ple, if canopy cover is incomplete in one treatment,it will result in reduced photosynthetic rates be-cause of lower total light interception, which wouldbe completely unrelated to pressure, ppCO2, orppO2. Canopy cover was very consistent amongthe different test sequences in our studies, and allmeasurements were repeated four times using dif-ferent sets of plants to reduce the effects of slightvariations in total canopy cover.
For the initial testing of photosynthetic CO2 up-take rates, the ppO2 dropped in proportion to thetotal pressure. Thus, the ppO2 levels were 21,15.7, 10.5, 5.2, and 2.1 kPa for the 101, 75, 50, 25,and 10 kPa total pressure treatments, respec-tively. Because Arabidopsis has a C3-type photo-synthetic pathway, maximum photosyntheticrates are affected by the amount of both ppCO2and ppO2 surrounding the leaves. Photosyntheticrates can be saturated by elevating the ppCO2 tonear 0.10 kPa, which overcomes the competitiveaction of ppO2 with the enzyme ribulose bisphos-phate carboxylase/oxygenase, i.e., photorespira-tion (Ogren, 1984; Drake et al., 1997). At relativelylow ppCO2, such as the current Earth ambientvalue of �0.0378 kPa, rates can be increased byreducing the ppO2 to less than 21 kPa, whichagain favors carboxylation over oxygenation. Ourresults showed increased Pnet rates over the lowerranges of ppCO2 where both the total pressuresand ppO2 were reduced, but it was not possibleto discern whether the ppO2, the total pressure,or both were responsible for the different photo-synthetic rates of the Arabidopsis plants. For ex-ample, gas diffusion rates increase as pressure de-creases (Iwabuchi et al., 1995; Goto et al., 1996),
RICHARDS ET AL.860
FIG. 5. Comparisons of the CO2 respiration (RD) of 5–6-week-old Arabidopsis plants during the dark phase of thediurnal cycle. Respiration measurements were made fol-lowing a 1-h equilibration of the plants to 101, 50, or 10 kPatotal pressure, starting at ambient concentrations of 0.04kPa ppCO2 and continuing for approximately 200 min intothe dark cycle. (Inset) The calculated RD at each pressuretreatment (y � �0.0038x � 1.2, r2 � 0.46, P � 0.0153). Barsrepresent standard errors of the means (n � 4).
FIG. 6. Affymetrix 8K GeneChip expression patterns inthe following five targeted photorespiration-related genes[RuBISCo (accession number X14564), catalase (cat3; cat1)(AF021937), alanine(ala):glyoxylate aminotransferase(AF063901], glycolate oxidase (U91509), and hydroxy-pyruvate reductase] of Arabidopsis plants exposed to 101,75, 50, 25, or 10 kPa atmospheric pressures for 24 h. Noneof the genes exhibited changes in differential expressionpatterns of more than twofold (n � 2).

which could allow faster delivery of CO2 to meso-phyll cells for biochemical fixation. To determinewhether low pressure or low ppO2 was respon-sible for lower Pnet rates under hypobaric condi-tions, photosynthesis rates were measured againusing a CO2 drawdown technique, but this timeby including a treatment with high (101 kPa) to-tal pressure and low (2.1 kPa) ppO2. Resultsshowed that by reducing the ppO2 level to 2.1kPa, rates were similar at both the high (101 kPa)and low (10 kPa) total pressures (Fig. 7). Thus,differences in Pnet rates observed among the firstseries of tests were likely due to the differencesin ppO2 and not the total pressure of the ambi-ent atmosphere. At the lowest total pressure,ppO2 was also lowest, which allowed photosyn-thetic rates to stay high even as the substrate
availability of CO2 dropped. Eventually, asppCO2 dropped to less than �0.01 kPa, photo-synthetic rates slowed even at the low ppO2 lev-els (Figs. 3 and 7).
In addition to affecting the overall photosyn-thetic rates, the reduced ppO2 levels also de-creased the CO2 compensation points. Compen-sation occurs at a ppCO2 where no net uptake canoccur and can be seen in our data by comparingthe asymptotic leveling of the drawdown curvesat the end of each test (Figs. 3 and 7). Treatmentswith lower ppO2 levels allowed the CO2 to draw-down to near-zero pp values, which suggests thatplants under reduced ppO2 should be able to sus-tain some net CO2 uptake at very low ppCO2.
The decrease in differences among the draw-down rates at the target pressures after 16 h com-pared with just 1 h (Fig. 3A vs. B) suggests thatsome acclimation occurs over time. Iwabuchi andKurata (2003) reported that short-term exposuresto reduced pressures increased photosynthesisand transpiration rates in spinach plants, butwhen plants were grown for 10 days at the tar-get pressure, no differences were noted. This wasattributed to a reduction in stomatal aperturesand conductance at the low pressure grownplants, which offset the increased diffusion rates.A similar reduction in conductance may have oc-curred after 16 h with the Arabidopsis plants inour study, but no direct measurements weretaken to confirm this.
Evapotranspiration data showed a consistentincrease as pressure decreased under both CO2-limiting and CO2-nonlimiting conditions. Thisfinding is consistent with other reports in the lit-erature (Daunicht and Brinkjans, 1992; Iwabuchiet al., 1995; Corey et al., 2002). Increased gas dif-fusion rates at reduced pressures favor higherevaporation rates (Rygalov et al., 2002), whichwould include leaf transpiration and can even re-sult in reduced leaf temperatures (Iwabuchi andKurata, 2003). There is little reason to suspect thatppO2 should have direct effects on transpiration,but ppCO2 can affect transpiration through directfeedback steps that control the opening of sto-matal guard cells in plant leaves (Morison, 1998).Yet there were no differences noted among theCO2-nonlimited (0.10–0.07 kPa) and the CO2-lim-ited (0.04–0.02 kPa) ranges in the tests. Despitethe direct effects of pressure on water vapormovement, when spinach plants were allowed toacclimate to low pressures for 10 days, transpi-ration was similar between 101 and 25 kPa
HYPOBARIC PLANT GROWTH AND TERRAFORMING MARS 861
FIG. 7. (A) CO2 drawdown curves of 5–6-week-old Ara-bidopsis plants comparing the effects of hypoxic (2.1 kPa)and normoxic ppO2 (21 kPa) with the total atmosphericpressure kept at a constant 101 kPa. (B) The reduced ppO2treatment at Earth-normal atmospheric pressure was ac-complished by flushing the LPGC with a 2.1 kPa O2/97.9kPa N2 gas mixture prior to the onset of the CO2 draw-down studies. The 21 kPa ppO2 environment was main-tained at 101 kPa normal atmospheric pressure. The ef-fects are shown for maintaining the ppO2 at a constant2.1 kPa while the total atmospheric pressure was changedfrom 101 kPa to 10 kPa. At 10 kPa total pressure, the am-bient ppO2 was 2.1 kPa (n � 4).

(Iwabuchi and Kurata, 2003). As noted abovewith CO2 uptake, this response was explained onthe basis of reduced stomatal conductance mea-sured for the low-pressure-acclimated plants.
Tracking the rise in CO2 during the dark pe-riod to estimate respiration rates of Arabidopsisplants showed that RD rates were in the order 10kPa � 50 kPa � 101 kPa (Fig. 5). This result con-trasts with the observation by Corey et al. (1996),who reported a 40% decrease in respiration of let-tuce plants grown at 51 kPa (with 11 kPa O2) com-pared with 101 kPa (with 21 kPa O2), and withthose of Corey et al. (1997), where no change inrespiration occurred with wheat plants grown at70 kPa (14 kPa O2). Oxygen pp values decreasedproportionately with pressure for both studies byCorey et al. (1996, 1997) and in our study withArabidopsis. Thus the range of responses is diffi-cult to reconcile on the basis of either total pres-sure or ppO2. One might expect that reducedppO2 would slow respiratory events, but this wasonly noted for lettuce (Corey et al., 1996). Unfor-tunately, the two studies by Corey et al. (1996,1997) and our study all used different plantspecies, which suggests that there may be differ-ent limitations of ppO2 availability to respiringtissues among these species.
Mars astrobiological interpretations
The NASA Mars Exploration Program has fourkey objectives: (i) characterize the climate ofMars, (ii) characterize the geology of Mars, (iii)determine whether life ever arose on Mars, and(iv) prepare for human exploration of Mars(Garvin et al., 2001) (see: http://mars.jpl.nasa.gov). The NASA Astrobiology Program has 10primary goals, of which a significant level of em-phasis is placed on determining how terrestriallife might respond to other planetary environ-ments (Morrison, 2001) (see: http://astrobiol-ogy.arc.nasa.gov). Both efforts are likely to leadto the human exploration of Mars within the next2–3 decades. To prepare for the many challengesthat await those future human explorers, the sci-entific and engineering communities must beginto model a wide range of physical and biologicalprocesses that will contribute to a successful mis-sion. Of the many diverse physical and biologi-cal processes to be considered while preparing forthe human exploration of Mars, hypobaric envi-ronments hold great potential for reducing theESM of bioregenerative ALS systems (Drysdale et
al., 1999) if the effects of low pressure on plantscan be understood.
The study of plant responses to low-pressureenvironments has three key applications to theMars Exploration Program, which include (i) con-ducting near-term plant biology experiments atlow pressures during future Mars surface exper-iments (i.e., over the next 10–20 years), (ii) designof bioregenerative ALS systems for human ex-ploration (i.e., over the next 20–30 years), and (iii)long-term efforts to terraform the martian surface(i.e., over the next hundreds of years). Recently,several researchers have begun to study hypo-baric effects on microbial physiology, growth,replication, and adaptation (Kanervo et al., 2005;Schuerger and Nicholson, 2006; Schuerger et al.,2006). Although the nascent field of hypobaricmicrobiology is just getting underway, evidencesuggests that many terrestrial microorganismsare capable of normal growth and replication atpressures as low as 2.5–10.0 kPa. The literatureand research results presented herein suggestthat plants might also be capable of adaptation toa low-pressure environment of at least 10 kPa(100 mb), and perhaps lower. Thus, there are ini-tial indications that terrestrial plants and mi-croorganisms can be preselected to adapt to hy-pobaric environments that would have directbenefits to the design of plant biology experi-ments for Mars landers, construction of biore-generative ALS systems for human missions toMars, and perhaps the long-term terraforming ofthe martian surface. Let us briefly examine eachof these scenarios in turn.
First, several recent papers have proposednear-term launch of plant biology experiments onMars landers (Schuerger et al., 2002; Paul et al.,2004; Ferl et al., 2006). The primary justificationsfor these efforts are: (i) to begin to characterizehow the martian environment will affect thegrowth, adaptation, gene expression, and evolu-tion of plants as a prelude to designing futurebioregenerative ALS systems for human missionsto Mars and (ii) to characterize the potentialbiotoxic effects of Mars regolith on eukaryotes.The former is a prelude to using plants for biore-generative life support systems on Mars (Coreyet al., 2002; Ferl et al., 2006), and the latter involvesplanetary protection issues related to thebiosafety of human exploration of Mars (Com-mittee on Precursor Measurements Necessary toSupport Human Operations on the Surface ofMars, 2002). The design of plant biology payloads
RICHARDS ET AL.862

for near-term Mars landers would be greatlyaided by reducing the atmospheric pressure re-quired for plant growth and development. Sucha hypobaric plant biology payload would reducethe ESM of the system by (i) lowering the struc-tural mass of the plant growth chamber, (ii) re-ducing the mass of atmospheric consumables re-quired for the experiments, and (iii) because ofthe lowered mass, decreasing the heating, cool-ing, insulation, and power loads required tomaintain acceptable temperature ranges for theplant biology experiments. Results from the cur-rent study suggest that plants could be grown inhypobaric environments to at least 10 kPa with-out overtly inhibiting photosynthesis. Althoughthere were changes noted in both evapotranspi-ration and dark respiration with Arabidopsis un-der hypobaric conditions, these factors might notchange the overall growth and development ofArabidopsis. In contrast, Paul et al. (2004) reporteddramatic shifts in patterns of gene expression forArabidopsis under hypobaric conditions, withover 200 genes being dramatically up- or down-regulated by changes in total atmospheric pres-sure. Thus, even though several ESM engineer-ing advantages exist for designing hypobaricplant biology payloads for Mars landers, it is cur-rently unknown whether the changes in plantphysiology noted here, and in the cited literature,might preclude or constrain the use of low pres-sure as an environmental factor for normalgrowth and development of plants on near-termMars lander payloads.
Many of these same arguments for the ESMbenefits and possible plant physiological compli-cations discussed above for Mars lander plant bi-ology payloads also exist for the design of hypo-baric bioregenerative ALS systems for humanmissions. However, the potential ESM reductionsin mass and power for hypobaric ALS systemshave driven most of the justifications for con-ducting low-pressure research on plant growthand development. If hypobaric environments areto be adopted for future bioregenerative ALS sys-tems, then the effects of low pressure on plantgrowth must be fully understood. The results reported here, and the results published byIwabuchi and Kurata (2003), suggest that plantsmight adapt to hypobaric conditions over time,and, thus, might perform nominally under hy-pobaric conditions that could significantly lowerthe ESM costs of a bioregenerative ALS system.Thus, if additional research clearly identifies how
to use hypobaric environments to produce high-quality and high-yielding plants, the potentialESM savings with a hypobaric bioregenerativeALS system might dramatically lower the massand energy costs for human missions to Mars.
But perhaps the most interesting long-term im-plication of plant adaptations to low-pressureconditions is the use of plants in intermediate andadvanced stages of terraforming the surface ofMars. Several reviews on how to initiate the ter-raforming of Mars discuss sequential stages of in-troducing terrestrial life forms to Mars as the atmosphere thickens and warms (Fogg, 1995;McKay and Marinova, 2001; Graham, 2004; andadditional citations within these reviews). Initialstages are likely to include deployment of mi-crobial systems, followed by lichens, fungi,bryophytes, insects, higher plants, and eventuallycomplex metazoan animal life. These reviews dis-cuss how the atmosphere on Mars must bechanged compositionally and thermally to permitthe establishment of terrestrial life on the surface,but they generally avoid the issue of the exact to-tal pressure required for these sequential stagesof biological succession. Graham (2004) does dis-cuss several adaptations of terrestrial life formsto diverse partial pressures of N2 and O2 that helpconstrain the minimum concentrations of thesegases required in a more complex bulk atmo-sphere, but fails to discuss the effects of total pres-sure on microbial and plant introductions on apartially terraformed Mars. The primary reasonfor this omission is that there is scant direct evi-dence that clearly indicates at which pressuresspecific groups of terrestrial organisms might beintroduced to a warming and thickening atmo-sphere to achieve self-sustaining ecosystems onMars. The results of the current study, and thecited literature, suggest that higher plants mightrequire at least 10 kPa (100 mb) of total atmo-spheric pressure, 2.1 kPa of ppO2, and at least sev-eral kPa of water vapor in the atmosphere to growand develop at a reasonable level of normalcy. Inaddition, a few studies indicate that many ter-restrial microorganisms might be able to functionat pressures down to 2.5 kPa (25 mb), as long asliquid water and consumable organics are avail-able in the environments (Schuerger and Nichol-son, 2005, 2006; Berry et al., 2006; Schuerger et al.,2006). Thus, we find that although total pressureis likely to have a profound effect on the succes-sion of microbial and plant systems on a partiallyterraformed Mars, very little substantive research
HYPOBARIC PLANT GROWTH AND TERRAFORMING MARS 863
is available to model the actual deployment of ter-restrial life forms. We suggest that future researchon terraforming Mars emphasize studies thatidentify the total pressure, atmospheric composi-tion (i.e., the pp values of constituent gases), andthermal conditions required for a nominal de-ployment of candidate species.
ACKNOWLEDGMENTS
This research was supported by grants fromthe HEDS Program (Human Exploration and De-velopment of Space), Code U, NASA (#AO-99-HEDS-01-032). The authors would like to thankPhil Fowler for his assistance on the design andinstallation of the automatic data acquisition sys-tem used in the LPGC.
ABBREVIATIONS
ALS, advanced life support; Enet, net evapo-transpiration; ESM, equivalent system mass;LPGC, low-pressure growth chamber; PAR, pho-tosynthetically active radiation; Pnet, net photo-synthesis; pp, partial pressure; RD, dark-cycle res-piration; RuBISCo, ribulose-1,5-bisphosphatecarboxylase; SAS, Statistical Analysis System.
REFERENCES
Andre, M. and Massimino, D. (1992) Growth of plants atreduced pressures: experiments in wheat-technologicaladvantages and constraints. Adv. Space Res. 12(5), 97–106.
Berry, B.J., Nicholson, W.L., and Schuerger, A.C. (2006)Proliferation of common spacecraft contaminants ap-pears limited under simulated Martian conditions [ab-stract]. Astrobiology 6(1), 254.
Boston, P.J. (1981) Low-pressure greenhouses and plantsfor a manned research station on Mars. JBIS 54(3),189–192.
Burg, S.P. and Burg, E.A. (1966) Fruit storage at subat-mospheric pressures. Science 153(3733), 314–315.
Bucklin, R.A., Fowler, P.A., and Leary, J.D. (2000) Designneeds for Mars deployable greenhouse. In NASA Tech-nical Memorandum 2000-208577: Mars Greenhouses: Con-cepts and Challenges, edited by R.M. Wheeler and C.Martin-Brennan, NASA, Kennedy Space Center, FL, pp.98–104.
Clawson, J.M. (2000) Development of an inflatable green-house for a modular crop production system. In NASATechnical Memorandum 2000-208577: Mars Greenhouses:
Concepts and Challenges, edited by R.M. Wheeler and C.Martin-Brennan, NASA, Kennedy Space Center, FL, pp.77–89.
Committee on Precursor Measurements Necessary toSupport Human Operations on the Surface of Mars,Aeronautics and Space Engineering Board Space Stud-ies Board, Division on Engineering and Physical Sci-ences, National Research Council (2002) Safe on Mars:Precursor Measurements Necessary to Support Human Op-erations on the Martian Surface, National Academy Press,Washington, DC, p. 51.
Cooper, W.C. and Horanic, G. (1973) Induction of abscis-sion at hypobaric pressures. Plant Physiol. 51(12),1002–1004.
Corey, K.A. and Fowler, P.A. (2000) Plant responses torarified atmospheres. In NASA Technical Memorandum2000-208577: Mars Greenhouses: Concepts and Challenges,edited by R.M. Wheeler and C. Martin-Brennan, NASA,Kennedy Space Center, FL, pp. 48–57.
Corey, K.A., Bates, M.E., and Adams, S.L. (1996) Carbondioxide exchange of lettuce plants under hypobaricconditions. Adv. Space Res. 18(4/5), 265–272.
Corey, K.A., Barta, D.J., and Henninger, D.L. (1997) Pho-tosynthesis and respiration of a wheat stand at reducedatmospheric pressure and reduced oxygen. Adv. SpaceRes. 20(19), 1869–1877.
Corey, K.A., Barta, D.J., and Wheeler, R.M. (2002) TowardMartian agriculture: responses of plants to hypobaria.Life Support Biosph. Sci. 8(2), 103–114.
Daunicht, H.J. and Brinkjans, H.J. (1992) Gas exchangeand growth of plants under reduced air pressure. Adv.Space Res. 12(5), 107–114.
Drake, B.G., Gonzalez-Meler, M.A., and Long, S.P. (1997)More efficient plants: a consequence of rising atmo-spheric CO2? Annu. Rev. Plant Physiol. Plant Mol. Biol.48, 609–639.
Drysdale, A.E., Ewert, M.K., and Hanford, A.J. (1999)Equivalent System Mass Studies of Missions and Concepts,SAE Technical Paper Series, ICES Publication 1999-01-2081, SAE International, Warrendale, PA.
Eckart, P. (1996) Spaceflight Life Support and Biospherics,Kluwer Academic Publishers, Boston, MA and Micro-cosm Press, Torrance, CA.
Ewert, M.K., Drysdale, A., Hanford, A.J., and Levri, J.(2001) Life Support Equivalent System Mass Predictions forthe Mars Dual Lander Reference Mission, SAE TechnicalPaper Series, ICES Publication 2001-01-2358, SAE Inter-national, Warrendale, PA.
Ferl, R.J., Schuerger, A.C., Paul, A.L., Gurley, W.B., Corey,K., and Bucklin, R. (2002) Plant adaptation to low pres-sures: potential molecular responses. Life SupportBiosph. Sci. 8(2), 93–101.
Ferl, R.J., Schuerger, A.C., Paul, A.L., Dixon, M., Fluford,P., and McKay, C. (2006) Mars plant biology: a work-shop report and recommendations for plant biology inthe era of exploration. Habitation 11(1), 1–4.
Fogg, M.J. (1995) Terraforming: Engineering Planetary Environments, Society of Automotive Engineers, Inc.(SAE), Warrendale, PA, pp. 544.
Gale, J. (1972) Availability of carbon dioxide for photo-
RICHARDS ET AL.864
synthesis at high altitudes: theoretical considerations.Ecology 53(3), 494–497.
Gale, J. (1973) Experimental evidence for the effect ofbarometric pressure on photosynthesis and transpira-tion. In Plant Response to Climatic Factors, edited by R.O.Slatyer, Unesco Publishing, Paris, pp. 289–294.
Garvin, J.B., Figueroa, O., and Naderi, F.M. (2001) NASA’snew Mars Exploration Program: the trajectory ofknowledge. Astrobiology 1(4), 439–446.
Goto, E. (1997) Environmental control for plant produc-tion in space CELSS. In Plant Production in Closed Ecosys-tems, edited by E. Goto, K. Kurata, M. Hayashi, and S.Sase, Kluwer Academic Publishers, Dordrecht, TheNetherlands, pp. 279–296.
Goto, E., Iwabuchi, K., and Takakura, T. (1991) An envi-ronmental control system for growing plants under lowtotal pressures. In Proceedings of the IFAC/ISHS Work-shop on Mathematical and Control Applications in Agricul-ture and Horticulture, Pergamon Press, Matsuyama,Japan, pp. 141–146.
Goto, E., Iwabuchi, K., and Takakura, T. (1995) Effect ofreduced total air pressure on spinach growth. J. Agric.Meteorol. 51(2), 139–143.
Goto, E., Ohta, H., Iwabuchi, K., and Takakura, T. (1996)Measurement of net photosynthetic and transpirationrates of spinach and maize plants under hypobaric con-ditions. J. Agric. Meteorol. 52(2), 117–123.
Goto, E., Arai, Y., and Omasa, K. (2002) Growth and De-velopment of Higher Plants Under Hypobaric Conditions,SAE Technical Paper Series, ICES 2002-01-2439, SAE In-ternational, Warrendale, PA.
Graham, J.M. (2004) The biological terraforming of Mars:planetary ecosynthesis as ecological succession on aglobal scale. Astrobiology 4(2), 169–196.
He, C., Davies, F.T. Jr., Lacey, R.E., Drew, M.C., andBrown, D.L. (2003) Effect of hypobaric conditions onethylene evolution and growth of lettuce and wheat. J.Plant Physiol. 160(11), 1341–1350.
Iwabuchi, K. and Kurata, K. (2003) Short-term and long-term effects of low total pressure on gas exchange ratesof spinach. Adv. Space Res. 31(1), 241–244.
Iwabuchi, K., Goto, E., and Takakura, T. (1995) Effect ofO2 pressure under low air pressure on net photosyn-thetic rate of spinach. Acta Hort. 399, 101–106.
Iwabuchi, K., Goto, E., and Takakura, T. (1996) Germina-tion and growth of spinach under hypobaric conditions.Environ. Control Biol. 34(3), 169–178.
Kanervo, E., Lehto, K., Stahle, K., Lehto, H., and Maen-paa, P. (2005) Characterization of growth and photo-synthesis of Synechocystis sp. PCC 6803 cultures underreduced atmospheric pressures and enhanced CO2 lev-els. Int. J. Astrobiol. 4(1), 97–100.
Lacey, R., Drew, M., and Spanarkel, R. (2000) Low pres-sure systems for plant growth. In NASA Technical Mem-orandum 2000-208577: Mars Greenhouses: Concepts andChallenges, edited by R.M. Wheeler and C. Martin-Brennan, NASA, Kennedy Space Center, FL, pp. 39–47.
Massimino, D. and Andre, M. (1999) Growth of wheat un-der one tenth of the atmospheric pressure. Adv. SpaceRes. 24(3), 293–296.
McKay, C.P. and Marinova, M.M. (2001) The physics, bi-ology, and environmental ethics of making Mars hab-itable. Astrobiology 1(1), 89–109.
Ming, D.W. and Henninger, D.L. (1989) Lunar Base Agri-culture: Soils for Plant Growth, American Society ofAgronomy, Crop Science Society of America, and SoilScience Society of America, Madison, WI, pp. 255.
Morison, J.I.L. (1998) Stomatal response to increased CO2
concentrations. J. Exp. Bot. 49, 443–452.Morrison, D. (2001) The NASA Astrobiology Program.
Astrobiology 1(1), 3–13.Musgrave, M.E., Gerth, W.A., Scheld, H.W., and Strain,
B.R. (1988) Growth and mitochondrial respiration ofmungbeans (Phaseolus aureus Roxb.) germinated at lowpressure. Plant Physiol. 86(1), 19–22.
Ogren, W.L. (1984) Photorespiration: pathways, regula-tion, and modification. Annu. Rev. Plant Physiol. 35,415–442.
Owen, T. (1992) The composition and early history of theatmosphere of Mars. In Mars, edited by H.H. Kieffer,B.M. Jakosky, C.W. Snyder, and M.S. Mathews, Uni-versity of Arizona Press, Tucson, pp. 818–834.
Parkinson, K.J. and Legg, B.J. (1978) Calibration of in-frared analysers for carbon dioxide. Photosynthetica12(1), 65–67.
Paul, A.-L., Schuerger, A.C., Popp, M.P., Richards, J.T.,Manak, M.S., and Ferl, R.J. (2004) Hypobaric biology:Arabidopsis gene expression at low atmospheric pres-sure. Plant Physiol. 134(1), 215–223.
Quebedeaux, B. and Hardy, R.W.F. (1976) Oxygen con-centration: regulation of crop growth and productivity.In CO2 Metabolism and Plant Productivity, edited by R.H.Burris and C.C. Blake, University Park Press, Baltimore,MD, pp. 185–204.
Rygalov, V.Y., Fowler, P.A., Metz, J.A., Wheeler, R.M.,and Bucklin, R.A. (2002) Water cycles in closed ecolog-ical systems: effects of atmospheric pressure. Life Sup-port Biosph. Sci. 8(3/4), 125–135.
Sandy, C.R. and Cadogen, D. (2000) Inflatable structuresfor space applications. In NASA Technical Memorandum2000-208577: Mars Greenhouses: Concepts and Challenges,edited by R.M. Wheeler and C. Martin-Brennan, NASA,Kennedy Space Center, FL, pp. 90–97.
Schuerger, A.C. and Mitchell, D.J. (1992) Effects of tem-perature, hydrogen ion concentration, humidity, andlight quality on disease severity of Fusarium solani f. sp.phaseoli. Can. J. Bot. 70(10), 1798–1808.
Schuerger, A.C. and Nicholson, W.L. (2005) Synergisticeffects of low pressure, low temperature, and CO2 at-mospheres inhibit the growth of terrestrial bacteria un-der simulated martian conditions [abstract 1366]. In 36th
Lunar and Planetary Science Conference Abstracts, LPIContribution No. 1234, Lunar and Planetary Institute,Houston.
Schuerger, A.C. and Nicholson, W.L. (2006) Interactive ef-fects of hypobaria, low temperature, and CO2 atmos-pheres inhibit the growth of mesophilic Bacillus spp. un-der simulated martian conditions. Icarus 185(1), 143–152.
Schuerger, A.C., Ming, D., Newsom, H., Ferl, R.J., andMcKay, C.P. (2002) Near-term lander experiments for
HYPOBARIC PLANT GROWTH AND TERRAFORMING MARS 865
growing plants on Mars: requirements for informationon chemical and physical properties of Mars regolith.Life Support Biosph. Sci. 8(3/4), 137–147.
Schuerger, A.C., Berry, B., and Nicholson, W.L. (2006) Ter-restrial bacteria typically recovered from Mars space-craft do not appear able to grow under simulated mar-tian conditions [abstract 1397]. In 37th Lunar andPlanetary Science Conference Abstracts, LPI ContributionNo. 1303, Lunar and Planetary Institute, Houston.
Schwartzkopf, S.H. and Mancinelli, R.L. (1991) Germina-tion and growth of wheat in simulated Martian atmo-spheres. Acta Astronaut. 25(4), 245–247.
Spanarkel, R. and Drew, M.C. (2002) Germination andgrowth of lettuce (Lactuca sativa) at low atmosphericpressure. Physiol. Plant. 116(4), 468–477.
Stenvers, N. and Bruinsma, J. (1975) Ripening of tomatofruits at reduced atmospheric and partial oxygen pres-sures. Nature 253(5492), 532–533.
Wheeler, R.M. (1992) Gas exchange measurements in alarge, closed plant growth chamber. HortScience 27(7),777–780.
Wheeler, R.M., Rygalov, V.Ye., Fowler, P.A., Corey, K.A.,Guidi, C.P., and Sger, J.C. (2001) Mars greenhouses: astep toward bioregenerative life support systems. InAdvanced Technology of Environment Control and Life Sup-port, edited by Y. Tako, M. Shinohara, O. Komatsubara,and K. Nitta, Institute for Environmental Science,Rokkasho, Japan, p. 339.
Zelitch, I. (1992) Control of plant productivity by regula-tion of photorespiration. BioScience 42(7), 510–516.
Address reprint requests to:Andrew C. Schuerger
Department of Plant PathologyUniversity of Florida
Space Life Sciences LaboratoryKennedy Space Center, FL 32899
E-mail: [email protected]
RICHARDS ET AL.866
This article has been cited by:
1. Patricia Fajardo-Cavazos , Samantha M. Waters , Andrew C. Schuerger , Sheeja George , James J. Marois , Wayne L.Nicholson . 2012. Evolution of Bacillus subtilis to Enhanced Growth at Low Pressure: Up-Regulated Transcription of des-desKR, Encoding the Fatty Acid Desaturase System. Astrobiology 12:3, 258-270. [Abstract] [Full Text HTML] [Full TextPDF] [Full Text PDF with Links]
2. Yong-Kang TANG, Shuang-Sheng GUO, Shan LIN, Wei-Dang AI, Li-Feng QIN. 2011. Review of advances on growthcharacteristics and adapting mechanism of plant at low atmospheric pressure. Chinese Journal of Plant Ecology 35:8, 872-881.[CrossRef]
3. B. Guo, B. H. Abbasi, Y. H. Wei. 2011. Effects of hypobaric growth conditions on morphogenic potential and antioxidativeenzyme activities in Saussurea involucrata. Biologia Plantarum 55:4, 783-787. [CrossRef]
4. Chuanjiu He, Fred T. Davies. 2011. Ethylene reduces plant gas exchange and growth of lettuce grown from seed to harvestunder hypobaric and ambient total pressure. Journal of Plant Physiology . [CrossRef]
5. R.M. Wheeler, C.A. Wehkamp, M.A. Stasiak, M.A. Dixon, V.Y. Rygalov. 2011. Plants survive rapid decompression:Implications for bioregenerative life support. Advances in Space Research 47:9, 1600-1607. [CrossRef]
6. Hemant L. Gohil, Melanie J. Correll, Thomas Sinclair. 2011. Predicting the effects of gas diffusivity on photosynthesis andtranspiration of plants grown under hypobaria. Advances in Space Research 47:1, 49-54. [CrossRef]
7. Chuanjiu He, Fred T. Davies, Ronald E. Lacey. 2009. Hypobaria, hypoxia, and light affect gas exchange and the CO 2compensation and saturation points of lettuce ( Lactuca sativa )This paper is one of a selection published in a Special Issuecomprising papers presented at the 50th Annual Meeting of the Canadian Society of Plant Physiologists (CSPP) held at theUniversity of Ottawa, Ontario, in June 2008. Botany 87:7, 712-721. [CrossRef]
8. Chuanjiu He, Fred T. Davies, Ronald E. Lacey. 2009. Ethylene reduces gas exchange and growth of lettuce plants underhypobaric and normal atmospheric conditions. Physiologia Plantarum 135:3, 258-271. [CrossRef]
9. E. Arican, N. Gozukirmizi. 2008. Effects of hyperbaric oxygenation on cultured barley embryos. Acta Biologica Hungarica59:4, 453-464. [CrossRef]
10. Chuanjiu He, Fred T. Davies, Ronald E. Lacey. 2007. Separating the effects of hypobaria and hypoxia on lettuce: growth andgas exchange. Physiologia Plantarum, ahead of print070719024921001-???. [CrossRef]