
Exporter Responses to FTA Tariff Preferences: Evidence ...€¦ · Exporter Responses to FTA Tariff...
36
Discussion Paper Series Exporter Responses to FTA Tariff Preferences: Evidence from Thailand Archanun Kohpaiboon and Juthathip Jongwanich Discussion Paper No.40 February 15, 2017 Faculty of Economics, Thammasat University
Transcript of Exporter Responses to FTA Tariff Preferences: Evidence ...€¦ · Exporter Responses to FTA Tariff...

Discussion Paper Series
Exporter Responses to FTA Tariff Preferences:
Evidence from Thailand
Archanun Kohpaiboon
and Juthathip Jongwanich
Discussion Paper No.40
February 15, 2017
Faculty of Economics, Thammasat University

1
Exporter Responses to FTA Tariff Preferences: Evidence from Thailand
by
Archanun Kohpaiboon* Faculty of Economics, Thammasat University
Bangkok, Thailand [email protected]
and Juthathip Jongwanich
Faculty of Economics, Thammasat University Bangkok, Thailand
ABSTRACT
This paper focuses on how exporters actually respond to the FTA preferential schemes that are mushrooming worldwide, analyzing the administrative records of FTA implementation at the product level in Thailand. Our key finding is that while there is a growing number of newly-launched FTAs with a potentially larger membership coverage in addition to existing FTAs, firms tend to intensively prioritize using these existing and bilateral FTAs instead. Only a narrow range of products were involved in applications for FTA preferential schemes. As a result, only one third of actual exports were covered by such arrangements. The key determinants for firms to apply the preferential schemes include tariff margins, the ability to compile with ROOs and economic fundamentals influencing trade. Hence, it is less likely for FTAs to open up new export opportunities for products that are either yet to be traded or of low prospective trade volume. Our estimate of the cost of complying with ROOs averages out at around 8.6 per cent of tariff equivalence. The cost is approaching zero for developed countries, but substantially higher for developing nations. The key policy inference is the export enhancing effect of FTAs being passive at best, working only after all economic fundamentals are established and sound. To harness the trade-induced effects of signed FTAs, reducing costs incurred from the presence of ROOs from both exporting and importing countries represents the prime focus required. Key words: Free Trade Agreement, Rules of Origin, Thailand, Unbalanced Panel Data
Econometric Analysis JEL: F15, F53, O19, O53 Asia Pacific Economic Literature (forthcoming)
* We would like to thank the journal’s referees for the constructive comments on the paper. We also benefits from discussion with Prema-chandra Athukorala, Richard Pomfret, William James, Shujiro Urata, Fukunari Kimura, and Christopher Findlay. Excellent research assistance from Mr. Panupong Sri-udomkajorn and Mr. Pit Jongwattanakul is acknowledged.
2
1. Issues The proliferation of free trade agreements (FTAs) is one of the most notable phenomena
prevailing in the world economy since the onset of the new millennium (Baldwin and
Jaimovich, 2012). The number of FTAs notified to the World Trade Organization (WTO)
rapidly increased from around 124 in 1994 to 625 by February 2016, nearly 70 per cent of
which currently remain in force.1 Considerations of whether and how exporters actually
respond to FTA preferential schemes remain open empirical questions with immense
policy implications. This is due to the fact that not all exports are eligible for such
preferential schemes. Products must compile with the rules of origins (ROOs), the rules
proving the origin of goods for the purpose of determining any eligibility for tariff
concessions. In addition, there exists a burden induced by administrative procedures in
receiving the preferential treatment. All in all, the actual impact on exports is not as
straightforward as we usually expect from multilateral and/or unilateral liberalization.
While there are a number of empirical studies (e.g. Keck and Lendle, 2012; Cadot
and Ing, 2015) examining the determinants of preferential scheme utilization, most of them
draw on data concerning the Generalized System of Preferences (GSP) schemes offered by
developed countries to developing nations. Despite useful, analyses based on GSP schemes
are based on exports from many developing countries to a given developed country. The
cost estimates therein would reflect the restrictiveness of rules of origin in a given GSP
scheme. Administrative procedures imposed by importing countries could not be captured.
Interestingly, there is increasing concern that ROOs in practice have been used as vital
commercial policy instruments and eventually deter firms from using FTA preferential
schemes. 2 Such concerns are highly policy relevant as a number of countries put
tremendous effort into negotiating and signing FTAs with the expectation of their
implementation enhancing trade opportunities.
1 Further details are available at:
https://www.wto.org/english/tratop_e/region_e/region_e.htm 2 There are a number of studies arguing that ROOs have been used as vital commercial policy instruments to mould ROOs to the benefit of special interest groups (Vermulst & Waer 1990, Krueger 1999, Bhagwati et al. 1999, Falvey & Reed 2002, Estevadeordal & Suominen 2004, James 2005, and Krishna 2005).
3
This issue has become particularly important in East Asia where many economies
are enthusiastic about signing FTAs with their regional partners culminating in the zone
now standing at the forefront of global FTA activity (The Economist, 2014). Interestingly,
freshly-launched FTAs often surface in addition to existing agreements. For example,
Thailand and Australia signed an FTA in the late 2005, known as the Thailand-Australia
FTA (TAFTA). In 2010, the ASEAN-Australia-New Zealand FTA came into force, so that
from 2010 onwards firms had further options when accessing preferential schemes. If the
Regional Comprehensive Economic Partnership (RCEP) is successfully concluded, there
will be another alternative scheme available for Thai firms when exporting to Australia.
Arguably, this aims to consolidate the plethora of bilateral and plurilateral agreements and
rectify existing problems found in the earlier signed FTAs. Whether the new alternatives
in fact mitigate the problems faced in existing FTAs and encourage firms to use preferential
schemes has rarely been examined in the literature to date.
Against this backdrop, a comprehensive analysis of exporters’ responses to FTA
preferential schemes is undertaken with a view to informing the policy debates outlined
above. In order to indicate the responses of the private sector to FTA export creation, FTA
utilization (FTAU), the ratio between administrative records and actual trade, is calculated.
The calculated FTAU is further used as the dependent variable in an inter-product
(unbalanced) panel data econometric analysis.
There are studies of preference utilization but their analysis is based on data
concerning GSP schemes only. 3 This made impossible to examine administrative
procedures that might be imposed with protectionism by importing countries. In addition,
certain industry-specific characteristics which were ignored in the previous studies are
incorporated in our analysis. In particular, the extent to which products are involved in
global production networks and the existence of any foreign presence are included.
3 Alternatively, there are studies examining how firms respond to FTA preferential
schemes through questionnaire surveys such JETRO (2007), Takahashi and Urata (2008), Kawai and Wignaraja (2011) and the Economist (2014). Their results are likely to be subject to social desirability bias. Firm coverage that varies from study to study coverage also could have an influential impact on the outcome. See a full discussion in Kohpaiboon and Jongwanich (2015).
4
Thailand is suitable as a case study in this context for two reasons. Firstly, the Thai
government is active in signing FTAs with trading partners. In 2015, administrative
records for the FTA implementation of Thai exporters became available for the period
2001-15. This allows us to undertake a systematic analysis of FTA utilization by Thai
exporters. Secondly, Thai exporters have the potential to utilize the tariff concessions
offered by FTAs because the Thai manufacturing sector is relatively broad-based,
compared to neighboring countries.
The organization of this paper is as follows: Section 2 discusses the development
of FTAs in Thailand; this is followed by consideration of trends and patterns of the
administrative records of FTA in Section 3. Section 4 presents the empirical model and the
data used for econometric analysis. Section 5 additionally outlines the results of the
econometric analysis. Conclusions and policy inferences are presented in the final section
(Section 6).
2. FTAs in Thailand The slowdown in WTO liberalization negotiations resulted in a switch of political
attention and negotiating resources in Thailand towards preferential trade agreements and
bilateral free trade accords in particular. This process accelerated as a result of a significant
change in the political situation in Thailand between 2001 and 2006 where Thaksin
Shinawatra’s Thai Rak Thai political party came to power with a strong mandate. In
particular, Thailand signed 15 FTAs initiated during the Thaksin administration period
(2001–2006) and implemented without neither careful consideration, nor public
consultation.
Between 2006 and May 2011 FTA enthusiasm in Thailand stalled due to the coup
a coup d’etat, the 11th since the country’s first coup in 1932. Under the new constitution
promulgated in 2007, execution of international trade agreements is subject to
parliamentary approval (Article 190) to prevent rushed conclusion of agreements without
careful study and public consultation. Article 190 ensures that all international trade
agreements must be carefully scrutinized and subject to countrywide public hearings. Thus,
more time is now needed to enact international trade agreements, compared with the
Thaksin period. This constitutional amendment had a significant impact on FTAs as not a

5
single bilateral FTA was ratified between 2006 and May 2011 except those that were only
instigated within the Association of Southeast Asian Nations (ASEAN) ‘plus’ format.
From May 2011 and May 2014, Prime Minister Yingluck Shinawatra, the younger
sister of former Prime Minister Thaksin Shinawatra, started to pay attention to FTA
negotiations again, including negotiations with Canada in March 2012 and the expression
of interest in becoming a member of the Trans-Pacific Partnership (TPP) made during the
United States President Obama’s visit to Thailand in November 2012. On May 2014,
nonetheless, the Royal Thai Armed Forces led by General Prayut Chan-o-cha, launched a
coup d’etat against the caretaker government of Thailand. As a consequence, this has
stalled all FTA talks wherein developed country FTA partners including US and European
countries were involved.4
There are only eight FTAs in which tariff cuts were substantial, covering more than
80 per cent of tariff lines and having been offered since 2010. They comprise the ASEAN
Free Trade Area (AFTA), ASEAN-China FTA (ACFTA), the Thailand–Australia FTA
(TAFTA), the Thailand–New Zealand FTA (TNFTA), the Japan–Thailand Economic
Partnership Agreement (JTEPA), the ASEAN–Japan FTA (AJFTA), the ASEAN–Korea
FTA (AKFTA), and the ASEAN-Australia-New Zealand FTA (AANZFTA).
Most of FTAs Thailand has signed so far mainly focus on goods market
liberalization (Kohpaiboon and Jongwanich, 2014; Kohpaiboon et al. 2015). As revealed
in Kohpaiboon and Jongwanich (2015), the preferential tariffs offered in these agreements
vary across FTAs considerably, from 0.1 to 10.7 per cent with sizable exceptions. Tariff
margins for the developed countries were smaller - ranging from 0.1 to 5.7 per cent. The
corresponding variance for developing countries was between 2 and 10.7 per cent with a
sizable number of exceptions.
3. Trend and Patterns of Administrative Records of FTA Implementation
4 Information in this subsection is compiled from official data source. Available at
http://www.dtn.go.th/index.php/forum.html by the authors. Full details are available upon the requests.
6
In this subsection, analysis made is based on official records of certificate of origin
(c/o).5 All exporters who want to apply for a FTA preferential tariff must complete the
prerequisite documents in order to provide necessary information related to product
originality. If products comply with FTA ROOs, official records of c/o will be issued.
Data on c/o records (henceforth referred to preferential export) are available for the period
2001 to the present (2015). Original data of preferential exports is available at the six-digit
level of the Harmonized System (HS) classification. Before 2006, there was a few FTAs
signed and in effect so our following analysis will focus between 2006 and 2015. Note that
the official records of TNZFTA is not available due to the adoption of paperless system so
that those are excluded in the following discussion.
The dollar value of preferential exports increased over the period, from $10 billion
in 2006 to $50.6 billion in 2015 (Figure 1.1). Its corresponding annual growth average was
18 per cent, with a downward trend over the considered period. In particular, the value
over the past three years (i.e. 2013-15) was stagnant, hovering at around $50 billion. The
rapid growth observed between 2006 and 2010 was a result of the increased number of
FTAs in effect.
The ASEAN Free Trade Area (AFTA) and its successor, The ASEAN Economic
Community (AEC), accounted for about 29.5 per cent of total preferential exports,
averaged out between 2006 and 2015 (Figure 1.2). Even though the export value through
the AEC continued to grow from $5.5 billion in 2006 to $19.2 billion in 2015, its share
dropped from 55 per cent to 37.9 per cent during this period. The decreasing relative
importance of the AEC emerged as a result of newly signed FTAs.
Generally, firms applying for AEC preferential schemes were seeking market
access to the original ASEAN members. For example, in 2015, the total dollar value of
preferential exports to AEC markets was $19.2 billion. Of the total AEC preferential
export figure, 64 per cent was for market access into original ASEAN member states.
Among the original ASEAN members, Indonesia accounted for the largest share, i.e. 26
per cent of total AEC preferential exports. The first and second runner-ups among the
original ASEAN members were the Philippines (18.8%), and Malaysia (16.1%).
5 Data are administered in Thailand by the Bureau of Preferential Trade (BPT),
Department of Foreign Trade and The Ministry of Commerce.

7
Nonetheless, their relative importance declined over the period under review due to the
rapid growth of preferential exports to new ASEAN member markets, i.e. Cambodia, Laos,
Myanmar and Vietnam (henceforth referred to as CLMV). The dollar value of preferential
exports to CLMV increased from $1.3 billion in 2006 to $5.2 and $6.9 billion in 2014-15,
respectively. Hence, its share increased from 23 per cent in 2006 to 36 per cent in 2015.
The most important export destination among CLMV is Vietnam.
Another interesting pattern observed within the AEC market concerns the declining
value of preferential exports to Indonesia. Despite occupying the largest share among
ASEAN members, Indonesia experienced not only a declining relative importance but also
a decline in terms of dollar values. This could be explained by increasing protectionism
sentiments and the use of non-tariff measures in Indonesia (Pantunru and Rahardja, 2015).6
By 2015, China had become the most important non-ASEAN, FTA partner in terms
of c/o records (Figure 1.3). The c/o record of Thai corporate exports to China increased
rapidly from $1.5 billion in 2006 to $11.5 billion in 2015, as a result of the progress of
trade liberalization undertaken in ACFTA. This works over and above the spectacular
growth performance of the Chinese economy over the past two decades.
Until 2013 Japan was the first runner-up after China in terms of the value of its
preferential exports. Their value increased from $ 4.5 billion in 2008 to around $6.5 billion
from 2012 onwards.7 From 2013, preferential exports to Australia overtook Japan and
became the first runner-up. Its preferential export value increased from $2.7 billion in 2006
to $8.2 billion in 2015.8
As outlined earlier, there are a growing number of newly launched FTAs in addition
to already signed FTAs. Hence, firms have more than one FTA schemes available for a
given export destination. In our data set, Australia and Japan are included in this category.
6 Nonetheless, a comprehensive study is needed to get a better understanding of
the declining preferential exports from Thailand to Indonesia. 7 The Figure for 2007 covered only two months (November and December) as
JTEPA came in effect in November 2007. Hence, we use 2008 as the starting point for comparison purposes.
8 While another developed country market is New Zealand, it is not brought into the discussion. This is because TNZFTA adopts a paperless system. Hence, there are no c/o records under the TNZFTA available. Measures recorded comprise transactions through AANZFTA. Hence, they do not form the same basis for comparison.
8
Interestingly, we find that firms are unlikely to apply such newly-launched FTAs. For
example, in the case of Australia, TAFTA and AANZFTA were in effect from 2006 and
2010, respectively. Hence, by 2010 onward firms were free to choose either TAFTA or
AANZFTA. In 2015, total preferential exports to Australia from Thailand amounted to
$8.2 billion, of which $7.8 billion was under the auspices of TAFTA. Similarly, the total
preferential export value from Thailand to Japan was $6.7 billion in 2015. The similar
result was also found in the case of Japan where two alternative FTAs available for Thai
firms exporting from Thailand to Japan (JTEPA and AJFTA). Such a pattern inevitably
raises policy attention. In particular, even though the regional wider FTAs, like AJFTA
and TANZFTA, allow for accumulation inputs across regions, they are not practical from
a firm viewpoint and as such relatively unattractive to prospective companies.
Experience of India is just opposite to what happens in FTAs involved Australai
and Japan. In particular, most of preferential export from Thailand to India were
undertaken under AIFTA. For example, by 2015, the value of preferential export from
Thailand to India was $3 billion,nearly 75 per cent of which were concluded under the
banner of AIFTA. This is due to the fact that there has not been any progress in
negotiations. By contrast, in 2010, AIFTA was in effect with a clear time schedule
concerning tariff cuts, i.e. 80% in 2016 for India and original ASEAN members.
The c/o records of ASEAN-Korea FTAs grew remarkably after signing in 2008,
from $0.9 billion in 2010 to $2.2 billion in 2011. From then on, the value of preferential
exports to Korea remained roughly constant at around $2 billion a year.
3.2 Product Concentration
This subsection examines the extent to which product lines benefiting from FTA
preferential schemes. As revealed in Table 1, a number of products applying for FTA
preferential schemes vary vastly across FTA partners. The number was high for major
FTA partners, such as Australia, Indonesia, Japan, Korea, Malaysia, Philippines, and
Vietnam average out at around 1,000 product lines. These numbers remained roughly
constant over the period considered. In response to the tariff cuts undertaken in gradual
steps in ACFTA, the number of products affected increased gradually over time, from 269
in 2006 to 1,270 product lines in 2015. The figures for India were similar to those of China
9
to a certain extent. With other FTA partners, the numbers of product lines were much
smaller.
The number of products applying for FTAs as a (per cent) ratio of the total volume
of products Thailand actually exports to a given FTA partner was around 40 per cent for
major FTA partners. It was much lower for other partners at around ten per cent. The
observed low ratio reflects the nature of highly concentrated product lines that benefit from
FTAs. This is supported by the cumulative share of preferential exports of top-ten products
(revealed in last three columns of Table 1), which was high over the period under
consideration. For example, the top ten products accounted for 77 per cent of total
preferential exports from Thailand to Australia in 2015, increasing from 72 and 61 per cent
in 2006 and 2012, respectively. The cumulative share of other major FTA partners was
more or less the same as Australia. The lowest cumulative share was in the case of Vietnam
with a noticeably increasing trend. Their share increased from 39 per cent in 2006 to 44
per cent in 2015. All in all, FTA preferential schemes tend to benefit a rather narrow range
of product lines. As argued in Kohpaiboon and Jongwanich (2015), these products are
dominated by four sectors, i.e. automotive (both vehicles and auto parts), electrical
appliances, petrochemical products, and processed foods, all of which share the following
characteristics. Firms in these sectors are generally large in size. Their products exhibit
high levels of local content. Interestingly, the tariff margins in these product are
substantial. All of these characterisitcs matter when it comes to firms’ decision to apply
FTA preferential schemes as elaborated below.
3.3 Utilization
To illustrate the use of FTAs, the ratio of preferential exports to actual export value
is calculated. There is ongoing debate on what the appropriate denominator in calculating
the ratio should be when the rather aggregate indicator is concerned.9 In particular, whether
the denominator in calculating the FTA utilization ought to entail total value or the value
of non-zero tariff items only. There are many items whose tariff is already zero so that
there is no incentive for firms to use FTAs. Including them in the denominator would lead
9 There problem is less severe when the analysis is undertaken at the disaggregate
level, i.e.4 digit or 6 digit.

10
to underestimating FTA utilization. Hence, it would be more appropriate to use non-zero-
tariff item values in the denominator. On the other hand, there are at least three reasons
running against the use of non-zero tariff items as the denominator. Firstly, in every FTA
negotiation, the potential trade highlighted in press is often based on total trade, regardless
how many products are tariff-free.10 Hence, to reveal the relative importance of FTAs,
total trade should be the benchmark. Secondly, negotiation in designing ROOs is
undertaken on all HS items, regardless of their existing most-favored-nation (MFN) tariff.
If zero-tariff items are not relevant for FTA uses, ROO negotiation should focus on non-
zero tariff items only. This is not true in ROO negotiation practice nowsdays. Finally, the
appropriate definition of non-zero-tariff items remains unclear when there are other tariff
exemption schemes in place. For example, in an export processing zones where tariffs of
inputs used for export can be exempted, . If so, it is very difficult to exclude them in
practice. Therefore, in the following discussion, which focuses on aggregate analyses, total
actual exports are used in the denominator in calculating utilization rates.
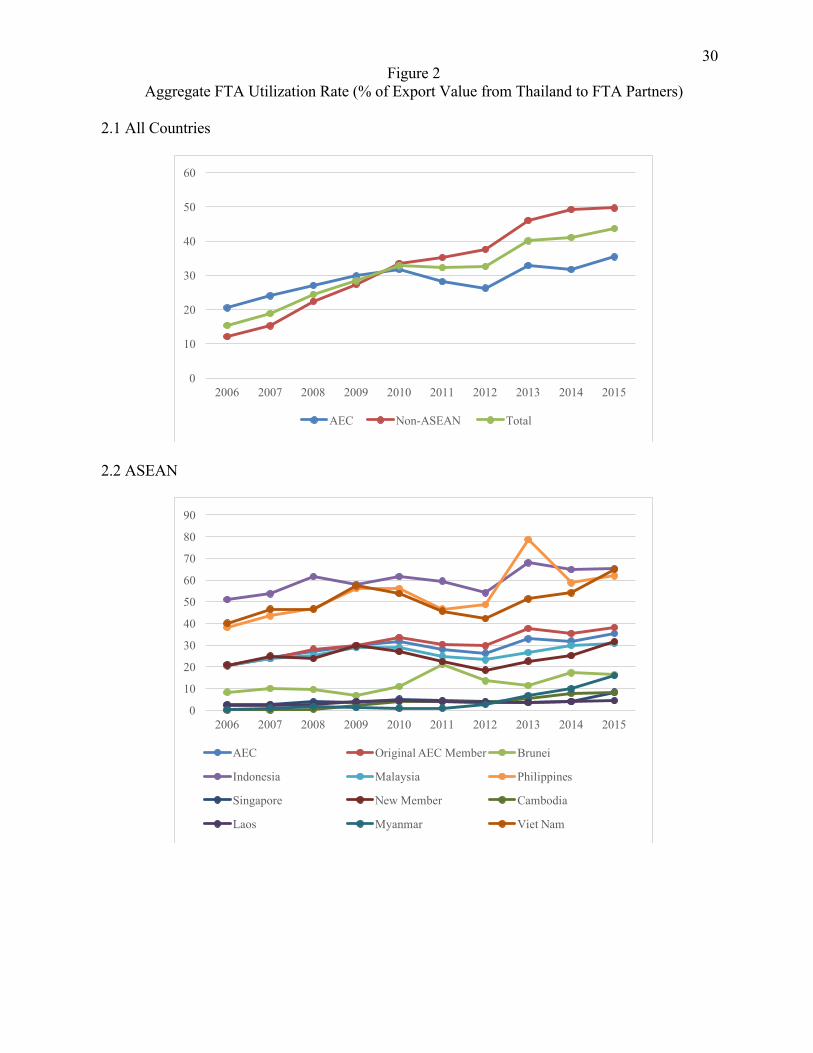
Figure 2 presents an overall assessment of how firms utilized FTA preferential
schemes between 2006 and 2015. When all partners are combined, the utilization rate11
was rather low, averaging out at 32.6 per cent from 2006 to 2012 (Figure 2.1). In other
words, about one-third of total export value to FTA partners applied for FTA preferential
schemes. It increased from 15.4 per cent in 2006 to around 43.7 and 32.6 per cent in 2014
and 2015, respectively. It is presently too early to make inferences concerning the drop in
the 2015 utilization rate, but this development should be noted for further investigation in
the future.
10 See, for example, the EU-Thailand FTA press release, usually referring to total
trade between two partners worth of 32 billion EURO, available at http://europa.eu/rapid/press-release_MEMO-13-179_en.htm.
11 The terminology used here is in line with Plummer et al (2010) in which the measures concerning how much FTAs are used by firms are classified into three categories. They are utilization rate, utility rate and usage rate. Utilization rate is referred to as the ratio of dutiable imports that use FTA preferences to total imports. When the denominator is changed to dutiable imports (MFN greater than zero), it is referred to as utility rate. Usage rate is the ratio of dutiable imports that use FTA preferences to dutiable imports with MFN tariff rate greater than FTA rate.

11
Utilization rates seem to vary across FTA partners. Among ASEAN members,
Indonesia had the highest utilization rate. From 2006 to 2015, it stood in the range between
50.9 and 67.9 per cent (Figure 2.2). The Philippines and Vietnam constitute first and
second runners-up in applying for AEC preferential schemes. The average of their
utilization rates during the period of 2006-2015 were 55.2 and 46.6 per cent, respectively.
There is no clear pattern observed among these ASEAN top-three nations in FTA
utilization over the period considered. Malaysia, another major economy in ASEAN,
recorded rather low utilization rates at around 24.3 per cent between 2006 and 2015. The
low utilization rate found in Singapore was not surprising given the fact that the country is
tariff-free. Turning to Cambodia, Laos and Myanmar utilization rates registered at less
than ten per cent, on average, between 2006 and 2015. This would be due to their gradual
adjustment to tariff reduction.
When non-ASEAN partners are concerned, utilization rates were slightly lower.
The average figure during the period of 2006-2015 was 35 per cent, with an accompanying
increasing trend being observed (Figure 2.3). Utilization rates were highest in the case of
Australia, fluctuating between 51.9 and 81.2 per cent. This suggests the presence of tariff
peak items in developed countries like Australia. These items were actually liberalized
under FTAs. For other non-ASEAN FTA partners, utilization rates exhibited a
continuously upward trend. This is especially true for China and India.
4. Determinants of FTA Utilization
So far the main finding from the analyses above is that FTAs are beneficial to a
narrow range of products. This occurs even in developed country partners whose MFN
tariff average is already low. Therefore, there is likely to be certain product- and industry-
specific factors that play an influential role in firms’ decision-making in applying
preferential schemes. To gain a better understanding, econometric analysis of FTA
determinants at the disaggregated product levels is undertaken.
4.1 Empirical Model

12
There is no fully developed theory examining the determinants of inter-product
FTA utilization. We, therefore, have developed our empirical model employing an eclectic
approach, informed by relevant theories and empirical regularities in previous studies. In
the empirical model, the FTA utilization rate of product i to country j ( ),ij tFTAU at time t
is used as a dependent variable in the analysis. It is calculated at the four digit HS
disaggregation level. See in Section 4.3 of discussion concerning the choice of
disaggregation level.
The first explanatory variable is tariff margins, measured by the difference between
general (most-favored-nations) and preferential tariffs, ( ), ,FTA
ij t ij tt t- (referred to direct
measure, henceforth). While the tariff margin is measured as a percentage of its
corresponding MFN tariff rates in some studies, its main shortcoming is the effect of a
tariff margin on a firms’ decision tends to be negligible at the high MFN tariff rate level.
This seems to be counter-intuitive. In fact, it would not matter what the combination of
tariff margin. 12 What really matters is how much tariff margin itself, indicating the benefit
firms could get from preferential schemes. Hence, our preferred choice here is the direct
measure. A positive relationship between tariff margin and FTA utilization is expected.
The second explanatory variable concerns the local content of products, as a proxy
of the ability to comply with rules of origin (ROO) in a FTA. In absence of a direct measure
of the ability to comply with any form of ROO, the local content could be employed. With
respect to goods, where firms intensively procure raw materials and intermediates locally,
final products tend to be categorized in different HS classifications at the disaggregate level
(e.g. subheadings). In this study, local content is measured by the backward linkages index
of product i at time t ( ),i tBLI based on the Leontief inter-industry accounting framework.
It indicates the total units of output required, directly and indirectly, from all sectors
(including the unit of output delivered in response to final demand by the given sector)
when the demand for product ith rises by one unit. In general, we expect that the higher
12 For a given tariff margin at 5 per cent, it could come from several combination
between MFN and preferential tariff rates, e.g. (5,0), (10,5), (20,15), etc., respectively.

13
the ,i tBLI , the greater the ability a product ith possesses in complying with ROOs. Thus, a
positive sign of coefficient corresponding to ,i tBLI is expected.
However, the relationship between ,i tBLI and ,ij tFTAU might be non-linear. That
is, when the local content of a product surpasses a certain level, the role of ,i tBLI in
deciding to use FTAs becomes less important. To address a possible non-linear
relationship, a squared term of BLI is introduced in the empirical model.
The third explanatory variable encapsulates the historical export records of the
actual exports of product i exporting to country j at time t ( ),ij tHEX . It is added to examine
whether or not FTAs could open up new export opportunities for products that have
heretofore not been traded. A statistical significance of the corresponding coefficient
would suggest that products that have not been exported (i.e. where the historical export
value is equal to zero) are less likely to apply for a FTA preferential scheme. Hence, the
expected sign of the corresponding coefficient between ,ij tHEX and ,ij tFTAU could be
either positive or zero. In this study, a historical export record is measured by the average
of the past three years export values.
The extent to which foreign firms; and multinational enterprise affiliates in
particular, participate in a given industry forms the fourth explanatory variable in the
model. It is likely that foreign firms behave differently from local enterprises in a number
of aspects, including applying for FTA tariff concessions. Foreign firms tend to be larger
in size, so that it is more likely that they will absorb administrative costs as opposed to
local firms. Thus, a positive relationship between foreign presence and utilization rates is
expected. Nevertheless, as argued in the multinational enterprise and product
fragmentation literature (e.g. Jones, 2000; Jones & Kierzkowski, 2001), efficiency-seeking
FDI has become increasingly important in East Asia over the past two decades. More
importantly, these multinational enterprises (MNEs) tend to be located in export processing
zones in order to receive input tariff exemption. Therefore, foreign firms might not be
attracted to FTA tariff concessions. The relationship between foreign presence and FTA
utilization could be negative. Hence, the relationship between foreign presence ( ),i tFOR

14
and ,ij tFTAU is ambiguous. Foreign presence ( ,j tFOR ) is measured by the proportion of
the output share of foreign firms to that of the industry as a whole.
The final explanatory variable is represented by the share of the parts and
components trade in the total trade of the industry i at time t ( ),i tPC . This is due to examine
whether products traded under global production sharing utilize the offered FTA tariff
preferences. This is highly policy relevant for East Asian economies where global
production sharing, the breakup of production processes into geographically separated
stages, is far more important in East Asia than elsewhere (Athukorala & Kohpaiboon,
2015). One consequence of the increasing importance of global production sharing is the
rapid expansion of P&C trade across countries. As the whole when the production process
is broken up and located in several locations, the domestic content tends to be lower than
the final goods trade. This would make it more difficult for P&Cs to comply with the rules
of origin. Hence, a negative coefficient is expected for ,i tPC
All in all, the empirical model of the determinants of FTAU is as follows;
( )2, , , , , , , ,, , , , ,FTAij t ij t ij t i t i t i t ij t i tFTAU f t t BLI BLI FOR HEX PC= - (1)
where ,i tFTAU = FTA utilization (the ratio between the official record of
FTA implementation and actual exports) in industry ith at time t
FTAi it t- (+) = the margin between general and preferential tariff rates in
industry ith
,i tBLI (+) = the degree of backward linkage index of industry ith as a
proxy of the ability of products to comply with ROOs 2,i tBLI (-) = the squared term of ,i tBLI
,i tFOR (+/-) = the degree of foreign presence in industry ith at time t
proxied by the employment share of foreign firms
,ij tHEX (+) = the historical export value averaged the past three years
of product i to country j at time t
,i tPC (-) = the ratio of the parts and component trade in total trade of
product i at time t
(The theoretical expected signs are in parentheses)

15
4.2 Data Cleaning
To measure FTA utilization, preferential exports must be matched with their
corresponding actual exports. This is done at the disaggregate level. Nonetheless, there
are two main problems in the matching process. The first problem is that there are c/o
records whose HS codes do not match with the official HS codes due to human error (i.e.
code mismatching). 13 Perhaps the errors revealed reflect the difficulty firms face in
identifying their HS codes in applying c/os. Nevertheless, the number of records
experiencing HS code mismatching is rather small and their corresponding value is
negligible.14 Such items are consequently dropped from our analysis.
The second problem concerns another form of mismatching found in the data set.
It occurs when the value of c/o records exceeds their corresponding actual export value
(i.e. value mismatching). In theory, c/o records should not exceed their corresponding
actual exports because firms are allowed to apply c/o in advance (i.e. 3 months in most) to
gain flexibility in expediting business initiatives. As a result, they might overestimate their
true demand for c/o and c/o records could slightly exceed their corresponding actual
exports in practice. In addition, this might be as a result of errors in the data collection
process.
The problems which take place occupy two extremes. One extreme is that there
are non-zero c/o records which are associated with zero actual export value. The numbers
of records falling in this extreme were relatively small.15 Hence, records in this extreme
were dropped from our analysis. In another extreme, there are c/o records whose values far
exceed their actual export value. While such an extreme should be dropped, it is difficult
in practice as there is no clear cut criterion to justify when such a measure should be
13 For example, the administrative records reported export values of HS 200890,
321010 and 350210 from Thailand to Indonesia in the 2003 records. Such items do not have corresponding actual export data. 14 For example, in 2015, there were 61 error records in the case of Australia, accounting for three per cent of total product lines applying for the preferential scheme (TAFTA). Their total value was about $0.3 million. Other major FTA partners experienced more or less the same situation.
15 For example, in 2015, there are 34 records, with a total value of $13.7 million. They accounted for around 0.2 per cent of total preferential exports.

16
regarded as an extreme. Hence, sensitivity analysis is undertaken. We found that 30 per
cent as a cutting point is chosen in order to preserve the integrity of observations in our
analysis. Interestingly, two types of mismatching dropped significantly when the data is
aggregated into a four digit classification. To maximize the number of records, the original
records are aggregated at the four digit level.16
4.3 Sample Coverage and Variable Measurements
While there are 17 individual FTA partners in total, only eight major partners were
covered in the analysis as tariff cuts under corresponding FTAs covered more than 80 per
cent for the period before 2010. They include Australia (2006), Indonesia (2006), Malaysia
(2006), Philippines (2006), Vietnam (2006), Japan (2007), China (2010) and Korea (2010).
These preferential schemes have long been available. Hence a comparison of these
observations decently reflects firms’ decisions in applying preferential schemes, instead of
reasons beyond this consideration, such as differences in the scope, scale, and progress in
FTA negotiations. Note that for a country when there is more than one FTA preferential
schemes available, the scheme firms used intensively is selected in our econometric
analysis. That is, data on TAFTA and JTEPA are used for Australia and Japan,
respectively. Other ASEAN members (i.e. Brunei, Cambodia, Laos and Singapore) are
excluded mainly because of the negligible value of their preferential exports. New Zealand
is excluded due to the absence of data as a result of the adoption of a paperless system. In
cases of India, Chile and Peru, their tariff cuts began with items which are of high potential
to be traded under FTA preferential schemes, so including them in the sample could result
in an upward bias on the effect of tariff margins on firms’ decision making.
Our econometric analysis focuses on manufacturing products defined as HS25-97
which account for around 75% of exports from Thailand to Australia, Indonesia, Japan,
Malaysia, the Philippines and Vietnam. Agricultural products are excluded because many
of these products are subject to specific tariffs. Converting them into ad valorem
equivalence would be problematic. Besides, these products are less likely to be affected
16 Full detail is availabe upon the requests of the authors.
17
by any forms of ROO as they are usually obtained wholly from an exporting country. This
represents a notably different scenario from that facing manufacturing products.
As mentioned earlier, preferential export values that were originally at a six digit
HS classification were aggregated to four digit HS marks. The corresponding tariff margin
comprises the weighted average within a four digit HS, using the actual export value as the
weight. Backward linkage index ( ),i tBLI is constructed for two years according to the
availability of Thailand’s input-output tables, 2005 and 2010. Hence, ,2005iBLI is used for
data between 2006 and 2009, whereas ,2010iBLI is used for data from 2010 onwards. Data
of ,i tFOR is obtained from two industrial censuses of Thai manufacturing (2006 and 2012).
The 2006 census is used for observations from 2006 to 2011, while 2012 data is used for
2012 onwards. ,i tFOR are originally classified according to the International Standard of
Industrial Classification (ISIC), so that the standard concordance between HS and ISIC
classification is used. Finally ,ij tHEX representss the annual export value over the past
three years at the four digit HS level. To construct ,i tPC ,we use the list of parts and
components developed in Athukorala & Kohpaiboon (2009), which is much more
comprehensive than those listed under Sections 42 and 53 in the Board Economics
Classification (BEC).17 Originally, the original list at the six-digit HS classification is
aggregated to four-digit. Table 2 provides a summary of the variables used in the
econometric analysis (Panel A) and the matrix of correlation coefficients.
5. Results 5.1 Baseline Estimation
Initially, all samples are pooled and estimated using ordinary least squares (OLS).
The country-specific, zero-one binary dummy is also introduced in the pooled cross-
sectional analysis. Specifically, zero-one binary dummy variables for Indonesia, Malaysia,
17 In fact, the list of parts and components developed in Athukorala &
Kohpaiboon (2009) use those listed in the BEC as a point of departure. Additional lists of parts are included based on interviews with representatives of particular firms cited in Kohpaiboon (2009).

18
the Philippines, Vietnam, Japan, China and Korea are introduced to capture any country-
specific factors. Australia is selected as the control group. Since the dependent variable,
,ij tFTAU , is censored, i.e. we do not observe values of ,ij tFTAU less than zero (the left
censoring) and greater than 100 per cent (the right censoring), OLS estimation would be
biased and inconsistent. Hence, a random-effect Tobit (weighted maximum likelihood)
estimator is used to obtain unbiased, consistent and efficient estimates. In order to provide
a robustness check of the estimation results, the corresponding fixed- and random-effect
estimators are also reported.
Table 3 presents the estimation results, namely pooled OLS, random-effect, and
fixed-effect, and random-effect Tobit estimations. All equations pass the overall statistical
significance benchmark at the one per cent level. Clearly, the estimation results are
insensitive to choices of estimation methods. Nevertheless, because of the nature of
censored dependent variables, the following discussion is based on random-effect Tobit
model estimation (Column 3.4). All coefficients are statistically significant at the five per
cent level or better with theoretical expected signs. The coefficient corresponding to
, ,FTA
ij t ij tt t- is significant at the one per cent level, implying that the tariff margin does matter
for the private sector in deciding whether or not to apply for FTA tariff concessions. It also
implies that applying for such tariff concessions is costly to a certain extent. Otherwise, a
positive relationship would not be revealed.
Both coefficients corresponding to ,i tBLI and 2,i tBLI are statistically different from
zero at the one per cent level with the theoreticall expected signs. Firms with products
which have high local content are likely to apply for a FTA preferential scheme. When
,i tBLI surpasses certain levels, its effect on ,ij tFTAU is diminishing. The observed statistical
significance of ,ij tHEX is that it is less likely for FTAs to open up new export opportunities
for products that are either yet to be traded or are of potentially low sales volume. This
highlights the potential role of FTAs in facilitating, instead of creating, trade. While tariff
margins could influence firms’ decisions to use, their influence is constrained by prevailing
economic fundamentals in both countries influencing trade.
The coefficient corresponding to ,i tPC is revealed to be negative, but statistically
insignificant, except in the case of fixed-effect estimates. Cetaris paribus, any decisions
19
to apply FTA preferential schemes are not statistically different between products traded
under MNE production networks and other manufacturing products. As long as there are
adequate tariff margins to cover the costs incurred by ROOs and economic fundamentals
are supportive, these products can be traded through preferential schemes like FTAs.
It seems that products with intensive foreign firm involvement are more likely to
apply for FTA preferential schemes. The coefficient corresponding to ,i tFOR is positive
and different from zero at the one per cent level of significance. This reflects the long
experience of multinationals in dealing with various government agencies in operating their
affiliates in Thailand. They become familiar with the system as opposed to indigenous and
relatively smaller firms. This issue becomes even more sensitive about revealing any
information related to cost structure.
Table 4 illustrates the Tobit regression by individual countries as a robustness check
to the multi-country regression outlined above. Clearly, estimates by individual countries
provide more or less the same inferences regarding FTA determinants. , ,FTA
ij t ij tt t- , ,i tBLI ,
2,i tBLI , and ,ij tHEX are the key factors driving firms’ decisions to apply for FTA
preferential schemes.
An interesting pattern emerging from Table 4 concerns the magnitude of the
estimated coefficient corresponding to , ,FTA
ij t ij tt t- , varying greatly across FTA partners.
Generally, the estimated coefficient of developed country-FTA partners is either lower than
that of developing countries (Australia) or statistically insignificant (Japan and Korea).
The coefficient for the major ASEAN FTA partners of Thailand ranges from 0.8 to 1.4.
The coefficient in the case of China was 0.825 per cent. Interestingly, the coefficient in
the Vietnamese case was 0.26.
The difference in estimated coefficients could be largely due to differences in
products applying for preferential export status and those in tariff margins offered. The
magnitude of coefficient would indicate dollar costs complying with rules of origin,
including administrative costs from importing countries in principle. The larger the
coefficient, the more difficulties the firm will face in obtaining c/os. This is further
examined in the following sub-section.
20
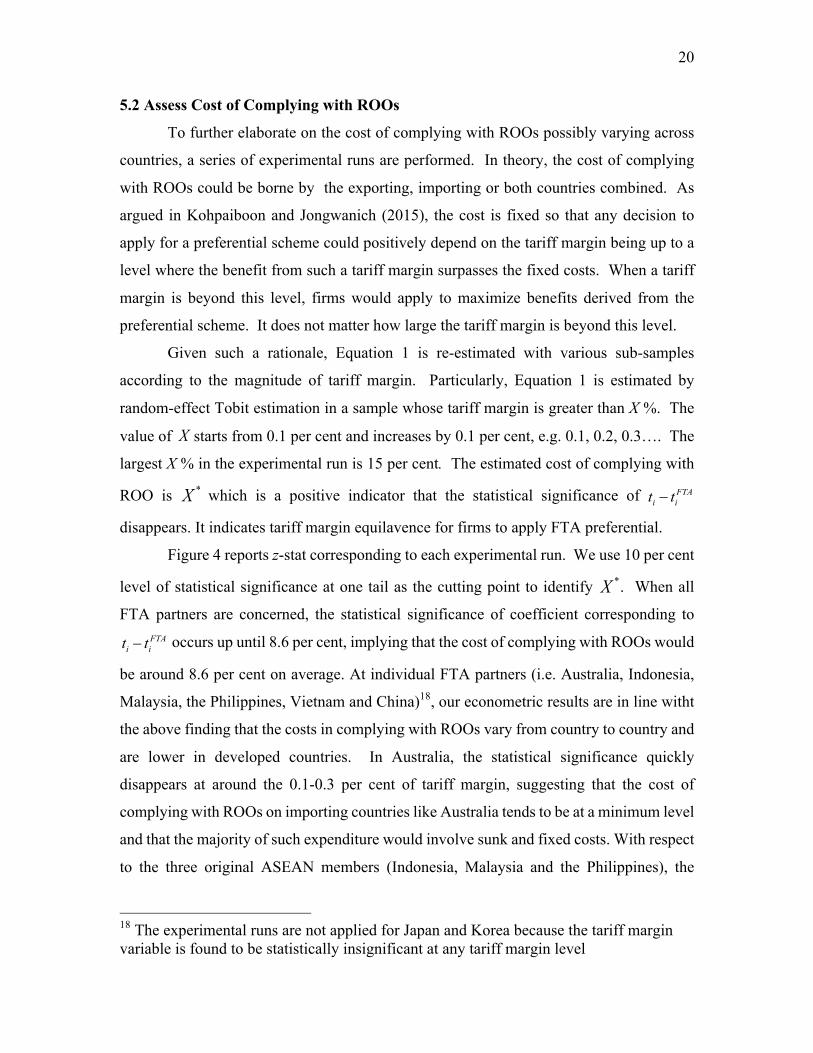
5.2 Assess Cost of Complying with ROOs
To further elaborate on the cost of complying with ROOs possibly varying across
countries, a series of experimental runs are performed. In theory, the cost of complying
with ROOs could be borne by the exporting, importing or both countries combined. As
argued in Kohpaiboon and Jongwanich (2015), the cost is fixed so that any decision to
apply for a preferential scheme could positively depend on the tariff margin being up to a
level where the benefit from such a tariff margin surpasses the fixed costs. When a tariff
margin is beyond this level, firms would apply to maximize benefits derived from the
preferential scheme. It does not matter how large the tariff margin is beyond this level.
Given such a rationale, Equation 1 is re-estimated with various sub-samples
according to the magnitude of tariff margin. Particularly, Equation 1 is estimated by
random-effect Tobit estimation in a sample whose tariff margin is greater than X %. The
value of X starts from 0.1 per cent and increases by 0.1 per cent, e.g. 0.1, 0.2, 0.3…. The
largest X % in the experimental run is 15 per cent. The estimated cost of complying with
ROO is *X which is a positive indicator that the statistical significance of FTAi it t-
disappears. It indicates tariff margin equilavence for firms to apply FTA preferential.
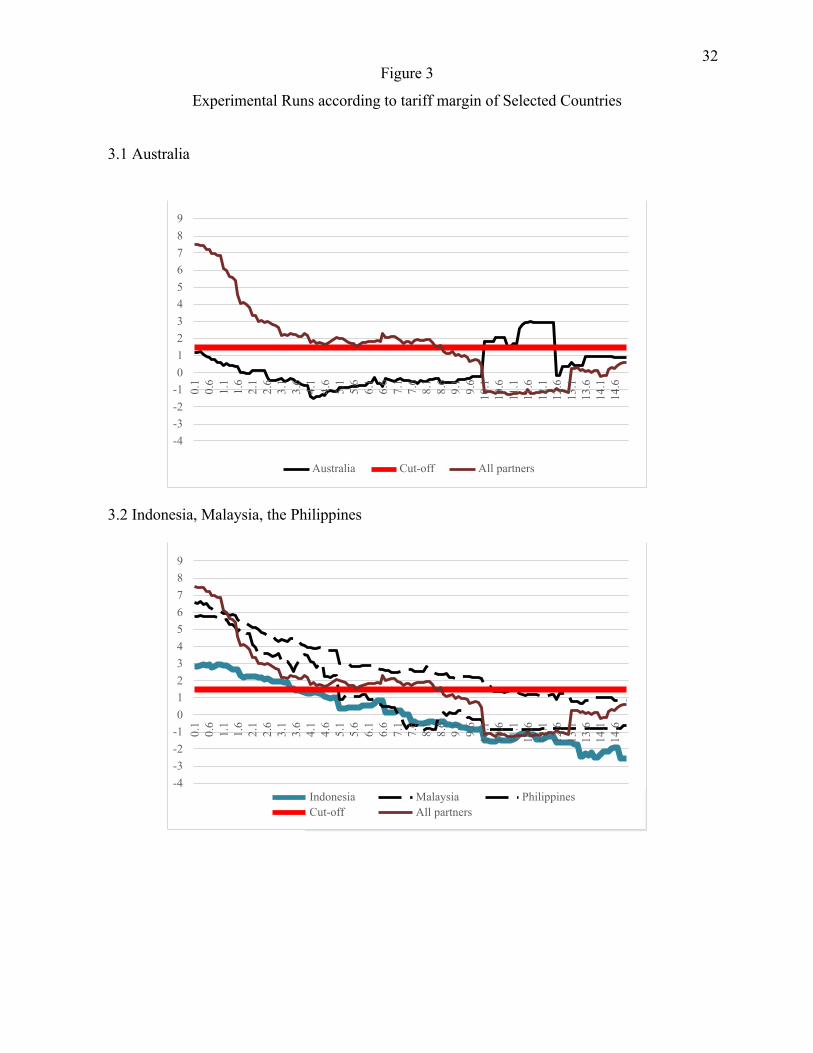
Figure 4 reports z-stat corresponding to each experimental run. We use 10 per cent
level of statistical significance at one tail as the cutting point to identify *X . When all
FTA partners are concerned, the statistical significance of coefficient corresponding to FTA
i it t- occurs up until 8.6 per cent, implying that the cost of complying with ROOs would
be around 8.6 per cent on average. At individual FTA partners (i.e. Australia, Indonesia,
Malaysia, the Philippines, Vietnam and China)18, our econometric results are in line witht
the above finding that the costs in complying with ROOs vary from country to country and
are lower in developed countries. In Australia, the statistical significance quickly
disappears at around the 0.1-0.3 per cent of tariff margin, suggesting that the cost of
complying with ROOs on importing countries like Australia tends to be at a minimum level
and that the majority of such expenditure would involve sunk and fixed costs. With respect
to the three original ASEAN members (Indonesia, Malaysia and the Philippines), the
18 The experimental runs are not applied for Japan and Korea because the tariff margin variable is found to be statistically insignificant at any tariff margin level
21
results vary noticeably. The coefficient associated with the tariff margin variable turns out
to be statistically insignificant when X exceeds 3.6, 5.1 and 10.3 per cent, respectively, in
the cases of Indonesia, the Philippines and Malaysia. The corresponding per cent of
Vietnam and China are 12.6 and 14.1 per cent, respectively.
Note that the low tariff margin equivalence in the case of Indonesia must be
interpreted with caution. It must be considered together with the fact that Indonesia is the
only country whose preferential exports have declined since 2013. This went hand-in-hand
with actual exports, so that utilization rates have remained more or less constant over the
past few years. This is especially true for vehicles which dropped noticeably in the past
few years. Hence, the result would reflect some element of self-selection where products
that are less likely to be adversely affected by the growing protectionist sentiments are
traded under preferential schemes with moderate costs incurred by the presence of ROOs.
For those under heavily protectionist constraints, costs are likely to be high and not
attractive for firms to apply for.
Besides, the considerable difference between Malaysia and the other two original
ASEAN members is likely to reflect costs incurred at the border of importing countries.
This seems to be sensible when viewed in light of the fact that preferential exports from
Thailand to Malaysia are dominated by vehicles which were long subject to heavy cross-
border protection until recent years.
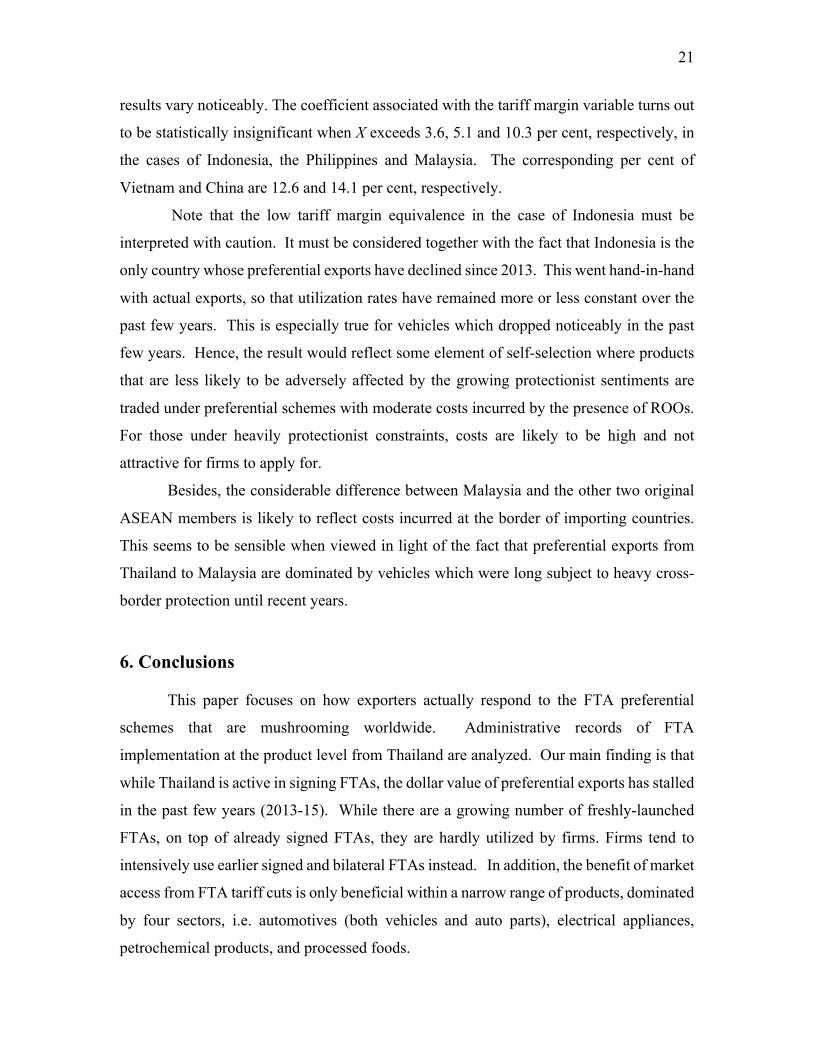
6. Conclusions
This paper focuses on how exporters actually respond to the FTA preferential
schemes that are mushrooming worldwide. Administrative records of FTA
implementation at the product level from Thailand are analyzed. Our main finding is that
while Thailand is active in signing FTAs, the dollar value of preferential exports has stalled
in the past few years (2013-15). While there are a growing number of freshly-launched
FTAs, on top of already signed FTAs, they are hardly utilized by firms. Firms tend to
intensively use earlier signed and bilateral FTAs instead. In addition, the benefit of market
access from FTA tariff cuts is only beneficial within a narrow range of products, dominated
by four sectors, i.e. automotives (both vehicles and auto parts), electrical appliances,
petrochemical products, and processed foods.
22
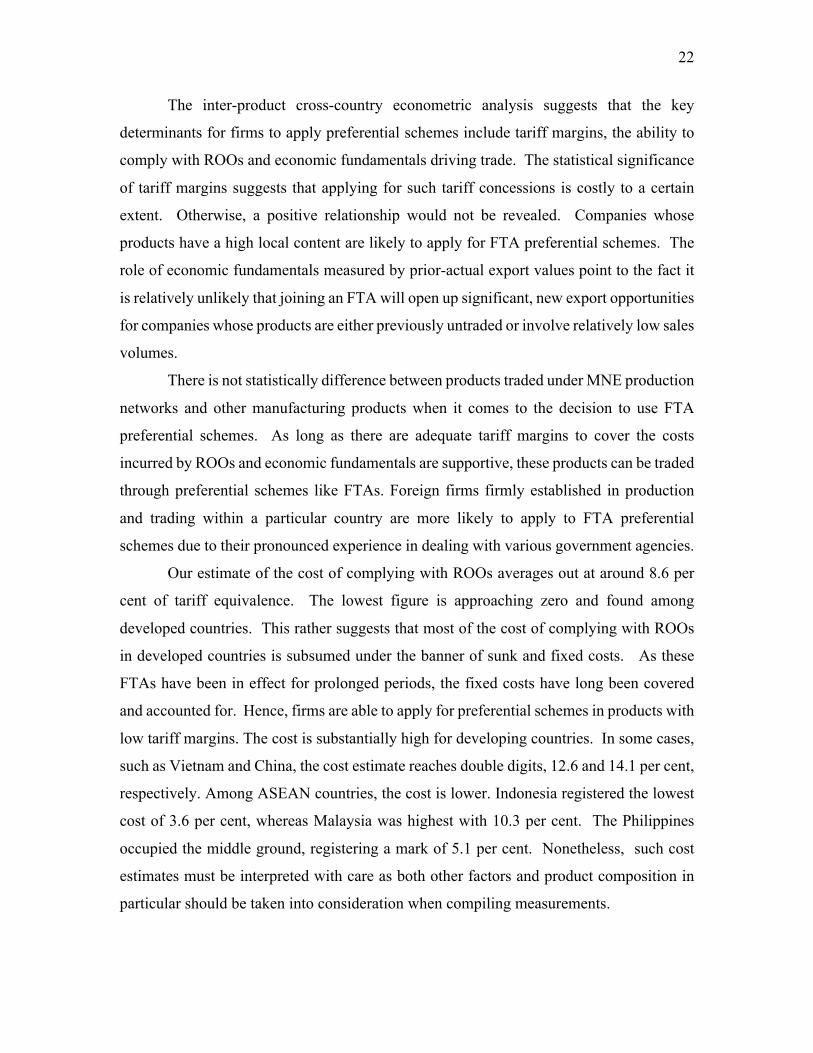
The inter-product cross-country econometric analysis suggests that the key
determinants for firms to apply preferential schemes include tariff margins, the ability to
comply with ROOs and economic fundamentals driving trade. The statistical significance
of tariff margins suggests that applying for such tariff concessions is costly to a certain
extent. Otherwise, a positive relationship would not be revealed. Companies whose
products have a high local content are likely to apply for FTA preferential schemes. The
role of economic fundamentals measured by prior-actual export values point to the fact it
is relatively unlikely that joining an FTA will open up significant, new export opportunities
for companies whose products are either previously untraded or involve relatively low sales
volumes.
There is not statistically difference between products traded under MNE production
networks and other manufacturing products when it comes to the decision to use FTA
preferential schemes. As long as there are adequate tariff margins to cover the costs
incurred by ROOs and economic fundamentals are supportive, these products can be traded
through preferential schemes like FTAs. Foreign firms firmly established in production
and trading within a particular country are more likely to apply to FTA preferential
schemes due to their pronounced experience in dealing with various government agencies.
Our estimate of the cost of complying with ROOs averages out at around 8.6 per
cent of tariff equivalence. The lowest figure is approaching zero and found among
developed countries. This rather suggests that most of the cost of complying with ROOs
in developed countries is subsumed under the banner of sunk and fixed costs. As these
FTAs have been in effect for prolonged periods, the fixed costs have long been covered
and accounted for. Hence, firms are able to apply for preferential schemes in products with
low tariff margins. The cost is substantially high for developing countries. In some cases,
such as Vietnam and China, the cost estimate reaches double digits, 12.6 and 14.1 per cent,
respectively. Among ASEAN countries, the cost is lower. Indonesia registered the lowest
cost of 3.6 per cent, whereas Malaysia was highest with 10.3 per cent. The Philippines
occupied the middle ground, registering a mark of 5.1 per cent. Nonetheless, such cost
estimates must be interpreted with care as both other factors and product composition in
particular should be taken into consideration when compiling measurements.

23
Three policy inferences can be drawn from this paper. Firstly, the export enhancing
effect of FTAs is passive at best, working only after all economic fundamentals are
established and sound. Promoting exports by maximizing the number of FTAs, while
ignoring the nature of FTA partners, is unlikely to be successful. Secondly, while there
has been a concerted recent effort to launch new FTAs with an enlarged membership
compared to existing agreements in order to facilitate ongoing regional supply chains, the
evidence from Thailand suggests that this initiative has been unsuccessful to this point.
Again, in managing supply chains stakeholders must take into consideration a range of
factors far beyond presence of tariff margins. Thirdly, for those who have less faith in the
prospects of first-best, world-wide liberalization through World Trade Organization
negotiations and the advocacy of FTAs as a mode for further liberalization, policy
emphasis to harness the trade-induced effects of signed FTAs should be placed on reducing
the costs incurred from the presence of ROOs. Lowering such costs needs the cooperation
of both exporting and importing countries. There is room for inter-government cooperation
to mitigate any cumbersome obstacles preventing firms from making use of available
FTAs.

24
Table 1
Analysis of Product Concentration under FTA Preferential Schemes.
Number of Product Lines Applying for FTA Preferential
Schemes
Per cent to Number of Product Lines Actually Traded
Top-10 Cummulative
Share (%) 2006 2012 2015 2006 2012 2015 2006 2012 2015 Australia 975 1173 1085 42.2 42.8 42.4 72 61 77 Brunei 90 165 160 10.8 17.9 16.6 77 73 64 Cambodia 25 186 356 1.4 8.2 14.3 88 77 70 Chile 56 n.a. n.a. 6.6 91 China 269 1076 1270 11.0 34.8 42.6 86 65 55 India 41 659 890 2.0 25.0 34.2 96 60 47 Indonesia 840 1140 1330 40.2 43.4 50.8 56 53 49 Japan 719* 1151 1197 22.6* 32.9 35.5 55* 53 47 Korea 864 998 n.a. 36.6 43.7 n.a. 51 34 Laos 90 256 303 3.7 9.4 10.1 81 71 59 Malaysia 1254 1288 1321 45.7 40.3 42.9 48 46 46 Myanmar 35 116 345 1.6 4.2 11.7 94 81 73 New Zealand 179 245 n.a. 10.5 14.4 n.a. 53 67 Peru 20 40 n.a. 3.7 6.2 n.a. 99 94 Philippines 841 991 1026 42.3 42.0 43.6 62 51 63 Singapore 404 470 492 14.2 13.9 15.3 62 64 74 Vietnam 1264 1356 1522 50.8 44.0 49.9 39 34 44
Note: * indicates figure of 2007. Source: Authors’ calculations, using preferential exports from Bureau of Preferential Trade, Ministry of Commerce.

25
Table 2 Variables Description
Panel A: Data Summary Variable Obs Mean Std. Min Max Nature
, ,FTA
ij t ij tt t- 38,140 0.1 0.1 0.0 1.5 Varying across tariff cut
commitment ,ij tPC 38,552 0.1 0.2 0.0 0.7 2006-2015 ,i tFOR 38,450 0.2 0.1 0.0 0.6 2005,2011 ,ij tHEX 38,222 13.1 2.9 -1.1 22.1 2003-15; ,ij tFTAU 38,552 0.3 0.3 0.0 0.8 2006-15
,i tBL 38,450 1.1 0.2 0.4 1.8 2005, 2010
Panel B: Correlation Coefficient Matrix ,ij tFTAU ,i tFOR ,i tBLI ,ij tHEX
, ,FTA
ij t ij tt t- ,ij tPC
,ij tFTAU 1 ,i tFOR -0.0627 1 ,i tBLI -0.1093 0.4593 1 ,ij tHEX 0.2601 0.1512 0.1641 1
, ,FTA
ij t ij tt t- 0.1384 -0.0845 -0.0153 -0.0097 1 ,ij tPC -0.0721 0.2198 0.3442 0.0891 -0.0561 1
Source: Authors’ calculation.

26
Coefficient t-stat Coefficient t-stat Coefficient t-stat Coefficient z-stat -0.25*** (-6.37) -0.75*** (-4.30) -0.53*** (-5.81) -0.55***
0.60*** (14.5) 0.33*** (5.39) 0.35*** (5.77) 0.35*** (19.1)
0.47*** (7.44) 0.84*** (2.95) 0.81*** (5.47) 0.82*** (6.10)
-0.29*** (-11.4) -0.22* (-1.93) -0.36*** (-6.09) -0.36*** (-6.38)
0.03*** (65.7) 0.03*** (18.3) 0.03** (21.2) 0.03*** (43.2)
-0.02 (-1.39) 0.13*** (4.11) 0.08*** (3.17) 0.09*** (4.60)
-0.05*** -0.03***
(-7.73) (-5.78)
0.03**
-0.02**
(2.20) (-2.48)
-0.01
-0.03**
(-0.51) (-2.53)
-0.004 - 0.03***
(-0.32)
(-5.65) -0.14*** (-30.3) -0.13*** (-12.7) -0.13*** (-13.1) -0.13*** (-29.3) -0.06*** (-11.4) -0.06*** (-6.16) -0.06*** (-6.08) -0.06*** (-14.1) -0.13*** (-21.1) -0.09*** (-8.16) -0.10*** (-8.56) -0.10*** (-20.7) -0.12*** (-21.2) -0.12*** (-8.80) -0.12*** (-8.86) -0.12*** (-23.5) -0.08*** (-13.1) -0.08*** (-6.06) -0.07*** (-5.65) -0.08*** (-13.4) 0.03*** (5.18) 0.02 (1.45) 0.03** (2.09) 0.03*** (4.49) 37739 37739 37739 37739 0.157 0.078 0.131 506.6 51.70
3338.68 3294.3
BLI
Table 3
Inter-product Panel-data Econometric Analysis
3.1 Pooled-Cross-sectional 3.2 Fixed-effect 3.3 Random-effect 3.4 Tobit-random-effect
INTERCEPT
FTA ij,t ij,t
BLIi ,t
2 i,t
HEX ij ,t FORi,t
PCi ,t
IND MAL PHI VIE JAP CHI KOR N R-sq F
Wald- c 2
Note: *, **, and *** indicate 10%, 5% and 1% level of statistical significant Source: Authors’ Estimation.

27
Table 4: Inter-product Panel-data Econometric Analysis of Individual Countries
Australia Indonesia Malaysia the Philippines
Coefficient t-stat Coefficient t-stat Coefficient t-stat Coefficient z-stat INTERCEPT -0.85*** (-5.23) -0.76*** (-4.96) -0.37*** (-3.02) 0.16 (1.05) t - t FTA ij,t ij,t 0.63*** (4.11) 0.80*** (5.64) 1.09*** (13.76) 1.40*** (5.91) BLIi,t 1.3*** (4.80) 1.09*** (4.31) 0.63*** (3.18) -0.37 (-1.47) BLI 2
i,t -0.59*** (-5.18) -0.47*** (-4.50) -0.26*** (-3.20) 0.12 (1.17) HEX ij ,t 0.03*** (17.1) 0.03*** (16.1) 0.01*** (5.51) 0.02*** (12.8) FORi,t 0.01 (0.48) 0.16*** (4.05) 0.003 (0.09) 0.06* (1.76) PCi ,t 0.02 (0.86) -0.03 (-1.17) -0.02 (-1.01) -0.08*** (-3.85) N 5063 5619 5988 5292 Wald- c 2 352.02 367.75 246.4 227.7
Vietnam Japan China Korea
Coefficient t-stat Coefficient t-stat Coefficient t-stat Coefficient z-stat INTERCEPT -0.57*** (-4.19) -1.41*** (-6.45) -0.49** (-2.03) -0.06 (-0.24) t - t FTA ij,t ij,t 0.26*** (7.40) 0.09 (0.51) 0.83*** (5.95) -0.07 (-0.53) BLIi,t 0.80*** (3.54) 2.42** (6.46) 0.89** (2.23) 0.39 (0.90) BLI 2
i,t -0.35*** (-3.70) -1.04*** (-6.40) -0.54*** (-3.21) -0.32* (-1.71) HEX ij ,t 0.02*** (12.62) 0.02*** (7.62) 0.03*** (11.3) 0.03*** (9.69) FORi,t 0.16*** (4.27) 0.19*** (4.19) 0.16*** (2.99) 0.18*** (2.74) PCi ,t 0.01 (0.66) -0.01 (-0.42) -0.01 (-0.27) -0.03 (-0.46) N 6118 4164 3015 2480 Wald- c 2 267.1 127 209.1 124.6
Note: *, **, and *** indicate 10%, 5% and 1% level of statistical significant
Source: Authors’ Estimation.

28
Figure 1 Preferential Export Value (Billion USD)
1.1 All Countries
1.2 ASEAN members
0
20
40
60
80
100
120
2006 2007 2008 2009 2010 2011 2012 2013 2014 2015
ASEAN Non-ASEAN Total
0
5
10
15
20
25
2006 2007 2008 2009 2010 2011 2012 2013 2014 2015
ASEAN Original AEC Member Indonesia
Malaysia Philippines

29
1.3 Non-ASEAN Countries
Sources: Authors’ calculation from official data sources: preferential exports from Bureau of Preferential Trade, Ministry of Commerce
0
5
10
15
20
25
30
35
Non-ASEAN Australia China Japan
30
Figure 2 Aggregate FTA Utilization Rate (% of Export Value from Thailand to FTA Partners)
2.1 All Countries
2.2 ASEAN
0
10
20
30
40
50
60
2006 2007 2008 2009 2010 2011 2012 2013 2014 2015
AEC Non-ASEAN Total
0
10
20
30
40
50
60
70
80
90
2006 2007 2008 2009 2010 2011 2012 2013 2014 2015
AEC Original AEC Member Brunei
Indonesia Malaysia Philippines
Singapore New Member Cambodia
Laos Myanmar Viet Nam

31
2.3 Non-ASEAN countries
Sources: Author’s calculation from official data source: preferential exports from Bureau of Preferential Trade, Ministry of Commerce, trade data from UNComtrade
0
10
20
30
40
50
60
70
80
90
2006 2007 2008 2009 2010 2011 2012 2013 2014 2015
Non-ASEAN Australia China India Japan Korea
32
0.1
0.6
1.1
1.6
2.1
2.6
3.1
3.6
4.1
4.6
5.1
5.6
6.1
6.6
7.1
7.6
8.1
8.6
9.1
9.6
10.1
10
.6
11.1
11
.6
12.1
12
.6
13.1
13
.6
14.1
14
.6
0.1
0.6
1.1
1.6
2.1
2.6
3.1
3.6
4.1
4.6
5.1
5.6
6.1
6.6
7.1
7.6
8.1
8.6
9.1
9.6
10.1
10
.6
11.1
11
.6
12.1
12
.6
13.1
13
.6
14.1
14
.6
Figure 3
Experimental Runs according to tariff margin of Selected Countries
3.1 Australia
9 8 7 6 5 4 3 2 1 0
-1 -2 -3 -4
Australia Cut-off All partners
3.2 Indonesia, Malaysia, the Philippines
9 8 7 6 5 4 3 2 1 0
-1 -2 -3 -4
Indonesia Malaysia Philippines Cut-off All partners

33
0.1
0.6
1.1
1.6
2.1
2.6
3.1
3.6
4.1
4.6
5.1
5.6
6.1
6.6
7.1
7.6
8.1
8.6
9.1
9.6
10.1
10
.6
11.1
11
.6
12.1
12
.6
13.1
13
.6
14.1
14
.6
3.3 Vietnam and China
9 8 7 6 5 4 3 2 1 0
-1 -2 -3 -4
Vietname China Cut-off All partners
Note: vertical axis refered to z-stat whereas horizontal one is X per cent Source: Author’s calculation using data sources discussed in text.
34
References Athukorala, P. and A. Kohpaiboon (2009), Trade and Investment Patterns in Asia:
Implications for the Debate on Multilateralising Regionalism, in M. Kawai and R. Baldwin (eds.), Multilateralizing Asian Regionalism, Oxford University Press, Oxford.
Baldwin, R. and D. Jaimovich (2012), ‘Are Free Trade Agreements Contagious?’, Journal of International Economics, 88: 1-16.
Bhagwati, J., P. Krisna, and A. Panagariya (1999), Trading Blocs: Alternative Approaches to Analyzing Preferential Trade Agreements, MIT Press, Cambridge.
Cadot, O., and L. Ing (2015), ‘How Restrictive Are ASEAN’s Rules of Origin?’, in L. Ing (ed) East Asian Integration, Economic Research Institute for ASEAN and East Asia, Jakatra.
Estevadeordal, A. and K. Suominen (2004), ‘Rules of Origin: A World Map and Trade Effects’, in A. Estevadeordal, O. Cadot, A. Suwa-Eisenmann, and D.C.T. Verdier (eds.), The Origin of Goods: Rules of Origin in Preferential Trade Agreements, Oxford University Press, Oxford.
Falvey, R. and G. Reed (2002), ‘Rules of Origin as Commercial Policy Instruments’, GLM Reserch Paper 2000/18, Centre for Research on Globalization and Labour Markets, University of Nottingham.
James, W. (2005), ‘Rules of Origin and Rules of Preference and the World Trade Organization: the Challenge to Global Trade Liberalization’, in P. Macrory, A. Applegate and M. Plummer (eds.), The World Trade Organization: Legal, Economics and Political Perspectives Vol.2, New York, Springer.
JETRO (2007), FY 2006 Survey of Japanese Firms’ International Operations, Japan External Trade Organization (JETRO), Tokyo.
Jones, R. W. (2000), Globalization and the Theory of Input Trade, Cambridge, Mass.: MIT Press.
Jones, R. W. and Henryk Kierzkowski (2001), ‘Globalization and the Consequences of International Fragmentation’, in Rudigar Dornbusch and G. Calvo and M. Obstfeld (eds), Money, Factor Mobility and Trade: The Festschrift in Honor of Robert A. Mundell, Cambridge, Mass.: MIT Press, 365-381.
Kawai, M. and G. Wignaraja (2011), Asia’s Free Trade Agreements: How is Business Responding?, Edward Elgar, Cheltenham
Keck, A. and A. Lendle (2012), ‘New Evidence on Preference Utilization’, Staffs Working Paper, World Trade Organization (WTO), Economic Research and Statistics Division, Geneva.
Kohpaiboon, A. (2009), Product Fragmentation in Thai Manufacturing, M.Kopy Publisher, Bangkok (in Thai)
Kohpaiboon, A. and J. Jongwanich (2015), ‘Use of FTAs from Thai Experience’, ERIA Discussion Paper, Economic Research Institute of ASEAN and East Asia, Jakatra. available to download at http://www.eria.org/ERIA-DP-2015-02.pdf
Kohpaiboon, A. with research team (2015), ‘ Study on Readiness of Thai Manufacturing for Regional Comprehensive Economic Partnership (RCEP)’, Report submitted to Office of Industrial Economics, Ministry of Industry (in Thai).
35
Krishna, K. (2005), ‘Understanding Rules of Origin’, NBER Working Paper No.11150, National Bureau of Economic Research, Cambridge.
Krueger, A. (1999), Are Preferential Trading Agreement Trade-liberalizing or protectionists?, Journal of Economics Perspectives, No.4., pp.105-125.
Takahashi, K. and S. Urata (2010), ‘On the Use of FTAs by Japanese Firms: Further Evidence’, RIETI Discussion Paper Series 09-E-028, Research Institute of Economy, Trade and Industry (REITI), Tokyo.
The Economist (2014), ‘FTAs: Fantastic, Fine or Futile?: Business Views on Trade Agreements in Asia’, available from download at https://globalconnections.hsbc.com/downloads/ftas_fantastic_fine_or_futile.pdf
Vermulst, E. and P. Waer (1990), ‘European Community Rules of Origin as Commercial Policy Instruments’, Journal of World Trade, Vol. 24, No.3, p55-100.