Export subsidies and the WTO negotiations rev - World...
34
Export Subsidies and WTO Trade Negotiations on Agriculture: Issues and Suggestions for New Rules Harry de Gorter Merlinda Ingco Lilian Ruiz Prepared for the World Bank’s Agricultural Trade Group March 2002
Transcript of Export subsidies and the WTO negotiations rev - World...

Export Subsidies and WTO Trade Negotiations on Agriculture: Issues and Suggestions for New Rules
Harry de Gorter
Merlinda Ingco
Lilian Ruiz
Prepared for the World Bank’s Agricultural Trade Group
March 2002
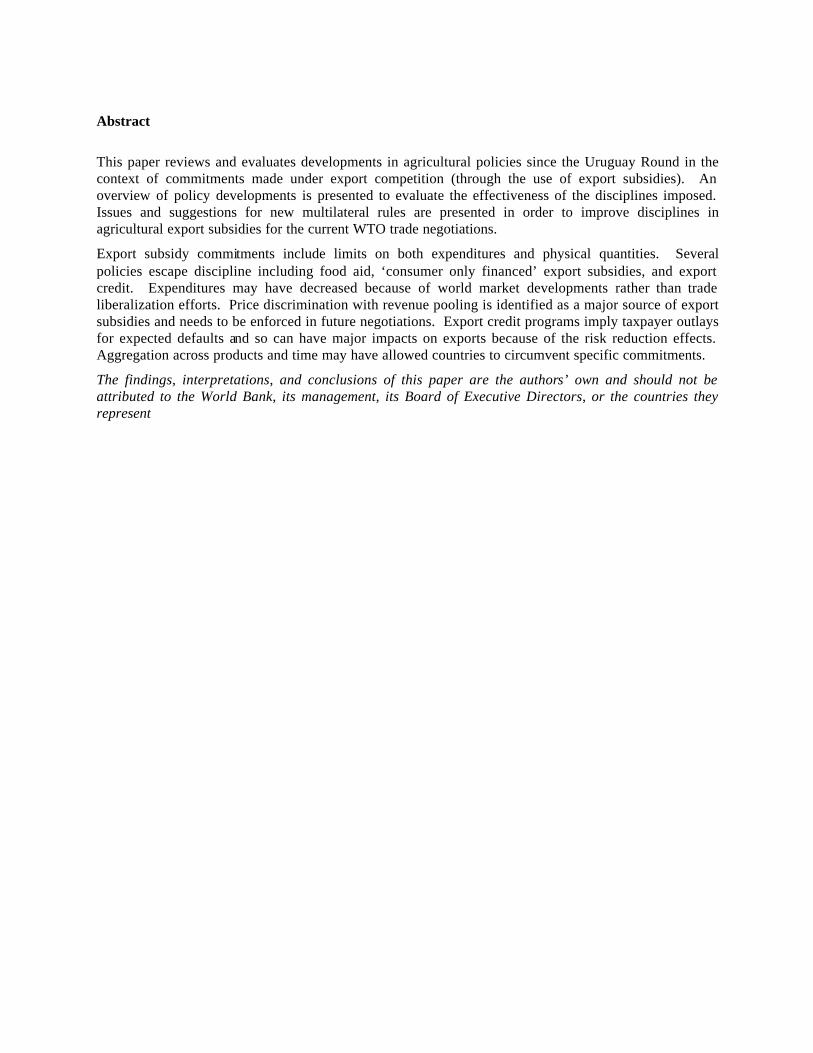
Abstract
This paper reviews and evaluates developments in agricultural policies since the Uruguay Round in the context of commitments made under export competition (through the use of export subsidies). An overview of policy developments is presented to evaluate the effectiveness of the disciplines imposed. Issues and suggestions for new multilateral rules are presented in order to improve disciplines in agricultural export subsidies for the current WTO trade negotiations.
Export subsidy commitments include limits on both expenditures and physical quantities. Several policies escape discipline including food aid, ‘consumer only financed’ export subsidies, and export credit. Expenditures may have decreased because of world market developments rather than trade liberalization efforts. Price discrimination with revenue pooling is identified as a major source of export subsidies and needs to be enforced in future negotiations. Export credit programs imply taxpayer outlays for expected defaults and so can have major impacts on exports because of the risk reduction effects. Aggregation across products and time may have allowed countries to circumvent specific commitments.
The findings, interpretations, and conclusions of this paper are the authors’ own and should not be attributed to the World Bank, its management, its Board of Executive Directors, or the countries they represent

Export Subsidies and WTO Trade Negotiations on Agriculture: Issues and Suggestions for New Rules
Introduction
The Agreement on Agriculture concluding the Uruguay Round (URAA) instituted commitments to reduce agricultural protection in the area of export competition. The purpose of this paper is to review and evaluate the export subsidy commitments in the URAA in lieu of changes in market conditions and agricultural policies in the implementation period. The effectiveness of the disciplines imposed on export subsidies are assessed. Issues and suggestions for new multilateral rules are presented that would improve disciplines on export subsidies in the current WTO trade negotiations on agriculture.
Export subsidy commitments include limits on both expenditures and physical quantities. Several policies escape discipline including food aid, ‘consumer only financed’ export subsidies, and export credit. Expenditures may have decreased because of world market developments rather than trade liberalization efforts. Price discrimination with revenue pooling is identified as a major source of export subsidies and needs to be enforced in future negotiations. Export credit programs imply taxpayer outlays for expected defaults and so can have major impacts on exports because of the risk reduction effects. Aggregation across products and time (the latter through practices called “front-loading” and “banking”) may have allowed countries to circumvent specific commitments.
A total of 25 WTO members can subsidize exports, but only for products on which they have commitments to reduce the subsidies. Those without commitments cannot subsidize agricultural exports at all. Some among the 25 have decided to greatly reduce their subsidies or drop them completely since the URAA has been signed. The agreement includes certain temporary exemptions for developing countries, allowing them to subsidize marketing, cost reduction and transport (Art 9.4).1
Limits on and reductions in the volume and value of export subsidies for 25 countries (and the prohibition of new subsidies) is the key policy commitment on export competition in the URAA. Each country agreed to reducing the volume of subsidized exports by 21 percent over 6 years from a 1986-90 base period level (14 percent over a 10-year period for developing countries), and reduce the value of export subsidies by 36 percent (24 percent over 10 years for developing countries). The Agreement provides flexibility by allowing countries to redistribute the value of subsidies or the volume of subsidized exports between years but the cumulative totals through the year 2000/01 are not to exceed those that would have resulted from full compliance. Countries were also permitted to somewhat aggregate products within a commodity group in their commitments. The reductions apply to each of 22 product categories.2 The least developed countries are not subject to reduction commitments.
1 For more details, see WTO Secretariat background paper “Export subsidies” G/AG/NG/S/5, downloadable from http://www.wto.org/english/tratop_e/agric_e/negoti_e.htm#secretariat.
2 The 22 product categories subject to reduction commitments are listed in Table 2.

WTO notifications have the European Union spending the lion’s share (over 80 percent) of total world export subsidies (Table 1).
Table 1: Total Export Subsidy Commitments
Base 1995/96 1996/97 1997/98 1998/99 2000 bound
European Union (million ECU)
14,800 6,100 6,300 4,800 4,800 9,400
United States (million US$)
930 26 122 113 150 600
World total (million US$)
20,000 6,900 7,000 5,500 5,500 13,400
The United States export subsidy expenditures were less than several countries including South Africa (which eliminated export subsidies in 1997) and Switzerland. Canada eliminated transportation subsidies for exports and so reduced their support in this category dramatically (See Chart 1 for Baseline).
Most observers consider the rules on export subsidies the most important element of the URAA (e.g., IATRC 2001a,b). However, many reasons make the reduction commitments look effective when they really were not. The base period from which reductions were agreed was unrepresentative, being a time of low world prices and high levels of export subsidies. Both “front loading” and “rollover” occurred. In the former, countries could designate a different base period while in the latter; subsidy commitments could be banked across years if unused. Many of the export subsidy policies were converted into domestic support, convenient because of the liberal restrictions on the “aggregate measure of support” (AMS). The following sections will address how effective the disciplines on export competition are by evaluating the ways in which countries have circumvented their commitments, the efficacy of value versus volume reduction commitments, consumer financed export subsidies, and other issues like how food aid, export credits, public stocks and State Trading Enterprises (STEs) can subsidize exports.
Circumvention of Export Subsidy Reduction Commitments
The baseline for the export subsidy reductions was calculated as an average of the volume and value levels applied by the countries on export subsidies from 1986-90. However, reductions could be made from the 1991-92 levels if higher than the 1986-90 average. This mechanism is called "front-loading", in which countries increased their export subsidies expenditures from the 1986-90 levels and were able to start the reductions from a higher level.
The schedule of reductions imposes equal annual reduction installments on a commodity-specific basis. However, the Agreement provides flexibility by allowing countries to redistribute the value of subsidies or the volume of subsidized exports between years but the cumulative totals through the year 2000/01 are not to exceed those that would have resulted from full compliance. From the second to the fifth year of the implementation period countries were allowed to "bank" on unused subsidies from previous periods, provided that:
• The cumulative amounts of budgetary outlays and quantities of subsidized exports, from the beginning of the implementation period through the year in question, does not exceed the cumulative amounts that would have resulted from full compliance with the relevant annual outlay and quantity commitment levels specified in the country’s schedule by more than 3 per cent and 1.75 per cent, respectively, of the base period levels;

• The total cumulative amounts of budgetary outlays for such export subsidies and the quantities benefiting from such export subsidies over the entire implementation period are no greater than the totals that would have resulted from full compliance with the relevant annual commitment levels specified in the country’s schedule;
• The country’s budgetary outlays for export subsidies and the quantities benefiting from such subsidies, at the end of the implementation period, are no greater than 64 per cent and 79 per cent of the 1986-90 base period levels, respectively. For developing countries these percents shall be 76 and 86 per cent, respectively.
Export subsidies that are subject to reductions include direct export payments by governments to firms, industries, or producers of agricultural products contingent on export performance; subsidized stock exports; producer-financed export subsidies; export marketing cost subsidies; export-specific transportation subsidies; and subsidies on goods incorporated into exports. Export subsidies may not be extended to commodities that are not subsidized in the base period. Widely available export market promotion and advisory services are exempted from reduction commitments to be negotiated later. Countries were also permitted to aggregate products within a commodity group in their commitments. This flexibility allows countries to switch subsidies between commodities within the same group.
An important aspect of the use of export subsidies is the proportion of total exports that are subsidized. This is a measure of the overall reliance on export subsidies for a given commodity. The notifications reveal that the figures for subsidized exports and total exports are different, with no explanation regarding the mechanism by which a certain volume is subsidized and the remaining is not. Table 2 shows the share of total exports that received export subsidies in each period.3 The two columns for each period compare the share of total exports receiving export subsidies for all 25 countries' exports to the share for OECD countries' exports only.
The disparity in the percent use of export subsidies between the two columns for each period shows that, in general, most countries did not make use of export subsidies for a significant share of their exports. However, most of the agricultural exports for OECD (industrial) countries rely on subsidization. For some commodities, the share of subsidized exports is even larger than 100%, because some countries report data from export certificates issued, which not always result in actual exports. Again, the products that rely most heavily on export subsidies are dairy and meat products.
The use of the countries' respective value allowances for each period is shown in Table 3. Countries did not exceed their total expenditure commitments. The same aggregate analysis cannot be made with respect to volumes, due to the differences in units of the various commodity groups. Also, it is problematic to aggregate metric tons of commodities so different like honey and whey powder. Table 3 shows that, on a country-by country basis, value commitments are not binding.
However, on a commodity basis, the analysis of the use of value allowances generates different results. Table 4 shows the percent of the total expenditure allowances for each period that was allocated to each commodity group. The largest percent allocation of value allowances is for wheat, coarse grains, dairy products and meats. The differences in the percent allowances during the implementation period are due to front-loading (when reductions were made from a value larger than the 86-90 average) and also due to exchange rate effects. In order to compare commodity groups from different countries, all expenditures were converted to U.S. dollars. Due to exchange rate fluctuations during the implementation period, the percent allocation of value commitments may have increased or decreased in dollar terms. Depending on the exchange rate to the US$ dollar for each year, the value commitments can increase (decrease) in dollars terms, and decrease (increase) in local currency.
3 The sources for Tables 2-11 are Ruiz.

In terms of the actual expenditures, meat, dairy and incorporated products used the largest proportions of the total expenditures in export subsidies, averaging more than 70% for the period 1995-99. Meats accounted for 25%, dairy for 34%, and incorporated products for 12%.
Table 5 shows the percent use of the value allowances allocated to each commodity group.4 It shows to what extent the countries on aggregate used the value allowances allocated to each commodity group. Coarse grains and wheat used a smaller proportion of the allowances, due to the high world prices in the beginning of the implementation period. Sugar exceeded the commitments, as well as wine in 1996-97. Pig meat exceeded the commitments in 1998-99. The largest percent use of the commitments is that of dairy, meats and incorporated products.
Table 6 shows the percent use of the volume allowances allocated to each commodity group.5 Coarse grains and wheat used a small proportion of the allowances, due to the high world prices in the beginning of the implementation period. However, the use of the allowances for wheat and grains has increased sharply during the last three years, and it became close to binding for coarse grains. The world price for wheat and grains, as well as exchange rate developments will be crucial in determining if countries will be able to comply with the commitments. Sugar, skimmed milk powder and other milk products have also increased the use of volume allowances to levels very close to the limits. Pig meat exceeded the commitments in 1998-99, due to a sharp increase of 350% in European subsidized exports. Dairy products, meat products and wine make the largest percent use of the volume commitments.
The percent use of value and volume allowances shows that the commitments are binding for some commodity groups, while for others the allowances are far above the actual volumes and values applied. By averaging the percentage use of commitments presented on Tables 5 and 6, the data shows that, on average, 36% of the value allowances have been used, while 45% of the volume allowance has been used. These figures suggest that the volume limits have been more binding than the value limits. This is a result of decrease in the domestic support price of several important commodities (the European Union even taxed exports of cereals in the beginning of the implementation period), and increases in world market prices, which decreased the need of large per-unit export subsidies.
In analyzing the effectiveness of export subsidy limits, three important issues concerning the reduction commitments on export subsidies. First, reduction commitments have been binding when analyzed in a more detailed breakdown of commodity sectors and countries than that presented so far. Limits imposed are above the levels of export subsidies used. This suggests that the commitments have not been binding in aggregate. The effectiveness of the limits imposed on value and volume on export subsidies depends on several factors, such as world prices and shifts in excess supply and demand.
When analyzing individual sectors, the picture changes, not least because of the use of "banking" on unused subsidies. Several factors determine the effectiveness of the reduction commitments. The baseline used is also a factor. The issue of the per-unit subsidy and the implications of not having a discipline that regulates the magnitude of distortion in the world price, and the asymmetry of protection resulting from different rates of export subsidization is also discussed.
Binding Commitments and the Rollover of Unused Export Subsidies
Several countries exceeded the value and volume allowances throughout the implementation period. The excess is justified by the countries as being "unused subsidies rolled over to subsequent years", in
4 The countries using subsidies and the commodity groups they subsidize are less than the allowances. Therefore, the percent use of commitments would be different if calculated as a percent of the commitments only for the countries and commodities that actually make use of them.
5 Eggs and Fruits and Vegetables were excluded due to inconsistencies regarding the units reported in the notifications. Incorporated products are also excluded because no volumes are reported for this group.

accordance to the flexibility offered in Article 9(b) of the URAA. This flexibility has been called "banking". The "banking" practice weakens the effect of the reductions, because it allows for strategic trade behavior in exploiting market share. “Banking” on unused subsidies would allow an increase in subsidies for some commodities during the implementation period. This flexibility provision allows countries to circumvent export subsidy commitments. Several countries resorted to the "banking" practice, including the European Union, United States, Poland and Norway.
The countries that are close to or above the value limits are shown in Table 7. The value commitments have been binding in various occasions, and it is clear that more countries are exceeding the commitments, as the end of the implementation period is approaching. Some commitments are exceeded by more than 300%. The European Union's expenditures were above the 2000-01 bound rates for several commodities during the implementation period, and in some cases, they exceed the annual commitments.
The countries that reached or exceeded the volume limits are shown in Table 8. The products that are closer to or above the volume commitment levels most often are dairy, meats, sugar and rice. The limits on coarse grains became more binding in 1998-99, whereas in the former periods, wheat and coarse grains were well below the commitment levels. The volume commitments again became more binding as the end of the implementation period approached. The same is occurring with the value commitments. This raises the question of whether the countries will be able to comply with their commitments, especially for politically sensitive commodities such as dairy and meat products, and what changes in domestic policies will be necessary.
The Basel ine and the Front-Loading Flexibi l i ty
The reduction commitments are based on a time period of 1986-1990, which had unusually high export subsidies worldwide. The base period, calculated as an average of the values and volumes applied during 1986-90, resulted in commitments that are, in general, higher than the actual levels applied during the implementation period. Moreover, the discipline offered the flexibility of allowing countries to start the reductions from the 1992-92 levels, if higher than the baseline. This makes the commitments even less effective in reducing trade distortions. Under this possibility, the subsidies can be higher (during all but the last year of the implementation period) than they would be in the case of maintaining the 1986-90 baseline for reductions.
Table 9 and 10 show selected cases in which countries have a higher level of subsidies, in terms of both value and volume, from which they started the reductions. The column for 1986-90 shows the levels for value/volume in the baseline in Tables 9 and 10, respectively. The next column shows that the average levels for 1991-92 are higher than the 1986-90 average baseline levels. In these cases, the reductions started from the 1991-92 average. The first year of the implementation period is shown in column 1995-96. The reduction commitment levels in 1995-96 are higher than the 1986-90 baseline, because they are based on the 1991-92 average. The last column shows the percent increase in the base value and volume when using the 1991-92 average instead of the 1986-90 average.
Although Canada only subsidized its butter exports in the first year of the implementation period, the front-loading mechanism allowed the volume reductions to start at a volume 141% higher than the 1986-90 baseline. The 1995-96 commitment level was above the baseline level. In other cases, the increase in the baseline for reductions is still more dramatic. For example, the baseline value of export subsidies for milk products in the United States was increased by 426%, as shown in Table 9.
The 1980s were characterized by a period of intensive use of export subsidies for cereals, coarse grains, dairy, and other products. The European Union used higher subsidies in the baseline than at the beginning of the 1990s (except for wheat). Therefore, the commitment allowances, including the 2000-01 bound levels are higher than the actual levels in the previous years (from 1990-95), for some commodities, which eliminated the need for dramatic changes in the domestic policies in order to accommodate the export subsidy reduction commitments.

The European Union and the United States used only 42% and 2.5%, respectively, of the value allowances in the first year of the implementation period (Table 3). This may be due to the high international prices that caused the decrease in the per-unit subsidy necessary, rather than to the commitments themselves. The European Union increased the expenditures on sugar, other milk products, pig meat, poultry meat and eggs in 1997-98 and the expenditures on almost all products in 1998-99 over the previous years. It also increased the volumes subsidized of almost all products in 1996-97 compared to the 1995-96 levels, of sugar and eggs in 1997-98 and of wheat, coarse grains, skimmed milk, pig meat, and eggs in 1998-99. The United States increased the expenditures on all subsidized exports (except for poultry meat) in 1996-97 over 1995-96, and subsequent increases occurred in the dairy product, coarse grain, and poultry sectors. The aggregate expenditures in 1996-97 and in 1998-99 were higher than in the previous year in each case. The volume subsidized increased for all subsidized products in 1997-98 with respect to the previous year, for dairy products in 1996-97, and for poultry and skimmed milk powder in 1998-99. The combination of lower world commodity prices and the end of the implementation period becomes a threat to countries that may face difficulties in complying with the commitments, which may induce domestic policy changes in many countries, notably in the European Union.
The Per-Unit Subsidy and Asymmetry of Protect ion
In addition to the level of reductions and the choice of baseline period, other characteristics of the URAA discipline on export subsidies will influence the effectiveness of the commitments in reducing trade distortions. One of the most important features of the discipline is that the per-unit subsidy is not regulated in the commitments.
As opposed to the discipline on tariffs, where the per-unit or ad valorem duties are bound, only the total amount of the expenditures (or volume exported) is regulated for export subsidies. This implies that there is less control over the trade distortion caused by export subsidies, because the same value of export subsidy allocated to a commodity can have different effects on the increase of quantities exported and on the decrease in world price.
The trade distortion of an export subsidy depends on the conditions of excess supply and demand, and on the amount of export subsidy expenditures. It is possible that a larger amount of export subsidy used by a given country will distort world price minimally, while a smaller value applied by another country will have a larger impact in decreasing the world price.
In addition, the conditions of trade will influence the way in which a country will allocate its value allowance. If there is no limit on the per-unit subsidy applied, the trade distortion might not be decreased by the current rules, because value and volume will rarely bind at the same time. For example, suppose that the volume limit only is binding. If a demand shock in the world demand causes the world price to decrease, the exporting country will be able to increase the per-unit subsidy, and to continue to export the same quantity at a lower world price. If limits were imposed on the amount of distortion in the world price that a subsidy can cause, then the country in question would have to decrease the volume exported, causing less distortion in the world price.
In other circumstances, no limits on per-unit subsidies help to isolate the domestic market from changes in the world market. In the former example, when the world price decreases due to an excess demand shock, if the country can increase the per-unit subsidy and hence export the same volume, then the domestic price for this commodity will not change, despite the drop in price in the world market (Ruiz).
The limit on the total value of subsidies awarded poses another problem. As they are not directly linked to the world price or the quantities exported, the rate of subsidization across commodities differs significantly. Therefore, different incentives are created for the sectors involved, because it changes the relative domestic prices with respect to the world markets, adding to the distortions and efficiency losses caused by the export subsidies.

Ruiz calculates per-unit subsidies as the ratio between the value of the subsidy (actual and committed) and the volume exported (actual and committed). The per-unit subsidy for butter and butter oil varies from US$67 per ton, to more than US$3,000 per ton. The European Union provided US$2,019 per ton of butter in 1997-98, while the United States provided US$506 per ton. The differences across countries can be found for all commodities presented in Table 11. As of the differences across commodities, for example, Norway provided per-unit export subsidies for cheese of around US$3,000 per ton, while the subsidy for other dairy products is zero after 1996. An example of differences across time is the exports of coarse grains from the United States, which received zero export subsidies in 1995-96 and 1996-97, and received a per-unit export subsidy of US$ 48 per ton in 1997-98.
There is a declining trend in the per-unit export subsidy applied, but this trend can be a result of developments in the world market and to exchange rate effects, rather than to true trade liberalization. Dairy products exhibit an increase in the general level of protection, as well as poultry, pig meat and coarse grains. In general, the European Union decreased the per-unit export subsidy, while the United States has increased it over the implementation period.
The resource misallocation caused by the use of export subsidies can be represented through the measure of export subsidy equivalents (ESE), which show the relationship between the per-unit subsidy awarded and the world price of the commodity. Table 11 shows ESE for selected countries and commodities, based on the per-unit subsidy calculated in the countries' notifications to the WTO, and FOB prices from the OECD. The ESE is the ratio of per-unit subsidy to world price, multiplied by 100.
Table 11 shows that the per-unit export subsidies awarded in those cases are very high with respect to the world price of the commodity. It is not unusual that the amount the producers or exporters receive from the export subsidy is two or three times larger than the amount actually paid in the world market. The table also shows the asymmetry of the ESE across commodities for the same country. The variation of rates within the same country can be form 10% to 378%. In the European Union, the ESE for pig meat was 378% of the world price in 1997-98, while only 16% for poultry meat. Such asymmetry of incentives will not only have effects in the world market, but also distort the domestic productive sector and affect domestic demand.
Such a distorting support structure can increase the economic inefficiency resulting from export subsidies. In 1995-96, the ESE for skim milk powder in the European Union was 36%, three times that of the United States, which was 12%. This difference reflects the different levels of domestic price support, which will absorb differences in the competitive advantages of the two countries in question. Therefore, the per-unit export subsidy should also be regulated in the discipline on export subsidy reduction.
Finally, there is the issue of export taxes that are not adequately addressed in the URAA. In years when world prices are high for traditionally export subsidized commodities; an export tax prevents an increase in keep domestic prices to world levels. The domestic price is therefore isolated from the world price. This practice, although unregulated by the agreement, is also trade distorting in the measure that it prevents world prices from falling, and therefore it threatens countries that depend on these commodities’ imports. The export tax, therefore, not only distorts supply and prices, but also may have consequences on food security matters for least-developed countries in times of relative shortage. Making supply less responsive to prices only aggravates the problem, contributing to more instability and uncertainty in the food supply. The European Union used export taxes on wheat and coarse grains (barley) after the rise in prices that occurred at the beginning of the implementation period. The use of export taxes allows for strategic protection of domestic processing industry, and also to improve the terms of trade for large countries exporters. They undermine the benefits achieved by foreign consumers, who buy subsidized exports at a lower price.

The Economics of Expenditure versus Quantity Limits
A key policy issue is whether the formula for further cuts in export subsidies should focus on volumes or expenditures. To analyze this, we refer to Ruiz and de Gorter, which give the conditions under which volume or value limits will be more binding.
Factors affecting the effectiveness of volume versus value limits include the level of world prices and internal price supports, elasticities of excess supply and demand, and how the free trade equilibrium changes over time with shifts in excess supply and demand.
For the current reduction commitments, value will never be binding in a static framework. The percent reductions in volume versus value will have to occur within specific ranges for value commitments to be binding in a static framework. For example, for identical reductions in volume and value, the volume reduction is always binding. This result is independent of the elasticities of excess supply and excess demand.
More specifically, Ruiz and de Gorter determine that the ratio of value over volume reduction commitments has to be smaller than the ratio of the initial and reduced per unit export subsidy. This relationship allows us to predict the effects of bindings on the reduction of per-unit subsidies for a given set of market parameters. Therefore, a country can analyze the final per-unit export subsidy resulting from the proposed volume and value reductions for each commodity sector. When reductions are negotiated this will determine the reduction in exports for given supply and demand conditions.
Other relationships between value and volume reductions can also be established. For a larger initial per-unit export subsidy, ceteris paribus, volume reduction commitments are more effective, and for larger initial quantities exported, ceteris paribus, value reductions are more likely to bind. This means that with more elastic trade curves, ceteris paribus, value reduction commitments become more effective.
In a static analysis, Figure 1 depicts baseline exports of Q0 with a per unit export subsidy of Pd – PW representing the price gap between domestic and world prices. Assume that in the baseline, both the volume of subsidized exports and the value of export subsidy expenditures are limiting. Let us first consider the case when the excess supply and demand curves do not shift over time. A 21 percent reduction in the volume of exports with an export subsidy may result in exports being equal to or less than the free trade level Qft (where the per unit export subsidy will fall to zero). In this case, the volume constraint will be more liberalizing and any reduction beyond Qft would not be necessary. Reducing the volume of exports receiving a subsidy results in a lower price gap, which becomes zero at Qft. One needs a less than 100 percent reduction in the volume of subsidized exports to reach free trade, unlike the case for reductions in export expenditures.
Within a dynamic framework, conditions of trade change, and therefore the analysis needs to include cases where the free trade equilibrium shifts during the export subsidy reduction implementation period, or thereafter.
The effectiveness of a volume versus an expenditure constraint in a dynamic framework depends on what is being held constant: the per unit export subsidy, total export subsidy expenditures, the volume of exports subsidized, or domestic price levels. For example, if the free trade equilibrium shifts right, the volume constraint will automatically have export subsidy expenditures decline as the per unit subsidy necessarily declines.
Assuming that both volume and value reductions are equally binding after the reductions have occurred, for exogenous shifts in excess supply and excess demand, volume constraints are always binding in the case of a positive shift, and expenditure constraints are always binding in the case of a negative shift.

If value reduction commitments are binding after the reductions, however, a positive shift on excess demand or excess supply can result in either volume or value commitments that are binding, depending on the ratio between the reductions.
If volume reduction commitments are binding after the reductions, a negative shift on excess demand or excess supply can result in either volume or value commitments that are binding, depending on the ratio between the reductions.
Figure 2 depicts two cases: the free trade equilibrium point shifted to the left in panel (a) with positive shifts in excess supply and/or excess demand; or the reverse in panel (b) where the free trade equilibrium shifted to the right. The effectiveness of a volume versus an expenditure constraint depends on the goal of the government. Politicians have the option to maximize any one of at least four potential policy targets to fulfill political demands as best as possible under changing market conditions and WTO export subsidy commitments: the per unit export subsidy, total export subsidy expenditures, the volume of exports subsidized or domestic price levels.
If the free trade equilibrium shifts to the left, volume limits become less binding. We can have “water” in the volume limit, if value commitments bind at a lower Q. It is more likely that countries that reduced their schedule of exports over the implementation period will have to increase per-unit subsidy on a smaller volume of exports. It is possible, though, that countries will not be able to spend all their value allowances, if it means exports above the volume limit. It would be possible to keep the level of domestic prices.
If the trade equilibrium shifted to the right, value limits became less binding, so we can have “water” in the value limit. It is more likely that countries will have to reduce the per-unit subsidy, and that the domestic price will have to fall due to the volume binding. The volume of exports will be maximized if the value limit does not bind at a lower Q.
Because the gap between domestic and world prices was relatively large in the baseline period of 1986-88 and that expenditures were the limiting factor in 1995 and 1996, it may be the case that the free trade equilibrium shifted left. As shown in panel (a), it is possible that the per unit export subsidy increases while the volume subsidized actually decreased, thereby rendering the expenditures as the limiting variable. However, the outcome may be due to the other factors described above. For example, an increase in world prices means the per unit subsidy declines for a given level of exports subsidized. It would be more likely that the volume limit becomes binding. The quantities of subsidized exports have to increase to maintain the same level of expenditures, even if the per unit export subsidy did not increase (the latter now being possible with higher world prices).
Another possible explanation for why budgetary commitments appear to be more binding than quantity commitments is governments may be able to circumvent quantity limits. Instead of a per unit export subsidy on all exports, governments may be targeting subsidies on a portion of total exports for the country in that year. The per-unit subsidy may increase for those exports subsidized but not all exports would receive subsidies in that year. Governments can be characterized as maximizing the export subsidy value commitments (or are reaching the objective of how much they want to spend) by subsidizing fewer exports at higher subsidy rates and so get around quantity limits. Because of uncertainty as to how the market will evolve, governments will choose a quantity below the limit and a subsidy rate that will at least reach their export subsidy expenditure commitments. It is more difficult to do the reverse of maximizing the volume of exports receiving a subsidy because there is no way to manipulate expenditure limits. This may explain why we observe subsidy expenditures to be more binding than export volumes. Because of market uncertainty, governments may feel it is better to reach the expenditure limit before the quantity limit; otherwise, there is no recourse to achieve the maximum export subsidy expenditures.
Given variations in world prices with shifts on the excess demand and supply curves, a binding on volumes exported will become limiting with any changes in domestic or world prices that reduce the per-

unit subsidy (an outward shift in excess demand and/or in excess supply). Therefore, in periods of expansion of agricultural production and consumption, volume bindings are essential for keeping export subsidies from escalating. This reasoning may seem counterintuitive that for higher levels of world prices, the need for subsidies is reduced. This is true only with respect to the per-unit export subsidy, with no regards to what happens to total expenditures and volume of subsidized exports. The volume binding is more effective than the value binding with outward shifts in excess supply or excess demand curves.
A binding on the value of subsidy will become limiting with any changes in domestic or world prices that increases the per-unit subsidy (an inward shift in excess demand and/or in excess supply). In those periods of contraction of agricultural production and consumption, a limit on expenditures (value) on export subsidies will help to force consumers and producers to respond to real market conditions instead of consume and produce at levels that are artificially maintained by an increase in subsidies.
Limits on volume of subsidized exports and value of export subsidies will impose limitations in the use of a domestic price support, because if the value commitment is binding, and therefore the total value of subsidies cannot be increased, domestic price will have to fall if the gap between world and domestic price becomes wider (an outward shift in world demand). But countries can use another type of mechanism. Countries can subsidize only part of the exports by the total amount of the gap and spend the all the value allowed, and the rest will be traded at lower world prices. This represents “seasonal” subsidies, where exports receive subsidies during alternative periods, such that the total of the period would not exceed the constraint, but individual periods would. The mechanism allows countries to circumvent volume bindings. In these situations, a limit on subsidy expenditures would be required to ensure trade liberalization. In contrast, for the case of an increase in world demand, the same binding volume can be subsidized by a smaller per-unit export subsidy, and therefore fixed domestic prices will not change.
Consumer Only Financed Export Subsidies
The Agreement has placed limits on taxpayer and producer financed export subsidies but has not recognized “consumer only financed” export subsidies. 6 A consumer only financed export subsidy exists when a government-sanctioned organization like a marketing board has the power to price discriminate and pool revenues to producers (Sumner; Schluep and de Gorter). Such a scheme has the effect of increasing supply and decreasing demand like a taxpayer financed export subsidy except that the consumer financed export subsidy distorts trade more for a given domestic price (Schluep and de Gorter). Note that both a taxpayer and a consumer financed only export subsidy scheme require import barriers in order to be effective. If such a scheme is covered in the market access part of the Agreement, then it may not be of paramount importance to recognize consumer only financed export subsidies. However, many times taxpayer financed export schemes are not covered in market access commitments like the Canada-U.S. wheat agreement (where Canada free rides on the U.S. taxpayer financed export subsidy - see Peterson and de Gorter) and fluid milk premia in several countries and regions.
Domestic price discrimination alone is a consumer tax. Price discrimination for a non-traded product like fluid milk with pooling of a traded product also constitutes an export subsidy. Price discrimination in world markets combined with revenue pooling in the domestic market is a production subsidy (like New Zealand Dairy Board practices). Producer financed export subsidies can only exist if a consumer only or a taxpayer financed export subsidy is in place first Schluep and de Gorter). Trade distortion with a producer tax on a taxpayer financed export subsidy differs from that of a tax on a consumer only financed
6 Taxpayer financed export subsidies have consumer transfers as well because of the increase in domestic prices.

export subsidy. As a result, export subsidies are inadequately dealt with in the Agreement on Agriculture, the Agreement on Subsidies and Countervailing Measures, and Article XVI of the GATT 1994.
The Federal Order dairy pricing scheme in the United States is an example of a consumer financed export subsidy scheme because of higher domestic prices and price pooling (Sumner). In addition, an implicit export subsidy prevails when one or more dairy products are sold in the domestic market at world prices. Supply increases to the export market for those products (sold in domestic markets at world prices as well) for two reasons: consumption of higher priced products is reduced and pooling causes production to expand. Exports are subsidized even if export revenues are not pooled to farmers (but domestic sales at the world price are). Schluep and de Gorter provide conditions when such a scheme is a full-fledged export subsidy and when it approaches a production subsidy.
The Federal Order system does not have explicit production controls but implicitly does because of regional price differentials for fluid milk. Because fluid milk prices are not allowed to equalize and consumer fluid prices are higher in high production cost regions (with lower weights for low class prices in the pool price), inefficiency in milk production does put a brake on total US milk production expansion arising from pooling.
New Zealand dairy policy under the control of the producer controlled dairy board has price discrimination among multiple markets for many products in the world market. Pooling these revenues have the effect of a production subsidy (Schluep and de Gorter). Price discrimination in world markets leads to higher prices for consumers worldwide and therefore lowers consumption and trade. But prices in the more elastic demand markets are lower which are the markets for competing exporters. Otherwise, price discrimination would not be possible in the first place. The producer board also pools downstream profits, domestic price premia, and import quota rents, resulting in an expansion in farm milk supply.
Producer Financed Export Subsidies
Mandatory or government regulated producer financed export subsides are subject to reduction commitments. A producer financed export subsidy can only co-exist with a taxpayer and/or a consumer only financed export subsidy. Otherwise, a producer financed export subsidy is not possible. Introducing a producer levy with a taxpayer financed export subsidy already in place increases the price to both farmers and consumers. If the levy maintains net price (and producer welfare), price to consumers increases and so increases tax costs of the program because the world price declines for a given level of exports. The only way producer levy to finance part of the costs of a taxpayer financed export subsidy program can reduce tax costs are if producer welfare declines.
The situation differs for a producer levy to partially or fully finance exports under a consumer only financed export subsidy scheme. Indeed, it turns out that a producer levy with consumer financed export subsidy scheme results in an identical outcome in terms of market effects. A levy imposed on a consumer only financed export subsidy results in the same average revenue (pooled domestic and export sales) curve because exports are not pooled at the world price anymore but at some higher price to justify the use of producer levies in the first place. Therefore, a producer levy to finance part of the costs of a consumer only financed export subsidy is identical to a consumer only financed export subsidy alone, holding producer welfare constant (Schluep and de Gorter; Schluep).
IATRC (2001a) argue that consumer financed export subsidies are of secondary importance. Meanwhile, IATRC (2001b) argues that the WTO Panel decision on Canadian dairy policy has important implications for all countries because Canadian practices are adopted worldwide. IATRC (2001b) argue that Canada’s

policy is merely a producer financed export subsidy.7 But Schluep and de Gorter prove that producer financed export subsidies are, in the case of Canada, identical to a consumer only financed export subsidy. Hence, reconciliation of this issue is of great importance.
Other Issues
Export Credi t Programs
Export credit programs totaled $7.9 billion in 1998 in the form of credit guarantees, interest rate subsidies, public assumption of risk and insurance subsidies (IATRC 2001a). The export subsidy component is the taxpayer outlays for expected defaults and so can have major impacts on exports because of the risk reduction effects. Export credits can expand demand for exports, because it helps to alleviate financial constraints in the importing country, and they decrease the adverse effects of exchange rate fluctuations during the length of the contracts. The use of export credits has been increasing for agricultural products, but the institutions that offer this subsidized credit (below-the market interest rates, delayed liquidations) have become object of discussion once export credits can have the same effects of export subsidies (Abraham et al.). Agricultural export credit programs are excluded from the international agreement that regulates export credits for manufactured goods. This fact shows the same political bias towards agriculture that is present in the GATT, where agricultural export subsidies were excluded from the Agreement on Subsidies and Countervailing Measures. The provision of export credits for agriculture needs to be negotiated and regulated in the current round.
The same reasoning is valid to what concerns export insurance. When the government or private agents offer export insurance at levels and rates that are not standard in the domestic markets of the countries involved, the incentive for exports is present and may have the effect of decreasing the export price of the product in question because it will affect transportation costs and risk.
The export subsidy component of export credit guarantees can be very complex to measure. Subsidized risk premiums need to be converted into a present value of expected costs of defaults to be borne by the taxpayer. It is possible that reducing the risk and enhancing purchasing power of importers, thereby shifting the demand for imports and mitigating the export subsidy effects, have corrected for a market failure. Better criteria for measuring export subsidy effects are required. For example, export credit guarantees are useful for food security in importing countries suffering from financial crises or food supply problems.
Public Stock Disposal
ABARE shows the direct correlation of export subsidies and the rundown of public stocks. There is a large literature on government stock disposal procedures and some economists argue that such schemes can decrease domestic prices and hence not act like an export subsidy (Houck; Chambers and Paarlberg; Anania, Bohman and Carter). However, Peterson, Minten and de Gorter show that these traditional models of export bonus programs focus only on the effects of disposing public stocks on the world market. The economic effects of export bonus programs are significantly different when one includes the costs of acquiring these stocks. Including stock acquisition costs has the domestic price always rising, rather than an ambiguous effect of the traditional model of an export bonus program. The analysis also shows that including stock acquisition costs results in an export bonus scheme to be equivalent to cash export subsidies. When an export bonus program is combined with an existing target price scheme, government cost may either rise or fall in either model. In an empirical simulation of the U.S. Export
7 This is only correct for one of the three price categories ruled on by the WTO. The WTO ruled that one category was an export subsidy when it was not, another category as not an export subsidy when it was, and the third category as an export subsidy when it was, but the WTO reasoning was incorrect.
Enhancement Program for wheat, the analysis shows that a model that includes acquisition costs induces a lower level of tax cost than the traditional model even though taxpayers bear the additional burden of acquisition expenditures.
Food A id
Food aid can have similar market effects as an export subsidy. However, food aid is not included in the schedule of reductions. Food aid that displaces commercial exports (for example, it is re-sold on the domestic market) will depress world prices while emergency food aid that increases total world consumption has the opposite effect. Actual food aid and export promotion programs have complex effects and so are problematic in a practical sense to determine if it constitutes an export subsidy or not. Therefore, it is important to determine when the aid is a result of commercial export diversion in the exporting country, because the resulting effect may be trade distorting but not categorized as an export subsidy.
On the other hand, when the aid is resulting from surplus disposal, it may be used as a mechanism of price support, because it increases domestic price, creating the prerequisite for export subsidies: a price gap with depressed demand and increased supply. Therefore, it has the same effect as a cash export subsidy in depressing and destabilizing world prices, hurting farmers and the food supply in poor countries. If the commodity donated is re-sold in the domestic market of the recipient country, world price will only be affected if it is a large importer (and if it had the possibility to pay for the commodity in a normal transaction). If the commodity is re-exported from the recipient country, the trade distortion is more evident than otherwise (Gardner).
Although food aid can assist in reducing hunger in emergencies, a large proportion of it is currently being provided to support farm prices and dispose of surpluses (ABARE). Alternative methods of assistance can be adopted to help the needy, including cash aid.
State Trading
State trading was not disciplined in the URAA except for an “understanding” on the interpretation of Article XVII of the GATT 1994. Progress may be made by agreeing to open markets for private trade, in order to create more competition for state agencies and thereby reduce their ability to control exports. Otherwise, the behavior of state trading agencies and/or the outcome of their operations directly needs to be controlled because state enterprises or marketing boards have a monopoly when buying commodities for export, and they also enjoy government guarantees, and do not work with commercial objectives. However, Veemen, Fulton and Larue make a very strong argument that STEs improve market competition. Hence, STEs may not be fundamentally different from private companies or even improve market conduct and performance. STEs often operate on a commercial basis while private companies can also enjoy monopoly power, use differential pricing, and can be bailed out with subsidies when they are in trouble. Hence, specific disciplines should be put on multinational corporations, public and private.
Other issues relating to exporting STEs is discrimination among destinations ("pricing-to-market"), and price pooling between domestic and export sales (possibly leading to ‘consumer only” financed export subsidies dealt with above). Pricing-to-market is a very difficult issue to deal because it often is a normal commercial practice, related to transport costs, quality differences and other similar factors. However, pricing-to-market can also be used as predatory pricing.
Export subsidies on inputs
Controversy over EU "inward processing relief" for cheese shows how export subsidies for inputs into cheese production (butter and skim milk powder) indirectly subsidizes cheese exports. This allows the EU to circumvent export subsidy limits and can be a precedent for countries to henceforth transfer subsidies from one product group to another in the form of input subsidies (Leetmaa and Ackerman).

This flexibility undermines the limits imposed by the commitments, and can be avoided by a more specific commodity definit ion. Switzerland reports export subsidies on "dairy products", which is more aggregated than other countries that report cheese, skim milk powder, butter and "other milk products". This gives Switzerland more flexibility to allocate subsidies among different products within this broad group. The United States and New Zealand argued that the "inward processing relief" for cheese in Europe is a circumvention of the commitments.
Conflat ion with other commitments
Further research should also focus on the issue of "conflation". Many export subsidy commitments are also implicitly included (sometimes only partially) in the market access and domestic support components of the Agreement. This conflation means that a decrease in tariffs or domestic support will automatically require a fall in export subsidies (and vice-versa). For example, price gaps are calculated for the export enhancement program of the U.S. wheat, rice, poultry and eggs sectors and so are included in measures of domestic support but not in market access commitments.
Concluding Remarks
On the face of it, export subsidy reductions appear to be a success but many problems remain. Most of the reduction in export subsidies is due to higher world prices and an unrepresentative base tear. Commodity aggregation, rollovers and front-loading also contributed to hiding the true extent of export subsidies used. The transfer of subsidies from one product to another in the form of export subsidies for inputs is also a way countries circumvent export subsidy commitments. The constraints on value and volume means countries can increase subsidy rates on a lower volume to circumvent volume limits.
The definition of an export subsidy in the GATT 1994 leaves room for loopholes, circumvention, and misinterpretation of what an export subsidy is and should be more specific on those policies that have the dual effect of contracting domestic consumption and escalating domestic production. This definition would provide a more solid basis to recognize different types of export subsidies that are not now explicitly listed including a consumer only financed export subsidy. Consumer only financed export subsidies with revenue pooling are not recognized and are more distorting than a traditional export subsidy. The clarification of the role of producer financed export subsidies and their relationship to taxpayer and consumer only funded export subsidies is also needed, especially in light of the recent WTO Panel on Canadian dairy pricing schemes.. An expansion of the definition of export subsidies and a revision of “revenue foregone” and “contingent on exports” clauses are needed to better identify true export subsidies.
Criteria for the conditions under which foreign food aid displaces commercial exports and hence functions as an export subsidy is also needed. Importance should be placed on public stock disposal schemes like payment in kind exports that recognize the effects of acquiring as well as disbursing stocks. Methods to isolate the export subsidy component of export credit guarantees need also to be developed while disciplines on exporter STEs need to be strengthened and coordinated with competition policy in the WTO.
Policy Recommendations for Further Discipl ine of Export Subsidies
Because export subsidies take a wide variety of indirect and direct forms, including direct export subsidies, export credits, state trading and food aid. Agreement on specific limitations will be difficult to achieve because of the variety of institutions and programs involved.

In general, we recommend:
• Further reductions on both the volume and value of direct export subsidies, if not elimination (a large initial reduction followed by progressive reductions and a time limit for an elimination)
• Consider rules to prevent circumvention, by introducing a limit on the per-unit subsidy as a percent of world price, and banning "front loading" and "banking"
• Consider differential treatment for developing countries for export credits and STEs. A lot of market failures are associated with credit in developing countries so maybe not “hurt themselves”. As for STEs, there are market competition issues where it improves with export STEs so for poor countries – economies of coordination, countervailing power against multinational grain companies, etc.
• Consider market power issues with STEs in the context of a broader competition policy
• Evaluate if the current WTO monitoring and dispute settlement system is adequate to ensure timely compliance
Identify food aid that is not widely accepted as food aid and require stricter notification and consultation procedures. Current rules exist but they are imperfect. Food aid can have similar market effects as an export subsidy. However, food aid is not included in the schedule of reductions. Food aid that displaces commercial exports (for example, it is re-sold on the domestic market) will depress world prices while emergency food aid that increases total world consumption has the opposite effect. Actual food aid and export promotion programs have complex effects and so are problematic in a practical sense to determine if it constitutes an export subsidy or not. Therefore, the important point is to determine when the aid is a result of commercial export diversion in the exporting country, because the resulting effect may be trade distorting but cannot be categorized as an export subsidy. On the other hand, when the aid is resulting from surplus disposal, it may be used as a mechanism of price support, because it increases domestic price, creating the prerequisite for export subsidies: a price gap with depressed demand and increased supply. Therefore, it has the same effect as a cash export subsidy. If the commodity donated is re-sold in the domestic market of the recipient country, world price will only be affected if it is a large importer (and if it had the possibility to pay for the commodity in a normal transaction). If the commodity is re-exported from the recipient country, the trade distortion is more evident than otherwise
The current rules can be circumvented and there are some omissions and improper measures. Hence, rules need to be revised to make disciplines more effective. We identify loopholes, issues, and areas that should be given priority in the new negotiations to make the reduction commitments more effective. We categorize the key problems to be addressed as follows:
Circumvent ion
(1) Ban the possibility of front loading (the practice of using a different base period for export subsidies) for countries that evaded binding limits on export subsidies by choosing a different base period. Future schedule of reductions should be adjusted gradually such that the bound level at the end of the reduction period reflects the level of subsidies of the 1986-90 period for all the countries.
(2) Ban the possibility of banking (or “rollover”) export subsidies and have limits per year.
Otherwise, countries have far too much flexibility in meeting their commitments and allows for destabilization of world markets by subsidizing when world prices are low.
(3) Ban the use of export subsidies on component commodities – e.g., export subsidies on butter and skim milk powder allow milk product exports to rise once the limit on cheese export subsidy limits has been reached. Commitments are made on a product/product group basis, but the basis varies by the country. The EU committed to reducing subsidies on dairy on a product basis. On the other hand, Switzerland committed to reduce export subsidies on dairy products as a whole. It depends on the country. To the best of my knowledge, the EU is the only WTO member that is doing the bait-and-switch with component subsidies (through their inward-processing relief program).
(4) Have all commitments on a per product basis so countries cannot use product aggregation in the baseline as a means to circumvent commitments (this is sort of done already with the product groups—if this is to add value, specify a product categorization to use. But there are practical problems in aggregating. Products are aggregated into 23 commodity groups (22 groups plus ‘other agricultural products’), but the aggregation differs across countries, as well as the units reported. The aggregation of different products into the same group (as ‘fruits and vegetables’ for example) poses problems when comparing figures across countries that may refer to completely different products. The units used to report volumes for meats can be carcass weight or product weight, and for eggs they can be units, dozen, tons, or tons of shell-equivalents.
(5) Ban the possibility of circumvention of Volume Commitments: The notifications should account for the expenditures on export subsidies "as if" all the exports had received the highest per-unit offered in each period, as a means to avoid circumvention of the volume commitments
Omissions
(1) Include consumer financed export subsides – e.g., the pooling of premia is not included in the Agreement on Agriculture anywhere.
(2) Revise definition of producer financed export subsidies to recognize that they can only exist in conjunction with either a taxpayer or consumer financed export subsidy program (and the trade distorting effects differ)
(3) Because food aid historically was to dispose of surpluses, a code is required that meets the needs of the needy but does not distort the market
(4) A code is required on export credit and payment guarantees and direct financing as it can substitute for an export subsidy
(5) State trading enterprises (STEs) should have some disciplines that include increased notification requirements and transparency to prevent disguised export subsidies (why not extend the disciplines of Article XVII and Article II on STE imports to make them subject to similar limits on the ad valorem subsidies) good idea
Rule Revis ions
(6) Put less emphasis on the commitment on volume limits because these can easily be circumvented by putting higher per unit export subsidies but on only part of total exports of the commodity for the year (But this will mess up value limits just as surely!! Not if your volume is binding and you want to use your value limit – paper derives lots of cases where this can happen)
(7) The reductions should focus more in reducing value allowances. The value limit became less binding during the implementation period - one prefers the commitment that becomes less binding should be more binding to squeeze water where water is. Also, the value of the export subsidy is more variable, and causes larger asymmetries among sectors.

(8) Introduce a per unit export subsidy reduction commitment along the lines of a tariff to make reductions more effective than volume and value limits in liberalizing trade and also, in reducing the variability of protection with changes in market conditions that shift excess supply and demand curves
(9) All expenditures involving direct in-kind disposal of public stocks in export markets be regarded as normal export subsidies8
(10) Encourage the use of cash aid in place of food aid to minimize adverse effects on markets
(11) Develop a methodology to include the export subsidy component of export credits
A country needs import barriers to make export subsidies effective but not vice-versa so reductions in import barriers will automatically require export subsidy reductions in some instances. There are of course other issues not addressed her such as specific rules, actual percentage reductions, specific timelines and other implementation issues. We also ignore issues of product aggregation methods, Swiss formula versus other subsidy reduction formulas, subsidy peaks and dispersion, “dirty subsidification” in the baseline and the like.
8 Economists have argued that such schemes can decrease domestic prices and hence not act like an export subsidy but these types of analyses focus only on the effects of disposing public stocks on the world market and exclude acquisition costs.
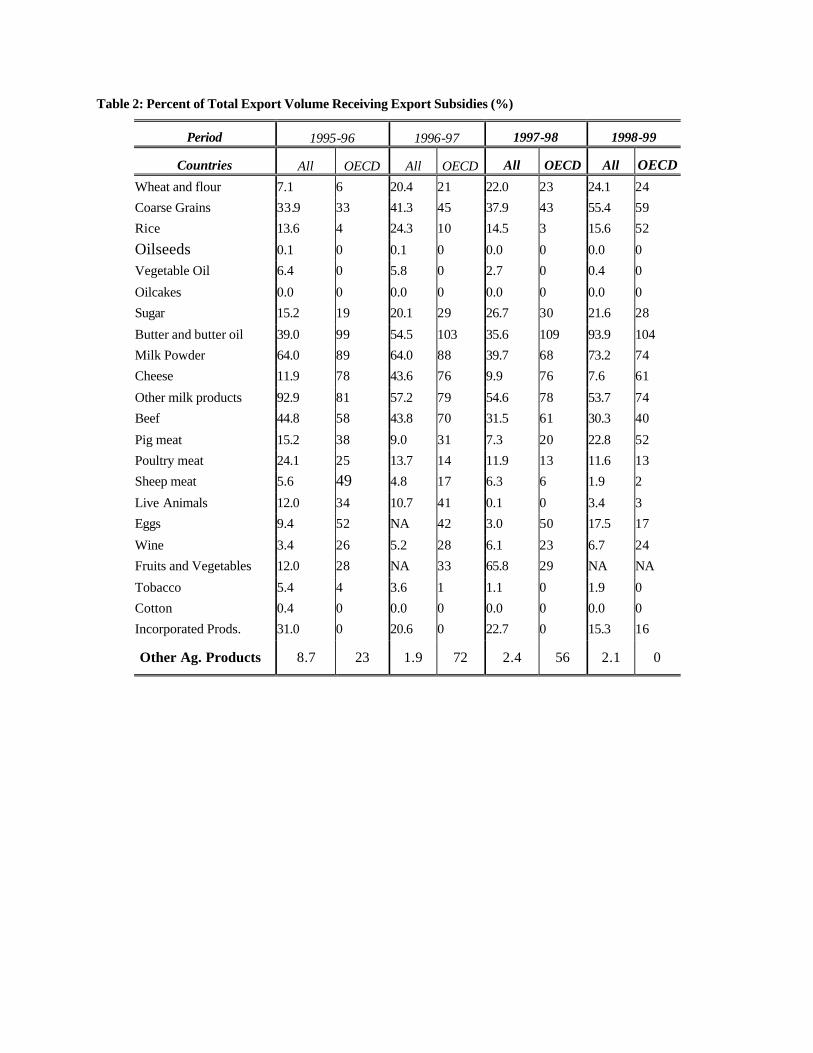
Table 2: Percent of Total Export Volume Receiving Export Subsidies (%)
Period 1995-96 1996-97 1997-98 1998-99
Countries All OECD All OECD All OECD All OECD Wheat and flour 7.1 6 20.4 21 22.0 23 24.1 24
Coarse Grains 33.9 33 41.3 45 37.9 43 55.4 59
Rice 13.6 4 24.3 10 14.5 3 15.6 52
Oilseeds 0.1 0 0.1 0 0.0 0 0.0 0
Vegetable Oil 6.4 0 5.8 0 2.7 0 0.4 0
Oilcakes 0.0 0 0.0 0 0.0 0 0.0 0
Sugar 15.2 19 20.1 29 26.7 30 21.6 28
Butter and butter oil 39.0 99 54.5 103 35.6 109 93.9 104
Milk Powder 64.0 89 64.0 88 39.7 68 73.2 74
Cheese 11.9 78 43.6 76 9.9 76 7.6 61
Other milk products 92.9 81 57.2 79 54.6 78 53.7 74
Beef 44.8 58 43.8 70 31.5 61 30.3 40
Pig meat 15.2 38 9.0 31 7.3 20 22.8 52
Poultry meat 24.1 25 13.7 14 11.9 13 11.6 13
Sheep meat 5.6 49 4.8 17 6.3 6 1.9 2
Live Animals 12.0 34 10.7 41 0.1 0 3.4 3
Eggs 9.4 52 NA 42 3.0 50 17.5 17
Wine 3.4 26 5.2 28 6.1 23 6.7 24
Fruits and Vegetables 12.0 28 NA 33 65.8 29 NA NA
Tobacco 5.4 4 3.6 1 1.1 0 1.9 0
Cotton 0.4 0 0.0 0 0.0 0 0.0 0
Incorporated Prods. 31.0 0 20.6 0 22.7 0 15.3 16
Other Ag. Products 8.7 23 1.9 72 2.4 56 2.1 0
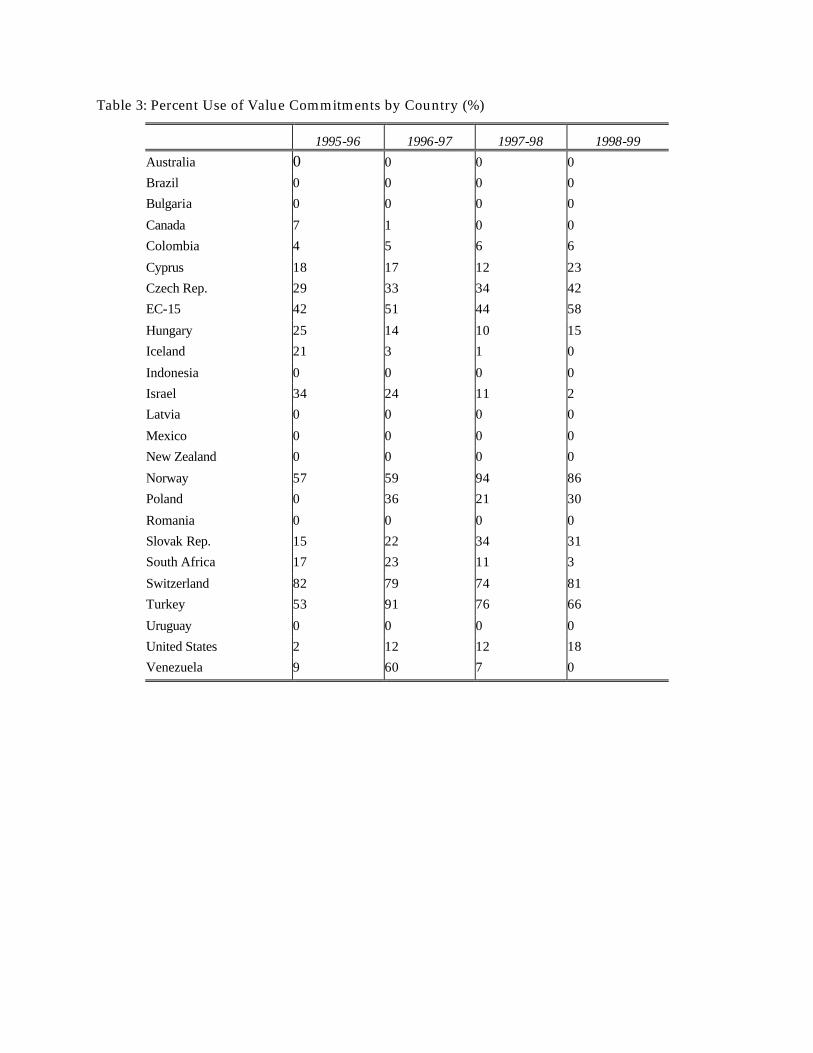
Table 3: Percent Use of Value Commitments by Country (%)
1995-96 1996-97 1997-98 1998-99
Australia 0 0 0 0
Brazil 0 0 0 0
Bulgaria 0 0 0 0
Canada 7 1 0 0
Colombia 4 5 6 6
Cyprus 18 17 12 23
Czech Rep. 29 33 34 42
EC-15 42 51 44 58
Hungary 25 14 10 15
Iceland 21 3 1 0
Indonesia 0 0 0 0
Israel 34 24 11 2
Latvia 0 0 0 0
Mexico 0 0 0 0
New Zealand 0 0 0 0
Norway 57 59 94 86
Poland 0 36 21 30
Romania 0 0 0 0
Slovak Rep. 15 22 34 31
South Africa 17 23 11 3
Switzerland 82 79 74 81
Turkey 53 91 76 66
Uruguay 0 0 0 0
United States 2 12 12 18
Venezuela 9 60 7 0

Table 4: Percent Allocation of Total Value Commitments by Commodity (%)
Period Base 1995-96 1996-97 1997-98 1998-99
Wheat and flour 17.86 21.54 21.40 20.86 19.93
Coarse Grains 12.47 11.94 11.96 11.95 11.64
Rice 1.12 1.16 1.30 1.38 1.68
Oiseeds 0.58 0.52 0.54 0.53 0.30
Vegetable Oil 0.82 0.91 0.91 0.90 0.92
Oilcakes 0.03 0.03 0.03 0.03 0.00
Sugar 5.62 5.52 5.57 5.62 5.80
Butter and butteroil 10.03 9.98 10.03 10.08 10.14
Milk Powder 4.17 4.06 4.11 4.20 4.27
Cheese 4.07 4.66 4.60 4.45 4.32
Other milk products 9.39 9.59 9.54 9.54 9.91
Beef 13.21 13.60 13.58 13.65 13.69
Pig meat 2.31 2.30 2.29 2.26 2.34
Poultry meat 1.37 1.27 1.26 1.23 1.30
Sheep meat 0.31 0.17 0.17 0.17 0.06
Live Animals 0.23 0.25 0.25 0.25 0.31
Eggs 0.49 0.48 0.49 0.49 0.51
Wine 0.51 0.47 .47 0.47 0.48
Fruits and Vegetables 2.44 1.99 2.09 2.41 2.73
Tobacco 0.67 0.77 0.74 0.71 0.61
Cotton 0.43 0.45 0.53 0.57 0.74
Incorporated Prods 6.32 6.45 6.17 6.23 6.28
Other Ag. Products 0.67 0.43 0.39 0.47 0.47

Table 5: Percent Use of the Total Value Commitments Allocated to Each Commodity Group (%)
Period 1995-96 1996-97 1997-98 1998-99
Wheat and wheat flour 4 11 7 22
Coarse Grains 18 24 18 57
Rice 18 41 19 13
Oilseeds 0 0 0 0
Vegetable Oil 47 31 7 1
Oilcakes 0 0 0 0
Sugar 48 72 112 121
Butter and butteroil 19 42 25 25
Milk Powder 31 46 38 70
Cheese 72 52 42 43
Other milk products 70 74 81 88
Beef 76 83 49 41
Pig meat 30 24 30 133
Poultry meat 68 43 52 64
Sheep meat 35 16 21 19
Live Animals 58 32 0 1
Eggs 22 14 25 33
Wine 89 109 72 58
Fruits and Vegetables 37 37 22 24
Tobacco 17 5 1 1
Cotton 0 0 0 0
Incorporated products 67 83 86 98
Other Ag. Products 5 24 3 4

Table 6: Percent Use of the Total Volume Commitments Allocated to Each Commodity Group (%)
Period 1995-96 1996-97 1997-98 1998-99
Wheat and wheat flour 8 27 26 39
Coarse Grains 33 54 42 96
Rice 17 44 30 29
Oilseeds 0.2 0.2 0 0
Vegetable Oil 13 15 11 2
Oilcakes 0 0 0 0
Sugar 34 50 88 74
Butter and butteroil 28 55 37 35
Milk Powder 66 63 54 80
Cheese 95 95 83 65
Other milk products 91 93 95 88
Beef 79 97 79 65
Pig meat 54 44 37 120
Poultry meat 74 71 77 74
Sheep meat 61 58 49 3
Live Animals 56 41 0.4 2
Wine 66 99 98 83
Tobacco 11 7 2 4
Other Ag. Products 13 2 4 7

Table 7: Countries Using Over 90% of Value Commitments
Member Commodity 1995-96 1996-97 1997-98 1998-99
Colombia Sugar 105 95 Cyprus Cheese 406 100 100 100 EC-15 Alcohol 90 106 EC-15 F & V 92 EC-15 Other milk prods 92 EC-15 Pig meat 155 EC-15 Rice 141 EC-15 Sugar 122 134 EC-15 Wine 111 Hungary Corn 282 413 Hungary Red pepper meal 147 141 Norway Bovine meat 106 Norway Cheese 113 117 Norway Poultry meat 243 Norway Processed products 97 92 Norway Sheep meat 112 South Africa Cocoa and prep. 108 323 99 South Africa Tea 112 South Africa Waters 144 South Africa Wine products 94 179 107 Switzerland Cattle for Breeding 94 Switzerland Fruits 91 Switzerland Processed Prods. 100 Turkey Creams 98 Turkey Chocolate... 97 Turkey F & V 99 99 100 Turkey Eggs/dozen 100 Turkey Poultry meat 99 United States Cheese 96 United States Other milk prods 100 129 United States Skim milk powder 136 Venezuela F & V 96

Table 8: Countries Using Over 90% of Volume Commitments
Member Commodity 1995-96 1995-96 1995-96 1995-96
Colombia Fruits 115 138 Colombia Processed prod 129 91 19 Colombia Sugar confection.. 316 473 332 1033 Cyprus Cheese 189 100 99 100 EC-15 Coarse grains 90 123 EC-15 Sugar 118 112 EC-15 Rice 144 103 99 EC-15 Other milk prod 98 100 102 91 EC-15 Cheese 99 99 EC-15 Olive oil 96 104 EC-15 Beef meat 90 110 94 EC-15 Poultry meat 96 99 105 99 EC-15 Wine 111 115 98 EC-15 F & V, fresh 99 99 98 93 EC-15 Eggs 90 104 Norway Sheep meat 142 106 Norway Pig meat 106 Norway Cheese 102 122 Norway Eggs and prods. 99 117 Norway Poultry meat 214 Poland Sugar 116 149 119 Slovak Rep Sugars... 100 100 Slovak Rep Other dairy prods. 95 99 110 South Africa Beer 106 105 South Africa Other milk prods. 139 South Africa Wine products 103 619 227 Switzerland Cattle for Breeding 111 Turkey F&V, fresh or proc. 100 97 100 100 Turkey Poultry meat 100 United States Other milk prods. 100 107 United States Skim milk powder 104 154 United States Cheese 100 93

Table 9: Value Front-Loading
1986-90 Outlays
1991-92 Outlays
1995-96 Outlay Commitment
Increase in Base Outlays
Country Commodity Local Currency %
Canada Butter 17,227 44,444 38,874 158
EC-15 Beef meat 1,959 2,029 1,923 4
EC-15 Cheese 534 550 594 3
EC-15 Incorporated Prods. 648 702 717 8
EC-15 Poultry meat 142 147 136 4
EC-15 Raw tobacco 63 106 97 69
EC-15 Wheat 2,015 2,255 2,309 12
Norway Bovine meat 55 116 102 112
Norway Cheese 384 596 538 55
Norway F & V 1 1.4 1.3 56
Norway Whey powder 0 4 5.30 4.4 1225
USA Eggs (dozen) 2,505,998 8,784,611 7,587,922 251
USA Other milk prods. 3,277,200 17,244,750 14,374,120 426
USA Rice 3,701,445 18,373,235 15,705,850 396
USA Vegetable oils 22,004,532 60,734,841 52,959,518 176
USA Wheat 568,460,338 845836,154 765,499,231 49
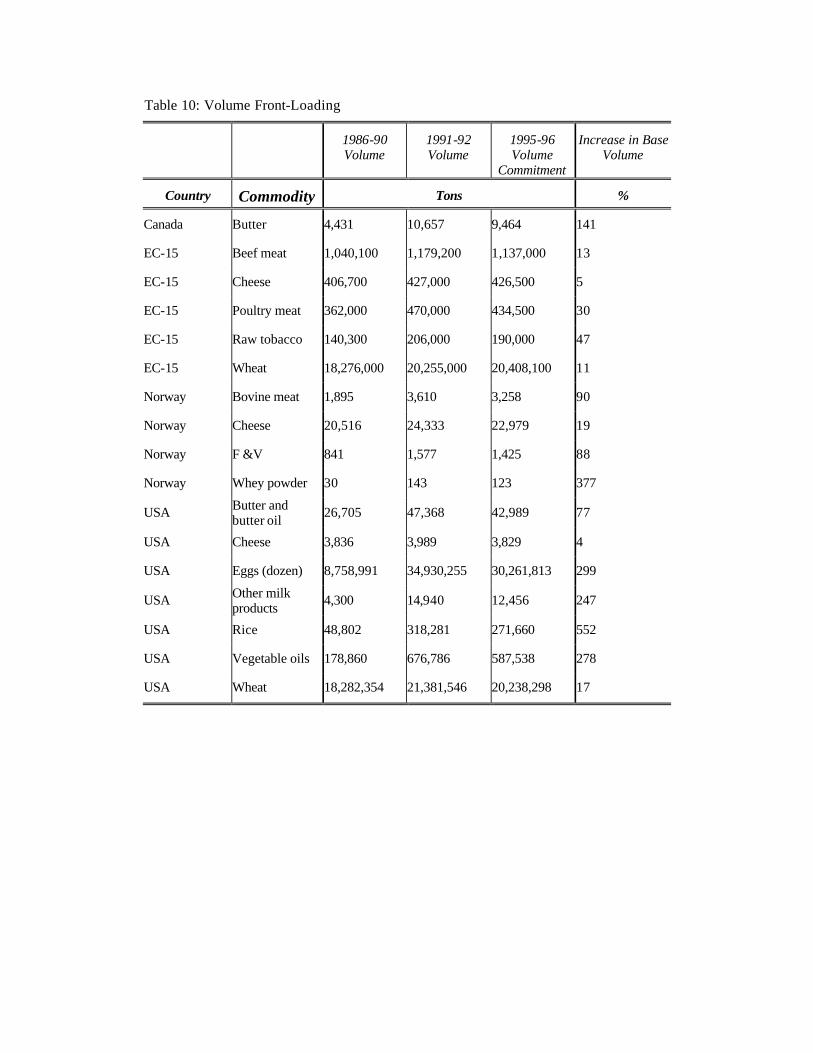
Table 10: Volume Front-Loading
1986-90 Volume
1991-92 Volume
1995-96 Volume
Commitment
Increase in Base Volume
Country Commodity Tons %
Canada Butter 4,431 10,657 9,464 141
EC-15 Beef meat 1,040,100 1,179,200 1,137,000 13
EC-15 Cheese 406,700 427,000 426,500 5
EC-15 Poultry meat 362,000 470,000 434,500 30
EC-15 Raw tobacco 140,300 206,000 190,000 47
EC-15 Wheat 18,276,000 20,255,000 20,408,100 11
Norway Bovine meat 1,895 3,610 3,258 90
Norway Cheese 20,516 24,333 22,979 19
Norway F &V 841 1,577 1,425 88
Norway Whey powder 30 143 123 377
USA Butter and butter oil 26,705 47,368 42,989 77
USA Cheese 3,836 3,989 3,829 4
USA Eggs (dozen) 8,758,991 34,930,255 30,261,813 299
USA Other milk products 4,300 14,940 12,456 247
USA Rice 48,802 318,281 271,660 552
USA Vegetable oils 178,860 676,786 587,538 278
USA Wheat 18,282,354 21,381,546 20,238,298 17
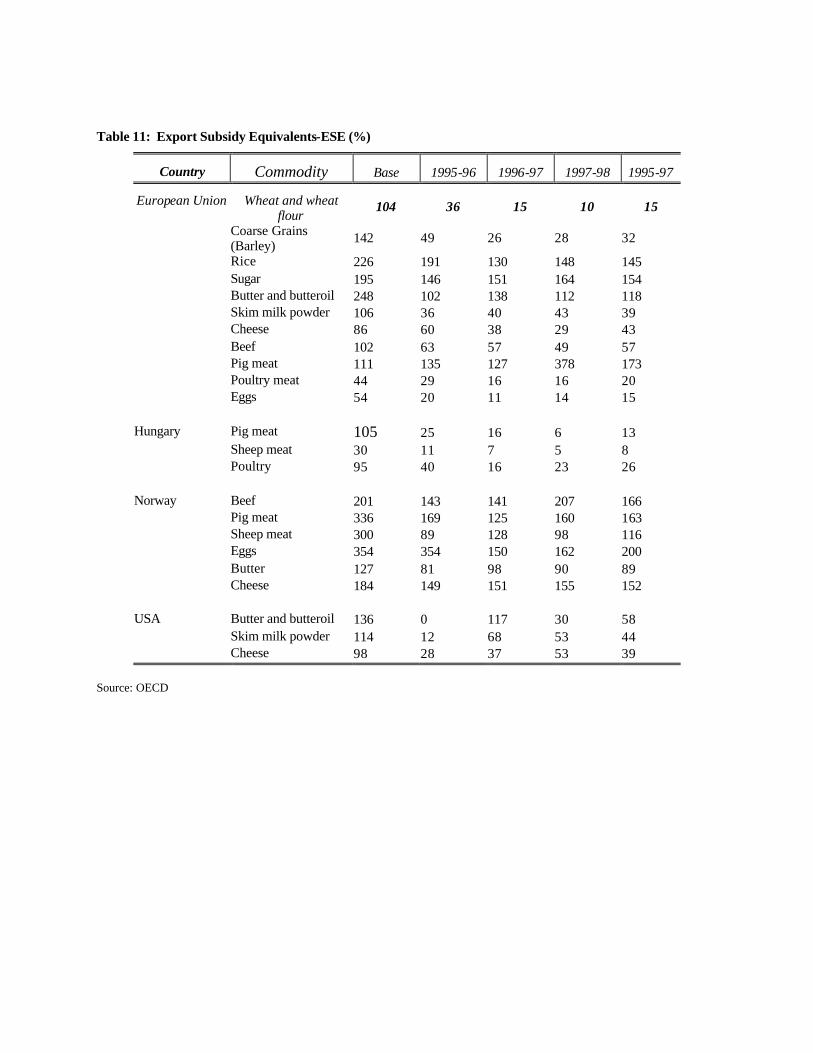
Table 11: Export Subsidy Equivalents-ESE (%)
Country Commodity Base 1995-96 1996-97 1997-98 1995-97
European Union Wheat and wheat flour
104 36 15 10 15
Coarse Grains (Barley) 142 49 26 28 32
Rice 226 191 130 148 145 Sugar 195 146 151 164 154 Butter and butteroil 248 102 138 112 118 Skim milk powder 106 36 40 43 39 Cheese 86 60 38 29 43 Beef 102 63 57 49 57 Pig meat 111 135 127 378 173 Poultry meat 44 29 16 16 20 Eggs 54 20 11 14 15 Hungary Pig meat 105 25 16 6 13 Sheep meat 30 11 7 5 8 Poultry 95 40 16 23 26 Norway Beef 201 143 141 207 166 Pig meat 336 169 125 160 163 Sheep meat 300 89 128 98 116 Eggs 354 354 150 162 200 Butter 127 81 98 90 89 Cheese 184 149 151 155 152 USA Butter and butteroil 136 0 117 30 58 Skim milk powder 114 12 68 53 44 Cheese 98 28 37 53 39
Source: OECD

Chart 1: Baseline Levels
Chart 1: Baseline Levels
EC-1570.92%
Poland3.75%
Mexico3.58%
Canada2.71%
Switzerland-Liecht2.37%
Israel2.19%
Colombia1.81%
South Africa1.66%
Czech Republic1.04%
Bulgaria0.98%
Hungary0.80%
Turkey0.67%
Norway0.59%
Brazil0.46%
Australia0.44%
Slovak Republic0.42%
Venezuela0.17%
Indonesia0.14%
Iceland0.12%
Cyprus0.08%
Uruguay0.01%
Romania0.01%
Other6.57%
United States4.45%
New Zealand0.65%

Figure 1: Volume versus Expenditure Limits on Exports
ES
ED
Qft Q1 Q0 Exports
Price
Pd
PW

Figure 2: Shifts in the Free Trade Equilibrium with Export Volume Limits
(a) (b)
ES
ES’
ED
Exports
P
Q0
ES ES’
ES’’
ED
Q0
P
Exports

ABARE (2001 ) Agricultural Export Measures in TO Negotiations Research Report 01.12, Australian Bureau of Agricultural and Resource Economics, Canberra, Australia.
Abraham, F. et al. (1992). Towards an EC Policy on Export Financing Subsidies: Lessons from the 1980s and Prospects for Future Reform. World Economy, v15, n3, 389-405.
Alston, Julian M. and Richard Gray. 1998. “Export Subsidies and State Trading: Theory and Application to Canadian Wheat,” in World Agricultural Trade edited by Tuelay Yildirim, A. Schmitz and W. Hartley Furtan, Westview Press.
Anania, G., Bohman, M., and Carter, M.A. (1992). “United States Export Subsidies in Wheat: Strategic Trade Policy or Expensive Beggar-Thy-Neighbor Tactic”. American Journal of Agricultural Economics, 74 (August), 534-45.
Chambers, R.G. and R.L. Paarlberg (1991). Are More Exports Always Better? Comparing Cash and In-Kind Export Subsidies. American Journal of Agricultural Economics, 73142-54.
de Gorter, H. 1999. “Market Access, Export Subsidies and Domestic Support Measures: Issues
and Suggestions for New Rules in the Agreement on Agriculture” in Agriculture and the
New Trade Agenda in the WTO 2000 Negotiations, M. Ingco ed., forthcoming 2002
Cambridge University Press, Cambridge.
Gardner, B.L. (1996). “The Political Economy of US Export Subsidies for Wheat.” In Anne
Krueger, The Political Economy of American Trade Policy. Chicago : University of
Chicago Press.
Houck, J.P., “The Basic Economics of an Export Bonus Scheme”, North Central Journal of
Agricultural Economics, Vol. 8, No. 2, July 1986, pp. 227-235
IATRC (2001a) Export Competition: Issues and Options in the Agricultural Negotiations The
International Agricultural Trade research Consortium, Commissioned Paper 15, May.
IATRC (2001b) The Current WTO Agricultural Negotiations: Options for Progress The
International Agricultural Trade research Consortium, Commissioned Paper 18, May.
Leetmaa, S. 1997. “EU Export Subsidy Commitments Not Yet Binding, But Future Uncertain”
Economic Research Service Agriculture in the WTO/WRS-97-5, December.
Leetmaa, S. and K. Ackerman 1998. “Export Subsidy Commitments: Few are Binding, But
Some Members Try to Evade Them” Economic Research Service Agriculture in the
WTO/WRS-98-44, December (updated 1999 in USDA’s WTO Briefing Room, 1999).
McCalla, A. (1999). Closing comments at the World Bank Conference on “Agriculture and the New Trade Agenda from a Developmental Perspective: Interest and Options in the Next WTO Negotiations” Geneva 2 October.
Peterson, J. M., B. J. Minten and H. de Gorter. (1999). “Economic Costs of the U.S. Wheat Export Enhancement Program: Manna from Heaven or from Taxpayers?” IATRC Working Paper 99-2, February.

Ruiz, L. 2000. “The Impacts of Export Subsidy Reduction Commitments in the Agreement on
Agriculture on International Trade: A General Assessment”. M.S. thesis, August, Cornell
University.
Ruiz, L. and H. de Gorter (2001) “The Impacts of Export Subsidy Reduction Commitments in the
Agreement on Agriculture on International Trade” in Global Agriculture in the New
Millennium. Lyn Kennedy (editor) 2001 Kluwer Academic Publishers, Dordrecht.
Schluep, I. (1999). The Law and Economics of Consumer Only Financed Export Subsidies: A Context for the WTO Panel on Canadian Dairy Pricing Policy. M.S. thesis, Cornell University.
Schluep, I. and H. de Gorter (1998). “The Definition of Export Subsidies and the Agreement on Agriculture,” in G. Peters (ed.), Tomorrow’s Agriculture: Incentives, Institutions, Infrastructure and Innovations”, Oxford University Press, 2001
Sumner, D. (1996). The Role of Domestic Market price Regulations in International Trade: the Case of Dairy Policy in the United States. Paper presented to the AEA San Francisco, January.
Veeman, M., M. Fulton and B. Larue (1999) “International Trade in Agricultural and Food
Products: The Role of State Trading Enterprises” Agriculture and Agri-Food Canada
Report # 1998E, Ottawa, Canada.
World Trade Organization (1999-2000). Country Notifications on Export Subsidies [On-Line]. Available: http://www.wto.org/wto/ddf/ep/search.html. Code: G/AG/N.