Export Led Growth: Evidence from a panel cointegration ...
18
Export Led Growth in the Caribbean: Evidence from a panel cointegration assessment AUTHORS: ROGER HOSEIN, JEETENDRA KHADAN AND NIRVANA SATNARINE-SINGH CONFERENCE ON THE ECONOMY 2016 OCTOBER 13 TH – 14 TH 2016 1
Transcript of Export Led Growth: Evidence from a panel cointegration ...

Export Led Growth in the Caribbean:
Evidence from a panel cointegration
assessment
AUTHORS: ROGER HOSEIN, JEETENDRA KHADAN AND NIRVANA SATNARINE-SINGH
CONFERENCE ON THE ECONOMY 2016
OCTOBER 13TH – 14TH 2016
1

Outline of Presentation
Introduction
Theoretical Support of ELG
Evolution of Empirical Literature
Empirical Studies using Panel Data
Data
Model
Methodology
Empirical Results
Analysis of Results
Conclusion
2

Introduction
As small open economies, the export sector of the Caribbean region is a substantial source of economic growth, accounting for, on average, 43 percent of GDP since 2010.
Theoretically, exports has been linked to increased productivity through numerous avenues (Feder, 1982). Export oriented sectors are assumed to increase factor productivity which acts as an externality, eventually radiating into the non export sector.
From a Caribbean perspective, the extent to which the export sector has successfully spawned growth through productivity in other sectors remain ambiguous. While this has been a significant topic for policy makers, there are no recent studies on the ELG hypothesis for the region. The few available studies are dated and focus on a single country through time series data analysis.
3
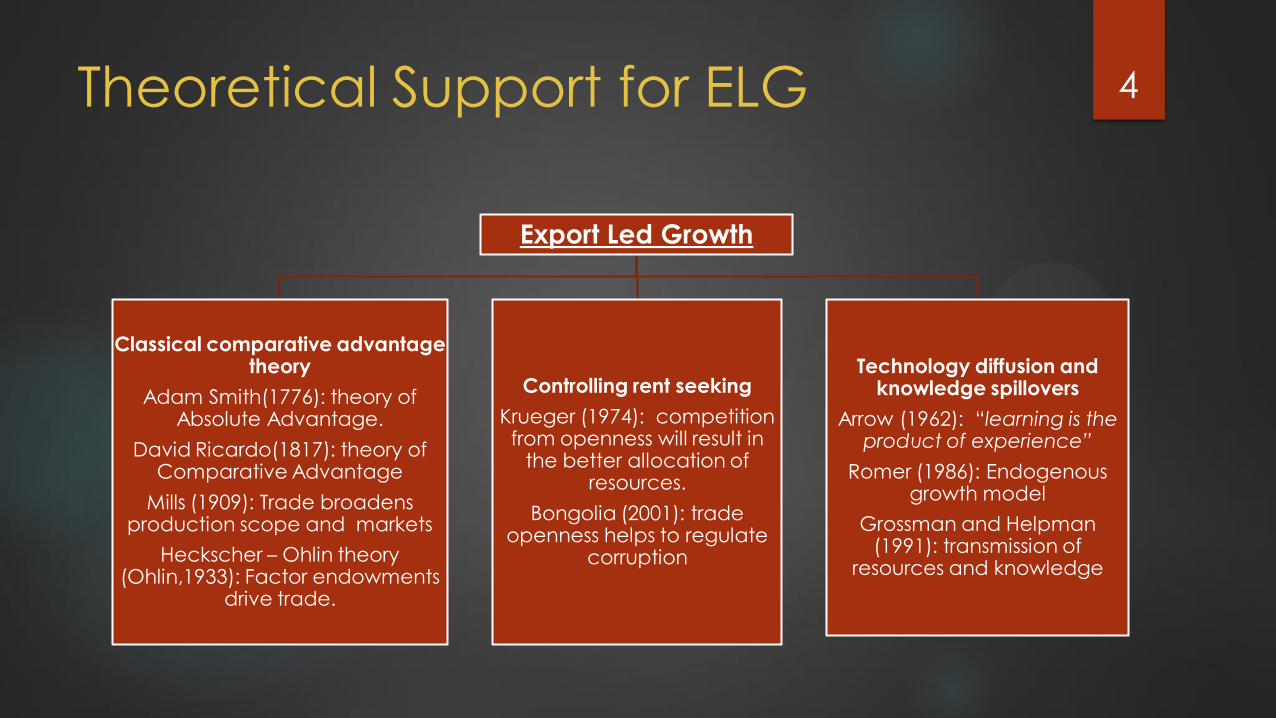
Theoretical Support for ELG
Export Led Growth
Classical comparative advantage theory
Adam Smith(1776): theory of Absolute Advantage.
David Ricardo(1817): theory of Comparative Advantage
Mills (1909): Trade broadens production scope and markets
Heckscher – Ohlin theory (Ohlin,1933): Factor endowments
drive trade.
Controlling rent seeking
Krueger (1974): competition from openness will result in
the better allocation of resources.
Bongolia (2001): trade openness helps to regulate
corruption
Technology diffusion and knowledge spillovers
Arrow (1962): “learning is the product of experience”
Romer (1986): Endogenous growth model
Grossman and Helpman (1991): transmission of
resources and knowledge
4

Evolution of empirical literature
Early studies conducted cross sectional analyses using correlation and least squares techniques. Some of the classic work done in this era are those by Emery (1967), Kravis (1970), and Balassa (1978).
This stage was succeeded by a production function approach. The often cited papers in this period include those of Michalopolous and Jay (1973), Balassa (1978), Tyler (1981) and Feder (1983).
During the 1970's and 80's, there was a switch in the concentration from cross sectional studies to time series studies. Foundation studies in this period include those of Jung and Marshall (1985) and Chow (1987).
Recent studies have utilised more sophisticated time series econometric techniques including co-integration tests. Some of the key research work thus far, in this field, has been that of Bahmani- Oskooee et. al. (1991), Biswal et. al. (1996) and Ghatak et. al. (1997).
The most recent studies utilize econometric techniques to test the long run relationship between the variables using panel data. Some prominent studies in this area of study includes Bahmani-Oskooee, Economidou and Goswami (2005), Parida and Sahoo (2007) and Dreger and Herzer (2013.
5

Panel data empirical literature
Author(s) Countries/Years Method Concluding Remarks
Biyase and Zwane (2014) 30 African Countries (1990-2005)
Pooled OLS, Fixed Effect,
Random Effects, 2SLS Export Led Growth
Parida and Sahoo (2007) 4 Asian Countries Pedroni Panel Cointegration
Export and Manufacturing
Industry Export-led Growth
Hypothesis
Dreger and Herzer (2013)
45 developing countries (1971-
2005)
Pedroni Panel Cointegration,
FMOLS, DOLS
Long run export decreasing
growth, short run export led
growth
Bahmani-Oskooee, Economidou
and Goswami (2005)
61 developing countries 1960-
1999 Panel Cointegration
Exports as the dependent
variable, there is evidence of
cointegration When the
dependent variable is output there
is no indication of cointegration
Pazim (2007)
Philippines, Indonesia and
Malaysia 1985-2002
(a) pooled ordinary least squares
(b) one way fixed effects (c) two
way fixed effects d) one way
random effects
BIMP-EAGA countries are not
export-driven economies
Yee Eee (2016) Sub Saharan Africa
Panel Cointegration, FMOLS and
DOLS
Positive relation from exports to
growth
6

Model
7

Data
Data on GDP, exports and gross capital formation (all in constant 2005 $US) was collected for 13 Caribbean countries for the period 1970 to 2013 from the United Nations Statistic Division’s Statistical database. The natural logarithms of all the data was taken.
The countries are namely Antigua and Barbuda, the Bahamas, Barbados, Dominica Grenada, Guyana, Haiti, Jamaica, St. Kitts and Nevis, St. Lucia, Suriname, St. Vincent and the Grenadines and Trinidad and Tobago.
These economies are separated into 10 tourism based economies and three (Guyana, Suriname and Trinidad and Tobago) commodity based.
This classification was based on the composition of GDP in each country, for the period 2011-2014, the service sector accounts for more than 50% of GDP in economies classified as service based.
LN denotes logged Non export GDP, LX denotes logged exports and LK denotes logged GCF.
8

Methodology
Unit Root Tests to ensure that all variables are
integrated of the same order. These tests can be
separated into two categories:
1) Assuming common unit root processes: Levin, Lin
and Chu (LLC) and Breitung tests
2) Assuming individual unit root processes: Im,
Pesaran and Shin (IPS), ADF-Fisher and PP-Fisher
Cointegration tests can be conducted if all variables
were shown to be integrated of the same
order. Two tests for cointegration were used:
1) Pedroni Tests: four “within dimension”
statistics or panel statistics and three “between
dimensions” statistics or group statistics.
2) Johansen Fisher Tests: Maddala and Wu (1999)
uses a Fisher’s (1932) consideration to combine
individuals tests for cointegration in panel
data by combining individual cross‐sections
Johansen tests for cointegration
Direction of causality: If the variables are cointegrated, the
direction of long run causality can be established using:
1) Panel VECM: based on assumptions used for the
Johansen Fisher Tests
2) FMOLS and DOLS: Pooled and Grouped
coefficients for the independent variables
are estimated.
Short Run causality can be determined using the
VECM (given cointegration) and the bi-variate Granger Causality
test.
9
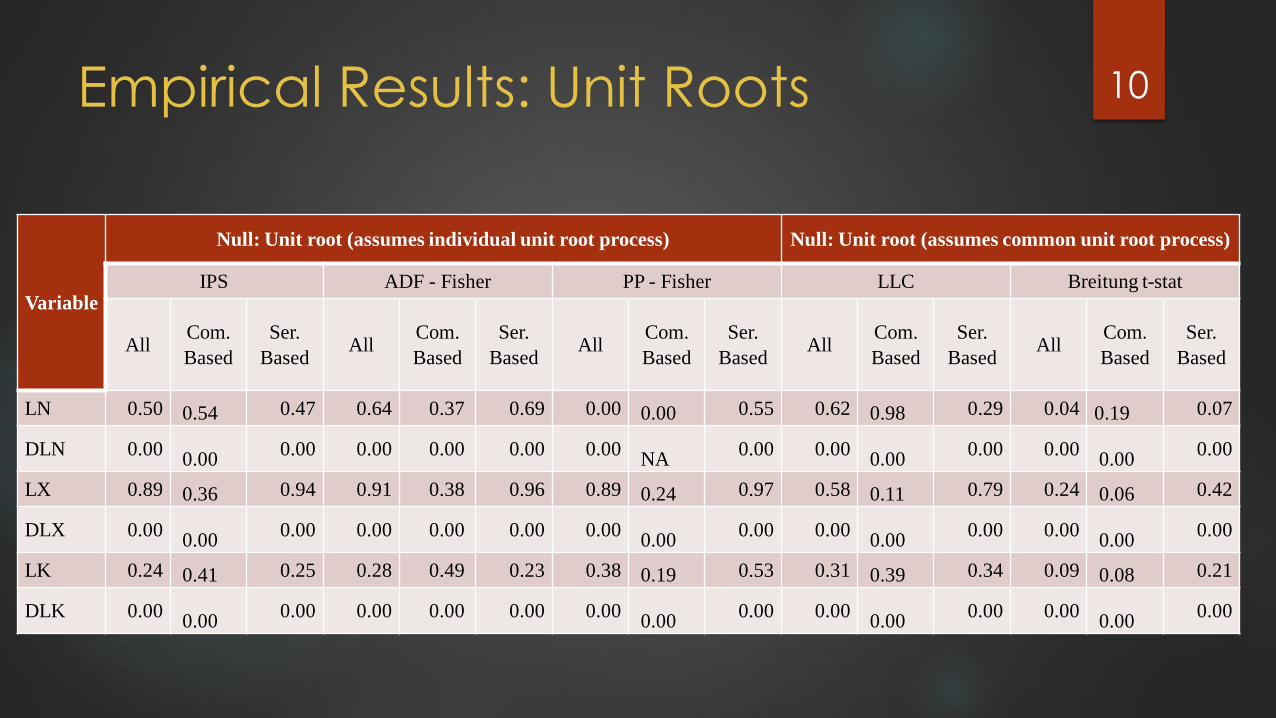
Empirical Results: Unit Roots
Variable
Null: Unit root (assumes individual unit root process) Null: Unit root (assumes common unit root process)
IPS ADF - Fisher PP - Fisher LLC Breitung t-stat
All Com.
Based
Ser.
Based All
Com.
Based
Ser.
Based All
Com.
Based
Ser.
Based All
Com.
Based
Ser.
Based All
Com.
Based
Ser.
Based
LN 0.50 0.54 0.47 0.64 0.37 0.69 0.00 0.00 0.55 0.62 0.98 0.29 0.04 0.19 0.07
DLN 0.00 0.00
0.00 0.00 0.00 0.00 0.00 NA
0.00 0.00 0.00
0.00 0.00 0.00
0.00
LX 0.89 0.36 0.94 0.91 0.38 0.96 0.89 0.24 0.97 0.58 0.11 0.79 0.24 0.06 0.42
DLX 0.00 0.00
0.00 0.00 0.00 0.00 0.00 0.00
0.00 0.00 0.00
0.00 0.00 0.00
0.00
LK 0.24 0.41 0.25 0.28 0.49 0.23 0.38 0.19 0.53 0.31 0.39 0.34 0.09 0.08 0.21
DLK 0.00 0.00
0.00 0.00 0.00 0.00 0.00 0.00
0.00 0.00 0.00
0.00 0.00 0.00
0.00
10

Empirical Results: Johansen Fisher
Countries
Hypothesized No.
of CE(s)
Fisher Stat (from
trace test)
Prob. (from trace
test)
Fisher Stat (from
max-eigen test)
Prob. (from max
eigen test)
All Countries
None *** 47.70 0.006 44.37 0.014
At most 1 19.72 0.805 19.83 0.800
At most 2 12.88 0.985 12.88 0.985
Commodity based
Countries
None 6.940 0.326 6.758 0.344
At most 1 2.832 0.829 4.902 0.556
At most 2 0.709 0.994 0.709 0.994
Service Based
countries
None *** 40.76 0.004 37.62 0.010
At most 1 16.89 0.660 14.92 0.780
At most 2 12.17 0.910 12.17 0.910
11

Empirical Results: Pedroni
Alternative hypothesis: common AR coefs. (within-dimension)
Panel Statistics All countries Commodity Based Ser. Based
Panel v-Statistic 0.000* 0.264 0.000*
Panel rho-Statistic 0.021* 0.082* 0.161
Panel PP-Statistic 0.000* 0.000* 0.048*
Panel ADF-Statistic 0.332 0.887 0.021*
Alternative hypothesis: individual AR coefs. (between-dimension)
Group Statistics All countries Commodity Based Ser. Based
Group rho-Statistic 0.323 0.527 0.287
Group PP-Statistic 0.000* 0.005* 0.008*
Group ADF-Statistic 0.464 0.969 0.130 *
12

Empirical Results: Panel VECM
Cointegrating Eq: Coefficients of CointEq1 (tstat) ALL Coefficients of CointEq1
Ser. Based
LN(-1) 1 1
LX(-1) 1.801 (4.86) 2.489 (5.466)
LK(-1) -3.160 (-8.07) -3.804 (-8.163)
TREND(70) 0.001 (1.29) 0.002 (1.535)
C 4.762 3.258
Coefficients for D(LN) Coefficients of VECM(tstat) : ALL Coefficients of VECM (tstat): Ser. Based
C(1) 0.001 (0.245) 0.004 (0.706)
C(2) 0.062 (1.372) 0.019 (0.352)
C(3)*** 0.130 (2.492) 0.101 (1.686)
C(4)** 0.076 (2.327) 0.080 (2.013)
C(5)*** 0.023 (3.335) 0.026 (3.267)
D(LN) = C(1)*( ETC(-1)) + C(2) *D(LN(-1)) + C(3)*D(LX(-1)) + C(4)*D(LK(-1)) + C(5)
13

Empirical Results: FMOLS and DOLS
estimates
Panel Method Variable
All Countries Ser. Based Countries
FMOLS DOLS FMOLS DOLS
Coefficient t-Statistic Coefficient t-Statistic Coefficient t-Statistic Coefficient t-Statistic
Pooled
(Between)
LX -0.593 -8.01 -0.587 -6.179 -0.651 -7.468 -0.702 -6.207
LK 0.39 6.3 0.436 5.203 0.371 5.299 0.41 4.059
Grouped
(Within)
LX -0.519 -10.447 -0.539 -6.911 -0.609 -11.466 -0.67 -7.906
LK 0.47 10.71 0.557 6.548 0.523 11.407 0.624 6.683
14
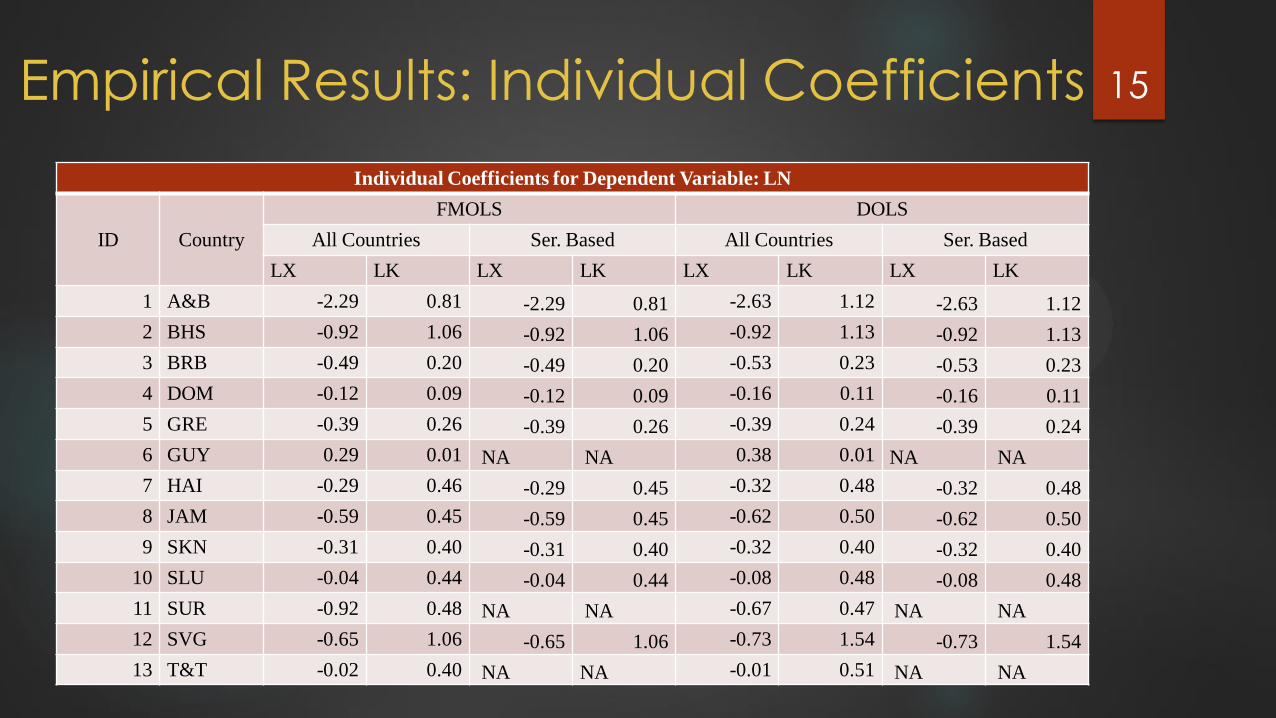
Empirical Results: Individual Coefficients
Individual Coefficients for Dependent Variable: LN
ID Country
FMOLS DOLS
All Countries Ser. Based All Countries Ser. Based
LX LK LX LK LX LK LX LK
1 A&B -2.29 0.81 -2.29 0.81 -2.63 1.12 -2.63 1.12
2 BHS -0.92 1.06 -0.92 1.06 -0.92 1.13 -0.92 1.13
3 BRB -0.49 0.20 -0.49 0.20 -0.53 0.23 -0.53 0.23
4 DOM -0.12 0.09 -0.12 0.09 -0.16 0.11 -0.16 0.11
5 GRE -0.39 0.26 -0.39 0.26 -0.39 0.24 -0.39 0.24
6 GUY 0.29 0.01 NA NA 0.38 0.01 NA NA
7 HAI -0.29 0.46 -0.29 0.45 -0.32 0.48 -0.32 0.48
8 JAM -0.59 0.45 -0.59 0.45 -0.62 0.50 -0.62 0.50
9 SKN -0.31 0.40 -0.31 0.40 -0.32 0.40 -0.32 0.40
10 SLU -0.04 0.44 -0.04 0.44 -0.08 0.48 -0.08 0.48
11 SUR -0.92 0.48 NA NA -0.67 0.47 NA NA
12 SVG -0.65 1.06 -0.65 1.06 -0.73 1.54 -0.73 1.54
13 T&T -0.02 0.40 NA NA -0.01 0.51 NA NA
15

What do these results mean?
What accounts for the negative spillover effects from exports to non export GDP for most Caribbean economies?
Although no econometric evidence have been presented, the concept of a declining positive contribution of the export sector has become a topic of debate for many Caribbean scholars in the recent years.
There are numerous reasons cited in the literature for the failure of the theoretically superior export led growth model particularly as it relates Caribbean countries.
One major reason for the current trade pattern of the region is due to the preferential market access granted to these countries by developed countries, particularly the EU.
A pivotal avenue by which the economies can improve their situation has to do with their ability to effectively diversify both market and products.
16

Conclusion
No significant long run relation between exports and non export GDP for commodity
based economies.
The overall results point to a case of export decreasing non export GDP growth for 12
out of the 13 countries, where Guyana is the exception.
Using the terminology of Feder (1981), “the marginal externality effect of exports on the
output of the non export sector” is negative.
Furthermore, while there has been no recent econometric evaluation of the export led
growth hypothesis in the region, the results of this paper is analytically supported by a
cadre of scholars, with one indication that the usual export oriented strategy in the
Caribbean has “run out of steam.”
17

Thank You.
18