Export dynamics and sales at home - CEPII · également confirmé par l’étude du comportement...
49
1 No 2011 – 33 December DOCUMENT DE TRAVAIL Export Dynamics and Sales at Home _____________ Nicolas Berman, Antoine Berthou & Jérôme Héricourt
Transcript of Export dynamics and sales at home - CEPII · également confirmé par l’étude du comportement...

1
No 2011 – 33
December
DO
CU
ME
NT
DE
TR
AV
AI
L
Export Dynamics and Sales at Home _____________
Nicolas Berman, Antoine Berthou & Jérôme Héricourt

CEPII, WP No 2011-33 Export dynamics and sales at home
TABLE OF CONTENTS
Non-technical summary . . . . . . . . . . . . . . . . . . . . . . . . . . . . . . . . . 3Abstract . . . . . . . . . . . . . . . . . . . . . . . . . . . . . . . . . . . . . . . . . . 4Résumé non technique . . . . . . . . . . . . . . . . . . . . . . . . . . . . . . . . . . 5Résumé court . . . . . . . . . . . . . . . . . . . . . . . . . . . . . . . . . . . . . . . 61. Introduction . . . . . . . . . . . . . . . . . . . . . . . . . . . . . . . . . . . . . . 72. Data and stylized facts . . . . . . . . . . . . . . . . . . . . . . . . . . . . . . . . 10
2.1. Database . . . . . . . . . . . . . . . . . . . . . . . . . . . . . . . . . . . . . 102.2. Descriptive statistics . . . . . . . . . . . . . . . . . . . . . . . . . . . . . . 11
3. Empirical methodology . . . . . . . . . . . . . . . . . . . . . . . . . . . . . . . . 124. Main Results . . . . . . . . . . . . . . . . . . . . . . . . . . . . . . . . . . . . . 15
4.1. Baseline regressions . . . . . . . . . . . . . . . . . . . . . . . . . . . . . . . 154.2. Robustness checks . . . . . . . . . . . . . . . . . . . . . . . . . . . . . . . 194.3. A quasi-natural experiment: the 1997-1998 Asian crisis . . . . . . . . . . . . 23
5. Channels of transmission . . . . . . . . . . . . . . . . . . . . . . . . . . . . . . . 265.1. Liquidity . . . . . . . . . . . . . . . . . . . . . . . . . . . . . . . . . . . . 26
6. Conclusions . . . . . . . . . . . . . . . . . . . . . . . . . . . . . . . . . . . . . . 317. Instruments: Robustness . . . . . . . . . . . . . . . . . . . . . . . . . . . . . . . 378. Asymmetry . . . . . . . . . . . . . . . . . . . . . . . . . . . . . . . . . . . . . . 389. Factor accumulation vs. TFP gains . . . . . . . . . . . . . . . . . . . . . . . . . . 3910. Data Appendix . . . . . . . . . . . . . . . . . . . . . . . . . . . . . . . . . . . . 40
10.1. Main interest variables . . . . . . . . . . . . . . . . . . . . . . . . . . . . . 4010.2. Instruments and controls for domestic demand . . . . . . . . . . . . . . . . . 41
2

CEPII, WP No 2011-33 Export dynamics and sales at home
EXPORT DYNAMICS AND SALES AT HOME
Nicolas BermanAntoine Berthou
Jérôme Héricourt
NON-TECHNICAL SUMMARY
The sales of a firm are distributed across several markets, each of these markets being identified by aspecific location and a particular product. How sales between these different markets interplay, beyondthe simple correlation of market-specific shocks, is unclear, though it may be an important determinantof firm-level dynamics. More generally, the interconnections between sales across markets have im-portant implications for the transmission of foreign demand shocks, exchange rate movements or tradepolicies to the domestic economy.This paper provides an empirical investigation of this question through the lens of the relationshipbetween French firms’ domestic sales and exports. As sales decisions across markets are likely tobe simultaneously determined, we develop a strategy that identifies variations in the foreign demandaddressed to the firms to predict exogenous changes in exports, and their effect on the firms’ domesticsales. The different dimensions of our data allows us to construct instruments that capture the demandspecifically addressed to a given firm in the foreign markets (destinations and products) it serves, whilecontrolling for the conditions it faces in the domestic market.Our empirical analysis relies on a large firm-level dataset containing both firm-level trade data fromthe French Customs and balance-sheet information over the period 1995-2001, at a yearly frequency.In particular, the balance-sheet data contains domestic and foreign turnovers, our main variables ofinterest. The customs data contains firm-level exports and imports by product and destination. Thisinformation is used together with import data at the product-destination level to construct the demandaddressed to firms in both foreign and domestic markets.We find that a 10% exogenous increase in exports generates a 1.5 to 3% increase in domestic sales inthe short-term, depending on the specification. This complementarity is robust to various estimationtechniques, combinations of instruments, sub-samples, and inclusion of additional controls. Our resultsare valid in cases where the foreign demand for firms’ products is either increasing or decreasing, theeffect being slightly larger in the latter case. Finally, the complementarity is observed across all firmsizes, but it is relatively more pronounced for smaller firms.Why are firms’ domestic sales positively related to exogenous changes in exports? In most interna-tional trade models, domestic and foreign sales are only related through idiosyncratic productivity.Consequently, exogenous shocks affecting a given location have no effect on sales in other markets.We show that the needs for short-run liquidity may be a relevant explanation. More precisely, the cashflow generated by exports may be used by firms to finance domestic operations in the short-term (to
3

CEPII, WP No 2011-33 Export dynamics and sales at home
pay suppliers, hire workers or invest), which would generate the type of complementarity we observe.Indeed, we find that firms belonging to sectors in which the need for short-term liquidity is higher - dueto higher working capital requirement - have domestic sales that exhibit a significantly larger responseto exogenous variations in exports.Our results have direct consequences for the effect of international trade on the synchronization of in-ternational business cycles. Beyond business cycles correlation, these results have many implicationsregarding the transmission of foreign trade policy, exchange rate shocks or financial crises to the domes-tic economy. In the case of the 1997-98 Asian crisis, we indeed show that firms that were more exposedto the destinations that experienced the crisis suffered a larger drop in domestic sales during the event.More generally, our results support the idea that changes in exports in one market, due to changes inmarket-specific demand conditions, tend to affect sales in other markets in the same direction. Thistransmission of firm performance across markets is not explained by business cycles’ synchronization.
ABSTRACT
How do firms’ sales interact across markets? Are foreign and domestic sales complements or substi-tutes? Using a large French firm-level database that combines balance-sheet and product-destination-specific export information over the period 1995-2001, we study the interconnections between exportsand domestic sales. We identify exogenous shocks that affect the firms’ demand on foreign markets toinstrument yearly variations in exports. We use alternatively as instruments product-destination specificimports or tariffs changes, and large foreign shocks such as financial crises or civil wars. Our resultsshow that exogenous variations in foreign sales are positively associated with domestic sales, even aftercontrolling for changes in domestic demand. A 10% exogenous increase in exports generates a 1.5 to3% increase in domestic sales in the short-term. This result is robust to various estimation techniques,instruments, controls, and sub-samples. It is also supported by the natural experiment of the Asian crisisin the late 1990’s. We discuss various channels that may explain this complementarity.
JEL Classification: F10, F44, L20Keywords: Export dynamics, domestic sales, markets, liquidity.
4
CEPII, WP No 2011-33 Export dynamics and sales at home
DYNAMIQUE DES EXPORTATIONS ET VENTES SUR LE MARCHÉ INTÉRIEUR
Nicolas BermanAntoine Berthou
Jérôme Héricourt
RÉSUME NON TECHNIQUE
Les études empiriques récentes menées à partir de données individuelles ont permis d’améliorer nosconnaissances relatives aux stratégies des entreprises sur chacun de leurs marchés. On observe ainsique les ventes totales d’une entreprise sont distribuées sur plusieurs marchés, chacun pouvant êtreidentifié par une destination précise et un produit. Sur une destination, une entreprise vend généralementplusieurs produits. Or, les analyses qui ont été réalisées n’ont jusqu’à présent pas cherché à identifierdans quelle mesure les marchés d’une entreprise sont interconnectés. On pourrait par exemple s’attendreà ce qu’un surcroît de ventes sur un marché, ou à l’inverse une baisse de ces ventes, ait une incidencesur les ventes sur d’autres marchés. Du point de vue macroéconomique, cette question a potentiellementdes implications importantes quant à la transmission des chocs entre marchés et à la synchronisationdes cycles.Nous nous intéressons en particulier à la relation entre ventes domestiques et exportations des entre-prises françaises. Les ventes étrangères et domestiques étant déterminées simultanément, nous déve-loppons une stratégie qui identifie des variations exogènes de la demande étrangère adressée à chaquefirme, et prédit leurs effets sur les ventes domestiques. Notre analyse utilise une base de données quicontient à la fois des informations sur le bilan des firmes et sur leurs échanges internationaux, de 1995à 2001. Nous utilisons ces informations, combinées à des données d’importations agrégées au niveaudes destinations et des produits, pour construire un indicateur de demande adressée aux entreprises surles marchés domestiques et étrangers.Nous trouvons qu’une augmentation exogène de 10% des exportations génère une hausse de 1,5 à 3%des ventes domestiques à court-terme. Cette complémentarité est robuste à l’utilisation de différentestechniques d’estimation, combinaisons d’instruments, sous-échantillons ou contrôles additionnels. Elleest par ailleurs observée aussi bien pour des chocs positifs que négatifs sur les exportations. Enfin, elleest significative pour l’ensemble des entreprises, mais particulièrement prononcée pour les entreprisesde petite taille.Pourquoi les ventes domestiques des entreprises répondent-elles positivement à des variations exogènesdes exportations ? Dans la plupart des modèles de commerce international, les ventes domestiques etétrangères sont uniquement liées au travers de la productivité des firmes. Un choc de demande sur unmarché donné n’a aucun effet sur les ventes sur les autres marchés. Nous montrons cependant queles besoins des entreprises en liquidité de court-terme semblent jouer un rôle significatif. En effet, laliquidité générée par le biais de l’activité d’exportation peut servir en général à financer des opérations
5

CEPII, WP No 2011-33 Export dynamics and sales at home
domestiques à court-terme, telles que le paiement des fournisseurs, une hausse de la main d’oeuvreemployée, ou des investissements. Nos résultats montrent que la relation entre exportations et ventesdomestiques des entreprises est plus forte pour les secteurs au sein desquels les entreprises ont desbesoins plus importants en termes de financements à court terme.Ces résultats mettent en avant le rôle du commerce international dans la propagation des cycles entrepays. La complémentarité entre exportations et ventes domestiques des entreprises contribue en effet àamplifier la transmission des politiques commerciales, des fluctuations de change, ou des crises finan-cières dans les pays partenaires, à l’économie domestique.
RÉSUMÉ COURT
Les ventes des entreprises sur un marché sont-elles affectées par les ventes qu’elles réalisent sur d’autresmarchés? Et si cette relation existe, ces ventes sont-elles complémentaires ou substituables? Cet articleétudie les interconnections entres exportations et ventes domestiques à l’aide d’une base de donnéesqui combine des informations sur les caractéristiques des entreprises et leurs marchés (destinations,produits) sur la période 1995-2001. Nous identifions des chocs macroéconomiques qui affectent lademande étrangère adressée aux entreprises françaises. Les exportations des entreprises françaisessont prédites, par une demande adressée calculée au niveau de la destination et du produit, par lesdroits de douanes de l’importateur, ou par des chocs plus agrégés comme les crises financières oules guerres civiles dans les pays partenaires. Nos résultats suggèrent que les variations exogènes desventes étrangères sont positivement associées aux ventes domestiques. Une augmentation exogène de10% des exportations génère une hausse de 1,5 à 3% des ventes domestiques à court-terme. Il estégalement confirmé par l’étude du comportement des entreprises françaises durant la crise asiatique, àla fin des années 1990. Nous discutons à la fin de l’article différents canaux susceptible d’expliquercette complémentarité.
Classification JEL : F10, F44, L20Mots clés : Exportations, ventes domestiques, marchés, liquidité.
6

CEPII, WP No 2011-33 Export dynamics and sales at home
EXPORT DYNAMICS AND SALES AT HOME
Nicolas BERMAN ∗, Antoine BERTHOU †, Jérôme HÉRICOURT ‡
1. INTRODUCTION
The sales of a firm are distributed across several markets, each of these markets being identifiedby a specific location and a particular product. Empirical evidence shows that large, productivefirms explore more markets and have larger average sales. How sales between these differentmarkets interplay, beyond the simple correlation of market-specific shocks, remains howeverunclear, though it may be an important determinant of firm-level dynamics. More generally,the interconnections between sales across markets have important implications for the trans-mission of foreign demand shocks, exchange rate movements or trade policies to the domesticeconomy.This paper provides an empirical investigation of this question through the lens of the rela-tionship between French firms’ domestic sales and exports. As sales decisions across marketsare likely to be simultaneously determined, we develop a strategy that identifies variations inthe foreign demand addressed to the firms to predict exogenous changes in exports, and theireffect on the firms’ domestic sales. The different dimensions of our data allows us to constructinstruments that capture the demand specifically addressed to a given firm in the foreign mar-kets (destinations and products) it serves, while controlling for the conditions it faces in thedomestic market.Our empirical analysis relies on a large firm-level dataset containing both firm-level tradedata from the French Customs and balance-sheet information over the period 1995-2001, at ayearly frequency. In particular, the balance-sheet data contains domestic and foreign turnovers,our main variables of interest. The customs data contains firm-level exports and imports by
∗. Graduate Institute of International and Development Studies (IHEID). Address: Case Postale 136, CH -1211, Geneva 21 - Switzerland. Tel: (0041) 22 908 5935. E-mail: [email protected].†. Banque de France and associate researcher at CEPII. Address: 39 rue Croix des Petits Champs 75001 Paris
- France. Tel: (0033) 01 42 92 28 76. E-mail: [email protected].‡. EQUIPPE-University of Lille. Université de Lille 1, Faculté des Sciences Économiques et Sociales, USTL
- Cité Scientifique - Bât SH2, 59655 Villeneuve d’Ascq Cedex - France. Tel/Fax: (33) 1 44 07 82 78, Email:[email protected]. We are especially grateful to Richard Baldwin, Matthieu Crozet, Anne-CéliaDisdier, Jean Imbs, Linda Tesar, Florian Mayneris, Vincent Vicard, and participants at several seminars andconferences for very useful comments and discussions. This research does not reflect the views of the Banque deFrance.
7

CEPII, WP No 2011-33 Export dynamics and sales at home
product and destination. This information is used together with import data at the product-destination level to construct the demand addressed to firms in both foreign and domesticmarkets. Our baseline instrument is the sum of imports in the product-destination servedby the firms, weighted by the average share of each product-destination in the firm’s totalexports. 1 Our results are robust to the use of alternative instruments, including firm-specifictariff changes, or exposure to large foreign shocks, such as financial crises or civil wars.We find that a 10% exogenous increase in exports generates a 1.5 to 3% increase in domes-tic sales in the short-term, depending on the specification. This complementarity is robust tovarious estimation techniques, combinations of instruments, sub-samples, and inclusions ofadditional controls. These variations in domestic sales are related to both factor accumulationand changes in total factor productivity. Our results are valid in cases where the foreign de-mand for firms’ products is either increasing or decreasing, the effect being slightly larger inthe latter case. Finally, the complementarity is observed across all firm sizes, but it is relativelymore pronounced for smaller firms.
Why are firms’ domestic sales positively related to exogenous changes in exports? In mostinternational trade models (e.g. Melitz, 2003), domestic and foreign sales are only relatedthrough idiosyncratic productivity. Consequently, exogenous shocks affecting a given locationhave no effect on sales in other markets. However, several theoretical mechanisms can beused to rationalize the existence of linkages between exports and domestic sales. On the onehand, increasing exports sales may well come at the expense of domestic sales in the shortrun in the presence of capacity constraints. On the other hand, at least two mechanisms wouldpredict complementarity: the short-run liquidity channel, whereby the cash flow generated byexports is used to finance domestic operations in the short-term (to pay suppliers, hire workersor invest), and the existence of increasing returns.Our results do not exclude the possibility of capacity constraints in the short-term, but simplysuggest that they do not dominate once export sales are properly instrumented. While the mainobjective of this paper is not to provide a definitive answer to the mechanism underlying ourfindings, we provide a number of results supporting the liquidity channel. In particular, wefind that firms belonging to sectors in which the need for short-term liquidity is higher - dueto higher working capital requirement - have domestic sales that exhibit a significantly largerresponse to exogenous variations in exports.
Our results have direct consequences for the effect of international trade on the synchronizationof international business cycles. Common wisdom generally attributes the strong correlation
1. A product is defined at the HS6 level.
8
CEPII, WP No 2011-33 Export dynamics and sales at home
between openness and the synchronization of business cycles 1 to a simple mechanism: aseconomies become more open, exports and imports represent a larger share of firms’ totalsales or input purchases. This makes firms more sensitive to variations in foreign demand,which tends to propagate shocks. Our results imply that foreign business cycles may be trans-mitted indirectly to domestic markets through the complementarity between firms’ domesticand foreign sales.Beyond business cycles correlation, these results have many implications regarding the trans-mission of foreign trade policy, exchange rate shocks or financial crises to the domestic econ-omy. In the case of the 1997-98 Asian crisis, we indeed show that firms that were more exposedto the destinations that experienced the crisis suffered a larger drop in domestic sales duringthe event. More generally, our results support the idea that changes in exports in one market,due to changes in market-specific demand conditions, tend to affect sales in other markets inthe same direction. This transmission of firm performance across markets is not explained bybusiness cycles’ synchronization.
A very recent, yet flourishing, body of literature has emphasized the role of capacity constraintsin explaining how exports affect the volatility of firms’ sales, pricing strategies, or exportmodes (Vannoorenberghe, 2011, Soderby, 2011, Nguyen and Schaur, 2011, Blum et al., 2011,Ahn and McQuoid, 2011). 2 The general idea of these papers is that if firms face convex costs inthe short-run, they may substitute sales away from a given market when growth opportunitiesappear in other markets. The fact that firms’ exports (or export status) are negatively correlatedwith their domestic sales appears to support this idea. Our results show that a change inexports, when predicted by exogenous demand conditions in foreign markets, triggers a changein domestic sales in the same direction. At the end of this paper, we show that, indeed, capacityconstraints seem to influence this relationship, but they are not strong enough to offset thecomplementarity between sales across markets.Finally, a number of recent empirical papers have tested the influence of foreign macroeco-nomic shocks on firms’ activities through factor utilization and productivity. Of particularinterest are the papers by Ekholm et al. (2011) and Hummels et al. (2010). Ekholm et al.
1. Theoretically, the fact that international trade causes tighter business cycle synchronization is ambiguous.If trade openness leads to greater specialization, and cycles are predominantly sector-specific, trade opennessmay actually decrease business cycle correlation. However, empirical works have found strong evidence thattrade openness amplifies international business cycles correlation. See, among many others, Frankel and Rose(1998) or Baxter and Kouparitsas (2005).
2. This recent literature follows a more ancient research documenting the relationship between exports anddomestic production at the country level (Ball et al., 1966, Dunlevy, 1980; Haynes and Stone, 1983; Zilberfarb,1980). Most of these papers tested the “capacity pressure” hypothesis, using aggregate data, and produced mixedresults.
9

CEPII, WP No 2011-33 Export dynamics and sales at home
(2011) showed that for Norway, firms that were more exposed to the appreciation of the Kronain the early 2000’s (through higher competitive pressure at home or reduced competitivenesson foreign markets) restructured more. Hummels et al. (2010) showed that for Denmark, pos-itive export shocks lead to an expansion of firms’ employment and wages paid to all types ofworkers. Our results suggest that these gains are not only directly related to foreign shocks,but may also be the indirect consequence of the complementarity between export and domesticsales. 1
The next section presents the data and some descriptive statistics. Section 3 presents ourempirical methodology. Section 4 reports our baseline results, a number of robustness checks,and an application of our results to the Asian crisis from 1997-98. We discuss various potentialchannels of transmission in section 5. The last section concludes.
2. DATA AND STYLIZED FACTS
2.1. Database
Our empirical analysis relies on two main datasets that report information at the firm level.The first source is the balance sheet dataset BRN (Bénéfice Réels Normaux), which relies onfiscal declarations by domestic French firms. The BRN database is constructed from manda-tory reports of French firms to the tax administration, which are in turn transmitted to IN-SEE (the French Statistical Institute). This dataset reports information including firms’ totalturnover and export turnover, employment, capital stock, value added, the industry, year, andbalance-sheet variables. The data covers the period 1995-2001, for which we have informationon both the total turnover and export turnover. This combined information is used to computedomestic turnover. The BRN contains between 650,000 and 750,000 firms per year over theperiod, which is around 60% of the total number of French firms. 2 Importantly, this dataset
1. To a lesser extent, our paper also contributes to the vast literature interested in the effect of internationaltrade on firm performance, which has been a major area of research since the late 1990’s. Most papers focused onthe link between exporting and productivity at the firm level, showing that the most productive firms self-selecton export markets. They provide only mixed evidence on the productivity gains generated by entry into foreignmarkets, however (early works include Bernard and Jensen, 1999 or Bernard and Wagner, 1998; for recent con-tributions see De Loecker, 2007, Van Biesebroeck, 2005, Park et al., 2009). These results have led many authorsto argue that trade liberalization may affect economic growth mainly through the process of resource reallocationacross firms within sector, with little contribution of productivity gains within firms. Our results suggest thatexport performance may affect domestic performance in the short-term, either through factor accumulation orTFP gains.
2. The BRN files contain all firm which sales at least 763 K euros (230 K euros for services).
10

CEPII, WP No 2011-33 Export dynamics and sales at home
is composed of both small and large firms, since no threshold applies on the number of em-ployees. Eaton et al. (2004) and Eaton et al. (2011) provide a more detailed description ofthe database. Because we are interested in the relationship between export flows and domesticsales, we only keep firms that export at least once over the period 1995-2001. We also restrictour analysis to firms whose primary activity is manufacturing. This is in particular to excludewholesalers. Finally, we clean the data by dropping the firms that have a share of exports overtotal sales above 90% 1, and the top and bottom percentile in terms of total average turnovergrowth.The second source of data used in this paper corresponds to the French customs data, whichreports exports flows with firm, destination and product dimensions. Both the quantity (intons) and value of each flow are reported. The product classification system is the EuropeanUnion Combined Nomenclature at 8 digits (CN8). The customs database is virtually exhaus-tive. After merging the two sources, we are left with between 90 and 95% of French exportscontained in the customs data, depending on the year.Our strategy relies on the estimation of the effect of export sales on domestic sales. We use thegeographical structure of exports for each firm to compute firm-specific (by destination andby product) measures of world demand for the goods produced by the firm, focusing on eitherall products exported by the firm or on its main exported product by destination. We will usethese variables as instruments for export sales in our empirical analysis. Their construction isfurther detailed in the next section.
2.2. Descriptive statistics
This section provides some descriptive statistics about the characteristics of the firms containedin our sample. Our final sample is composed of 29,542 firms exporting at least once overthe period 1995-2001. On average, around 21,000 firms report exports each year. Table 1reports information for these firms regarding their number of employees, their domestic sales(in thousands of euros), their export sales (in thousands of euros), export propensity, which ismeasured as the ratio of export turnover over total turnover, and the log change of exports anddomestic sales. The size of the firms contained in the data is very heterogeneous: it starts witha single employee for the smallest firm, whereas the largest has almost 82,000 employees.The distribution of export propensity confirms that most of firms’ sales correspond to businessoperations on the domestic market: 50% of firms in the sample export 14% or less of theirtotal turnover; 75% of firms export at most a third of their total turnover. Hence, this empirical
1. This drops firms located in France whose main activity is to sell goods abroad. Less than 1.8% of theobservations are dropped. Note that our results are robust to the use of the full sample.
11

CEPII, WP No 2011-33 Export dynamics and sales at home
Table 1 – Descriptive statistics: firm size, sales and export propensity
Mean 1st Quartile Median 3rd Quartile S.D.
Number of employees 114.9 12.0 32.0 76.0 619.4Domestic sales 1.1e+05 7375.0 19442.6 55133.2 8.9e+05Export Sales 57520.2 632.0 2794.0 13291.0 9.3e+05Propensity to export 0.22 0.04 0.13 0.33 0.22∆ ln Domestic sales 0.03 -0.07 0.03 0.14 0.27∆ ln Export Sales 0.06 -0.21 0.04 0.31 0.90
Note: Source: authors’ computation from BRN data. Export and domestic turnover are expressed in thousandsof euros. Propensity to export corresponds to exports/total sales.
pattern confirms that firms’ sales are mostly concentrated on the domestic market, whereasexports are concentrated on a small number of firms that have a large degree of international-ization. Finally, both export and domestic sales exhibit, on average, a positive growth (3 and4% respectively), with foreign sales being significantly more volatile than domestic sales.We then provide simple descriptive evidence regarding the relationship between firms’ sizeand export propensity. Using the number of employees, six classes of firms’ size are definedin Table 2. For each category, we report the average export propensity. Overall, these meanvalues are larger than the median presented in the previous table. However, the numbers thatare displayed confirm that larger firms have a higher export propensity. On average, firms with500 or more employees export a third of their total turnover, whereas small firms export around21% of their total turnover.
3. EMPIRICAL METHODOLOGY
Endogeneity issues. Our main objective is to identify the effect of changes in export sales ondomestic sales. In general, we want to estimate a specification taking the following form:
lnYit = α + β lnXit + µi + λkt + εit (1)
where Xit and Yit are respectively the exports and domestic sales of firm i during year t. µi
denotes firm-specific unobserved characteristics, and λkt represents sector × year dummies. 1
1. A sector is defined at the 2 digit (NES classification, 36 sectors) level.
12

CEPII, WP No 2011-33 Export dynamics and sales at home
Table 2 – Export propensity by firm-size class
Size class Mean exportPropensity
< 20 employees 0.21
20 - 50 employees 0.19
50 - 100 employees 0.22
100 - 200 employees 0.25
200 - 500 employees 0.29
> 500 employees 0.33
All categories 0.22
Source: authors’ computation from BRN data. Export propensity corresponds to exports/total sales.
The latter captures in particular business cycle conditions and changes in input prices. Ourcoefficient of interest is β, the coefficient on export sales Xit: a negative sign would implysubstitutability between export and domestic sales, while a positive sign would suggest com-plementarity.Endogeneity is obviously a major concern in this specification. Domestic sales and exportsare likely to be jointly determined by the same aggregate or idiosyncratic shocks affecting thedemand addressed to the firm. For instance, a productivity shock is expected to simultaneouslyraise domestic and foreign sales of the firm, thus introducing a positive bias in the relationshipbetween the two variables. In general, domestic and foreign sales are determined by macroeco-nomic conditions on each market, which are likely to be correlated. The different dimensionsof our data allow us to build instruments capturing the demand specifically addressed to a firmin the foreign markets it serves, while controlling for the demand it faces in the domestic mar-ket. To do so, we make use of the information provided by the French customs on the range ofproducts and destinations served by each firm.
Instruments. Our main instrument is constructed using information about the foreign demandaddressed to the firm using product and destination information. Specifically, we compute the
13

CEPII, WP No 2011-33 Export dynamics and sales at home
sum of foreign imports in the product-destination served by the firm in year t, weighted by theaverage share of each product-destination in the firm’s total exports over the period. Weightsare computed using the average share of the product-destination in the firm’s total exports overthe 1995-2001 period. A product is defined at the 6-digit (HS6) level. More precisely, wedefine:
FDit =∑j,p
ωijpMjp,t (2)
where ωijp is the average share of each product p and destination j in firm i’s exports over theperiod. This variable is expected to impact the firm’s exports, but not domestic sales, unlessforeign demand for the firm’s products is correlated with the domestic demand of these prod-ucts. To ensure that our results are not driven by this international business cycle correlation,we explicitly control in our baseline specification for the domestic equivalent of our instru-ment. It is defined as the domestic demand addressed to the firm (DDit). This mirror variableis the sum of the world imports from France for all products exported by firm i, weighted bythe share of each product in the firm’s exports:
DDit =∑j,p
ωijpMFR,p,t (3)
Therefore, this variable provides a firm-specific measure of domestic demand addressed to thefirm. Alternatively, we compute the foreign demand and domestic demand variables usingsales for the “core” product of the firm on each destination: FDcore
it and DDcoreit , respectively.
The core product of the firm is defined at the HS4-digit level as the product with the highestvalue of export over the entire period. The detailed computation of these variables is providedin the data appendix.
Baseline specification. We include DDit explicitly in equation (1). The following equationassesses the effect of exogenous changes in exports (through variations in FDit in a first stage)on domestic sales, controlling for domestic demand:
lnYit = α2 + β2 lnXit + δ2DDit + µi + λkt + εit (4)
lnXit = α1 + β1 lnFDit + δ1DDit + µi + λkt + νit (5)
where 5 is the first stage equation that identifies exogenous variations in lnXit. We expectδ2 to be positive. We estimate this specification by two-stage-least-squares (2SLS). Note thatour results are unchanged when the two-way relationship between export and domestic sales
14

CEPII, WP No 2011-33 Export dynamics and sales at home
is jointly estimated using 3SLS, allowing for residual correlation across equations. 1 Finally,in all estimations, standard errors are robust to heteroscedasticity and clustered at the sectorallevel (based on NACE 36 industry classification) using Froot (1989) correction.
Alternative instruments. Testing for overidentifying restrictions requires at least two in-struments, as we have one endogenous regressor. To assess the exogeneity of our baselineinstruments, and to show that our results are unchanged when using other measures of foreigndemand, we constructed a number of alternative instruments. The first is a measure of firm-specific tariffs faced by French exporters, which depend on the destinations and products theyexport. It is constructed essentially in the same way as DDit above, but using tariffs instead ofimports. Tariffs are arguably more exogenous because they are less correlated with domesticconditions. However, this instrument is weaker as tariff variations are limited over the period.Second, we will make use of the occurrence of large (negative) shocks, such as civil wars orthe 1997-98 Asian crisis, to show that our results hold whatever the source of variations inforeign demand. More details about the computations of these variables are provided later inthe paper, as well as in the data appendix.Using these alternative instruments allows us to perform Hansen’s J-test of overidentifyingrestrictions. Insignificant test statistics indicate that the orthogonality of the instruments andthe error term cannot be rejected; thus, our choice of instruments is appropriate on that ground.As shown later, the overidentifying restrictions cannot be rejected. Finally, we performed theDurbin-Wu-Hausman test for exogeneity of regressors. Unsurprisingly, the null hypothesis ofexogeneity is rejected in most cases. 2 This clearly shows that we need to use IV methodologiesto identify exogenous variations of exports.In all estimations, we report the F-stat form of the Kleibergen-Paap statistic, the heteroskedas-tic and clustering robust version of the Cragg-Donald statistic suggested by Stock and Yogo(2005) as a test for weak instruments. Most statistics are comfortably above the critical values,confirming that our instruments are strong predictors of export sales.
4. MAIN RESULTS
4.1. Baseline regressions
Within estimations. We start with a simple estimation of Equation (4) by OLS where thefirms’ domestic sales are explained by export sales and a set of controls for the domestic market
1. Results are available upon request.2. Detailed results of these tests available upon request.
15

CEPII, WP No 2011-33 Export dynamics and sales at home
conditions, firm fixed effects and year dummies (alternatively with sector × year dummies).This specification offers a benchmark estimation of the relationship between domestic andforeign sales, which can be compared to our preferred estimations (presented in the followingtables) where export sales are instrumented by foreign market demand.
Table 3 – Export and domestic sales: correlation
(1) (2) (3) (4)
Dep. Var. ln Dom. sales ∆ ln Dom. sales
ln Export salesit 0.006(0.005)
ln Domestic demandit 0.139a
(0.025)
ln Number of firmskt 0.374a
(0.119)
ln Industry domestic saleskt 0.134b
(0.051)
∆ ln Export salesit -0.012a -0.017a -0.018a
(0.003) (0.003) (0.003)
∆ ln Domestic demandit 0.125a 0.123a 0.107a
(0.019) (0.027) (0.026)
∆ ln Number of firmskt 0.164c -0.084(0.088) (0.068)
∆ ln Industry domestic saleskt 0.076a 0.056a
(0.026) (0.020)
Observations 110721 110721 110721 110721Firm FE Yes No Yes YesYear dummies Yes Yes Yes NoSector × year dummies No No No Yes
Robust Standard errors, clustered by NACE 36 industry, in parentheses. c significant at 10%; b significant at 5%; a significant at 1%.
16

CEPII, WP No 2011-33 Export dynamics and sales at home
Table 3 presents the results of the estimation in levels (column 1) and in first differences(columns 2 to 4). Domestic market conditions are controlled for by using a measure of thedomestic demand addressed to the firm (ln Domestic demandit as defined by (3)), the numberof firms that operate in the same industry (ln Number of firmskt) and the industry domesticsales (ln Industry domestic saleskt). The results show that the relationship between domesticand foreign sales is either insignificant or negative. In other words, controlling for demandconditions on the domestic market, an increase of exports reduces domestic sales. 1 Moreover,variations of the domestic demand for products in which the firm is specialized are positivelyrelated to the firm’s domestic sales. The effect of the number of domestic firms operating inthe same industry is positive when significant, as the effect of industry domestic sales.While this estimation provides an interesting correlation between the two variables, it howeverdoes not allow us to infer anything about the causal effect of an exogenous change in exports ondomestic sales. In the rest of the paper, we shall use the aforementioned instruments to estimatethe effect of an exogenous change in exports on domestic sales, originated by a variation offoreign demand.
Instrumental variables estimations. We present in Table 4 the results of the 2SLS estima-tions, in which foreign sales are instrumented by measures of foreign demand addressed tothe firm. In the first two columns, all variables are expressed in levels and export sales areinstrumented using foreign demand in HS6 products exported by the firm (FDit, as defined inequation (2)). The estimations control for the domestic demand addressed to the firm. Column(1) includes year dummies and controls for additional variables that identify sector-specificdomestic business cycle: the industry domestic sales and the number of domestic firms oper-ating in the same industry. In column (2), our preferred specification, sector×year dummiesare included. Column (3) uses the foreign demand for the core (HS4) product exported by thefirm (FDcore
it as defined above) as the instrument for exports.The estimation results contrast with those presented in the previous table, where exports werenot instrumented by exogenous changes in the foreign demand addressed to the firms. The2SLS estimations in levels conclude to a positive and highly significant relationship betweenexports and domestic sales: an increase in a firm’s exports, induced by an increase of theforeign demand, raises domestic sales in the same year. This result is stable when the demandfor the core product is used as an alternative instrument for the export sales (column 3) andwhen sector×year dummies are introduced (column 2). The strength of our instruments isconfirmed by the Kleibergen-Paap statistics, which are above the critical values.
1. This result is in line with Vannoorenberghe (2011) who also finds that domestic sales growth is negativelycorrelated with export sales growth.
17

CEPII, WP No 2011-33 Export dynamics and sales at home
Table 4 – Baseline results
(1) (2) (3) (4) (5)Estimator 2SLS
Dep. Var. ln dom. sales ∆ ln dom. sales
ln Export salesit 0.146a 0.158a 0.239a
(0.033) (0.029) (0.041)
ln Domestic demandit 0.099a 0.105a
(0.023) (0.021)
ln Number of firmskt 0.315a
(0.083)
ln Industry domestic saleskt 0.122a
(0.046)
ln Dom. demand core prod.it 0.084a
(0.018)
∆ ln Export salesit 0.232a 0.341a
(0.048) (0.089)
∆ ln Domestic demandit 0.084a 0.073a
(0.013) (0.014)
Observations 146702 146702 146702 110721 105135Firm FE Yes Yes Yes No YesYear dummies Yes No No No NoSector × year dummies No Yes Yes Yes YesKleibergen-Paap stat. 95.1 94.8 47.3 36.2 14.1
Robust Standard errors, clustered by NACE 36 industry, in parentheses. c significant at 10%; b significant at 5%; a significant at 1%. All estimations but (3) (first differences) include firmfixed effects. The critical value for the weak instruments test is based on a 10% 2SLS bias at the 5% significance level, which is 16.4 is all estimations. The instruments are the following.In columns (1), (2), (4), (5): foreign demand in HS6 products exported by the firm (FDit in the main text) - instruments taken in first difference in columns (4) and (5); in column (3):foreign demand for the core (HS4) product exported by the firm (FDcore
it in the main text).
The difference between the estimation results presented in Tables 3 and 4 might reflect thatfirms set their capacity and determine their production ex-ante after anticipating a certain levelof aggregate demand. This introduces substitutability between domestic and foreign sales, and
18

CEPII, WP No 2011-33 Export dynamics and sales at home
generates a downward bias in the export sales coefficient in OLS estimations. Instrument-ing export by exogenous changes in foreign demand, together with controlling for domesticdemand conditions, addresses this issue.Columns (4) and (5) in Table 4 report the estimation results of the relationship between do-mestic and foreign sales, when all variables are expressed in first differences. Both estimationsinclude sector×year dummies, and estimation (5) also contains firm fixed effects. These alter-native specifications confirm that an increase in export sales, consecutive to an improvementin foreign demand conditions, raises domestic sales. Overall, results from columns (1) to (5)suggest that a 10% exogenous increase in exports generates between 1.5 and 3.5% increasein domestic sales. Importantly, we control for the domestic counterpart of our instruments inall estimations, and these controls are highly significant. The effect of exports on domesticsales that we identify can therefore hardly be attributed to common shocks affecting domesticand foreign sales simultaneously, rather represents the effect of shocks that are specific to theforeign market. We provide more robustness checks on this issue in the next subsections. 1
4.2. Robustness checks
Business cycle correlation. Despite the fact that we explicitly control for firm-specific domes-tic business cycle in all specifications, one could still argue that our results may come frominternational business cycles correlation, and that our controls do not fully capture it. If thiswas the case, we should expect the complementarity between exports and domestic sales to behigher for firms exporting to countries in which business cycles are more synchronized withthe French one. This would be the case, for instance, for French firms mainly exporting to EUdestinations.Columns (1) and (2) of Table 5 presents estimates which control explicitly for these phe-nomena. We estimate the specification of column (2), Table 4 on two different samples, whichcontain the firms exporting more or less inside the EU (i.e. firms for which the share of exportsinside EU-15 is above or below the median of the sample), respectively: if the correlation be-tween foreign and domestic business cycles was driving our results, the coefficient on exportsshould be higher for firms more exposed to the EU market.Our results are robust, whatever the sample considered. The positive effect of exports ondomestic sales is found to be significantly higher for firms exporting more outside EU-15,
1. Note also that these results are unchanged when we perform 3SLS estimations, estimating jointly theeffect of foreign sales on domestic ones and the effect of domestic sales on exports. The export-domestic salesrelationship is found to work both ways, but using this estimator does not affect our conclusions. This suggeststhat residuals correlation between the export sales and the domestic sales equations, if any, is not sufficient tosignificantly impact our results. These results are available upon request.
19

CEPII, WP No 2011-33 Export dynamics and sales at home
Table 5 – Export and domestic sales: Robustness
(1) (2) (3) (4)Estimator 2SLSSplit % exports inside EU # destinationsSample Low High Low High
Dep. Var. ln domestic sales
ln Export salesit 0.199a 0.129a 0.152a 0.177a
(0.044) (0.033) (0.041) (0.033)
ln Domestic demandit 0.105a 0.104a 0.087a 0.118a
(0.036) (0.016) (0.020) (0.029)
Observations 67702 73516 73348 73354Sector × year dummies Yes Yes Yes YesKleibergen-Paap stat. 65.5 65.1 42.4 118.1
Robust Standard errors, clustered by NACE 36 industry, in parentheses. c significant at 10%; b significant at 5%; a significant at 1%. All estimations include firm fixed effects. The criticalvalue for the weak instruments test is based on a 10% 2SLS bias at the 5% significance level, which is 16.4 is all estimations. The instrument in all specifications is foreign demand in HS6products exported by the firm (FDit in the main text). High / low: higher / lower than sample median.
suggesting that business cycle correlation is unlikely to bias our results.
Export diversification. One could argue that our results are partly driven by some firms thatrely heavily on sales in a particular destination. On the other hand, more diversified exportersmay be less affected by a shock in foreign markets. Columns (3) and (4) in Table 5 show thatour results hold for all categories of exporters, even the more diversified ones.In columns (3) and (4) our sample is split according to the average number of destinationsreached by the firm over the period. The coefficient on export sales, although significant atthe 1% level in all specification, appears to be slightly higher for the most diversified firms(column 4). This may be due to the fact that these firms have, on average, a larger share ofexports in their total sales. But overall, our results are not driven by firms whose exports areconcentrated in a single market. 1
Alternative instruments. A more direct way to assess the reliability of our empirical method-
1. This is also confirmed when we split the sample according to measure of geographical concentration (e.g.Herfindahl index) of exports at the firm level.
20
CEPII, WP No 2011-33 Export dynamics and sales at home
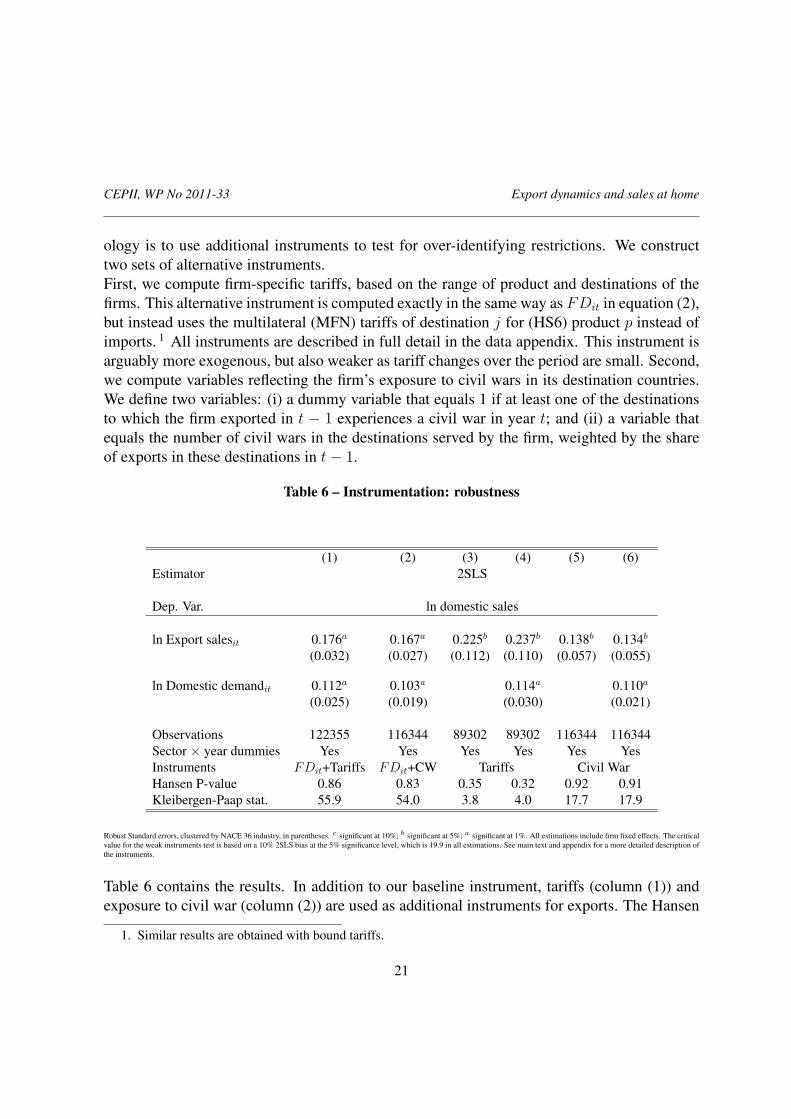
ology is to use additional instruments to test for over-identifying restrictions. We constructtwo sets of alternative instruments.First, we compute firm-specific tariffs, based on the range of product and destinations of thefirms. This alternative instrument is computed exactly in the same way as FDit in equation (2),but instead uses the multilateral (MFN) tariffs of destination j for (HS6) product p instead ofimports. 1 All instruments are described in full detail in the data appendix. This instrument isarguably more exogenous, but also weaker as tariff changes over the period are small. Second,we compute variables reflecting the firm’s exposure to civil wars in its destination countries.We define two variables: (i) a dummy variable that equals 1 if at least one of the destinationsto which the firm exported in t − 1 experiences a civil war in year t; and (ii) a variable thatequals the number of civil wars in the destinations served by the firm, weighted by the shareof exports in these destinations in t− 1.
Table 6 – Instrumentation: robustness
(1) (2) (3) (4) (5) (6)Estimator 2SLS
Dep. Var. ln domestic sales
ln Export salesit 0.176a 0.167a 0.225b 0.237b 0.138b 0.134b
(0.032) (0.027) (0.112) (0.110) (0.057) (0.055)
ln Domestic demandit 0.112a 0.103a 0.114a 0.110a
(0.025) (0.019) (0.030) (0.021)
Observations 122355 116344 89302 89302 116344 116344Sector × year dummies Yes Yes Yes Yes Yes YesInstruments FDit+Tariffs FDit+CW Tariffs Civil WarHansen P-value 0.86 0.83 0.35 0.32 0.92 0.91Kleibergen-Paap stat. 55.9 54.0 3.8 4.0 17.7 17.9
Robust Standard errors, clustered by NACE 36 industry, in parentheses. c significant at 10%; b significant at 5%; a significant at 1%. All estimations include firm fixed effects. The criticalvalue for the weak instruments test is based on a 10% 2SLS bias at the 5% significance level, which is 19.9 in all estimations. See main text and appendix for a more detailed description ofthe instruments.
Table 6 contains the results. In addition to our baseline instrument, tariffs (column (1)) andexposure to civil war (column (2)) are used as additional instruments for exports. The Hansen
1. Similar results are obtained with bound tariffs.
21

CEPII, WP No 2011-33 Export dynamics and sales at home
tests of overidentifying restrictions cannot reject the exogeneity of our instruments in bothcases. At all events, the coefficients of exports are largely unaffected. Note that the number ofobservations is lower because we removed from the sample the firms that export to countriesin which there is no tariff variation over the period (this includes in particular EU countries) orfor which information on the occurrence of civil wars is missing.Estimations in columns (3) to (6) use our alternative instruments alone. We include both firm-specific tariff and its lag in columns (3) and (4) to be able to assess the exogeneity of thisinstrument. Columns (5) and (6) contain the results using both the binary and the continuousproxies for firm-specific exposure to civil wars as instruments. In all estimations, the Hansentest does not reject the orthogonality of our instruments, and the coefficient on export sales isalways positive and significant at the 5% level. The coefficients are found to be quantitativelylarger than before in columns (3) and (4), but our estimates are also less precise. These resultssuggest that, whatever the (exogenous) shock affecting the firms’ foreign sales, it has a positiveeffect in the short-term on domestic performance. Interestingly, the results obtained using civilwars in columns (5) and (6) are very similar to our benchmark results from Table 4: a 10%increase in exports generates an additional 1.3% in domestic sales.Note that all our instruments have the expected effect on exports, as shown in the Table 10in the appendix, which reports the first stage coefficients. Finally, our results are unchangedwhen we restrict our sample to the firms that are present during the entire period (Table 11in the appendix). Therefore, firms close to bankruptcy, which could decrease simultaneouslyboth exports and domestic sales, do not drive our results.
Imports. Recent papers have shown that offshoring may exacerbate international businesscycle correlation. 1 Another potential bias may arise in our estimations if firms export andimport products from the same destination. The positive effect of foreign shocks on domesticsales could in this case be partly due to better or cheaper access to foreign inputs. Our firm-level customs data also contain information on firm-product-country specific imports, so thatwe can explicitly control for this. We therefore include the firms’ imports as a control variablein our estimation. This variable is instrumented using the foreign supply addressed to thefirm by product (FSit): foreign exports by country-product are weighted by the share of eachcountry-product pair in each firm’s imports (see data appendix for more details).
Table 7 reports the estimation results that control specifically for firms’ predicted imports.Columns (1) to (4) differ in terms of the instruments used for export sales: foreign demand inthe HS6 product exported by the firm (column 1), foreign demand for the core (HS4) productexported by the firm (column 2), firm-specific tariffs (column 3) or exposure to civil war
1. See Bergin et al. (209) and Burstein et al. (2008).
22

CEPII, WP No 2011-33 Export dynamics and sales at home
Table 7 – Robustness: imports
(1) (2) (3) (4)Dep. Var. ln domestic sales
ln Export salesit 0.102a 0.214a 0.207a 0.205a
(0.030) (0.042) (0.044) (0.052)
ln Importsit 0.065a 0.051a 0.047b 0.058b
(0.016) (0.016) (0.023) (0.023)
ln Domestic demandit 0.086a
(0.021)
ln Dom. demand main prod.it 0.067a 0.076a 0.088a
(0.019) (0.018) (0.020)
Observations 136004 136004 107736 83181Sector × year dummies Yes Yes Yes YesInstruments FDit FDcore
it FDcoreit + Tariffs FDcore
it + CWHansen p-value - - 0.21 0.46Kleibergen-Paap stat. / S-Y Crit. val. (10%) 18.0/7.0 17.5/7.0 5.5/7.6 10.4/7.6
Robust Standard errors, clustered by NACE 36 industry, in parentheses. c significant at 10%; b significant at 5%; a significant at 1%. 2SLS estimations. The critical values for the weakinstruments test are based on a 10% 2SLS bias at the 5% significance level. The instruments are the following: in all columns, foreign supply in HS6 products imported by the firm (BCM
itin the main data appendix); in column (1) foreign demand in HS6 products exported by the firm (FDit in the main text); in column (2) to (4) foreign demand for the core (HS4) productexported by the firm (FDcore
it in the main text); in column (3), firm-specific tariff; in column (4), exposure to civil wars. See appendix for more details.
(column 4). In these augmented specifications, the effect of export decreases slightly in column(1), but remains positive and significant at the 1% level in all specifications. The coefficientestimate of exports varies between 0.1 and 0.2, quantitatively close to our baseline results.
4.3. A quasi-natural experiment: the 1997-1998 Asian crisis
A direct implication of our results is that negative external shocks, such as financial crises, aretransmitted to domestic sales through trade. The time period for which our data is availableallows us to directly assess the effect of a particular event, the 1997-1998 crisis in South EastAsia, on French firms’ domestic sales. Both the banking and currency crises that several Asiancountries experienced generated a large negative demand shock for French firms serving thesedestinations.Figure 1 below shows the total domestic turnover for different categories of French firms
23

CEPII, WP No 2011-33 Export dynamics and sales at home
defined according to their exposure to countries that were the most affected by the crisis.Exposure is defined as the average share of total exports before the crisis (in 1995 and 1996) inthe following destinations: Thailand, the Philippines, South Korea, Malaysia, and Indonesia.Panel (a) contains all the firms, while panel (b) considers the firms present in our sample overthe whole 1995-2001 period. In both cases, the difference between the firms that were notexposed (i.e. did not export to these countries prior to the crisis) and the others is striking. Thetrend of domestic sales is either less positive for all firms with a positive exposure, or negativefor firms with an exposure larger than 20%.
Figure 1 – Domestic sales of French firms and exposure to the 1997-1998 Asian crisis
(a) All firms (b) Firms present all years
8090
100
110
120
1996 1997 1998 1999 2000 2001Year
Exposure>20% Exposure>0
No exposure
Source: French customs and INSEE
Domestic sales (index, 100 in 1996)
9010
011
012
013
0
1996 1997 1998 1999 2000 2001Year
Exposure>20% Exposure>0
No exposure
Source: French customs and INSEE
Domestic sales (index, 100 in 1996)
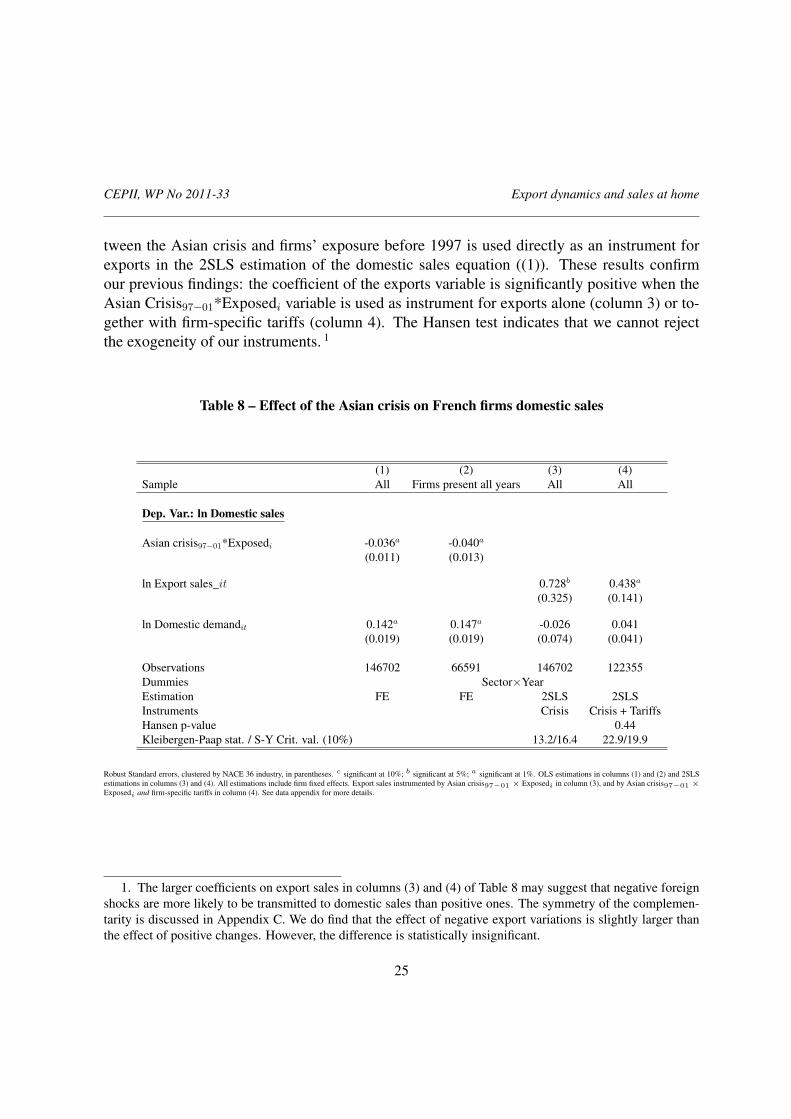
Table 8 reports estimates of the effect of the Asian crisis on French firms’ domestic sales. Weregress the log of domestic sales on an interaction term between a dummy variable which iden-tifies the years of the crisis (Asian crisis97−01, which equals 1 from 1997 on), and a dummyvariable that equals 1 if the firms exported to the crisis countries before the start of the eventand were consequently exposed to the shock (exposedi). We also control for domestic demand.As already suggested by Figure 1, we find that the crisis had a significantly more negative im-pact on domestic sales for firms that were exposed to the crisis countries (column 1). Domesticsales are found to be 5% lower for those firms. In column 2, the estimation is performed ona sample of firms that are present through the entire time period of 1995-2001. Our resultsare robust to this alternative specification. In columns (3) and (4), the interaction term be-
24
CEPII, WP No 2011-33 Export dynamics and sales at home
tween the Asian crisis and firms’ exposure before 1997 is used directly as an instrument forexports in the 2SLS estimation of the domestic sales equation ((1)). These results confirmour previous findings: the coefficient of the exports variable is significantly positive when theAsian Crisis97−01*Exposedi variable is used as instrument for exports alone (column 3) or to-gether with firm-specific tariffs (column 4). The Hansen test indicates that we cannot rejectthe exogeneity of our instruments. 1
Table 8 – Effect of the Asian crisis on French firms domestic sales
(1) (2) (3) (4)Sample All Firms present all years All All
Dep. Var.: ln Domestic sales
Asian crisis97−01*Exposedi -0.036a -0.040a
(0.011) (0.013)
ln Export sales_it 0.728b 0.438a
(0.325) (0.141)
ln Domestic demandit 0.142a 0.147a -0.026 0.041(0.019) (0.019) (0.074) (0.041)
Observations 146702 66591 146702 122355Dummies Sector×YearEstimation FE FE 2SLS 2SLSInstruments Crisis Crisis + TariffsHansen p-value 0.44Kleibergen-Paap stat. / S-Y Crit. val. (10%) 13.2/16.4 22.9/19.9
Robust Standard errors, clustered by NACE 36 industry, in parentheses. c significant at 10%; b significant at 5%; a significant at 1%. OLS estimations in columns (1) and (2) and 2SLSestimations in columns (3) and (4). All estimations include firm fixed effects. Export sales instrumented by Asian crisis97−01 × Exposedi in column (3), and by Asian crisis97−01 ×Exposedi and firm-specific tariffs in column (4). See data appendix for more details.
1. The larger coefficients on export sales in columns (3) and (4) of Table 8 may suggest that negative foreignshocks are more likely to be transmitted to domestic sales than positive ones. The symmetry of the complemen-tarity is discussed in Appendix C. We do find that the effect of negative export variations is slightly larger thanthe effect of positive changes. However, the difference is statistically insignificant.
25

CEPII, WP No 2011-33 Export dynamics and sales at home
5. CHANNELS OF TRANSMISSION
How can we explain the export-domestic sales complementarity in the short run? As men-tioned earlier, in most international trade models, aggregate or idiosyncratic productivity, to-gether with local demand conditions, determines simultaneously the level of sales in eachmarket. Exogenous changes in demand conditions in a given market have no effect on thelevel of sales in other markets. However, several factors may explain why we observe a posi-tive impact of exports on domestic sales. Before turning to these, first note that we are lookingat contemporaneous effects. In the medium- to long-term, a rise in exports may increase thescale of domestic production through efficiency gains - the so-called learning-by-exportinghypothesis 1. However, in the short-run, this is unlikely to explain our findings. In this section,we provide a discussion of the potential channels through which exports may affect domesticsales. In general, we will observe a positive reaction of domestic sales following a positiveshock on exports if the firm’s marginal costs are downward sloping. This may be due to anumber of reasons.
5.1. Liquidity
In the short-term, firms need liquidity to fulfill working capital requirements. That is, anyfirm needs liquidity to purchase capital, buy intermediates, or hire additional workers so asto increase their sales in a market. In the presence of financial constraints, this requires us-ing internal liquidity rather than external borrowing 2 (Hubbard, 1998). Short-term cash flowgenerated by foreign sales is therefore important to finance domestic operations.As the dependence on short-term cash flow may be especially important for small firms, weshould expect the export-domestic sales complementarity to decrease with firm size. Figures2.a and 2.b show that, indeed, the magnitude of the effect is heterogeneous across firms. Moreprecisely, we plot the effect of exogenous changes in exports on domestic sales for four dif-ferent groups of firms, which are defined according to their average size, together with 90%confidence intervals. Size is proxied by the number of employees (figure 2.a) or value added(figure 2.b). These figures replicate estimation (3) of Table 4 on samples defined accordingthese four quartiles of size.Domestic sales of firms belonging to the first quartile are found to react significantly more to
1. See Wagner (2007) for a survey, and the studies by Bernard and Jensen (1999), De Loecker (2007) andPark et al. (2010).
2. In the case of capital, Berthou and Hugot (2011) use a survey of French firms in 2008 to show that amongexporters, 52% of the productive investment is self-financed.
26

CEPII, WP No 2011-33 Export dynamics and sales at home
Figure 2 – Domestic turnover and exports variations, by quartiles of size
(a) By # employees (b) By value added
0.1
.2.3
.4.5
1 2 3 4Size (# workers) Quartile
Domestic sales to export elasticity
0.1
.2.3
.4.5
1 2 3 4Size (Value Added) Quartile
Domestic sales to export elasticity
changes in exports than the rest of the sample. The effect is divided by three when we movefrom the first to the fourth size quartile. This pattern holds regardless of whether the number ofemployees or value added is used as a proxy for firm size. Hence, for smaller firms, domesticperformance is more related to changes in exports.
A more direct way to assess the relevance of the liquidity mechanism is to use sectoral hetero-geneity in terms of dependence upon short-run liquidity. More precisely, we follow a method-ology akin to Rajan and Zingales (1998) and construct a sector-specific indicator of short-runneeds for working capital. For each firm, our data contains the working capital requirement,computed by the INSEE. For each sector, the working capital requirement ratio (WCR/CF)is computed as the average working capital requirement divided by the average cash flow ofthe sector. A sector is either defined at the 2-digit (NES 36) or 3-digit (NES 114) level. Thisindicator represents the need of the sector in terms of short-run liquidity; a high value of WCRimplies that firms in the considered sector have a higher need for short-term liquidity. Hetero-geneity across sectors in terms of WCR can be explained by differences in the production ordistribution processes, which can affect the frequency of earnings and payments.Columns (1) and (2) of Table 9 show the effect of exports on domestic sales for two differentsamples, which are characterized by either a high (above median) or low (below median)working capital requirement ratio. The difference is striking: a 10% exogenous increase in
27
CEPII, WP No 2011-33 Export dynamics and sales at home
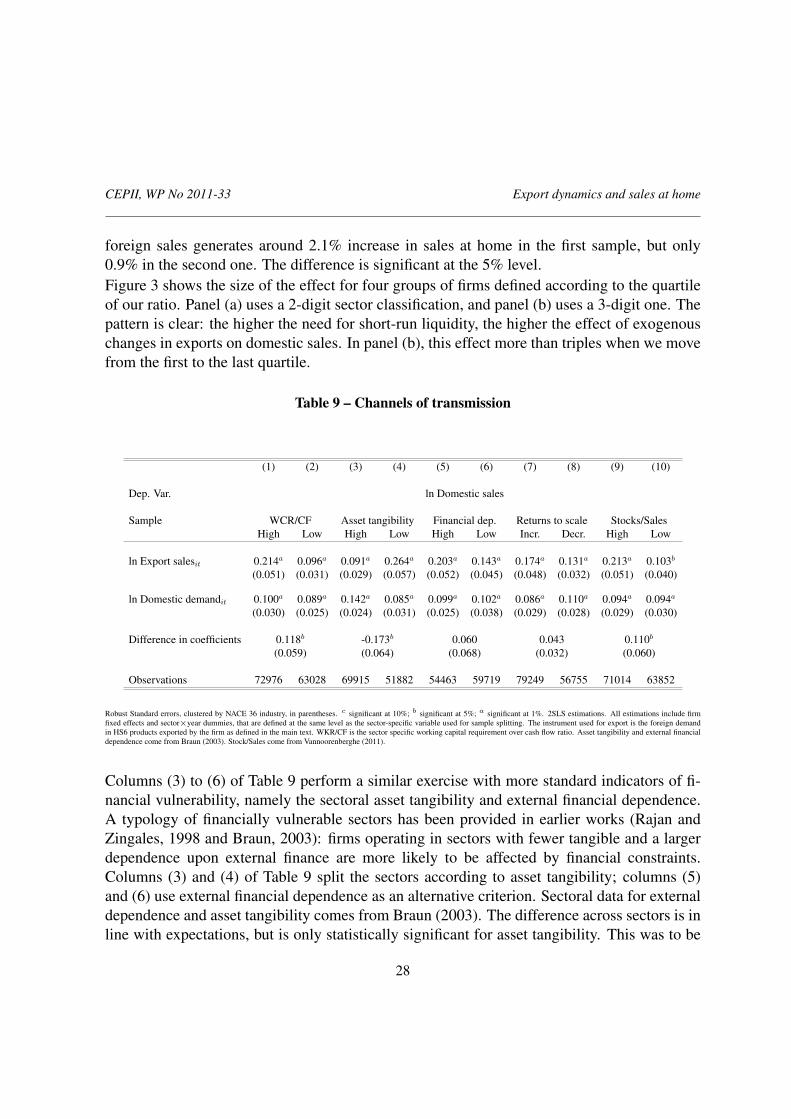
foreign sales generates around 2.1% increase in sales at home in the first sample, but only0.9% in the second one. The difference is significant at the 5% level.Figure 3 shows the size of the effect for four groups of firms defined according to the quartileof our ratio. Panel (a) uses a 2-digit sector classification, and panel (b) uses a 3-digit one. Thepattern is clear: the higher the need for short-run liquidity, the higher the effect of exogenouschanges in exports on domestic sales. In panel (b), this effect more than triples when we movefrom the first to the last quartile.
Table 9 – Channels of transmission
(1) (2) (3) (4) (5) (6) (7) (8) (9) (10)
Dep. Var. ln Domestic sales
Sample WCR/CF Asset tangibility Financial dep. Returns to scale Stocks/SalesHigh Low High Low High Low Incr. Decr. High Low
ln Export salesit 0.214a 0.096a 0.091a 0.264a 0.203a 0.143a 0.174a 0.131a 0.213a 0.103b
(0.051) (0.031) (0.029) (0.057) (0.052) (0.045) (0.048) (0.032) (0.051) (0.040)
ln Domestic demandit 0.100a 0.089a 0.142a 0.085a 0.099a 0.102a 0.086a 0.110a 0.094a 0.094a
(0.030) (0.025) (0.024) (0.031) (0.025) (0.038) (0.029) (0.028) (0.029) (0.030)
Difference in coefficients 0.118b -0.173b 0.060 0.043 0.110b
(0.059) (0.064) (0.068) (0.032) (0.060)
Observations 72976 63028 69915 51882 54463 59719 79249 56755 71014 63852
Robust Standard errors, clustered by NACE 36 industry, in parentheses. c significant at 10%; b significant at 5%; a significant at 1%. 2SLS estimations. All estimations include firmfixed effects and sector×year dummies, that are defined at the same level as the sector-specific variable used for sample splitting. The instrument used for export is the foreign demandin HS6 products exported by the firm as defined in the main text. WKR/CF is the sector specific working capital requirement over cash flow ratio. Asset tangibility and external financialdependence come from Braun (2003). Stock/Sales come from Vannoorenberghe (2011).
Columns (3) to (6) of Table 9 perform a similar exercise with more standard indicators of fi-nancial vulnerability, namely the sectoral asset tangibility and external financial dependence.A typology of financially vulnerable sectors has been provided in earlier works (Rajan andZingales, 1998 and Braun, 2003): firms operating in sectors with fewer tangible and a largerdependence upon external finance are more likely to be affected by financial constraints.Columns (3) and (4) of Table 9 split the sectors according to asset tangibility; columns (5)and (6) use external financial dependence as an alternative criterion. Sectoral data for externaldependence and asset tangibility comes from Braun (2003). The difference across sectors is inline with expectations, but is only statistically significant for asset tangibility. This was to be
28

CEPII, WP No 2011-33 Export dynamics and sales at home
Figure 3 – Domestic turnover and exports: the role of liquidity
(a) 2-digit sector class. (b) 3-digit sector class.
0.1
.2.3
1 2 3 4WCR/CF Quartile
Domestic sales to export elasticity
0.1
.2.3
.4
1 2 3 4WCR/CF Quartile
Domestic sales to export elasticity
expected as these indicators are proxies for financial constraints but do not specifically focuson short-run liquidity needs.
Increasing returns. If the firm’s production technology exhibits increasing returns, a positivedemand shock on the foreign market will increase the production scale and decrease averagecost. This increase of firm’s efficiency should promote sales at home if it is - at least partially -reflected in the price of goods sold in the domestic market. This mechanism will be observedif the products sold by the firm in two different markets are produced using the same inputs.For instance, increasing sales in foreign markets may help to pay the maintenance cost ofproduction facilities, which is shared by all markets. Additional workers may also be hired inthe short-run, therefore increasing the firm’s supply capacity. Similar reasoning applies to thefirm’s capital.Similarly, increasing returns may be related to the evolution of productivity along the businesscycle. An important literature has identified the empirical fact that TFP is procyclical (seeBasu and Fernald, 2001 for a survey). This pattern has been partly explained by the existenceof factor hoarding along the business cycle: firms tend to adjust the rate of capital and laborutilization in periods of booms and busts, which tends to propagate shocks (Burnside et al.,1993; Burnside and Eichenbaum, 1996). For instance, Devereux (2000) shows that aggregatedemand shocks lead firms to reallocate their labor, therefore affecting the skill intensity of tasks
29

CEPII, WP No 2011-33 Export dynamics and sales at home
of individual workers. Firms also have the possibility of adjusting the number of hours workedper employee. Accordingly, positive shocks on aggregate demand in one market are expectedto increase factor utilization within the firm, its efficiency, and therefore its capacity to sellgoods in the other markets. This channel is directly related to the firm’s production capacitiesat the time of the shock. Additionally, it implies that the complementarity between sales indifferent markets mainly come from adjustments in the firm’s TFP (or factor utilization), notfrom factor accumulation. The results shown in Table 13 in the appendix are inconsistentwith this: both TFP and factor accumulation seems to be affected by foreign shocks throughexports.More generally, the IRS story can be tested by looking at the differences across sectors in termsof economies of scale. Namely, we estimate a production function by 2-digit sector (NES 114).Whenever the sum of the labor and capital coefficients is larger than 1, we classify the sectoras an increasing returns sector (decreasing returns otherwise). The results, shown in columns(7) and (8) of Table 9, are consistent with our intuition: in this case, exports have a slightlymore positive impact on domestic sales in the sectors that exhibit increasing returns. However,the coefficient on exports is positive and significant at the 1% level in both sub-samples, andthe difference across samples is insignificant. Moreover, firms in our sample exhibit constantreturns to scale on average. This channel is therefore unlikely to fully explain our results.
Capacity constraints. As mentioned in the introduction, a number of recent papers (Van-noorenberghe, 2011, Nguyen and Schaur, 2011, Soderby, 2011, Blum et al., 2011) emphasizethe fact that the presence of capacity constraints or convex costs may generate substitutabilitybetween sales across destinations. While our results suggest that domestic and foreign salesare complementary, and therefore that other channels are more prevalent 1, we should expectthe complementarity between sales across markets to be stronger in firms facing low capacityconstraints. We test this prediction using sector-specific data on average stock over sales ratiofrom Vannoorenberghe (2011). 2
Columns (9) and (10) show the estimates of the effect of export sales on domestic sales forfirms belonging to sectors in which inventories are either high (above the sample median, incolumn (9)) or low (below the sample median, in column (10)). The results are consistent
1. Note that our findings are not inconsistent with the main results of Vannoorenberghe, 2011 or Nguyen andSchaur, 2011, i.e. that that exporting increases domestic and global sales volatility. Intuitively, it is the existenceof a correlation between sales across markets, rather than the sign of this correlation, that can generate morevolatility.
2. We are very grateful to Gonzague Vannoorenberghe who accepted to share this data. The index is computedfrom Amadeus data on French firms over the period 1998-2007. For more information see Vannoorenberghe(2011).
30

CEPII, WP No 2011-33 Export dynamics and sales at home
with Vannoorenberghe (2011): in sectors where inventories are large, i.e., where firms are lesslikely to face capacity constraints, the complementarity is stronger. However, the coefficienton export sales remains positive and significant in both estimations.
6. CONCLUSIONS
Using a large firm-level database on French firms combining balance-sheet and destination-specific export information over the period 1995-2001, this paper shows that firms’ domesticand export sales are complementary when exports are predicted by exogenous changes in for-eign demand. This result differs from the apparent negative correlation between the two vari-ables. A change in foreign macroeconomic conditions, which is associated with an increase inthe foreign demand of the products sold abroad by the exporter, raises domestic sales. This im-plies that shocks on foreign markets can be channeled into the domestic business cycle throughthe complementarity between firms’ domestic and foreign sales.These results are confirmed by a number of robustness checks, in which we assess the validityof the empirical analysis through different specifications. We use alternatively as instrumentsfor export sales the the foreign imports for the product range exported by the firm, or for itscore product, tariff changes, or large foreign shocks such as civil wars. We take into accountthe possibility that domestic and foreign macroeconomic conditions may be correlated. Wealso control for the possibility that the result might be driven by the correlation between ex-ports and imports for each firm. Our results are valid in cases where the foreign demand forfirms’ products is increasing or decreasing. Finally, our analysis is supported by the naturalexperiment of the Asian crisis in the late 1990’s. Estimation results show that firms that weremore exposed to this crisis through their exports suffered a decrease of their domestic sales ascompared to firms of the control group.Overall, this relation between domestic and foreign sales is at odds with theoretical models ininternational trade where domestic and foreign sales are only connected through exogenousproductivity, as in Melitz (2003). Our results rather suggest that exogenous shocks on theforeign business cycle will reflect in the domestic business cycle through the relationship be-tween domestic and foreign sales. This result has many implications, for instance, in terms ofthe exchange rate policy or trade policy transmission to the domestic economy.The precise channel of transmission, however, remains an avenue for future research. Weprovide evidence in the last section that dependence on short-run liquidity, through workingcapital requirement, may be a relevant explanation. This channel is also consistent with thefact that our result is found to be stronger for small firms than for large ones. However, otherchannels may be relevant, including demand side mechanisms. If the firms’ marginal revenue
31

CEPII, WP No 2011-33 Export dynamics and sales at home
is upward sloping, one should expect a positive relationship between foreign and domesticsales. This may be the case if French firms that serve the same foreign markets (and thereforefacing the same demand shocks) interact with each other on the domestic market, throughtrade in inputs. For instance, assume that two French firms are both selling to Germany thesame final good, and sell to each other the inputs involved in the production of this good.When demand increases in Germany, firms will expand their domestic sales as input demandwill increase at home. This channel should be observed in particular in sectors in which thefirms interact with each other more intensely along the supply chain. Future research shouldprobably attempt to determine the channel of transmission that is prevalent in explaining thisexport-domestic sales complementarity.
32

CEPII, WP No 2011-33 Export dynamics and sales at home
REFERENCES
AHN, J. and MCQUOID, A. (2011), “ Increasing Marginal Costs Among Exporters: The Roleof Financial and Physical Capacity Constraints, and Their Macroeconomic Implications ”, .
BALL, R. J., EATON, J. R. and STEUER, M. D. (1966), “ The Relationship Between UnitedKingdom Export Performance in Manufactures and the Internal Pressure of Demand ”, TheEconomic Journal, vol. 76 no 303.
BASU, S. and FERNALD, J. (2001), “ Why Is Productivity Procyclical? Why Do We Care? ”,in New Developments in Productivity Analysis, National Bureau of Economic Research, Inc,NBER Chapters, pp. 225–302.
BAXTER, M. and KOUPARITSAS, M. A. (2005), “ Determinants of business cycle comove-ment: a robust analysis ”, Journal of Monetary Economics, vol. 52 no 1: pp. 113–157.
BERGIN, P., FEENSTRA, R. and HANSON, G. (209), “ Volatility due to Outsourcing: Theoryand Evidence ”, Mimeo.
BERNARD, A. and JENSEN, B. (1999), “ Exceptional exporter performance: cause, effect, orboth? ”, Journal of International Economics, vol. 47 no 1: pp. 1–25.
BERNARD, A. and WAGNER, J. (1998), “ Export Entry and Exit by German Firms ”, NBERWorking Paper W6538.
BERTHOU, A. and HUGOT, J. (2011), “ How does innovation affects the internationalizationpatterns of firms? ”, EFIGE country report France.
BLUM, B. S., CLARO, S. and HORSTMANN, I. J. (2011), “ Occasional vs Perennial Ex-porters: The Impact of Capacity on Export Mode ”, .
BRAUN, M. (2003), “ Financial Contractibility and Asset Hardness ”, Harvard University, De-partment of Economics Working Paper.
BURNSIDE, C. and EICHENBAUM, M. (1996), “ Factor-Hoarding and the Propagation ofBusiness-Cycle Shocks ”, American Economic Review, vol. 86 no 5: pp. 1154–74.
BURNSIDE, C., EICHENBAUM, M. and REBELO, S. (1993), “ Labor Hoarding and the Busi-ness Cycle ”, Journal of Political Economy, vol. 101 no 2: pp. 245–73.
33

CEPII, WP No 2011-33 Export dynamics and sales at home
BURSTEIN, A., KURZ, C. and TESAR, L. (2008), “ Trade, production sharing, and the inter-national transmission of business cycles ”, Journal of Monetary Economics, vol. 55 no 4:pp. 775–795.
DE LOECKER, J. (2007), “ Do exports generate higher productivity? Evidence from Slove-nia ”, Journal of International Economics, vol. 73 no 1: pp. 69–98.
DEVEREUX, P. J. (2000), “ Task Assignment over the Business Cycle ”, Journal of LaborEconomics, vol. 18 no 1: pp. 98–124.
DUNLEVY, J. A. (1980), “ A Test of the Capacity Pressure Hypothesis within a SimultaneousEquations Model of Export Performance ”, The Review of Economics and Statistics, vol. 62no 1: pp. 131–35.
EATON, J., KORTUM, S. and KRAMARZ, F. (2004), “ Dissecting Trade: Firms, Industries,and Export Destinations ”, American Economic Review Papers and Proceedings, vol. 94no 2: pp. 150–154.
EATON, J., KORTUM, S. and KRAMARZ, F. (2011), “ An Anatomy of International Trade:Evidence from French Firms ”, Econometrica, vol. Forthcoming.
EKHOLM, K., MOXNES, A. and ULLTVEIT-MOE, K.-H. (2011), “ Manufacturing restructur-ing and the role of Real exchange rate shocks: A firm level analysis ”, Journal of Interna-tional Economics, vol. Forthcoming.
FRANKEL, J. A. and ROSE, A. K. (1998), “ The Endogeneity of the Optimum Currency AreaCriteria ”, Economic Journal, vol. 108 no 449: pp. 1009–25.
FROOT, K. A. (1989), “ Consistent covariance matrix estimation with cross-sectional depen-dence and heteroskedasticity in financial data ”, Journal of Financial and Quantitative Anal-ysis, vol. 24: pp. 333–335.
HAYNES, S. E. and STONE, J. A. (1983), “ Secular and Cyclical Responses of U.S. Trade toIncome: An Evaluation of Traditional Models ”, The Review of Economics and Statistics,vol. 65 no 1: pp. 87–95.
HUBBARD, G. (1998), “ Capital Market Imperfections and Investment ”, Journal of EconomicLiterature, vol. 36 no 3: pp. 193–225.
34
CEPII, WP No 2011-33 Export dynamics and sales at home
HUMMELS, D., JORGENSEN, R., MUNCH, J. and XIANG, C. (2010), “ The Wage and Em-ployment Effects of Outsourcing: Evidence from Danish Matched Worker-Firm Data ”,Mimeo.
MELITZ, M. (2003), “ The Impact of Trade on Intra-Industry Reallocations and AggregateIndustry Productivity ”, Econometrica, vol. 71 no 6: pp. 1695–1725.
NGUYEN, D. and SCHAUR, G. (2011), “ Cost linkages transmit volatility across markets ”,Mimeo.
PARK, A., YANG, D., SHI, X. and JIANG, Y. (2009), “ Exporting and Firm Performance:Chinese Exporters and the Asian Financial Crisis ”, Nber working papers, National Bureauof Economic Research, Inc.
PARK, A., YANG, D., SHI, X. and JIANG, Y. (2010), “ Exporting and Firm Performance:Chinese Exporters and the Asian Financial Crisis ”, The Review of Economics and Statistics,vol. 92 no 4: pp. 822–842.
RAJAN, R. G. and ZINGALES, L. (1998), “ Financial Dependence and Growth ”, AmericanEconomic Review, vol. 88 no 3: pp. 559–86.
SODERBY, A. (2011), “ Market size, Structure, and Access: Capacity constraints and trade ”,Mimeo.
STOCK, J. H. and YOGO, M. (2005), “ Testing for Weak Instruments in Linear IV Regres-sion ”, in ANDREWS, D. W. and STOCK, J. H. (editors), Identification and Inference forEconometric Models: Essays in Honor of Thomas Rothenberg, Cambridge: CambridgeUniversity Press.
VAN BIESEBROECK, J. (2005), “ Exporting raises productivity in sub-Saharan African manu-facturing firms ”, Journal of International Economics, vol. 67 no 2: pp. 373–391.
VANNOORENBERGHE, G. (2011), “ Firm volatility and exports ”, Forthcoming Journal of In-ternational Economics.
WAGNER, J. (2007), “ Exports and Productivity: A Survey of the Evidence from Firm-levelData ”, The World Economy, vol. 30 no 1: pp. 60–82.
ZILBERFARB, B.-Z. (1980), “ Domestic Demand Pressure, Relative Prices and the ExportsSupply Equation-More Empirical Evidence ”, Economica, vol. 47 no 188: pp. 443–50.
35

CEPII, WP No 2011-33 Export dynamics and sales at home
A1. INSTRUMENTS: FIRST STAGES
Table 10 – First stage estimations
(1) (2) (3) (4) (5)Dep. Var. ln export sales
Instruments
FDit 0.372a
(0.038)
FDcoreit 0.239a
(0.041)
τXit -0.010b
(0.004)
WarXit -0.283a
(0.051)
CrisisXit -0.050a
(0.014)
DDit 0.102a
(0.029)
DDcoreit 0.084a
(0.018)
Observations 146702 146702 89302 116344 146702
Robust Standard errors, clustered by NACE 36 industry, in parentheses. c significant at 10%; b significant at 5%; a significant at 1%. 2SLS estimations. First stage estimates of Table 4:columns (2) and (3); Table 6: columns (3) and (5); and Table 8: column (6). All estimations include firm fixed effects and sector × year dummies. See the data appendix for more detailson the computation of the instruments.
36
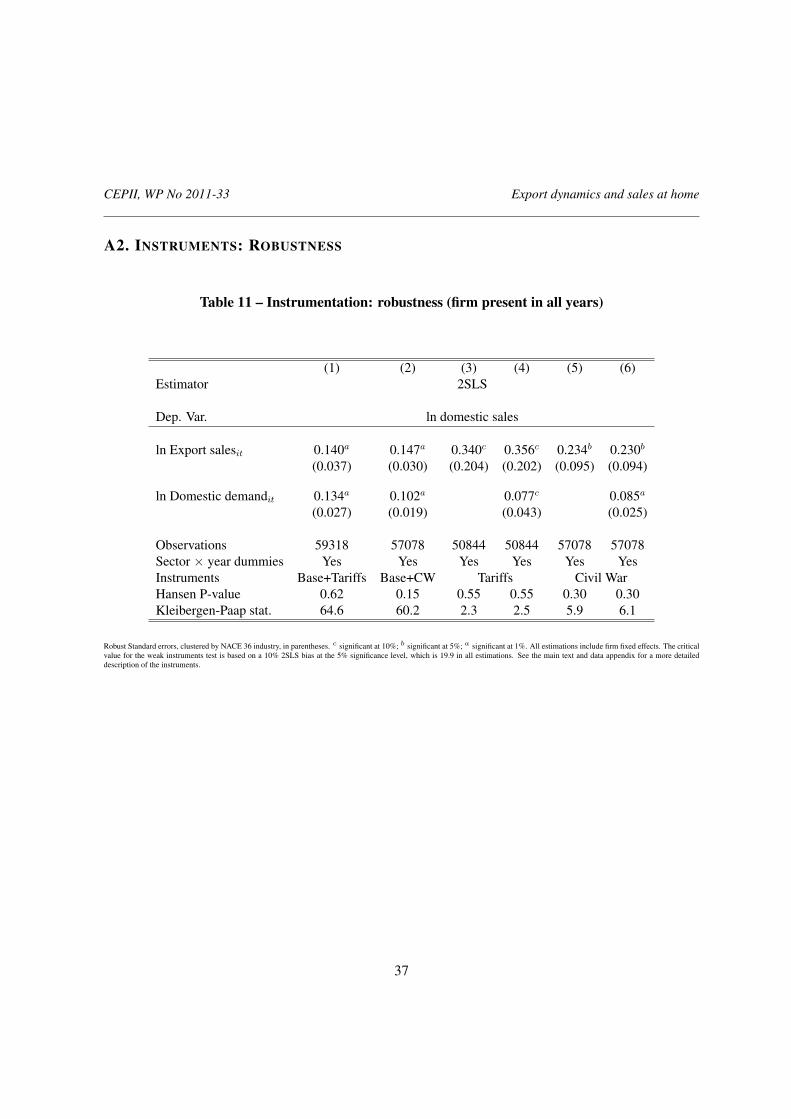
CEPII, WP No 2011-33 Export dynamics and sales at home
A2. INSTRUMENTS: ROBUSTNESS
Table 11 – Instrumentation: robustness (firm present in all years)
(1) (2) (3) (4) (5) (6)Estimator 2SLS
Dep. Var. ln domestic sales
ln Export salesit 0.140a 0.147a 0.340c 0.356c 0.234b 0.230b
(0.037) (0.030) (0.204) (0.202) (0.095) (0.094)
ln Domestic demandit 0.134a 0.102a 0.077c 0.085a
(0.027) (0.019) (0.043) (0.025)
Observations 59318 57078 50844 50844 57078 57078Sector × year dummies Yes Yes Yes Yes Yes YesInstruments Base+Tariffs Base+CW Tariffs Civil WarHansen P-value 0.62 0.15 0.55 0.55 0.30 0.30Kleibergen-Paap stat. 64.6 60.2 2.3 2.5 5.9 6.1
Robust Standard errors, clustered by NACE 36 industry, in parentheses. c significant at 10%; b significant at 5%; a significant at 1%. All estimations include firm fixed effects. The criticalvalue for the weak instruments test is based on a 10% 2SLS bias at the 5% significance level, which is 19.9 in all estimations. See the main text and data appendix for a more detaileddescription of the instruments.
37
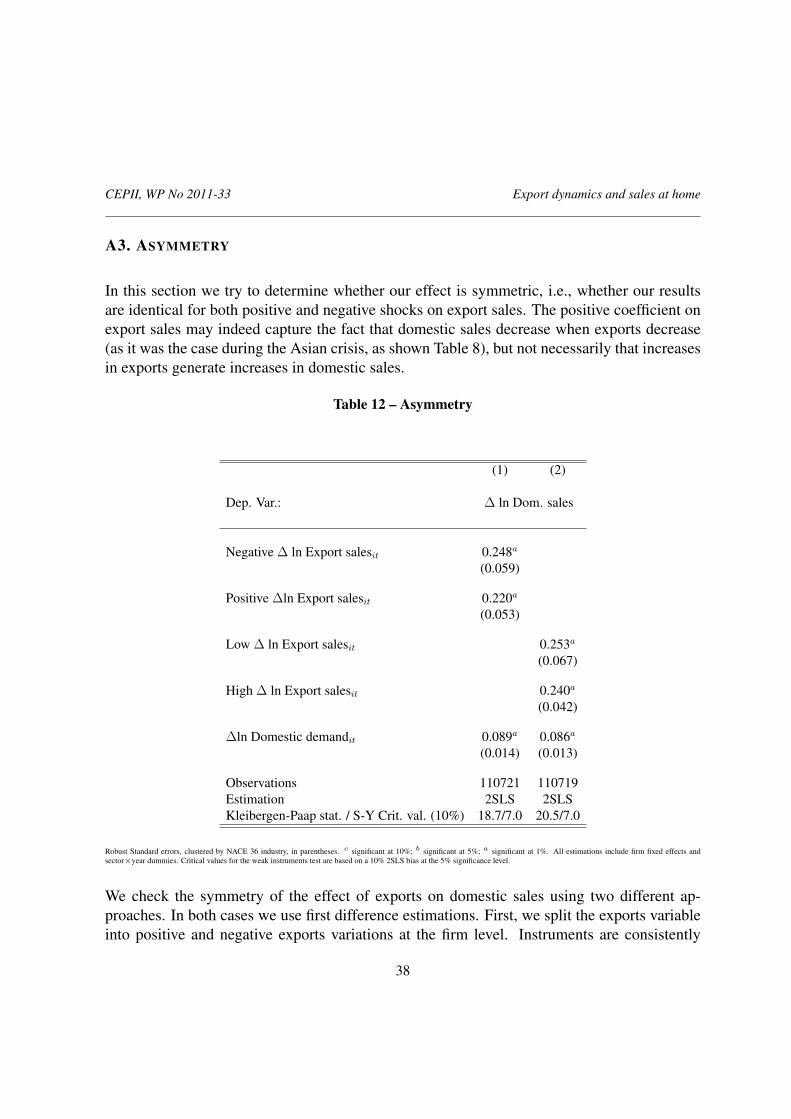
CEPII, WP No 2011-33 Export dynamics and sales at home
A3. ASYMMETRY
In this section we try to determine whether our effect is symmetric, i.e., whether our resultsare identical for both positive and negative shocks on export sales. The positive coefficient onexport sales may indeed capture the fact that domestic sales decrease when exports decrease(as it was the case during the Asian crisis, as shown Table 8), but not necessarily that increasesin exports generate increases in domestic sales.
Table 12 – Asymmetry
(1) (2)
Dep. Var.: ∆ ln Dom. sales
Negative ∆ ln Export salesit 0.248a
(0.059)
Positive ∆ln Export salesit 0.220a
(0.053)
Low ∆ ln Export salesit 0.253a
(0.067)
High ∆ ln Export salesit 0.240a
(0.042)
∆ln Domestic demandit 0.089a 0.086a
(0.014) (0.013)
Observations 110721 110719Estimation 2SLS 2SLSKleibergen-Paap stat. / S-Y Crit. val. (10%) 18.7/7.0 20.5/7.0
Robust Standard errors, clustered by NACE 36 industry, in parentheses. c significant at 10%; b significant at 5%; a significant at 1%. All estimations include firm fixed effects andsector×year dummies. Critical values for the weak instruments test are based on a 10% 2SLS bias at the 5% significance level.
We check the symmetry of the effect of exports on domestic sales using two different ap-proaches. In both cases we use first difference estimations. First, we split the exports variableinto positive and negative exports variations at the firm level. Instruments are consistently
38

CEPII, WP No 2011-33 Export dynamics and sales at home
modified versions of the ones previously presented. Second, we divide exports according towhether their variations are above or below the firm-level average. Results are provided inTable (12). In both cases, the effect of negative export variations is found to be slightly largerthan the effect of a positive export variation on domestic sales growth. Overall, these resultsconfirm our previous findings that exogenous changes in exports drive domestic sales in thesame direction. This result is observed for both positive and negative variations of exports.
A4. FACTOR ACCUMULATION VS. TFP GAINS
The positive effect of foreign shocks on domestic sales can either be channeled through morefactor accumulation or TFP variations. Whether one is more affected that the other may helpus understand the precise channels of transmission. In Table 13 we estimate the effect ofexogenous export variations on capital and labor (columns (2) and (3)) and on TFP 1 (column(4)). Column (1) replicates our baseline results. Column (5) simply shows the result of aregression of domestic sales on capital, labor and TFP. The total effect of exports on domesticsales is the sum of the coefficients on exports from columns (2) to (4), weighted by the impactof each factor on domestic sales shown in column (5). Our results suggest that the shocksaffecting export sales both affect factor accumulation and TFP, with a higher effect on TFP.Accounting for the effect of each component on the firms’ domestic sales, factor accumulationand TFP variations are found to explain one and two thirds of the overall effect, respectively.
1. TFP is computed sector by sector using Olley and Pakes (1996) methodology.
39

CEPII, WP No 2011-33 Export dynamics and sales at home
Table 13 – Decomposition of the effect
(1) (2) (3) (4) (5)Estimator 2SLSDep. var. ln Dom.
Salesln # Work-ers
ln K stock ln TFP ln Dom.Sales
ln Export salesit 0.158a 0.129a 0.148a 0.212a
(0.029) (0.022) (0.024) (0.027)
ln Domestic demandit 0.105a 0.013 0.020 0.095a
(0.021) (0.017) (0.017) (0.018)
ln # workersit 0.664a
(0.026)
ln K stockit 0.189a
(0.012)
ln TFPit 0.753a
(0.031)
Observations 146702 146702 146702 146702 146702Estimation 2SLS 2SLS 2SLS 2SLS FEKleibergen-Paap stat. / S-Y Crit. val. (10%) 94.9/16.4 94.9/16.4 94.9/16.4 94.9/16.4 -
Robust Standard errors, clustered by NACE 36 industry, in parentheses. c significant at 10%; b significant at 5%; a significant at 1%. All estimations include firm fixed effects and sector× year dummies. Critical values for the weak instruments test are based on a 10% 2SLS bias at the 5% significance level. Weights are computed using the firm’s average share of exportsin total turnover of the firm in year t. The instrument is the foreign demand in HS6 products exported by the firm and in sector k.
40

CEPII, WP No 2011-33 Export dynamics and sales at home
A5. DATA APPENDIX
The sample is made of yearly firm-level data over the period 1995-2001. Indexes i, j, k, p andt represent the firm, the destination served, the sector the firm belongs to, the product exportedand the time unit (year), respectively. We provide a complete description of the variablesbelow:
Main interest variables
Foreign and Domestic sales (Xit and Yit). The BRN contains direct information on totalsales and export sales. Domestic sales are therefore computed as the difference between totaland export sales.TFP. TFP is computed using the Olley and Pakes (1996) methodology and is estimated sectorby sector (NES 36 classification), therefore allowing for different input coefficients acrosssectors. Capital is deflated using a gross fixed asset deflator from the OECD economic outlookdatabase and value added using a sectoral deflator from the EU-Klems data.Inputs. Capital stock and the number of employees are from the BRN. Firm specific imports,by product and destination, are taken the French customs.
Instruments and controls for domestic demand
Foreign and domestic demands addressed to the firms. Our preferred instrument is thesum of foreign imports in the product-destination served by the firm in year t, weighted bythe share of each product-destination in the firm’s total export over the period. A product isdefined at the 6-digit (HS6) level. Import data comes from BACI (CEPII). Denoting ωijp theaverage share of each product p and destination j in firm i’s exports over the period, and Mjp,t
the imports of destination j of product p during year t, this variable is computed as:
FDit =∑j,p
ωijpMjp,t (6)
The mirror of this variable for domestic demand is:
DDit =∑j,p
ωijpMFR,p,t (7)
where MFR,p,t denotes the French imports of product p during year t. Alternatively, we usesimilar instruments and controls focusing on the firm’s core product, defined as the HS-4
41

CEPII, WP No 2011-33 Export dynamics and sales at home
product with the highest average value of exports over the period. ωcoreij is the weight of
destination j in firm’s i core product exports. We compute:
FDcoreit =
∑j
ωcoreij M core
j,t (8)
And:
DDcoreit =
∑j
ωcoreij M core
FR,t (9)
Firm-specific tariffs. We use information on tariff to construct alternative instruments forexport sales. Firm-specific tariffs are computed as:
τXit =
∑j,p
ωijptjp,t (10)
where tjp,t represents the MFN tariff of destination j in product p. The data comes from theITC. Similar results are obtained with bound tariffs.
Exposure to civil wars. We construct two variables reflecting the exposure of a given firmi to a civil war in country j. The first is a dummy variable that equals 1 if at least one thedestinations to which the firm exported in t − 1 experiences a civil war in year t. The secondequals the sum of the number of civil wars the destination served by the firm, weighted by theshare of exports in these destinations in t− 1:
WarXit =
∑j
Xij,t−1
Xi,t−1
CWj,t (11)
where CWj,t is a dummy that equals 1 if the destination j experienced a civil war in t. Thedata on civil wars comes from the Correlates of War (CoW).
Instruments for imports. We create instruments for firm-level imports using a similar vari-able as for exports. Firms’ imports are instrumented using the foreign supplied addressed tothe firm, FSit. More precisely, we compute the sum of the foreign exports in the product-destination from which the firm imports goods during year t, Xjpt, weighted by the share ofeach product-destination in the firm’s total imports over the period ηijp. A product is defined at
42

CEPII, WP No 2011-33 Export dynamics and sales at home
the 6-digit (HS6) level, ηijp. Export data comes from BACI (CEPII). This variable is computedas:
FSit =∑j,p
ηijpXjp,t (12)
Exposure to the 1997-1998 Asian crisis. We construct a variable similar to the one proposedfor civil wars:
CrisisXit =
∑j∗
expitCrisisj,t (13)
where Crisisj,t is a dummy variable that equals 1 after 1997 for the five Asian countries thatwere hit the most by the Asian crisis (Thailand, Korea, Philippines, Indonesia, Malaysia) andexpit is a dummy variable that equals 1 if the firm exported to one of these countries in 1995or 1996.
43
CEPII, WP No 2011-33 Export dynamics and sales at home
44
LIST OF WORKING PAPERS RELEASED BY CEPII
An Exhaustive list is available on the website: \\www.cepii.fr.
No Tittle Authors
2011-33 Export Dynamics and Sales at Home N. Berman, A. Berthou
& J. Héricourt
2011-32 Entry on Difficult Export Markets by Chinese
Domestic Firms: The Rôle of Foreign Export
Spillovers
F. Mayneris & S. Poncet
2011-31 French Firms at the Conquest of Asian Markets: The
Role of Export Spillovers
F. Mayneris & S. Poncet
2011-30 Environmental Policy and Trade Performance:
Evidence from China
L. Hering & S. Poncet
2011-29 Immigration, Unemployment and GDP in the Host
Country: Bootstrap Panel Granger Causality Analysis
on OECD Countries
E. Boubtane
D. Coulibaly & C. Rault
2011-28 Index Trading and Agricultural Commodity Prices:
A Panel Granger Causality Analysis
G. Capelle-Blancard
& D. Coulibaly
2011-27 The Impossible Trinity Revised: An Application to
China
B. Carton
2011-26 Isolating the Network Effect of Immigrants on Trade M. Aleksynska
& G. Peri
2011-25 Notes on CEPII’s Distances Measures: The Geodist
Database
T. Mayer & S. Zignago
2011-24 Estimations of Tariff Equivalents for the Services
Sectors
L. Fontagné, A. Guillin
& C. Mitaritonna
2011-23 Economic Impact of Potential Outcome of the DDA Y. Decreux
& L. Fontagné
CEPII, WP No 2011-33 Export dynamics and sales at home
45
No Tittle Authors
2011-22 More Bankers, more Growth? Evidence from OECD
Countries
G. Capelle-Blancard
& C. Labonne
2011-21 EMU, EU, Market Integration and Consumption
Smoothing
A. Christev & J. Mélitz
2011-20 Real Time Data and Fiscal Policy Analysis J. Cimadomo
2011-19 On the inclusion of the Chinese renminbi in the SDR
basket
A. Bénassy-Quéré
& D. Capelle
2011-18 Unilateral trade reform, Market Access and Foreign
Competition: the Patterns of Multi-Product Exporters
M. Bas & P. Bombarda
2011-17 The “ Forward Premium Puzzle” and the Sovereign
Default Risk
V. Coudert & V. Mignon
2011-16 Occupation-Eduction Mismatch of Immigrant
Workers in Europe: Context and Policies
M. Aleksynska
& A. Tritah
2011-15 Does Importing More Inputs Raise Exports? Firm
Level Evidence from France
M. Bas
& V. Strauss-Kahn
2011-14 Joint Estimates of Automatic and Discretionary Fiscal
Policy: the OECD 1981-2003
J. Darby & J. Mélitz
2011-13 Immigration, vieillissement démographique et
financement de la protection sociale : une évaluation
par l’équilibre général calculable appliqué à la France
X. Chojnicki & L. Ragot
2011-12 The Performance of Socially Responsible Funds:
Does the Screening Process Matter?
G. Capelle-Blancard
& S. Monjon
2011-11 Market Size, Competition, and the Product Mix of
Exporters
T. Mayer, M. Melitz
& G. Ottaviano
2011-10 The Trade Unit Values Database A. Berthou
& C. Emlinger
2011-09 Carbon Price Drivers: Phase I versus Phase II
Equilibrium
A. Creti, P.-A. Jouvet
& V. Mignon
CEPII, WP No 2011-33 Export dynamics and sales at home
46
No Tittle Authors
2011-08 Rebalancing Growth in China: An International
Perspective
A. Bénassy-Quéré,
B. Carton & L. Gauvin
2011-07 Economic Integration in the EuroMed: Current Status
and Review of Studies
J. Jarreau
2011-06 The Decision to Import Capital Goods in India: Firms'
Financial Factors Matter
A. Berthou & M. Bas
2011-05 FDI from the South: the Role of Institutional Distance
and Natural Resources
M. Aleksynska
& O. Havrylchyk
2011-04b What International Monetary System for a fast-
changing World Economy?
A. Bénassy-Quéré
& J. Pisani-Ferry
2011-04a Quel système monétaire international pour une
économie mondiale en mutation rapide ?
A. Bénassy-Quéré
& J. Pisani-Ferry
2011-03 China’s Foreign Trade in the Perspective of a more
Balanced Economic Growth
G. Gaulier, F. Lemoine
& D. Ünal
2011-02 The Interactions between the Credit Default Swap and
the Bond Markets in Financial Turmoil
V. Coudert & M. Gex
2011-01 Comparative Advantage and Within-Industry Firms
Performance
M. Crozet & F. Trionfetti
2010-33 Export Performance and Credit Constraints in China J. Jarreau & S. Poncet
2010-32 Export Performance of China’s domestic Firms: The
Role of Foreign Export Spillovers
F. Mayneris & S. Poncet
2010-31 Wholesalers in International Trade M. Crozet, G. Lalanne
& S. Poncet
2010-30 TVA et taux de marge : une analyse empirique sur
données d’entreprises
P. Andra, M. Carré
& A. Bénassy-Quéré
2010-29 Economic and Cultural Assimilation and Integration
of Immigrants in Europe
M. Aleksynska
& Y. Algan
2010-28 Les firmes françaises dans le commerce de service G. Gaulier, E. Milet
& D. Mirza
CEPII, WP No 2011-33 Export dynamics and sales at home
47
No Tittle Authors
2010-27 The world Economy in 2050: a Tentative Picture J. Fouré,
A. Bénassy-Quéré
& L. Fontagné
2010-26 Determinants and Pervasiveness of the Evasion of
Customs Duties
S. Jean
& C. Mitaritonna
2010-25 On the Link between Credit Procyclicality and Bank
Competition
V. Bouvatier,
A. Lopez-Villavicencio
& V. Mignon
2010-24 Are Derivatives Dangerous? A Literature Survey G. Capelle-Blancard
2010-23 BACI: International Trade Database at the Product-
Level – The 1994-2007 Version
G. Gaulier
& Soledad Zignago
2010-22 Indirect Exporters F. McCann
2010-21 Réformes des retraites en France : évaluation de la
mise en place d’un système par comptes notionnels
X. Chojnicki
& R. Magnani
2010-20 The Art of Exceptions: Sensitive Products in the Doha
Negotiations
C. Gouel, C. Mitaritonna
& M.P. Ramos
2010-19 Measuring Intangible Capital Investment: an
Application to the “French Data”
V. Delbecque
& L. Nayman
2010-18 Clustering the Winners: The French Policy of
Competitiveness Clusters
L. Fontagné, P. Koenig,
F. Mayneris &S. Poncet
2010-17 The Credit Default Swap Market and the Settlement
of Large Defauts
V. Coudert & M. Gex
2010-16 The Impact of the 2007-10 Crisis on the Geography
of Finance
G. Capelle-Blancard
& Y. Tadjeddine
2010-15 Socially Responsible Investing : It Takes more than
Words
G. Capelle-Blancard
& S. Monjon
2010-14 A Case for Intermediate Exchange-Rate Regimes V. Salins
& A. Bénassy-Quéré

CEPII, WP No 2011-33 Export dynamics and sales at home
48
No Tittle Authors
2010-13 Gold and Financial Assets: Are they any Safe Havens
in Bear Markets?
V. Coudert
& H. Raymond
2010-12 European Export Performance A. Cheptea, L. Fontagné
& S. Zignago
2010-11 The Effects of the Subprime Crisis on the Latin American Financial Markets: An Empirical Assessment
G. Dufrénot, V. Mignon & A. Péguin-Feissolle
2010-10 Foreign Bank Presence and its Effect on Firm Entry and
Exit in Transition Economies
O. Havrylchyk
2010-09 The Disorted Effect of Financial Development on
International Trade Flows
A. Berthou
2010-08 Exchange Rate Flexibility across Financial Crises V. Coudert, C. Couharde
& V. Mignon
2010-07 Crises and the Collapse of World Trade: The Shift to
Lower Quality
A. Berthou & C. Emlinger
2010-06 The heterogeneous effect of international outsourcing on firm productivity
Fergal McCann
2010-05 Fiscal Expectations on the Stability and Growth Pact:
Evidence from Survey Data
M. Poplawski-Ribeiro
& J.C. Rüle
2010-04 Terrorism Networks and Trade: Does the Neighbor Hurt J. de Sousa, D. Mirza
& T. Verdier
2010-03 Wage Bargaining and the Boundaries of the Multinational Firm
M. Bas & J. Carluccio
2010-02 Estimation of Consistent Multi-Country FEERs B. Carton & K. Hervé
2010-01 The Elusive Impact of Investing Abroad for Japanese Parent Firms: Can Disaggregation According to FDI
Motives Help
L. Hering, T. Inui & S. Poncet

Organisme public d’étude et de recherche
en économie internationale, le CEPII est
placé auprès du Centre d’Analyse
Stratégique. Son programme de travail est
fixé par un conseil composé de responsables
de l’administration et de personnalités
issues des entreprises, des organisations
syndicales et de l’Université.
Les documents de travail du CEPII mettent
à disposition du public professionnel des
travaux effectués au CEPII, dans leur phase
d’élaboration et de discussion avant
publication définitive. Les documents de
travail sont publiés sous la responsabilité de
la direction du CEPII et n’engagent ni le
conseil du Centre, ni le Centre d’Analyse
Stratégique. Les opinions qui y sont
exprimées sont celles des auteurs.
Les documents de travail du CEPII sont
disponibles sur le site : http//www.cepii.fr.