
Export and import spillovers in Hungary - ETSG · Export and import spillovers in Hungary P´eter...
28
Export and import spillovers in Hungary P´ eter Harasztosi 1 Central European University 12 August 2010 Very preliminary, comments are welcome Abstract Evidence suggests that export participation can be influenced by the firms imme- diate environment. Peer effects, spillovers encourage firms to engage in trade. So far these studies have been focusing the investigation to the export part of trade. This study examines whether spillovers have an effect on importing additivity using Hungarian product-country level manufacturing trade data from 1996 to 2003. The results suggest that import participation is also encouraged by peers in the vicinity and the effect appears more robust than in the case of exports when compared. However, the effect are found to be moderate, additional peers increase trading probability by 0.5 to 0.9 percentage points for imports and exports respectively. Keywords: export, import, local spillovers JEL classification: 1 P´ eter Harasztosi: CEU, corresponding author: [email protected]. The author is grateful for comments by G´abor B´ ek´ es, Mikl´os Koren
Transcript of Export and import spillovers in Hungary - ETSG · Export and import spillovers in Hungary P´eter...

Export and import spillovers in Hungary
Peter Harasztosi 1
Central European University
12 August 2010
Very preliminary, comments are welcome
Abstract
Evidence suggests that export participation can be influenced by the firms imme-
diate environment. Peer effects, spillovers encourage firms to engage in trade. So
far these studies have been focusing the investigation to the export part of trade.
This study examines whether spillovers have an effect on importing additivity using
Hungarian product-country level manufacturing trade data from 1996 to 2003. The
results suggest that import participation is also encouraged by peers in the vicinity
and the effect appears more robust than in the case of exports when compared.
However, the effect are found to be moderate, additional peers increase trading
probability by 0.5 to 0.9 percentage points for imports and exports respectively.
Keywords: export, import, local spillovers JEL classification:
1 Peter Harasztosi: CEU, corresponding author: [email protected]. The authoris grateful for comments by Gabor Bekes, Miklos Koren

1 Introduction
Empirical literature on the trading behaviour of firms suggests that the ob-served persistence in the foreign market presence of firms can be attributed tofixed costs of entry. The first contributions on this issue by Bernard & Jensen(2004), Bernard & Jensen (1999) were followed by a series of empirical studiesarguing that only the most productive firms are able to overcome such fixedcosts and will subsequently self-select to be an exporter. See e.g. Bernard &Wagner (2001) for Germany, Mayer & Ottaviano (2008) for a sample of EUcountries. The empirical evidence underlining the importance of considerablewithin sector heterogeneity in trade participation, unexplained by economictheory until the seminal paper of Melitz (2003).
Recently, a series of studies argue that self-selection mechanism is also presentin the case of importers and the activity is also subject to a fixed cost. Though,the empirical evidence on the connection between productivity and importingactivity is limited studies suggest that only the more productive firms will sub-stitute their production inputs with foreign intermediates (see e.g. Altomonte& Bekes (2009) or Castellani et al. (2008)). In addition, using imported inter-mediates also results in ex-post increase in productivity as shown by Halpernet al. (2009) for Hungarian manufacturing firms and by Kasahara & Lapham(2008), Kasahara & Rodrigue (2008) for Chilean firms.
The fixed cost of export entry varies considerably by product and destinationcountry.The heterogeneity regarding fixed cost is primarily related to marketsize and distance. Eaton et al. (2008) in their investigation of French export-ing firms show that estimated fixed costs of entry increase with market size.Furthermore, they argue that fixed cost considerations drive within destina-tion differences of intensive margin, that is less efficient firms target smallermarket share of any destination country. Similarly, Akerman & Forslid (2009)model export entry cost being dependent on market size of export destina-tion. As they argue to introduce a toothpaste brand in U.S. is more costlythan in Sweden. The importance of heterogeneity of fixed costs was also notedby Chaney (2008) as he pointed out that firms more often respond to shocksby adjusting extensive than intensive margin.
Recent studies have shown, that presence of other firms in the close vicinitymight increase the probability of firms trade participation by reducing thefixed cost of entry via spillover effect. Aitken et al. (1997) examine Mexicanplants’ export behaviour and find that propensity to trade is positively affectedby presence of multinational firms in the same location only but not tradersin general. On Colombian, Mexican and Moroccan data Clerides et al. (1998)find evidence of positive regional externalities. Similar conclusion is drawn byGreenaway & Kneller (2008) for domestic manufacturers in the UK and byPupato (2007) for Argentine firms. For France, Koenig et al. (2010) have shown
1
the presence of positive spillovers from local exporters on trade participation,but not on the intensity of trade. They also confirmed, that spillovers arethe country and product specific. However, spillover effect were found to benot significant in countries as the US (Bernard & Jensen 2004) and Ireland(Lawless 2005).
Despite the voluminous literature on the export behaviour there is only alimited number of studies who examine either the heterogeneity of firms im-porting behaviour in terms of products and source countries or the relationshipbetween local environment and import activity. Using Hungarian trade dataAltomonte & Bekes (2009) argue that only the most productive firms are ableimport complex bundles of intermediate goods, from many countries of dif-ferent characteristics. However, to our knowledge there is no study thus farinvestigating the effect of peers on importing behaviour.
This paper adds to aforementioned literature and argues that both importingfirms and exporting might benefit from local spillovers from other traders. Theapproach developed by Koenig et al. (2010) will be applied to both export andimport behaviour of Hungarian manufacturing firms at product and countrylevel. For both exporting and importing activities the following questions areasked. Are firms more likely to start trade activity, when there are more tradingfirms in the vicinity? Are spillovers affecting trade participation specific to theproduct firms like to export of procure or the country of origin or destination?To answer these questions a panel of Hungarian manufacturers from 1996 to2003 are examined whose location and export and import activity is knownat product (HS) and country level.
The rest of the paper is structured as follows. Next, section 2 offers a generalempirical strategy to model export or import spillovers. Section 3 gives adescription of the data and the variables, while section 4 looks at the spatialdistribution of traders by trading partner country and traded products. Section5 provides the results and section 6 offers robustness checks and extensions tothe model.
2 Empirical model to assess trade related spillovers
Dynamic trade participation decision is not easy to model. Except for thestructural approach on export entry by Das et al. (2007) studies use reducedform models e.g. Clerides et al. (1998) and model decision of engaging intrading via choice modeling. This study takes this latter route. To describeparticipation in trade the following model is proposed.
2

2.1 Model
A firm engages in exporting product g to country k if it finds such actionprofitable. Also, a firm will decide to import intermediaries if it provides im-provement to production process and increases productivity resulting in higherprofits. This latter mechanism is addressed by e.g. Halpern et al. (2009). Here,a very simple framework is proposed that is to capture both export and im-port incentives. A firm i decides to trade good g, to or from country k, at timet, if it is better off than not doing so. This implies that if firm trades, thenTigkt = 1.
Rit(Tigkt = 1)− Fgkt(Tigk(t−1) = 0) > Rit(Tigkt = 0) (1)
where Rit is the present and expected profits, Fgk is a country product specificfixed cost which the firm incurs when establishing a new trade relationship.The product and country specificity of fixed cost was proposed by Koenig(2005) and Koenig et al. (2010). Thus, the the probability of a product beingtraded by the firm is modelled by the probability that the following inequalityholds.
Rit(Tigkt = 1)−Rit(Tigkt = 0)− Fgkt(1− Tigk(t−1)) > 0 (2)
If other firms in the vicinity are engaged in the same or rather similar tradingactivity, in our argument reduces the fixed cost of entry for the firm. Thecost reducing effects might work by sharing information directly about tradechannels or indirectly by witnessing other firm successful business activity duetrade. The effect of other trader (Nit) in the vicinity on the fixed cost of tradeis modelled the following way:
Fgk = F 0gkN
− 1θ
gkt
where F 0gk is a baseline cost. However, to model trade participation as in eq. 2
empirically has two impediments. On the one hand, the counterfactual profitsor revenue the firm have had if it did not engage in trade is not observable. Toovercome this, it will be assumed that the net gain from trade participationdepends on observed and unobserved firm, country and product variant het-erogeneity. On the other hand, the fixed cost the firm has to pay to establishtrade channels is not directly at the researchers disposal, only its effect can beassessed indirectly. These considerations imply the following empirical model,to be estimated with logit specification.
3
Tigkt =
1, if βXitgk + γNit + ϱi + ςg + τt + υk + εigkt > 0
0, otherwise
(3)
Where Xitgk is a vector of country, firm and product characteristics and Nit
are the number of firm peers engaged in similar activity. The coefficient ofinterest is γ, which if other firms’ presence increases the probability of tradeparticipation and entry is expected to be positive. Unobservables are modelledwith ϱi, ςg, τt, υk at firm, product year and regional level correspondingly.Given the assumption of having been controlled for the unobservables εigkt isassumed to be exogenous and independently distributed across indices. 2
2.2 Proposed covariates
There are several factors that influence participation in trade and thus entervariable Xitgk.
First, the voluminous literature of gravity model estimation (see. e.g Anderson& van Wincoop (2003)) suggest that bilateral trade is positively related to thepartner countries’ GDP and negatively with distance. The role of distance issimilar both in cases of export and imports as it increases variable costs,thus discouraging trade. However the role of GDP might be different in caseof imports and exports depending on products. It might be more profitablefor a firm to sell its products on larger foreign markets in light of higherexpected price or volume, also higher GDP countries are more likely to providehigher quality or more differentiated inputs. However, firms might find it moreadvantageous to procure inputs from a lower GDP country at a lower costs.For these reasons it is worth controlling for both the overall bilateral flowbetween countries of a given product and the GDP of the partner country.Separating the two demand/supply variables also allows for the relaxing ofhomotheticity across goods.
Second, the strand of trade literature on the heterogeneity of trading firmssuggests that those engaged in international look different from nontradersalong a number of dimension. Exporters and importers are on average larger,more productive, pay higher wages and are more capital intensive. This phe-nomenon has been documented both for the U.S. and European countries forexample in Bernard et al. (2007) or in Mayer & Ottaviano (2008) and Castel-lani et al. (2008). Recently, also for Hungary by Altomonte & Bekes (2009).
2That is we assume, that the same good traded with different country is indeed adifferent product and given the controls choices between countries e.g. are inde-pendent for both trades. Data shows that the average number of countries firmsexport a good to or import from has roughly the same distribution.
4

These results suggest to introduce firm size, productivity and average wageinto the vector of control variables.
2.3 Estimation
To estimate the effect of spillovers - coefficient γ in eq. 3 - several issues needto be considered. The number of other firms engaged in similar trade activity,the spillover measure, is correlated with local characteristics. If these are notcontrolled for or are being omitted that induces bias in the estimation.
First, the correlation between trading activity and the number of trading peersmight not be a result of a causal relationship. Firms located in regions close tothe national border have natural advantage in trade. In the case of Hungaryregions west from the Danube have better access to Austria and Germany,which might induce clustering of firms trading with aforementioned countrieson Hungary’s western border. An analogous example can be set up for Eastern-Hungary in the case of Ukrainian or Romanian foreign trade. The geographicaladvantage in trade will result in clustering of firms trading with similar partnercountries, thus the higher propensity to trade is a consequence of the locationand not the economic surroundings. Present study addresses this issue byintroducing location fixed effects and also by explicitly investigating tradingbehaviour towards neighbouring and other countries.
Second, economic shocks to the home or to a foreign country change tradepropensity for all firms simultaneously. Changes in exchange rate, significantreduction in bilateral trade barriers encourage all firms at the same time.Failing to control for this effect implies falsely identifying simultaneous firmbehaviour as spillover effects. To avoid this, on the one hand year and countryfixed effects are included in the estimation, but also spillover variable is laggedby a year, on the other.
Third, the number of trading peers to the firm depends on the density of thelocal economic environment. Cities and agglomerations not only hold morefirms, but provide better financial and transportation services that enhancetrade. It is rational to assume that the same number trading peers will exercisedifferent influence on firms when they are located in dense or in scarcelypopulated areas. Therefore, variables controlling for the mass of employmentin the locality of the firm should be included in estimating equation.
Fourth, more productive firms self select to agglomerations and to biggercities. 3 This implies that agglomeration does not only provide a good en-vironment for traders via agglomeration benefits but also hold relatively more
3The spatial sorting of heterogenous firms has been investigated by Melitz & Ot-taviano (2008) Baldwin & Okubo (2006).
5
productive firms per se that are more likely to trade. For these reasons besidesthe control for the size of the local labour market firm fixed effects are alsoincluded in the regressions.
Fifth, there is an ongoing debate in the international trade literature aboutthe direction of causation between trade and productivity, which is not yetfully resolved. On the one hand firms starting to export might become moreproductive through learning effects and because they have to better themselvesin the global-scale competition. On the other hand, Bernard & Jensen (2004)and Bernard & Jensen (1999) and Melitz (2003) argue that trading firmshave ex-ante productivity advantage. This notion sheds light on the possibleendogeneity of firm characteristics variable.
Sixth, it is important to include product level fixed effects as well. The typeof the product traded is important for at least two reasons. First not all goodshave the same ability to trade, fried and frozen chicken for example. 4 Second,one needs to control for the phenomenon when a spatial cluster of trade ina good is a result of an economic cluster due to first geography variables oreconomies of scale.
Last, firms in the same vicinity might share common unobserved shocks thatdrive their behaviour. The problem rises from using aggregate indicators asregressors on firm level data. As pointed out by Moulton (1990), regressingaggregate variables on micro-level observations has the pitfall of underestimat-ing the standard errors of the coefficient estimate. To handle this estimationproblem standard errors are clustered according to micro-regions.
3 Description of the data
The main source of data are the firm level Hungarian customs declarationstatistics taken from the CEFiG-IEHAS dataset. 5 It contains export and im-port transactions aggregated to the product-country level for economic entitiesin Hungary. The time dimension of the data ranges from 1992 to 2003, how-ever this study uses only 1996 to 2003. 6 The transactions are aggregatedup to HS4 levels. This aggregation makes data-handling easier by reducingdimensionality, while still allows for considerable diversity across products.Hungarian manufacturing firms export 1243 different HS4 products to 215countries, while they import 4774 products from 213 places.
4This example is taken from Miklos Koren5 For a detailed description of the dataset see Bekes et al. (2009)6There are two reasons for the sample cut. First, the 1992-1995 contain years oftransition implying structural changes in the Hungarian economy and furthermoreimportant changes in the political map of ex-socialist countries. Second, due to theimmense datasize, especially in case of imports, even small reduction in dimension-ality considerably improves computation.
6

Another part of the CEFiG-IEHAS dataset is used to observe the firms em-ployment size, share of foreign ownership and location at the municipalitylevel. It also contains necessarily variables are at disposal to calculate firmlevel productivity 7 This part of the data contains the universe of manufac-turing firms over average employment of five from 1992-2003. Hence, the firmscharacteristics and presence are observed even when firm is not engaged inany trading activity.
To examine the effect of peers in the vicinity on the trading propensity of thefollowing two datasets are compiled from the previous sources: one for exam-ining exports and one for imports. The construction is explained for imports,the export is analogous. The import dataset’s basic observation is product-country-firm unit, whose longitudinal dimension is determined by years forwhich firm is observed between 1996 and 2003. It involves only firms that doimport at least once in their time present in the sample, that is, firms thatnever trade are excluded. The main reason for the exclusion is that when afirm does not trade no information is available on goods that firms not import,nor we know anything about source countries.
However, a restriction is implied on the product and country choice set. Firstly,we keep only the top 50 importing partner countries, exhibiting the largestmanufacturing trade volume in the Hungarian import basket over the 1996-2003 span. The list of countries are provided in the Table 4 (Appendix). Sec-ond, the product set that firm import is restricted to those products thatconstitute 90 percent of her import basket in volume. These restrictions weremade by two reasons. First, we would like to neglect the temporary trade firmsexecute to focus on their regular input output procedures, see e.g. Murakozy &Bekes (2009). Second, the restriction also significantly reduces computationalrequirements. 8
The remaining range of products and countries takes into account all thepossibilities that can be described by the firms import behaviour. An examplewould be the following. A choice set is constructed for all product the firmimports at the HS4 level of aggregation, for all the countries that the firmimports from. For a firm that imports two products from three countries thushas a choiceset of six. This exercise is repeated for all years whenever the firmis observed. The construction process results in a unbalanced panel at thefirm-country-product level.
In the case of imports the resulting data contains 499,865 observations, around60 thousand a year. The observations are about the choices of 14,894 firms
7 In this study firm level productivity is estimated by the procedure proposed byLevinsohn & Petrin (2000).8Note, that calculating without restricting the country choiceset is feasible forthe author under currently accessible computing power: The main results remainunchanged. The import is not at all feasible even in compiling the database.
7
among the combination of choices made of 1502 products and 50 markets.On the exporting side we observe 12,365 firms 956 products and due therestrictions 50 markets.
3.1 Dependent variables
The classic variable to measure trade participation takes up one if the firmtrades a particular good with a country at a given year, zero otherwise. Tograsp firms trade entry behaviour modification of the participation dummy isproposed by Koenig et al. (2010). The following description will provide anexport example only, import is analogous. The export entry dummy is one ifthe firm starts to export a good to a given country, that is it exports in yeart but not in t-1 and is zero when the firm does not export. When the firmexported in t-1 a good to a country, the next years dependent variable for thesame good and country is rendered missing. 9
This aforementioned specification of trade entry and has several advantages.First, rendering post-export years missing does not allow continuous and dis-continuous trade spells to play role in the estimation and allows to concentrateon export activities when firms might incur fixed costs of entry. Second, miss-ing dependent variables reduce dimensionality and help calculations. Third, itallows for repeated entries, that is it may take up the value of one more thanonce in the country-product dimension for a firm.
3.2 Spillover variables
The effect of the number peers is in the focus of the present paper, whichrequires defining proximity. This study defines firms to be geographically closeif their headquarters that most likely call on trade decisions are located in thesame micro-region. Micro-region (kisterseg) is the Hungarian equivalent of theNUTS4 level EU category. 10
The spillover variable should capture the number of other firms engaged incertain trade activity. Harnessing product and country dimensions severalspillover variables are proposed, which are summarised in Table 1. The pos-sible number of firms are defined according to whether or not they trade thesame good with the same country. For exports e.g., the number of other firms
9This modification implies that a the following sequence of trade participation01110011 if transformed to 011..01.10This study uses the NUTS classification that stratifies Hungary into 150 micro-regions. Each micro-region contains approximately 4-10 towns and villages, whicharea corresponds to a range where firms are operating within a 20-30 km radius.Their average size is 620 km2 and 70 thousand inhabitants.
8

exporting any other products to any other country, to the same country, otherfirms exporting the same product to other and to the same countries. The vari-ables in this order express the spillovers from the more general to the specific.The first captures the general openness of the microregion where the firm islocated, while the last the expresses the narrowest spillover channel: the set ofpeers with possibly the most specific influence are those who trade the sameHS4 product with the same county.
Table 1Describing spillover variables
statistics share of in 1999 (%)Spillover variables mean
s.dev.max zeroes 1–4 5–10 over
10
number of other exportersdifferent country,
diff. product281.5 545.9 1656 43.4 0.4 1.5 54.8
same country,diff. product
51.0 126.8 737 46.2 9.1 5.8 39.0
different country,same product
2.0 6.1 106 63.6 16.1 4.6 15.8
same country,same product
0.6 1.8 40 69.3 18.6 1.7 10.4
number of other importersdifferent country,
diff. product492.0 832.4 2197 39.93 0.51 1.23 58.33
same country,diff. product
105.0 239.7 1122 42.41 7.15 4.79 45.65
different country,same product
3.6 8.8 71 57.27 14.72 5.18 22.83
same country,same product
1.1 3.1 36 61.4 20.57 4.1 13.92
In Table 1 the first three columns give description about the mean, the stan-
dard deviation and the maximum value for each spillover variable, while the
next three columns concentrates on the left end of the distribution by collect-
ing the share of observations that are zeroes, between 1 and 4, between 5 and
10, etc. The table provides information on the export and import in separate
blocks. Summary figures show that as spillover definition is more restrictive
lessens the number of peers and thus the share of those cells that contain
zero are higher. For example, 43 percent of the observations have no peers
that export any product to a different country, and 70 percent of the same-
country-same-product variable have zero peers. The corresponding figures in
case of imports are 40 and 60 percent.
9
4 Spatial Concentration of Trade
If presence of other firms have positive effect on establishing particular trade
channels firms trading similar or the same good with the same country should
show clustering in space. In fact both Hungarian manufacturing production
and international trade is rather concentrated in space and in volume. Most of
Hungarians foreign trade is concentrated in the capital and in the north-west
regions of Hungary. For example, four of the 20 NUTS3 level geographical en-
tities, Budapest, Gyor-Moson-Sopron, Fejer and Vas are responsible for more
than sixty percent of the export and import volume of Hungary in 1990’s. 11
Besides the concentration in volume one can also witness some spatial bunch-
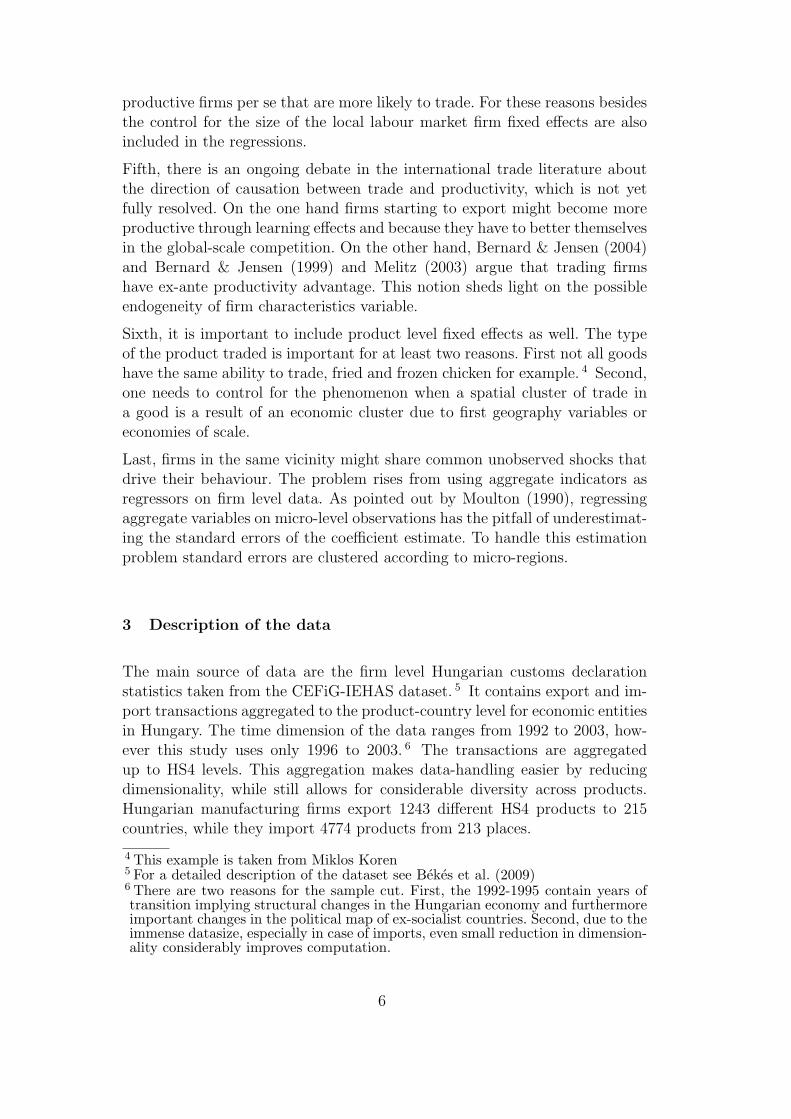
ing in trade activity at product and country level. To give a brief overview
of country level concentration Figure 2 a picture on spatial distribution of
exports related Italy (widespread) and Ireland (concentrated). In addition,
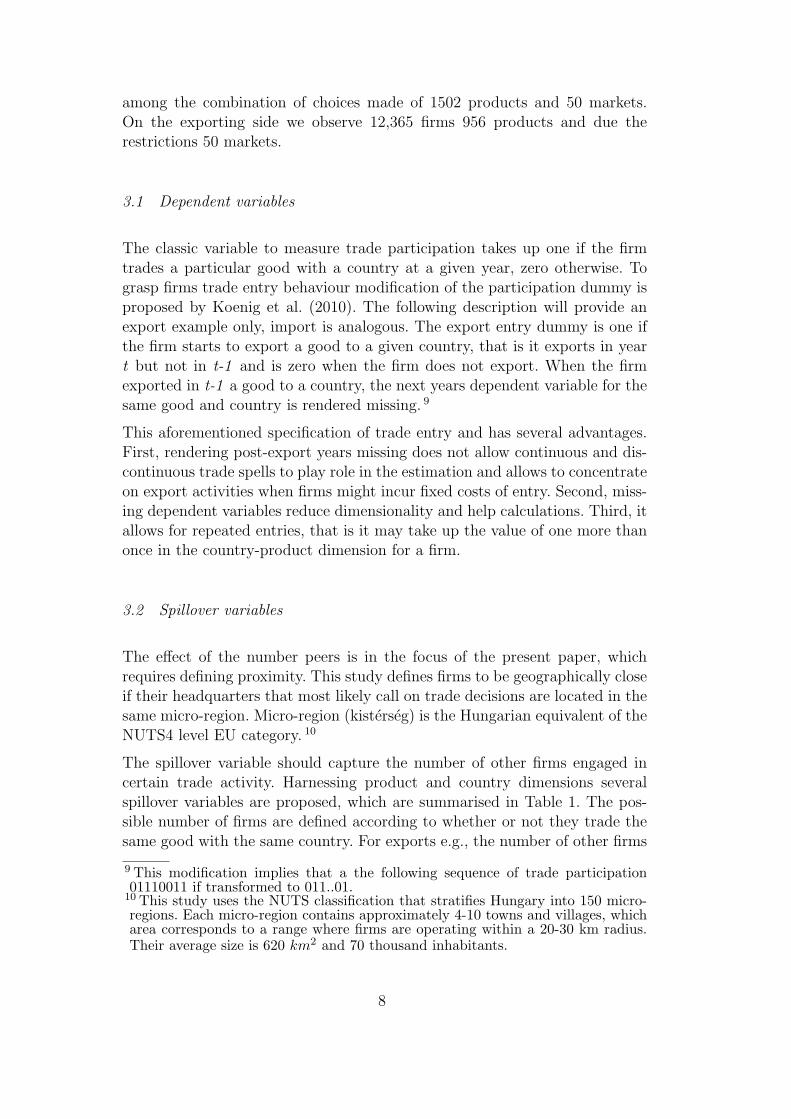
the evolution of Chinese imports from 1996 to 2003 is portrayed in Figure 3.
Chinese imports grew rapidly in the late 1990’s on all margins.
Besides the country specific distribution underlying sectoral distribution is key.
The next lines give examples when a good traded with a particular country
is concentrated in few or even one region. It is natural to assume, that goods
that are concentrated in their production or goods that only few firms use as
inputs will show concentration. Therefore examples are taken from goods that
are traded by many regions.
Export examples: Insulating fittings for electrical machines (HS4:8547) from
the Mor region by 3 firms, while its traded from 32 regions. Leather clothing
(HS4:4203) to Finland is only exported from Pecs region by 5 firms, while
exported from 24 regions. Also, insecticides (HS4:3808) are sold only from
Balatonalmadi region to China, whereas it is exported from 17 regions. The
concentration is also present if only domestic firms are examined, e.g. Pilisc-
saba is the only region that sells footwear (HS4:6406) to France out of the 33
regions exporting the same good.
Import examples: Essential oils, resinoids (HS4:3301) are imported by 17
regions, only the 3 firm in Godollo import the good from Mexico. Woven
fabric (HS4:5513) are imported by 42 regions, but only 3 Mohacs located
manufacturers do import from Belgium. Vulcanized rubber thread and cord
(HS4:4007) is imported to 16 regions, while only 3 regions import it from
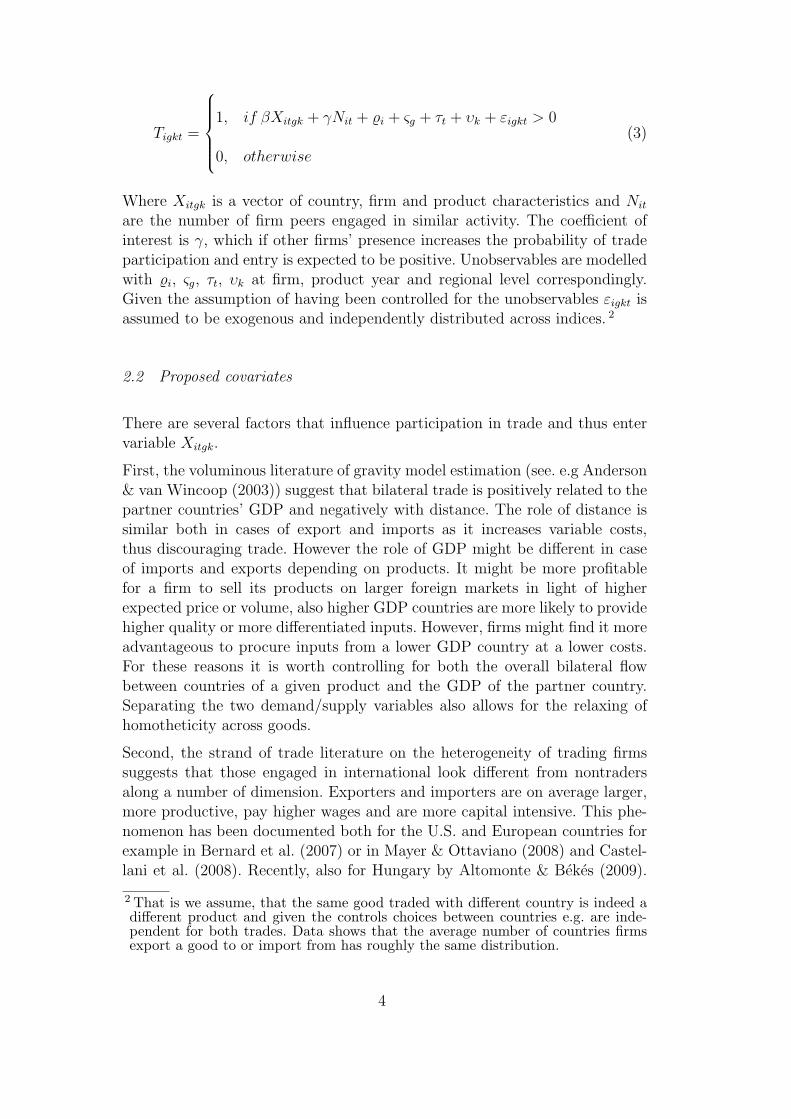
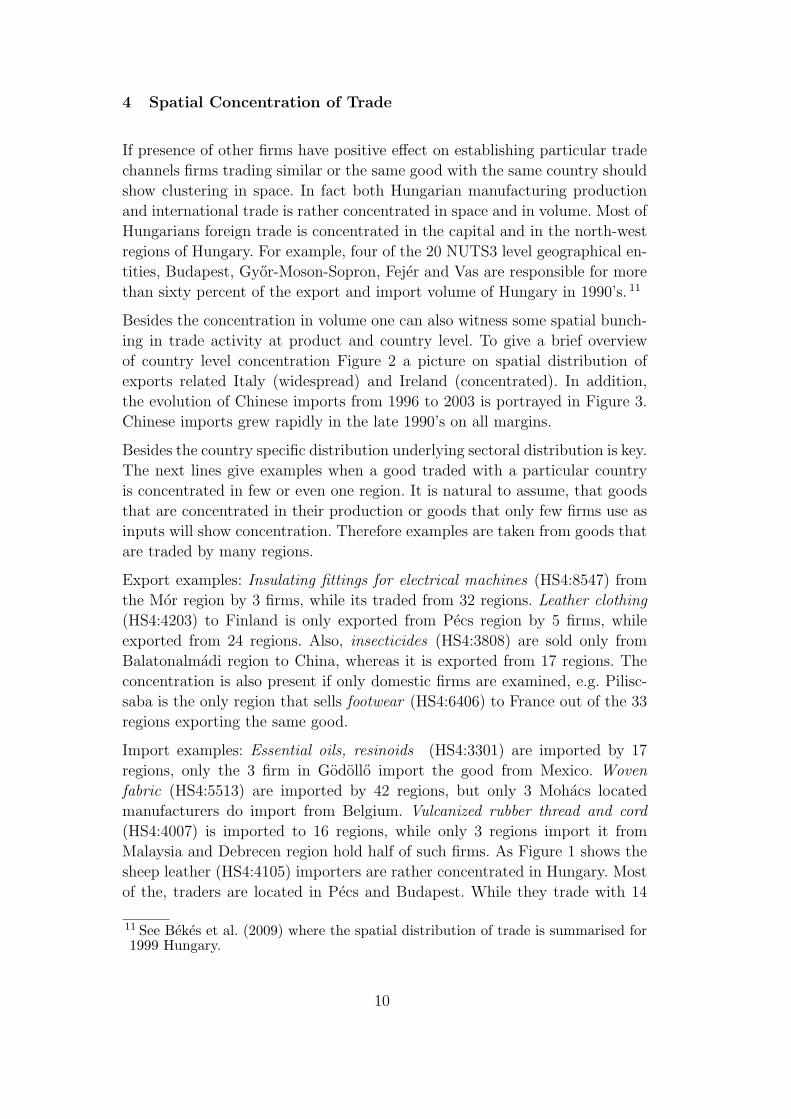
Malaysia and Debrecen region hold half of such firms. As Figure 1 shows the
sheep leather (HS4:4105) importers are rather concentrated in Hungary. Most
of the, traders are located in Pecs and Budapest. While they trade with 14
11 See Bekes et al. (2009) where the spatial distribution of trade is summarised for1999 Hungary.
10
countries only 11 Pcs located firms trade with the UK.
Fig. 1. Sheep leather importers in 1996: Number of firms
The map shows Hungary with the 150 micro-region stratification. The numbers in the regionsshow the number of sheep leather importers in 1996. The colours from green to red mimicsthat distribution.
While examples listed before shed light on possible accumulation of product
and country specific trade related knowledge, they were picked from various
cross sections of time. There is no guarantee these examples are that of firms
benefiting from local spillovers as e.g. favourable simultaneous change such
as that of exchange rate produces similar picture. Econometric technique can
control for these unobservable effects.
5 Results
To assess the effect of the vicinity of peers equation 3 is estimated. In order
to distinguish between the possible spillover effect that help firm to overcome
fixed cost associated with trade entry four different peer groups are used, as
described above. The most specific being the number of other firms in the
locality trading the same good (HS4) to the same country.
For trade entry with an export product to a country Table 2 summarizes
the main result in five columns. The first four includes each spillover vari-
able separately alongside the control variables, while the fifth column includes
all spillovers jointly. The results collecting the import related counterpart of
export regressions is Table 3, which has a analogous structure.
Controls in the export case are not all significant and of the right sign. As
11

Table 2Effect of spillovers on export entry
Dep. Var.: Entry [1] [2] [3] [4] [5]
ln(number of peers+1)– same country, 0.00997** -0.00747diff. product [0.00507] [0.0621]– different country, 0.00830*** -0.0395diff. product [0.00296] [0.0464]– different country, 0.0431*** 0.0853***same product [0.00883] [0.0278]– same country, 0.121*** 0.241***same product [0.0220] [0.0480]ln overall sales 0.00432 0.0042 0.00401 0.00363 0.00399
[0.00670] [0.00676] [0.00685] [0.00683] [0.00682]ln firmsize 0.641*** 0.641*** 0.640*** 0.641*** 0.638***
[0.0537] [0.0537] [0.0539] [0.0538] [0.0540]ln TFP (LP) 0.156*** 0.156*** 0.156*** 0.156*** 0.156***
[0.0309] [0.0309] [0.0309] [0.0308] [0.0308]ln local labour -0.127 -0.127 -0.125 -0.124 -0.117market size [0.141] [0.141] [0.142] [0.142] [0.142]ln GDP/c of for. -0.410** -0.412** -0.414** -0.402** -0.400**Market country [0.188] [0.188] [0.188] [0.188] [0.187]Dummy: year yes yes yes yes yesFixed effects: coun-try, product, firm
yes yes yes yes yes
Observations 102277 102277 102277 102277 102277Pseudo R-squared 0.0432 0.0432 0.0432 0.0433 0.0434
expected one finds that export entry probability is positively effected by firm-
size and productivity. This confirms established stream of empirical evidence,
e.g. summarized in Bernard et al. (2007). We find that in the case of exports
product and country level controls do not behave according to expectation.
One would anticipate, that overall sales that embodies the foreign demand for
domestic good to have a positive effect. Also, the negative coefficient on GDP
is unexpected. Lessons from gravity modeling of international trade suggest,
that GDP expressing general demand and market size is positively correlated
with trade. This result suggest, that firms negatively adjust of the extensive
margin. 12 In addition, we use local labour market control (size of the employ-
ment in the micro-region) to control for agglomeration related trade benefits.
We find no effect.
In the importing case all controls show significant coefficients and none of
unusual sign. Firm level controls are analogous with the export finding and
confirm the international evidence laid down e.g. in Castellani et al. (2008):
12The negative coefficient on the ln GDP is only present when we use time dummycontrols. Otherwise it is significant and positive.
12

Table 3Effect of spillovers on import entry
Dep. Var.: Entry [1] [2] [3] [4] [5]
ln(number of peers+1)– same country, 0.0245*** -0.0331diff. product [0.00772] [0.0233]– different country, 0.0195*** -0.00141diff. product [0.00656] [0.0222]– different country, 0.0646*** 0.0494same product [0.0235] [0.0304]– same country, 0.184*** 0.233***same product [0.0429] [0.0690]ln overall 0.0404*** 0.0402*** 0.0402*** 0.0394*** 0.0393***procurement [0.00725] [0.00721] [0.00723] [0.00734] [0.00734]ln firmsize 0.501*** 0.502*** 0.501*** 0.501*** 0.500***
[0.0408] [0.0407] [0.0408] [0.0406] [0.0407]ln TFP (LP) 0.155*** 0.155*** 0.155*** 0.155*** 0.154***
[0.0244] [0.0244] [0.0245] [0.0245] [0.0245]ln local labour 0.437*** 0.436*** 0.440*** 0.440*** 0.443***market size [0.145] [0.145] [0.145] [0.147] [0.147]ln GDP/c of for. 1.219*** 1.220*** 1.220*** 1.221*** 1.224***market [0.308] [0.306] [0.306] [0.307] [0.304]Dummy: year yes yes yes yes yesFixed effects: coun-try, product, firm
yes yes yes yes yes
Observations 134501 134501 134501 134501 134501Pseudo R-squared 0.047 0.0471 0.0471 0.0473 0.0474
Importing firms are likely to be larger and more productive. Results also sug-
gest that firm are more likely start importing goods that are widely imported
in the country. In contrast to the export case the GDP coefficient is posi-
tive and significant, implying firms are more like to trade with countries with
higher (or increasing due to fixed effects) wealth. This is not surprising as in
the period witnesses rapid growth in China and other far eastern countries
starting to play more important role in Hungarian imports. 13
The spillover variables in the case of export entry are all significant separately
with positive sign. The highest value is however taken up by the spillover
expressing the vicinity of same product, same country peers. The value of
the coefficient is 0.12, which translate to a 0.5 percentage points increase
in the probability of export entry by an additional peer. 14 When all of the
13 From 1992 to 2003 the share of Chinese import by the manufacturing sectorincreased from 2.1 to 7.3 percent, becoming the second largest trade partner. Wecan also see a similar rapid shift in case of the Malaysia and South Korea.14The average probability of choosing to enter exports is 0.38. The average effectis calculated using p(1− p)β, where p is the average trade starting probability
13

spillover variables are included jointly the coefficient doubles, but the marginal
effect increases only slightly, to 0.9 percentage points. One can conclude that
spillover effect are the strongest if they are product specific.
In the case of imports one can observe a similar pattern. However the joint
estimation of all the spillover variable concludes that only product and country
specific spillovers matter. However, as the average probability of starting to
import (0.36) is less than that of starting to import the effect of an additional
peer is slighly lower than in the importing case, being half percentage points.
6 Robustness and extension
Though country, product and firm specific fixed effects control extensively for
unobservables spillovers might not have the same effect over the population
of firms, products. Therefore several robustness checks and extensions are
proposed in this section.
Does product specificity matter? Observing that product and product-
country specific spillovers do seem the strongest, it is a valid question how
much our results depends on the specification of the product. Specifying the
definition of product as an HS2 category instead of HS4 investigates whether
spillover effects allow for a bigger distance in the product space. In Table
5 spillovers are defined over the larger product category of HS2. The result
are quite similar to those from the baseline regression in the case of imports.
This implies that product specificity of the spillovers are well maintained in a
broader category in the case of imports. However, exports results are mixed, as
the three least restrictive spillovers are also significant with higher than before
coefficient. In addition, results suggest that exporters in general discourage
trade.
Is it countries or global regions? We have found that country specific
spillovers mostly significant together with product. One reason might be that
destination or source specific fixed costs to be alleviated are in fact related
to bigger entities, such as trade groups if they exist. Establishing stable pro-
curement channels towards South Americas or East Asia might share common
factors. Also, for example product regulations or red tapes might be the same
with EU. For this reason countries were groups according to geographical
proximity and trade agreements. The tradegroups used instead of countries
in regressions are described in Table 10. Regression results replicating the
baseline methodology collected in Table 6 show similar results to previous
findings.
Are results sensitive to the capital? Budapest, the capital of Hungary
14

can be considered an outlier from an economic geography point of view. It
holds approximately on fifth of the Hungarian population and also the major-
ity of firms. Given its economic density and diversity spillovers can be assumed
to work differently. While it might provide more fertile soil to skill and labour
related spillover and external economies trade-related, product and country
specific information spillovers can be assumed to spread better in cities of
smaller scales and tighter information networks. For these reason robustness
checks were carried out leaving firms with Budapest located headquarters out
of the sample. Results were collected in Table 7. We find that same coun-
try, same product spillovers are positive and significant in both the exporting
and importing case. Interestingly, we find negative coefficient on the broad-
est spillover variable, which suggests a negative general ’competition’ effect.
However, they are only modestly significant.
Does spillover come from foreign firms? An important question of the
foreign direct investment literature is whether foreign presence has a positive
effect on domestic firms. These studies mostly focus on the productivity effects,
it is worth investigating whether foreign firms’ in the vicinity provides a role
model and thus indirectly helps local firms participation in trade. To assess this
channel the spillover variables introduced previously were modified to count
foreign and domestic peers separately. This procedure resulted in 8 spillover
variables, which were included in the product-country specified regression.
The results are displayed in Table 8. Both in the case of exports and imports
estimates that same county same product spillovers are the strongest. Also,
we find that spillovers are not solely directed from foreign firms, but domestic
also. These imply no particular advantage of foreign presence in terms of trade
destination-product choices. Note, however this does not mean that foreign
presence does not have other e.g. productivity advantages.
All in all, robustness check and alternate specification give two interesting
insight. First, we find that country and product specific spillovers are the
strongest and most robust amongst all spillover specification. This implies
that when examining spillovers as effects trading behaviour one needs to be
rather specific. Second, this spillover effect is found to behave similarly in the
case of export and imports.
7 Future research and an extension
Export and import activity is basically a series of simultaneous decision. A
firm has to decide on product and country dimensions together. These choices
are, however, not necessarily independent of one another. Firms in many cases
sell a multitude of products to the same country or sell one to many countries
15
at the same time. The model used in this paper does not necessarily capture
that.
To remedy part of this problem, one dimension of the multiple choice problem,
is addressed here: simultaneous choice of many countries. Following Silvente &
Gimnez (2007), multinomial logit (MNL) regression are ran to assess whether
spillovers from peers significantly influence firms preference ranking when first
decide to trade their core product or core input. That is, only one product is
considered. Therefore, the both the import and exports datasets were altered.
Only the year when firm enters trade is taken, and the choice is made between
the top 50 countries, listed in the Appendix. The preference ranking of the
firm is modeled by the volume of the actual trade in the core product.
A serious disadvantage of the MNL model is that non-choice specific (country)
characteristics cannot be included. Therefore, firm and locality characteristics
are excluded from the model. Fortunately, spillovers can be made choice spe-
cific given the firms’ core product. Three spillovers variable are created, which
differ in the product specificity, counting other firms that trade with the spe-
cific country: same HS4, same HS2 and others.
Regression results displayed in Table 9 find the most narrow, same HS4 type
spillover variable the highest and most significant. However, we also find that
unlike in the case of export, in the case of imports only these very specific
spillovers seem to matter. This result coincides with previous specification for
imports.
8 Concluding Remarks
This paper examined spillover effect generated by neighbouring firms affect
trade probabilities on a Hungarian product-destination level trade data of
manufacturing firms from 1996 to 2003. Uniquely, both the exporting and
importing behaviour of were under scrutiny. We found significant, though
moderate spillover effect on the firms exporting decision related to a country-
product choice. This result is already known and established for exporting case
for other countries, especially France. In addition, it has been argued, that
similar spillover effects are detectable when examining importing behaviour
as well.
Both export and import spillovers appear specific to product and country the
firm chooses to export to or import from. These specific spillovers are robust
across various specifications Spillover effects that are more general, involving
effects from traders of other goods and with other trade partners are either
insignificant or small and are found to be not robust neither in significance and
16

size. Finding suggest studies either academic or policy examining or promoting
trade or cluster policies should target rather specific channels.
References
Aitken, B., Hanson, G. H. & Harrison, A. E. (1997), ‘Spillovers, foreign in-
vestment, and export behavior’, Journal of International Economics 43(1-
2), 103–132.
Akerman, A. & Forslid, R. (2009), Firm heterogeneity and country size de-
pendent market entry cost, Working Paper Series 790, Research Institute of
Industrial Economics.
Altomonte, C. & Bekes, G. (2009), ‘Trade complexity and productivity’, IE-
HAS working papers 14.
Anderson, J. E. & van Wincoop, E. (2003), ‘Gravity with gravitas: A solution
to the border puzzle’, American Economic Review 93(1), 170–192.
Baldwin, R. E. & Okubo, T. (2006), ‘Heterogeneous firms, agglomeration and
economic geography: spatial selection and sorting’, Journal of Economic
Geography 6(3), 323–346.
Bekes, G., Murakozy, B. & Harasztosi, P. (2009), ‘Firms and products in
international trade: Data and patterns for hungary’, Cefig Workig Papers
no. 9.
Bernard, A. B. & Jensen, B. (2004), ‘Why some firms export’, The Review of
Economics and Statistics 86(2), 561–569.
Bernard, A. B., Jensen, J. B., Redding, S. J. & Schott, P. K. (2007), ‘Firms
in international trade’, Journal of Economic Perspectives 21(3), 105–130.
Bernard, A. & Jensen, B. (1999), ‘Exceptional exporter performance: cause,
effect, or both?’, Journal of International Economics 47(1), 1–25.
Bernard, A. & Wagner, J. (2001), ‘Export entry and exit by german firms’,
Review of World Economics (Weltwirtschaftliches Archiv) 137(1), 105–123.
Castellani, D., Serti, F. & Tomasi, C. (2008), Firms in international trade: Im-
porters and exporters heterogeneity in the italian manufacturing industry,
LEM Papers Series 2008/04, Laboratory of Economics and Management
(LEM), Sant’Anna School of Advanced Studies, Pisa, Italy.
Chaney, T. (2008), ‘Distorted gravity: The internsive and extensive margins
of international trade’, American Economic Review 98(4), 1707–1721.
Clerides, S. K., Lach, S. & Tybout, J. R. (1998), ‘Is learning by exporting
important? micro-dynamic evidence from colombia, mexico, and morocco’,
The Quarterly Journal of Economics 113(3), 903–947.
Das, S., Roberts, M. J. & Tybout, J. R. (2007), ‘Market entry costs, producer
heterogeneity, and export dynamics’, Econometrica 75(3), 837–873.
Eaton, J., Kortum, S. & Kramarz, F. (2008), An anatomy of international
17

trade: Evidence from french firms, NBER Working Papers 14610, National
Bureau of Economic Research, Inc.
Greenaway, D. & Kneller, R. (2008), ‘Exporting, productivity and agglomer-
ation’, European Economic Review 52(5), 919–939.
Halpern, L., Koren, M. & Szeidl, A. (2009), Imported inputs and productivity,
Cefig working papers, CeFIG Working Papers no. 8.
Kasahara, H. & Lapham, B. (2008), Productivity and the decision to import
and export: Theory and evidence, Technical report.
Kasahara, H. & Rodrigue, J. (2008), ‘Does the use of imported intermedi-
ates increase productivity? plant-level evidence’, Journal of Development
Economics 87(1), 106–118.
Koenig, P. (2005), ‘International trade and internal geography: Theory and
firm-level evidence’, Phd Dissertation, Univ. Paris I, Sorbonne.
Koenig, P., Mayneris, F. & Poncet, S. (2010), ‘Local export spillovers in
france’, European Economic Review 54(4), 622–641.
Lawless, M. (2005), Firm export participation: Entry, spillovers and tradabil-
ity, MPRA Paper 10005, University Library of Munich, Germany.
Levinsohn, J. & Petrin, A. (2000), Estimating production functions using in-
puts to control for unobservables, NBER Working Papers 7819, National
Bureau of Economic Research, Inc.
Mayer, T. & Ottaviano, G. (2008), ‘The happy few: The internationalisation
of european firms’, Intereconomics: Review of European Economic Policy
43(3), 135–148.
Melitz, M. J. (2003), ‘The impact of trade on intra-industry reallocations and
aggregate industry productivity’, Econometrica 71(6), 1695–1725.
Melitz, M. J. & Ottaviano, G. I. P. (2008), ‘Market size, trade, and produc-
tivity’, Review of Economic Studies 75(1), 295–316.
Moulton, B. R. (1990), ‘An illustration of a pitfall in estimating the effects of
aggregate variables on micro unit’, The Review of Economics and Statistics
72(2), 334–38.
Murakozy, B. & Bekes, G. (2009), Temporary trade, IEHAS Discussion Papers
0909, Institute of Economics, Hungarian Academy of Sciences.
Pupato, G. (2007), ‘Non-market interactions and entry into export markets:
an empirical analysis’, University of British Columbia, Working paper.
URL: http://grad.econ.ubc.ca/pupa/Research.html
Silvente, F. & Gimnez, J. (2007), ‘Information spillovers and the choice of
export destination: A multinomial logit analysis of spanish young smes’,
Small Business Economics 28(1), 69–86.
18

9 Appendix
Fig. 2. Concentrated and widespread trade: exporting firms to Italy and Ireland
(a) Italy 2003
(b) Ireland 2003
Maps provide a picture of spatial distribution of exporting firms inHungary in 2003 to two countries respectively. The spatial stratifica-tion is by micro-region. Both Italy and Ireland are in the top 15 tradepartner countries by manufacturing export volume in the 1996-2003period. The graphs are coloured from dark green to orange by increas-ing number of firms. Italy gives and example of a widespread, whileIreland a concentrated spatial structure.
19
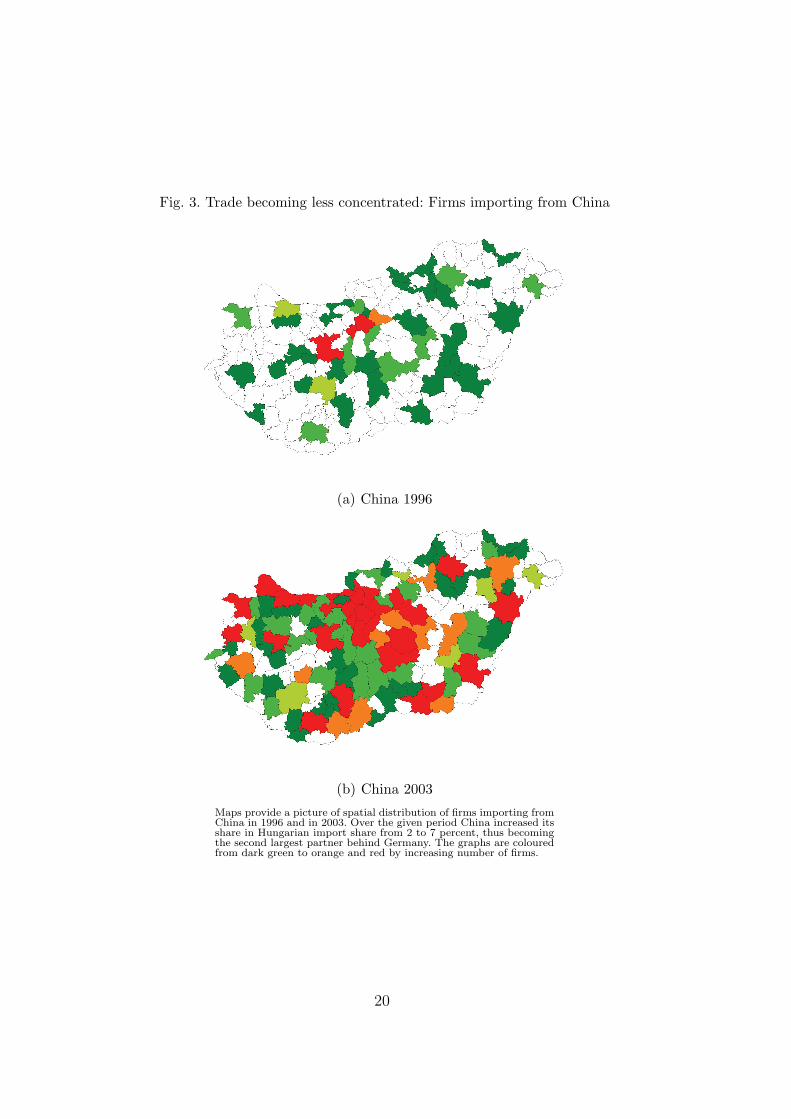
Fig. 3. Trade becoming less concentrated: Firms importing from China
(a) China 1996
(b) China 2003
Maps provide a picture of spatial distribution of firms importing fromChina in 1996 and in 2003. Over the given period China increased itsshare in Hungarian import share from 2 to 7 percent, thus becomingthe second largest partner behind Germany. The graphs are colouredfrom dark green to orange and red by increasing number of firms.
20

Table 4Most important 50 trading partners
IMPORT PARTNERS
1 Germany 11 Belgium 21 Finland 31 Hong Kong 41 Mexico2 Italy 12 Spain 22 South Korea 32 Thailand 42 Serbia3 Austria 13 Poland 23 Turkey 33 Malaysia 43 Australia4 France 14 Japan 24 Russia 34 Brazil 44 Philippines5 UK 15 China 25 Ukraine 35 Indonesia 45 South Africa6 USA 16 Romania 26 India 36 Bulgaria 46 Belarus7 Netherlands 17 Sweden 27 Canada 37 Israel 47 Estonia8 Cyprus 18 Taiwan 28 Croatia 38 Singapore 48 Malta9 Switzerland 19 Slovenia 29 Ireland 39 Norway 49 Tajikistan10 Slovakia 20 Denmark 30 Portugal 40 Greece 50 Uganda
EXPORT PARTNERS
1 Germany 11 Poland 21 Denmark 31 Israel 41 Hong Kong2 Austria 12 USA 22 Finland 32 Australia 42 Emirates3 Romania 13 Russia 23 Serbia 33 Belarus 43 Taiwan4 Slovakia 14 Croatia 24 Lithuania 34 Portugal 44 Singapore5 Italy 15 Belgium 25 Greece 35 Ireland 45 Egypt6 Cyprus 16 Ukraine 26 Bosnia 36 China 46 South Korea7 France 17 Slovenia 27 Japan 37 Kazakhstan 47 Mexico8 Netherlands 18 Sweden 28 Turkey 38 South Africa 48 Malaysia9 Switzerland 19 Spain 29 Canada 39 Macedonia 49 Saudi Arabia10 USA 20 Bulgaria 30 Norway 40 Brazil 50 Iran
21

Table 5Spillover effects with HS2 product definition
Dep. Var.: Trade entry Export Import
ln(number of peers+1)– same country, diff. product 0.102*** 0.0135
[0.0300] [0.0314]– different country, diff. product -0.116*** -0.0323
[0.0284] [0.0257]– different country, same product 0.109*** 0.0272
[0.0377] [0.0299]– same country, same product 0.258*** 0.232***
[0.0557] [0.0299]ln overall sales/procurement 0.0288** 0.0600***
[0.0117] [0.0230]ln firmsize 0.605*** 0.505***
[0.0631] [0.0543]ln TFP (LP) 0.147*** 0.154***
[0.0281] [0.0275]ln local labour market -0.0514 0.296**
[0.156] [0.127]ln GDP of for. Market -0.229 0.760***
[0.173] [0.199]Dummy: year yes yesFixed effects: country, product, firm yes yesObservations 108768 129548Pseudo R-squared 0.0464 0.0469
22
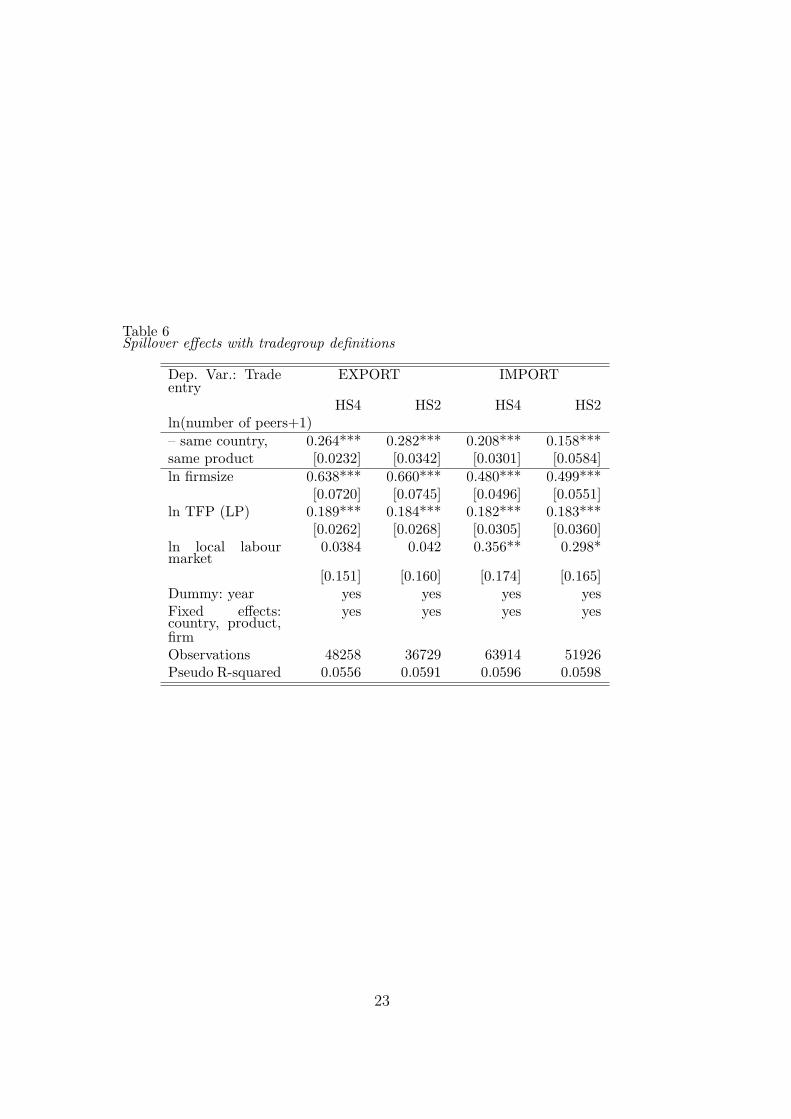
Table 6Spillover effects with tradegroup definitions
Dep. Var.: Tradeentry
EXPORT IMPORT
HS4 HS2 HS4 HS2ln(number of peers+1)– same country, 0.264*** 0.282*** 0.208*** 0.158***same product [0.0232] [0.0342] [0.0301] [0.0584]ln firmsize 0.638*** 0.660*** 0.480*** 0.499***
[0.0720] [0.0745] [0.0496] [0.0551]ln TFP (LP) 0.189*** 0.184*** 0.182*** 0.183***
[0.0262] [0.0268] [0.0305] [0.0360]ln local labourmarket
0.0384 0.042 0.356** 0.298*
[0.151] [0.160] [0.174] [0.165]Dummy: year yes yes yes yesFixed effects:country, product,firm
yes yes yes yes
Observations 48258 36729 63914 51926Pseudo R-squared 0.0556 0.0591 0.0596 0.0598
23

Table 7Spillover effects without firms in Budapest
Dep. Var.: Trade entry Export Import
ln(number of peers+1)– same country, diff. product 0.0896 0.00627
[0.0616] [0.0407]– different country, diff. product -0.115* -0.0959**
[0.0608] [0.0421]– different country, same product 0.0564 0.185***
[0.0719] [0.0573]– same country, same product 0.375** 0.577***
[0.155] [0.139]ln overall sales/procurement 0.00842 0.0469***
[0.00923] [0.00826]ln firmsize 0.674*** 0.458***
[0.0719] [0.0471]ln TFP (LP) 0.169*** 0.173***
[0.0429] [0.0338]ln local labour market -0.135 0.307**
[0.148] [0.141]ln GDP/c of for. market -0.392 1.575***
[0.256] [0.301]Dummy: year yes yesFixed effects: country, product, firm yes yesObservations 74283 102277Pseudo R-squared 0.0448 0.0432
24

Table 8Spillover effects by origin
Dep. Var.: Export entry Import entry
ln(number of domestic peers+1)– same country, diff. product -0.0863 -0.107
[0.0551] [0.0653]– different country, diff. product 0.0898 0.0694
[0.0996] [0.112]– different country, same product -0.0514* -0.0123
[0.0273] [0.0264]– same country, same product 0.169*** 0.148***
[0.0386] [0.0357]ln(number of foreign peers+1)– same country, diff. product 0.0752 0.0635
[0.0614] [0.0718]– different country, diff. product -0.121 -0.0528
[0.119] [0.118]– different country, same product 0.165*** 0.0611**
[0.0288] [0.0249]– same country, same product 0.0907*** 0.108***
[0.0283] [0.0385]Controls yes yesDummy: year yes yesFixed effects: country, product, firm yes yesObservations 102277 134501Pseudo R-squared 0.0436 0.0474
25

Table 9Spillover effects with country ranking
EXPORT PANEL
Depvar: rank [1] [2] [3] [4] [5]
ln(number of peers + 1 )– same country, 1.432*** 0.961***diff. product [0.0482] [0.0478]– same country, 1.759*** 0.383***same HS2. prod-uct
[0.243] [0.140]
– same country, 2.651*** 1.317***same HS4. prod-uct
[0.456] [0.176]
ln distance -0.895*** -0.139** -0.546*** -0.715*** -0.230***[0.0311] [0.0544] [0.0869] [0.0649] [0.0520]
ln GDP percapita
0.779*** -0.015 0.322*** 0.512*** -0.0213
[0.0800] [0.0735] [0.118] [0.114] [0.0766]Num. obs. 49900 49900 49900 49900 49900Chi-sq 833.9 1516 79.69 210.8 418.2Num. firms 998 998 998 998 998
IMPORT PANELDepvar: rank [1] [2] [3] [4] [5]
ln(number of peers + 1 )– same country,
0.00211*** 0.00136***diff. product [2.94e-05] [9.70e-05]– same country, 0.0106*** -
0.00327***same HS2. prod-uct
[0.000467] [0.000450]
– same country, 0.188*** 0.157***same HS4. prod-uct
[0.0209] [0.0265]
ln distance -0.608*** -0.518*** -0.572*** -0.614*** -0.563***[0.0741] [0.130] [0.0950] [0.0728] [0.111]
ln GDP percapita
1.243*** 1.029*** 1.143*** 1.117*** 1.035***
[0.0637] [0.122] [0.0668] [0.0745] [0.123]Num. obs. 69650 69650 69650 69650 69650Chi-sq 546.9 8882 3762 325.1 17854Num. firms 1393 1393 1393 1393 1393
26
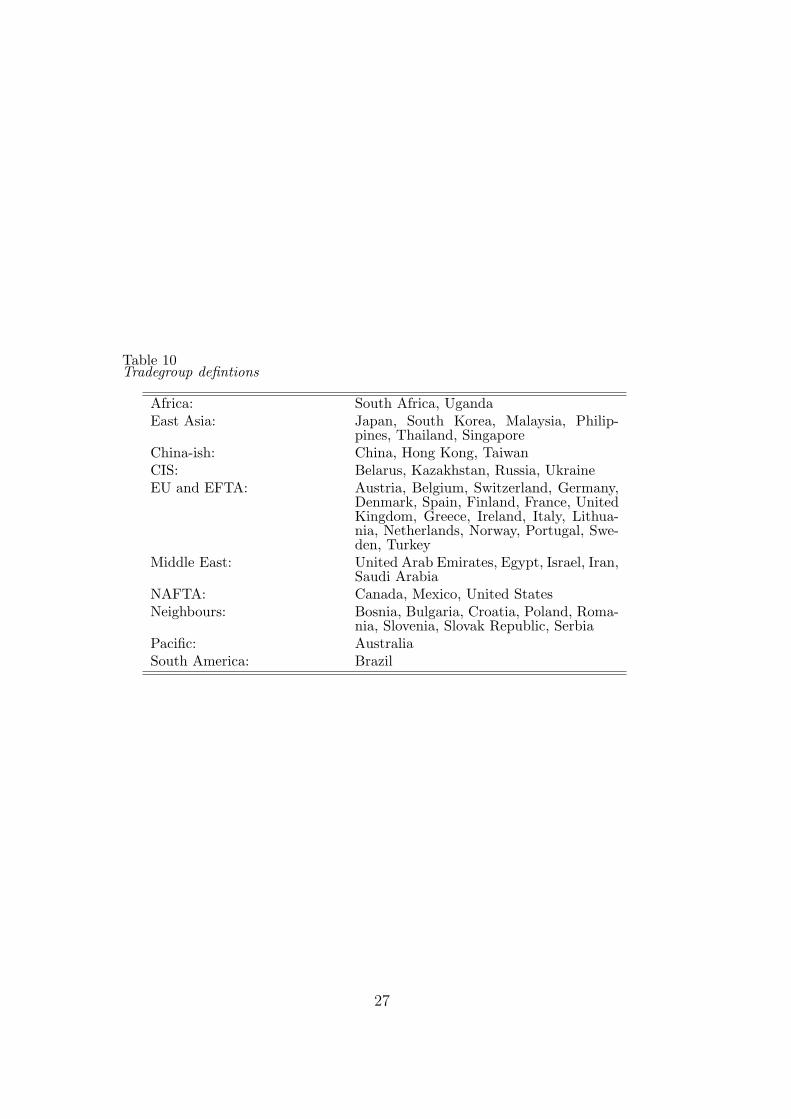
Table 10Tradegroup defintions
Africa: South Africa, UgandaEast Asia: Japan, South Korea, Malaysia, Philip-
pines, Thailand, SingaporeChina-ish: China, Hong Kong, TaiwanCIS: Belarus, Kazakhstan, Russia, UkraineEU and EFTA: Austria, Belgium, Switzerland, Germany,
Denmark, Spain, Finland, France, UnitedKingdom, Greece, Ireland, Italy, Lithua-nia, Netherlands, Norway, Portugal, Swe-den, Turkey
Middle East: United Arab Emirates, Egypt, Israel, Iran,Saudi Arabia
NAFTA: Canada, Mexico, United StatesNeighbours: Bosnia, Bulgaria, Croatia, Poland, Roma-
nia, Slovenia, Slovak Republic, SerbiaPacific: AustraliaSouth America: Brazil
27