High Throughput Exposure Prediction for the ExpoCast Project

ExpoCast: Applications to Integrated Bioactivity - Exposure Ratios John Wambaugh National Center for Computational Toxicology U.S. EPA, Office of Research and Development
Office of Research and Development
Exposure Science in the 21st Century Grantee Kickoff Meeting February 3, 2015
Research Triangle Park, NC
The views expressed in this presentation are those of the author and do not
necessarily reflect the views or policies of the U.S. EPA

Office of Research and Development 2 2
Introduction
• The timely characterization of the human and ecological risk posed by thousands of existing and emerging commercial chemicals is a critical challenge facing EPA in its mission to protect public health and the environment
• While advances have been made in HT toxicity screening, evaluated exposure and dosimetry prediction methods applicable to 1000s of chemicals are needed
November 29, 2014

Office of Research and Development 3
Prioritizing 1000’s of Chemicals
for Further Study
e.g. Judson et al., (2011)
Chemical Research in Toxicology
Potential Exposure
from ExpoCast
mg/kg BW/day
Potential Hazard
from in vitro with
Reverse
Toxicokinetics
Lower
Risk Medium Risk Higher
Risk
• High throughput risk prioritization relies
on three components – high
throughput hazard characterization,
high throughput exposure forecasts,
and high throughput pharmacokinetics
2007
NRC
Report

Office of Research and Development 4
Concentration
Resp
on
se
In vitro Assay AC50
Concentration (mM)
Assay AC50
with Uncertainty
High-Throughput Bioactivity
• Tox21: Examining >10,000 chemicals using ~50 assays intended to identify interactions with biological pathways (Schmidt, 2009)
• ToxCast: For a subset (>1000) of Tox21 chemicals ran >500 additional assays (Judson et al., 2010)
• Most assays conducted in dose-response format (identify 50% activity concentration – AC50 – and efficacy if data described by a Hill function)
• All data is public: http://actor.epa.gov/

Office of Research and Development 5
In Vitro Bioactivity, In Vivo Toxicokinetics,
and Human Exposure
Num
ber
of C
hem
icals
Egeghy et al. (2012):
There is a paucity of data for providing exposure context to HTS data

Office of Research and Development 6
High Throughput Toxicokinetics
(HTTK)
High Throughput
In Vitro Bioactive
Concentration
Simulated Human In Vivo Doses Populations
that are More Sensitive
HTTK in vitro
data
Monte Carlo Simulation of Biological
Variability
Combination of higher exposure and sensitivities
Images from Thinkstock

Office of Research and Development 7
In Vitro Bioactivity, In Vivo Toxicokinetics,
and Human Exposure
Num
ber
of C
hem
icals
Egeghy et al. (2012):
There is a paucity of data for providing exposure context to HTS data

Office of Research and Development 8
Num
ber
of C
hem
icals
Egeghy et al. (2012):
There is a paucity of data for providing exposure context to HTS data
HTTK studies like Wetmore et al. (2012), can address the need for toxicokinetic data
In Vitro Bioactivity, In Vivo Toxicokinetics,
and Human Exposure

Office of Research and Development 9
High Throughput Exposure
Forecasts
5
• New methods for Exposure
Forecasting (ExpoCast)
currently being considered
for prioritization of chemical
testing in the Endocrine
Disrupter Screening
Program (EDSP)
• Favorably reviewed by July
2014 Federal Insecticide,
Fungicide, Rodenticide Act
(FIFRA) Scientific Advisory
Panel (SAP)
https://federalregister.gov/a/2014-12593
Agency/Docket Numbers:
EPA-HQ-OPP-2014-0331
FRL-9910-22

Office of Research and Development 10
Consensus Model Building with the
SEEM Framework
• Incorporate multiple models into consensus predictions for 1000s of chemicals
within the Systematic Empirical Evaluation of Models (SEEM) framework
• Evaluate/calibrate predictions with available measurement data across many
chemical classes
• Analogous efforts for both human and ecological exposures

Office of Research and Development 11 11
Predicting NHANES exposure rates
R2 ≈ 0.5 indicates that we can predict 50% of the chemical to chemical variability in mean NHANES exposure rates Same five predictors work for all NHANES demographic groups analyzed – stratified by age, sex, and body-mass index
Wambaugh et al., 2014

Office of Research and Development 12 12
Number of Chemicals
Heuristic Description
Inferred NHANES
Chemical Exposures
(106)
Full Chemical
Library ( 7784)
ACToR “Consumer use &
Chemical/Industrial Process
use”
Chemical substances in consumer products (e.g., toys, personal
care products, clothes, furniture, and home-care products) that
are also used in industrial manufacturing processes. Does not
include food or pharmaceuticals.
37 683
ACToR “Chemical/Industrial
Process use with no
Consumer use”
Chemical substances and products in industrial manufacturing
processes that are not used in consumer products. Does not
include food or pharmaceuticals
14 282
ACToR UseDB “Pesticide
Inert use” Secondary (i.e., non-active) ingredients in a pesticide which
serve a purpose other than repelling pests. Pesticide use of
these ingredients is known due to more stringent reporting
standards for pesticide ingredients, but many of these
chemicals appear to be also used in consumer products
16 816
ACToR “Pesticide Active use” Active ingredients in products designed to prevent, destroy,
repel, or reduce pests (e.g., insect repellants, weed killers, and
disinfectants).
76 877
TSCA IUR 2006 Total
Production Volume Sum total (kg/year) of production of the chemical from all sites
that produced the chemical in quantities of 25,000 pounds or
more per year. If information for a chemical is not available, it
is assumed to be produced at <25,000 pounds per year.
106 7784
High-throughput exposure
heuristics
12 Wambaugh et al., 2014

Office of Research and Development 13 13
Calibrated Exposure Predictions
for 7968 Chemicals
Upper 95% Prediction
Median Prediction
Wambaugh et al., 2014

Office of Research and Development 14 14
• We focus on the median and upper 95% predictions because the lower 95% is below the NHANES limits of detection (LoD)
• Dotted lines indicate 25%, median, and 75% of the LoD distribution
Upper 95% Prediction
Median Prediction
NHANES LoD
Calibrated Exposure Predictions
for 7968 Chemicals
Wambaugh et al., 2014

Office of Research and Development 15 15
• Chemicals currently monitored by NHANES are distributed throughput the predictions
• Chemicals with the first and ninth highest 95% limit are monitored by NHANES
NHANES LoD
Calibrated Exposure Predictions
for 7968 Chemicals
Wambaugh et al., 2014

Office of Research and Development 16 16
• The grey stripes indicate the 4182 chemicals with no use indicated by ACToR
UseDB for any of the four use category heuristics
NHANES LoD
Calibrated Exposure Predictions
for 7968 Chemicals
Wambaugh et al., 2014

Office of Research and Development 17
• Bisphenol A was active at some
concentration for 17 of 18 ER-related
assays
Assay Conc.
NVS_NR_bER_ACC 0.19
NVS_NR_hER_ACC 0.20
NVS_NR_mERa_ACC 0.27
OT_ER_ERaERa_0480_ACC 1.27
OT_ER_ERaERa_1440_ACC 1.34
OT_ER_ERaERb_0480_ACC 0.23
OT_ER_ERaERb_1440_ACC 0.25
OT_ER_ERbERb_0480_ACC 0.23
OT_ER_ERbERb_1440_ACC 0.19
OT_ERa_EREGFP_0120_ACC 0.33
OT_ERa_EREGFP_0480_ACC 0.52
ATG_ERa_TRANS_up_ACC 0.03
ATG_ERE_CIS_up_ACC 0.05
Tox21_ERa_BLA_Agonist_ratio_ACC 1.88
Tox21_ERa_LUC_BG1_Agonist_ACC 0.14
ACEA_T47D_80hr_Positive_ACC 0.16
Tox21_ERa_BLA_Antagonist_ratio_ACC 13.27
Tox21_ERa_LUC_BG1_Antagonist_ACC 1000000
Integrated Bioactivity :
Exposure Ratio (IBER)

Office of Research and Development 18
• A mathematical model was used to
integrate all assays into a single predicted
active concentration
Integrated Bioactivity :
Exposure Ratio (IBER)
Judson et al., in preparation

Office of Research and Development 19
• The error bar indicates the span between
the median and the minimum plausible
active concentration
Integrated Bioactivity :
Exposure Ratio (IBER)
Judson et al., in preparation

Office of Research and Development 20
• Reverse dosimetry based on HTTK data
was used to predict an oral equivalent
dose that would cause the ACC in plasma
for the 95-percentile, most sensitive adult
Wetmore et al., (2012)
Integrated Bioactivity :
Exposure Ratio (IBER)
Office of Research and Development 21
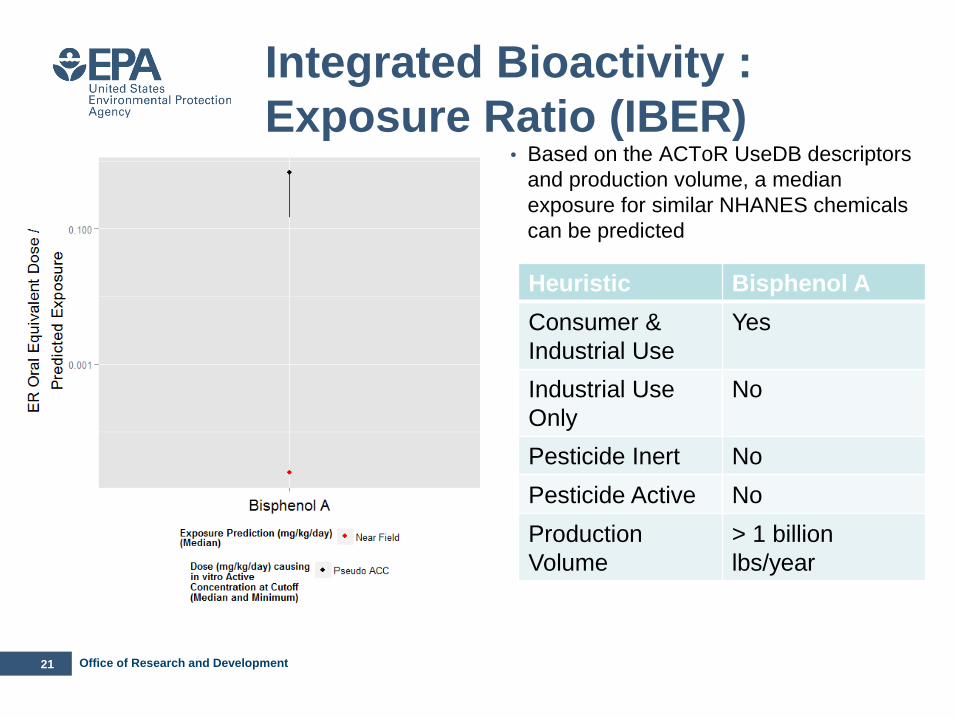
• Based on the ACToR UseDB descriptors
and production volume, a median
exposure for similar NHANES chemicals
can be predicted
Heuristic Bisphenol A
Consumer &
Industrial Use
Yes
Industrial Use
Only
No
Pesticide Inert No
Pesticide Active No
Production
Volume
> 1 billion
lbs/year
Integrated Bioactivity :
Exposure Ratio (IBER)

Office of Research and Development 22
• Due to the large uncertainty, the upper
95% limit of the exposure estimate
credible interval is used
Heuristic Bisphenol A
Consumer &
Industrial Use
Yes
Industrial Use
Only
No
Pesticide Inert No
Pesticide Active No
Production
Volume
> 1 billion
lbs/year
Integrated Bioactivity :
Exposure Ratio (IBER)

Office of Research and Development 23
Integrated Bioactivity :
Exposure Ratio (IBER)
• ANSES (2013) BPA Receipts, 200 ng/kg
BW/d (Workers) and 10 ng/kg BW/d
(Consumers)
• LaKind and Naiman (2011) Estimated
Exposure to BPA from NHANES data in
ng/kgBW/day):
Demographic LaKind and
Naiman (2011)
ExpoCast
Geometric
Mean Median
ExpoCast
Geometric
Mean Upper
95%
Total 35.1 25.0 2193
Age 6-11y 54 63 4984
Age 12-19y 48 59 5169
Age 20-39y* 38.5 57 6056
Age 40-59y* 28.9 57 6056
Age >=60y 27.3 66 84221
Male 39.6 38 3132
Female 31.2 12 1125
*ExpoCast makes single prediction for Age 20-59y

Office of Research and Development 24 24
ToxCast
Bioactivity
Converted to
mg/kg/day with
HTTK
ExpoCast
Exposure
Predictions
December, 2015 Panel:
“Scientific Issues Associated with Integrated
Endocrine Bioactivity and Exposure-Based
Prioritization and Screening“
DOCKET NUMBER:
EPA–HQ–OPP–2014–0614
IBER Scientific Advisory Panel
(SAP)
ToxCast Chemicals

Office of Research and Development 25 25
• The grey stripes indicate the 4182 chemicals with no use indicated by ACToR
UseDB for any of the four use category heuristics
NHANES LoD
Calibrated Exposure Predictions
for 7968 Chemicals
Wambaugh et al., 2014

Office of Research and Development 26 26
Gas-Phase Concentration Model
• 73 total chemicals in model
including SVOCs1 reported
from Wilke et al. (2004)
• 4 chemicals reported from
Little et al. (2012)
• 1 main physicochemical
property that model data (VP).
Other predictors include
formulation descriptors.
Acronyms:
• SVOCs = Semivolatile Organic Compounds
• FRs = Flame Retardants
• VP = Vapor Pressure
• Y°= Gas-phase concentration
Slide from Chantel Nicolas

Office of Research and Development 27 27
Refined Models and Better Data:
SHEDS-HT Chemical to Chemical Variability of NHANES Biomonitoring
~10% Far field (Industrial) Releases Wambaugh et al. (2013)
~50% Indoor / Consumer Use Wambaugh et al. (2014)
Consumer product database and two new near field models in 2014
Office of Research and Development 28
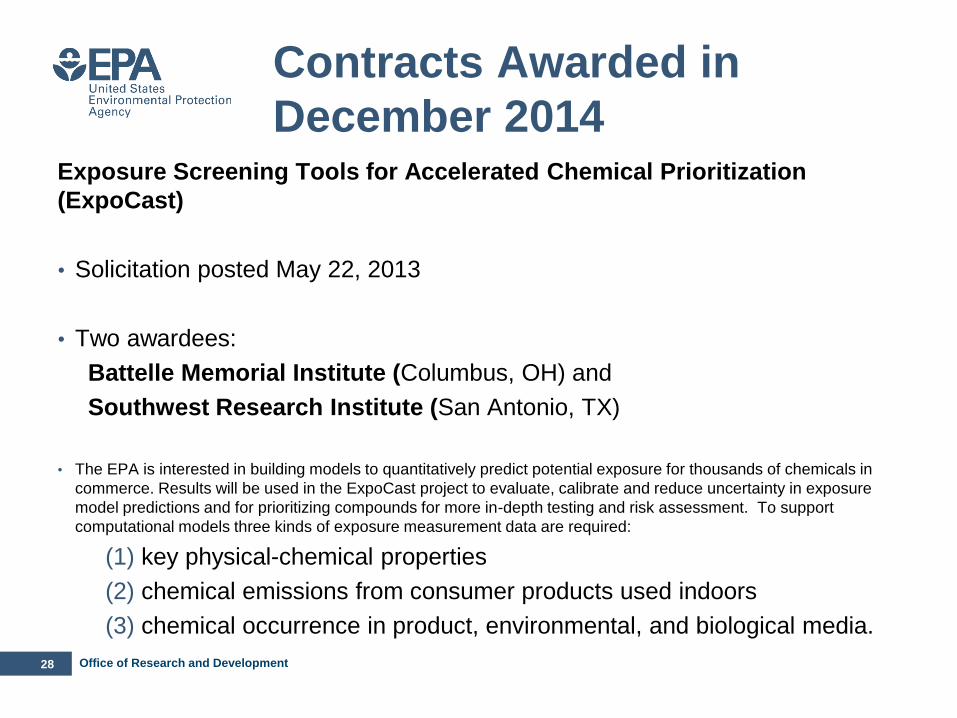
Contracts Awarded in
December 2014 Exposure Screening Tools for Accelerated Chemical Prioritization
(ExpoCast)
• Solicitation posted May 22, 2013
• Two awardees:
Battelle Memorial Institute (Columbus, OH) and
Southwest Research Institute (San Antonio, TX)
• The EPA is interested in building models to quantitatively predict potential exposure for thousands of chemicals in
commerce. Results will be used in the ExpoCast project to evaluate, calibrate and reduce uncertainty in exposure
model predictions and for prioritizing compounds for more in-depth testing and risk assessment. To support
computational models three kinds of exposure measurement data are required:
(1) key physical-chemical properties
(2) chemical emissions from consumer products used indoors
(3) chemical occurrence in product, environmental, and biological media.

Office of Research and Development 29
SEEM Evolution – Human Exposure
Model and Predictors
• Existing complex fate and transport models have low correlation to measured exposures • Near field factor most important
• Simple, readily available data • Better correlation to measured exposures • Similar predictions across demographics
1st
Gen
Calibration/Evaluation Data SEEM Conclusion
2n
d G
en
USEtox
RAIDAR
Near Field / Far Field
NHANES Urine Data
Production Volume
Use Categories
Production Volume
Phys-Chem Properties
NHANES Urine Data
3rd
Gen
• Analysis ongoing SHEDS-HT
Literature Models
CPcat Database
NHANES Urine + Blood
Data
Office of Research and Development 30
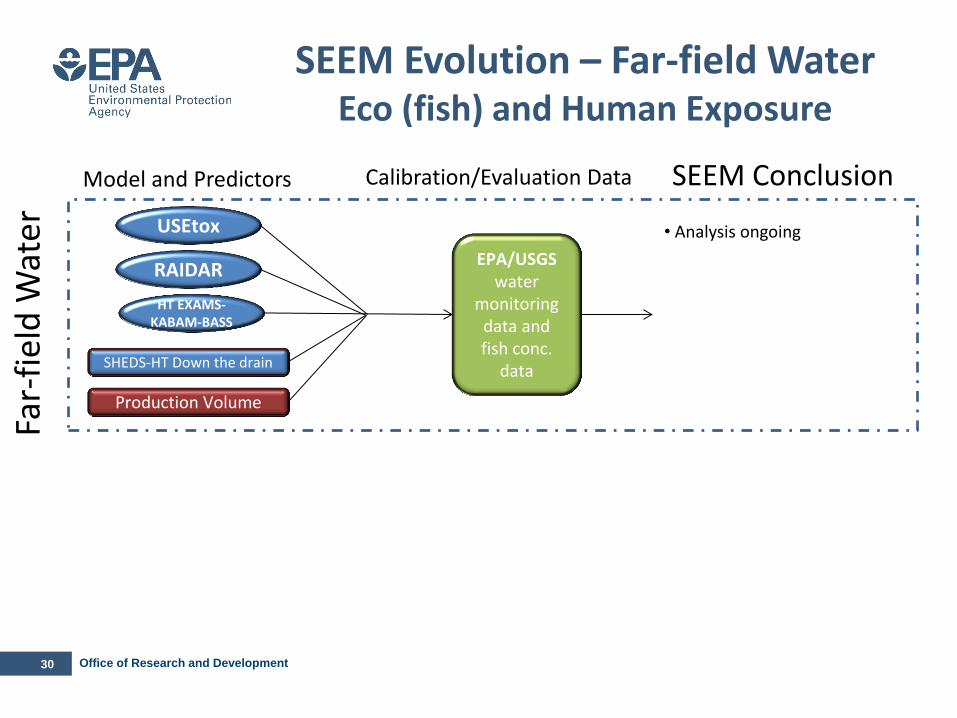
Model and Predictors Calibration/Evaluation Data SEEM Conclusion
USEtox
RAIDAR
SHEDS-HT Down the drain
EPA/USGS water
monitoring data and fish conc.
data
Production Volume
SEEM Evolution – Far-field Water Eco (fish) and Human Exposure
HT EXAMS-KABAM-BASS
Far-
fiel
d W
ater
• Analysis ongoing

Office of Research and Development 31 31
Conclusions
• High throughput risk prioritization relies on three components – high
throughput hazard characterization, high throughput exposure
forecasts, and high throughput pharmacokinetics
• Characterize uncertainty in chemical exposures by examining the
predictive ability of models and the coverage (or lack thereof) of
critical pathways
• Upcoming analysis:
– Augment heuristics with calibrations of new mechanistic HT models for exposure
from consumer use and indoor environment (e.g., SHEDS-HT)
– Develop new data sources with additional chemical descriptors (e.g., CPcatDB)
– Should help decrease uncertainties and increase confidence in extrapolation
– Perform similar analysis for water concentrations

NCCT
Chris Grulke
Richard Judson
Thomas Knudsen
Chantel Nicolas
Robert Pearce
James Rabinowitz
Caroline Ring
Woody Setzer
Imran Shah
Rusty Thomas
John Wambaugh
NERL
Craig Barber
Derya Biryol
Dalizza Colon
Kathie Dionisio
Peter Egeghy
Kim Gaetz
Kristin Isaacs
Julia Rager
Mark Strynar
Jon Sobus
Mike Tornero-Velez
Dan Vallero
*Trainees
*
*
*
Chemical Safety for Sustainability (CSS) Rapid Exposure and Dosimetry (RED) Project
NHEERL Jane Ellen Simmons
Marina Evans
Mike Hughes
Hamner Institutes
Barbara Wetmore
Cory Strope
University of North Carolina, Chapel Hill
Alexander Sedykh
Alex Tropsha
Indiana University
James Sluka
Netherlands Organisation for
Applied Scientific Research (TNO)
Sieto Bosgra
*
National Institute for Environmental
Health Sciences (NIEHS)
Mike Devito
Nisha Sipes
Kyla Taylor
Kristina Thayer
Chemical Computing Group
Rocky Goldsmith
NRMRL
Xiaoyu Liu
North Carolina State University
Anran Wang
University of Michigan
Olivier Jolliet
Michigan State University
Jade Mitchell
University of California, Davis
Deborah Bennett
Arnot Research and Consulting
Jon Arnot
Environmental Protection Agency
Alicia Frame
*
Collaborators
Silent Spring Institute
Robin Dodson
*
Research Triangle Institute
Timothy Fennell
*
The views expressed in this presentation are those of the author and do not
necessarily reflect the views or policies of the U.S. EPA
*