Exploringmasses andCNO surfaceabundancesofred giantstars · FDUP, for (a) the standard stellar...
12
arXiv:1507.01517v1 [astro-ph.SR] 6 Jul 2015 Mon. Not. R. Astron. Soc. 451, 1–?? (2015) Printed 8 November 2018 (MN L A T E X style file v2.2) Exploring masses and CNO surface abundances of red giant stars Ghina M. Halabi 1⋆ , Mounib El Eid 1 1 Department of Physics, American University of Beirut, Bliss Street 11-0236, Beirut 1107 2020, Lebanon Accepted: May 2015. Received ; in original form ABSTRACT A grid of evolutionary sequences of stars in the mass range 1.2-7M ⊙ , with solar-like initial composition is presented. We focus on this mass range in order to estimate the masses and calculate the CNO surface abundances of a sample of observed red giants. The stellar models are calculated from the zero-age main sequence till the early asymptotic giant branch (AGB) phase. Stars of M 2.2M ⊙ are evolved through the core helium flash. In this work, an approach is adopted that improves the mass de- termination of an observed sample of 21 RGB and early AGB stars. This approach is based on comparing the observationally derived effective temperatures and abso- lute magnitudes with the calculated values based on our evolutionary tracks in the Hertzsprung-Russell diagram. A more reliable determination of the stellar masses is achieved by using evolutionary tracks extended to the range of observation. In ad- dition, the predicted CNO surface abundances are compared to the observationally inferred values in order to show how far standard evolutionary calculation can be used to interpret available observations and to illustrate the role of convective mix- ing. We find that extra mixing beyond the convective boundary determined by the Schwarzschild criterion is needed to explain the observational oxygen isotopic ratios in low mass stars. The effect of recent determinations of proton capture reactions and their uncertainties on the 16 O/ 17 O and 14 N/ 15 N ratios is also shown. It is found that the 14 N(p,γ ) 15 O reaction is important for predicting the 14 N/ 15 N ratio in red giants. Key words: convection, nuclear reactions, nucleosynthesis, abundances - stars: evo- lution - stars: low-mass 1 INTRODUCTION After the main sequence evolutionary phase, stars evolve to the red giant branch (RGB). This evolution is initiated by the ignition of shell H-burning surrounding the He core, whose energy flux causes the envelope to expand and the star evolves to the RGB. The expansion increases the opacity and leads to the development of a deep convective envelope. This is the first dredge up event (FDUP), as convection mixes up the products of H-burning to the surface altering the surface composition of the star. In the mass range (4-7)M⊙, stars exhibit blue loops at the beginning of core He burning (see Halabi, El Eid & Champagne (2012), and references therein). The main phase of core He-burning is completed before the track evolves back to the RGB. This leads again to the deepening of envelope convection. For solar metallicity stars of M 4M⊙, a second dredge up (SDUP) ⋆ E-mail: [email protected] can reach deeper regions, which leads to further changes in the surface abundances. This work uses observations obtained for a sample of red giants by Tsuji (2008), hereafter Tsuji08, in order to achieve two goals: (a) to estimate the masses of these giants by matching their observationally derived effective tempera- tures and bolometric magnitudes to the values obtained from the evolutionary tracks in the HR diagram. This is possible since the stars are not pulsating Mira variables (see Section 3.1 for details). We are able to improve the mass determina- tion done by Tsuji08 by using more extended evolutionary tracks to avoid the extrapolation that he partially relied on to determine the mass of some giants, (b) to compare the cal- culated CNO abundances of these models to those inferred from observations in the light of recent determinations of key reaction rates. A large body of observational data is available for the surface CNO abundances in RGB stars (Lambert & Reis 1981; Harris & Lambert 1984a,b; Harris et al. 1988; Lambert et al. 1986; Gilroy & Brown 1991; Tsuji 1991; c 2015 RAS
Transcript of Exploringmasses andCNO surfaceabundancesofred giantstars · FDUP, for (a) the standard stellar...

arX
iv:1
507.
0151
7v1
[as
tro-
ph.S
R]
6 J
ul 2
015
Mon. Not. R. Astron. Soc. 451, 1–?? (2015) Printed 8 November 2018 (MN LATEX style file v2.2)
Exploring masses and CNO surface abundances of red
giant stars
Ghina M. Halabi1⋆, Mounib El Eid11Department of Physics, American University of Beirut, Bliss Street 11-0236, Beirut 1107 2020, Lebanon
Accepted: May 2015. Received ; in original form
ABSTRACT
A grid of evolutionary sequences of stars in the mass range 1.2-7M⊙, with solar-likeinitial composition is presented. We focus on this mass range in order to estimatethe masses and calculate the CNO surface abundances of a sample of observed redgiants. The stellar models are calculated from the zero-age main sequence till the earlyasymptotic giant branch (AGB) phase. Stars of M 6 2.2M⊙ are evolved through thecore helium flash. In this work, an approach is adopted that improves the mass de-termination of an observed sample of 21 RGB and early AGB stars. This approachis based on comparing the observationally derived effective temperatures and abso-lute magnitudes with the calculated values based on our evolutionary tracks in theHertzsprung-Russell diagram. A more reliable determination of the stellar masses isachieved by using evolutionary tracks extended to the range of observation. In ad-dition, the predicted CNO surface abundances are compared to the observationallyinferred values in order to show how far standard evolutionary calculation can beused to interpret available observations and to illustrate the role of convective mix-ing. We find that extra mixing beyond the convective boundary determined by theSchwarzschild criterion is needed to explain the observational oxygen isotopic ratiosin low mass stars. The effect of recent determinations of proton capture reactions andtheir uncertainties on the 16O/17O and 14N/15N ratios is also shown. It is found thatthe 14N(p, γ)15O reaction is important for predicting the 14N/15N ratio in red giants.
Key words: convection, nuclear reactions, nucleosynthesis, abundances - stars: evo-lution - stars: low-mass
1 INTRODUCTION
After the main sequence evolutionary phase, stars evolveto the red giant branch (RGB). This evolution is initiatedby the ignition of shell H-burning surrounding the He core,whose energy flux causes the envelope to expand and the starevolves to the RGB. The expansion increases the opacity andleads to the development of a deep convective envelope. Thisis the first dredge up event (FDUP), as convection mixes upthe products of H-burning to the surface altering the surfacecomposition of the star.
In the mass range (4-7)M⊙, stars exhibit blueloops at the beginning of core He burning (seeHalabi, El Eid & Champagne (2012), and referencestherein). The main phase of core He-burning is completedbefore the track evolves back to the RGB. This leadsagain to the deepening of envelope convection. For solarmetallicity stars of M &4M⊙, a second dredge up (SDUP)
⋆ E-mail: [email protected]
can reach deeper regions, which leads to further changes inthe surface abundances.
This work uses observations obtained for a sample ofred giants by Tsuji (2008), hereafter Tsuji08, in order toachieve two goals: (a) to estimate the masses of these giantsby matching their observationally derived effective tempera-tures and bolometric magnitudes to the values obtained fromthe evolutionary tracks in the HR diagram. This is possiblesince the stars are not pulsating Mira variables (see Section3.1 for details). We are able to improve the mass determina-tion done by Tsuji08 by using more extended evolutionarytracks to avoid the extrapolation that he partially relied onto determine the mass of some giants, (b) to compare the cal-culated CNO abundances of these models to those inferredfrom observations in the light of recent determinations ofkey reaction rates.
A large body of observational data is available for thesurface CNO abundances in RGB stars (Lambert & Reis1981; Harris & Lambert 1984a,b; Harris et al. 1988;Lambert et al. 1986; Gilroy & Brown 1991; Tsuji 1991;
c© 2015 RAS

2 G. M. Halabi & M. El Eid
Charbonnel 1994; Tsuji 2008; Tautvaisiene et al. 2010;Piau et al. 2011). These data provide a powerful tool toget insight into the internal structure of evolved stars.In particular, comparing the predicted oxygen surfaceabundances to the observed data is useful to improve thetreatment of convective mixing in the stellar interiors (seeSection 3.2.2). Our results suggest the need for extra mixingbelow the edge of the convective envelope as determinedby the Schwarzschild criterion in order to achieve a betteragreement with observations. This extra mixing has beensuggested in several investigations in connection with theevolution of field giants (Charbonnel & Do Nascimento1998; Gratton at al. 2000), open clusters (Luck 1994;Tautvaisiene et al. 2000, 2005), globular clusters (Shetrone2003; Pilachowski et al. 2003; Recio-Blanco & de Laverny2007; Denissenkov et al. 2015) as well as to explain isotopicratios in pre-solar grains (Palmerini et al. 2011, 2013;Busso et al. 2014). The abundance profile of 17O of par-ticular interest. This is because this isotope is producedby the ON-cycle which requires higher temperatures thanthe CN-cycle. Therefore, the 17O profile exhibits a steepgradient within the central region of the star, at the positionof maximum convective penetration (shown later in Fig.4). This renders the 17O surface abundance sensitive tothe depth of convective mixing, stellar mass and to thenuclear reaction rates involved in the CNO cycle (El Eid1994). We show in Section 3.2.2 how the 16O/17O ratiois useful to constrain this extra mixing. The low surfacecarbon isotopic ratios in low mass stars however, cannot be explained by our extra-mixing treatment. Othernon-standard mixing mechanisms may need to be invokedas shown in Section 3.2. Ramstedt & Olofsson (2014) alsodiscuss carbon isotopic ratios in AGB stars in connectionwith their recent estimations of circumstellar 12CO/13COabundance ratios based on radiative transfer analysis ofradio line emission observations.
Concerning the nuclear reaction network, there has beenextensive experimental work recently on updated determi-nations of major reaction rates, including those of the CNOcycle. One set of rates that we use (Sergi et al. 2014) wasobtained with the Trojan Horse method (La Cognata et al.2010), which is an indirect technique that is able to providemore reliable reaction rate cross-sections at low tempera-tures where measurements in the astrophysical energy rangeare available. Other sets, obtained by Sallaska et al. (2013)and Iliadis et al. (2010) are evaluated based on Monte Carlotechniques (Longland et al. 2010). This method provides amedian rate which -under certain conditions- resembles thecommonly referred to “recommended” rate, as well as a lowrate and a high rate which, unlike the “upper” and “lower”limits of classical rates, have a well-defined statistical mean-ing. The effect of these recent determinations of the protoncapture reactions including the 14N(p, γ)15O rate on the iso-topic ratios 16O/17O and 14N/15N is investigated.
This paper is organized as follows. Section 2 describesthe calculations and provides a summary of the observa-tional data used in this work. The results are presented inSection 3. Mass determinations and comparison with pre-vious works are provided in Section 3.1. In Section 3.2, wedescribe the surface abundance profiles and the effects of ex-tra mixing. The effect of nuclear reaction rates is discussedin Section 3.3. Concluding remarks are given in Section 4.
2 MODEL CALCULATIONS
The evolutionary sequences presented in this work are ob-tained using the stellar evolution code HYADES as de-scribed in El Eid et al. (2009), with the recent modificationsoutlined in Halabi, El Eid & Champagne (2012). This codeis a one-dimensional implicit Lagrangian code based on ahydrodynamical method which solves the stellar structureequations on an adaptive grid. Mass-loss is included usingsemi-empirical rates adjusted to the global parameters of thestar. The rates are used according to a Mira pulsation pe-riod (P ) (Vassiliadis & Wood 1992). For P<100 d, Reimers(1975) mass-loss rate is used, with η =1. For 100 6P<500 dwe use a more effective rate according to Bowen (1988). ForP > 500 d, the superwind mass-loss rate during the AGB isused as suggested by Vassiliadis & Wood (1992).
2.1 Analyzing the overshooting region
In the context of the Mixing Length Theory (MLT),the extension of a convective zone is determined by theSchwarzschild criterion, that is when ∇rad > ∇ad, where∇rad and ∇ad are the radiative and adiabatic temperaturegradients, respectively.
Within this framework, a long-standing issue is to fixthe boundary of the convective zone. In the local descriptionof the MLT, mixing beyond the Schwarzschild boundary isintroduced in a parameterized way. According the multi-dimensional hydrodynamic simulations by Freytag et al.(1996), a local description of an extra mixing (or overshoot-ing) may be introduced in terms of an exponentially decay-ing diffusion coefficient:
D(z) = Doe−2zfHp (1)
where z=∣
∣
∣rboundary − r
∣
∣
∣is the overshoot distance, Do
is the diffusion coefficient at the boundary of the convec-tive envelope obtained from the Mixing Length Theory (seeLanger et al. (1985)), Hp is the pressure scale height and fis a free parameter which is a measure of the efficiency of thisextra partial mixing. It is clear from Eq. 1 that for smallervalues of f, D has a steeper profile, or equivalently less ex-tra mixing. As f increases, this extra mixing extends furtherbeyond the formal convective boundary. The numerical sim-ulations by Freytag et al. (1996) find f =0.25 ± 0.05 and1.0 ± 0.1 for A-stars and DA white dwarfs, respectively. Wewill use the observationally inferred oxygen isotopic ratio inred giants to constrain the value of f (see Section 3.2).
The mixing of chemical elements is achieved by solvingthe diffusion equation given by:
dXi
dt=
∂
∂Mr
[(4πr2ρ)2D∂Xi
∂Mr
] (2)
where r is the radius, ρ is the mass density and D is thediffusion coefficient given by Eq. 1 when used in the over-shoot region, otherwise it is equal to Do in a convective zoneaccording to the Schwarzschild criterion.
To illustrate the effect of the treatment of mixing de-scribed above, Fig. 1 shows the behavior of ∇rad , ∇adas well as the profiles of the diffusion coefficient and hydro-gen (XH) as a function of interior mass. This is done for a1.2M⊙ model during the first dredge up phase (FDUP) afterthe star has evolved to the red giant branch.
c© 2015 RAS, MNRAS 451, 1–??

Exploring masses & abundances of red giants 3
Figure 1. Physical quantities related to the condition of convection at the bottom of the convective envelope in a 1.2M⊙ star duringFDUP, for (a) the standard stellar model and (b) the model with overshooting using f=0.125. (c) and (d) are the same as (a) and (b),respectively, but 3×10⁵ years later. ∇rad and ∇ad are the radiative and adiabatic temperature gradients, respectively. Also shown arethe hydrogen profile (left scale) and diffusion coefficient profile (right scale).
The left-hand panel of Fig. 1 shows the extension ofthe convective envelope in the standard models, i.e. withoutovershooting where the abrupt drop of the diffusion coeffi-cient D is visible along with the vertical drop of XH. Theright panel shows the behavior with overshooting. It is seenthat in the latter case, mixing is extended into the radia-tive region where ∇rad < ∇ad. The lower panels show theprofiles at the next time-step, 3×10⁵ years later. In bothcases, the convective envelope deepens in mass as FDUPproceeds, but it is deeper in the case with overshooting,where the change in composition alters the opacity so that∇rad > ∇ad becomes satisfied deeper in mass. Therefore,overshooting does not only induce extra mixing but alsodrives convective instability. Details of the present calcula-tions with this overshooting or extra diffusive mixing areprovided in Section 3.2.2.
2.2 Observational data
A sample of red giant stars has been observed by Tsuji08 asgiven in Table 1. The effective temperatures were obtainedusing the infrared flux method (Blackwell et al. 1980), whilethe absolute bolometric magnitudes were determined fromthe bolometric luminosities obtained by integrating the spec-tral energy distributions and the Hipparcos parallaxes. Theuncertainty on the effective temperature is estimated to be
100K, and the error on the bolometric magnitude is mainlydue to the error on the parallaxes. In the next section, theeffective temperatures and bolometric magnitudes are usedto determine the stellar masses of the observed giants us-ing our evolutionary tracks, which cover the whole range ofobservations.
3 EVOLUTIONARY RESULTS
Evolutionary sequences of stars in the mass range (1.2-7.3)M⊙ are calculated from the zero-age main sequence tillthe early AGB phase. Stars of M > 3M⊙ exhibit blue loopsstarting at the onset of central helium burning, which be-come more extended for stars of mass & 4M⊙. A detaileddiscussion on this evolutionary phase has been presentedin Halabi, El Eid & Champagne (2012). Stars of masses 6
2.2M⊙ and solar-like initial composition evolve through thecore He-flash (Kippenhahn & Weigert 1990; Mocak et al.2010; Bildsten et al. 2012). We find that for M < 2M⊙, thehelium flash starts off-center owing to the cooling via theplasma and photo neutrino energy losses. In the mass range2 6M/M⊙ 6 2.2 the helium flash starts at the center sincethese stars evolve at relatively lower central densities so thecooling by neutrino energy losses is less efficient.
The core helium flash requires very short time steps to
c© 2015 RAS, MNRAS 451, 1–??

4 G. M. Halabi & M. El Eid
Table 1. Spectral type, effective temperatures and bolometricmagnitudes (Tsuji08).
Object(BS/HD) Spectral type Teff (K) Mbol (mag)
δ Vir (4910) M3III 3643 −2.4± 0.3
α Tau (1457) K5+III 3874 −1.7± 0.2
RRUMi (5589) M4.5III 3397 −3.4± 0.3
RZ Ari (687) M6III 3341 −3.5± 0.6
δ Oph (6056) M0.5III 3790 −2.2± 0.3
ν Vir (4517) M1III 3812 −2.2± 0.4
τ4 Eri (1003) M3+IIIa 3712 −2.9± 0.4
10 Dra (5226) M3.5III 3730 −2.9± 0.3
β Peg (8775) M2.5II-III 3606 −3.3± 0.2
30g Her (6146) M6-III 3298 −4.2± 0.4
σ Lib (5603) M2.5III 3596 −3.4± 0.5
R Lyr (7157) M5III 3313 −4.3± 0.3
µ Gem (2286) M3III 3643 −3.3± 0.3
OP Her (6702) M5II 3325 −4.4± 0.8
ρ Per (921) M4II 3523 −4.1± 0.4
α Cet (911) M1.5IIIa 3909 −3.2± 0.3
λ Aqr (8698) M2.5III 3852 −3.4± 0.7
XY Lyr (7009) M5II 3300 −5.1± 1.1
δ2 Lyr (7139) M4II 3420 −5.5± 0.8
α Her (6406) M5Ib-II 3293 −5.8± 1.6
BS6861(6861) M4 3600 −5.2± 2.0
accommodate the rapidly changing variables. In our calcula-tion, the time step is of the order of less than a year duringthe core helium flash. For stars of masses in excess of 2.2M⊙,no significant degeneracy effects occur and core He-burningproceeds under hydrostatic conditions.
3.1 Mass evaluation
In the work by Tsuji08, the masses of the red giant starslisted in Table 1 are derived using the evolutionary tracks byClaret (2004). A main difference between our code and thatof Claret (2004) is that the latter used Caughlan & Fowler(1988) rates for the basic nuclear reactions in the network,while our used reaction rates are updated according tothe JINA REACLIB database (Cyburt et al. 2010). Thisis expected to introduce modifications on the evolutionarytracks. Another difference is that Claret assumes core over-shooting, with an overshooting distance of 0.2Hp for thewhole mass range and ignores envelope overshooting. Coreovershooting results in a bigger core mass and affects theevolutionary tracks and the stellar lifetimes. In the sam-ple considered here, most of the stars are low-mass starswhich have very small or no convective core at all, thus ap-plying the same amount of overshooting at the convective
core boundary would result in a large amount of mixingthat yields results which are inconsistent with observations(Woo & Demarque 2001). In order to avoid this artifact,core overshooting is not included in our calculation.
Moreover, the tracks by Claret (2004) are not extendedenough, so that extrapolations were needed at temperaturesbelow 3200K during the RGB phase for about half of thestars in the sample studied by Tsuji08. In this calculation,the stars are evolved until the early AGB phase withoutrelying on extrapolation. Moreover, mass-loss is included,and we report the masses of the evolved stars rather thantheir initial masses, which improves the mass determination,particularly for the higher masses where mass-loss becomesmore effective.
Adopting the values of Mbol and Teff given in Ta-ble 1, the evolutionary tracks shown in Fig. 2 are used toevaluate the stellar masses. It is important to note herethat a direct comparison of the theoretical temperatureto that inferred observationally wouldn’t have been possi-ble if the stars are pulsating Mira variables, in which casea radius cannot be strictly defined and any comparisonwouldn’t hold. Even the term effective temperature may be-come questionable for the very evolved AGB stars featuringstrong pulsations and mass loss rates (Baschek et al. 1991;Lebzelter et al. 2010). However, in this sample, the stars areon the RGB or early AGB phase, and thus, haven’t yet expe-rienced any thermal pulsations. This allows a reliable com-parison between the predicted effective temperatures andthe observationally inferred ones. The theoretical bolomet-ric magnitude is obtained using the well known relation:Mbol = 4.75 − 2.5 log(L/L⊙).
As seen in Fig. 3, our evolutionary tracks describe wellthe advanced evolutionary stage of these stars. Having ob-tained the mass of every star using these tracks, it is possibleto identify its evolutionary stage and compare its CNO sur-face abundances with the observational data. This will bedescribed in Section 3.2.
The stellar masses are given in Table 2. For complete-ness, masses obtained by other works for some stars are in-cluded (Maillard 1974; Smith & Lambert 1985; Harris et al.1988; Decin et al. 1997). The error on the mass is deter-mined from the error bars on the observational Mbol andTeff . Table 2 shows that our values are systematically lowerthan those by Tsuji08. We attribute this mainly to two rea-sons:
(a) The stars are evolved to the stage where they areobserved, that is, we do not use any extrapolated tracks asdone in Tsuji08.
(b) Mass-loss is taken into consideration, which becomessignificant for the more massive stars.
Moreover, it is clear from Table 2 that our errors on themasses are also lower. Calculating the tracks up to advancedstages helps to get better evaluation of the masses of redgiants.
3.2 CNO Surface Abundances in Red Giants
3.2.1 Predictions of surface abundances with standard
mixing
This section presents the results for the surface CNO abun-dances of the studied sample of stars. These are then com-
c© 2015 RAS, MNRAS 451, 1–??

Exploring masses & abundances of red giants 5
3.43.53.63.73.83.944.14.24.34.4
−8
−6
−4
−2
0
2
4
6
log Teff(K)
Mbol
Figure 2. Bolometric magnitude (Mbol) versus effective temperature (Teff ) showing the present evolutionary tracks of stars of masses(1.2-7)M⊙. Also shown is the observed sample listed in Table 1.
3.53.513.523.533.543.553.563.573.583.593.6
−6
−5.5
−5
−4.5
−4
−3.5
−3
−2.5
−2
−1.5
−1
log Teff(K)
Mbol
RZ Ari α Cet
ρ Per
τ4 Eri
α Tau
µ Gem
ν Vir δ Vir
10 Dra
RR UMi σ Lib
δ Oph
30g Her
α Her
OP Her
BS6861 XY Lyr
δ2 Lyr
R Lyr
λ Aqr β Peg
5.5M5.0M4.0M3.0M2.5M2.1M2.0M1.8M1.4M1.3M1.2M
Figure 3. The evolutionary tracks together with the observed red giants listed in Table 1. Note that the observed data points haveerrors as indicated in Table 1.
c© 2015 RAS, MNRAS 451, 1–??
6 G. M. Halabi & M. El Eid
Table 2. a: present work (MRGB is the mass on the RGB, in-cluding mass-loss), b: Tsuji08, c: Smith and Lambert (1985), d:Harris et al. (1988), e: Decin et al. (1997), f : El Eid (1994). Themasses are given in solar units. Note that the error on the massby Tsuji08 increases for more massive stars, which may be relatedto the inaccuracy in the parallax measurements.
Object(BS/HD) M ainitial
M aRGB M b M(others)
δ Vir (4910) 1.2± 0.2 1.19 ± 0.2 1.4± 0.3 2.0 c
α Tau (1457) 1.2± 0.2 1.20 ± 0.2 1.5± 0.3 1.5 c,d
RRUMi (5589) 1.3± 0.1 1.15 ± 0.1 1.6± 0.3
RZ Ari (687) 1.3± 0.2 1.14 ± 0.2 1.5± 0.4
δ Oph (6056) 1.4± 0.2 1.39 ± 0.2 1.6± 0.3
ν Vir (4517) 1.4± 0.4 1.39 ± 0.4 1.7± 0.4 2.0 c
τ4 Eri (1003) 1.8± 0.3 1.73 ± 0.3 2.0± 0.4
10 Dra (5226) 1.8± 0.3 1.74 ± 0.3 2.1± 1.8
β Peg (8775) 1.8± 0.3 1.70 ± 0.3 2.2± 0.3 1.7 c,d,e,f
30g Her (6146) 1.8± 0.3 1.65 ± 0.3 2.0± 0.6 4.0c
σ Lib (5603) 2.0± 0.2 1.90 ± 0.2 2.2± 0.5
R Lyr (7157) 2.0± 0.2 1.80 ± 0.2 2.1± 0.5
µ Gem (2286) 2.0± 0.5 1.90 ± 0.5 2.3± 0.5 2.0 d.f
OP Her (6702) 2.1± 0.4 1.90 ± 0.4 2.3± 1.0
ρ Per (921) 2.5± 0.4 2.40 ± 0.5 3.2± 0.5
α Cet (911) 3.0± 0.5 2.96 ± 0.5 3.6± 0.4
λ Aqr (8698) 3.0± 0.5 2.96 ± 0.5 3.7± 1.2
XY Lyr (7009) 4.0± 1.0 3.0± 1.0 3.7± 1.5
δ2 Lyr (7139) 5.0± 1.0 4.5± 1.0 5.5± 2.0
α Her (6406) 5.5± 1.5 4.0± 1.0 5.0± 2.0 7.0 f
BS 6861(6861) 5.5± 1.5 5.35 ± 1.5 6.3± 4.0
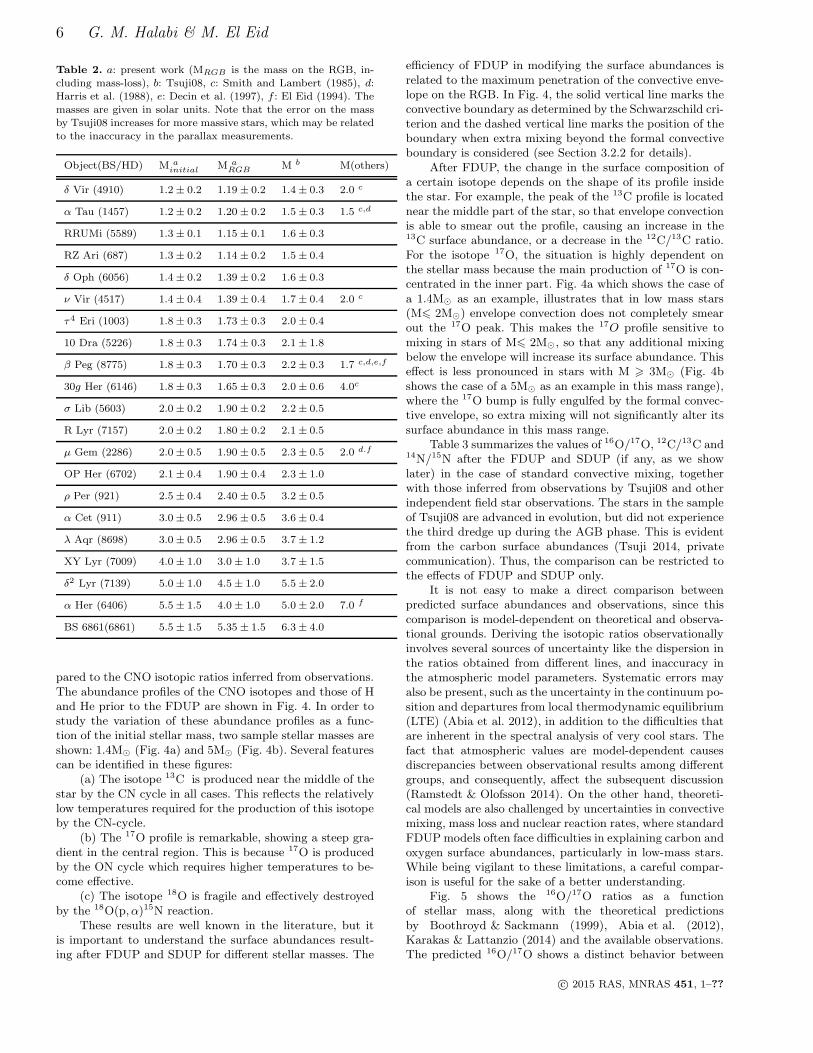
pared to the CNO isotopic ratios inferred from observations.The abundance profiles of the CNO isotopes and those of Hand He prior to the FDUP are shown in Fig. 4. In order tostudy the variation of these abundance profiles as a func-tion of the initial stellar mass, two sample stellar masses areshown: 1.4M⊙ (Fig. 4a) and 5M⊙ (Fig. 4b). Several featurescan be identified in these figures:
(a) The isotope 13C is produced near the middle of thestar by the CN cycle in all cases. This reflects the relativelylow temperatures required for the production of this isotopeby the CN-cycle.
(b) The 17O profile is remarkable, showing a steep gra-dient in the central region. This is because 17O is producedby the ON cycle which requires higher temperatures to be-come effective.
(c) The isotope 18O is fragile and effectively destroyedby the 18O(p, α)15N reaction.
These results are well known in the literature, but itis important to understand the surface abundances result-ing after FDUP and SDUP for different stellar masses. The
efficiency of FDUP in modifying the surface abundances isrelated to the maximum penetration of the convective enve-lope on the RGB. In Fig. 4, the solid vertical line marks theconvective boundary as determined by the Schwarzschild cri-terion and the dashed vertical line marks the position of theboundary when extra mixing beyond the formal convectiveboundary is considered (see Section 3.2.2 for details).
After FDUP, the change in the surface composition ofa certain isotope depends on the shape of its profile insidethe star. For example, the peak of the 13C profile is locatednear the middle part of the star, so that envelope convectionis able to smear out the profile, causing an increase in the13C surface abundance, or a decrease in the 12C/13C ratio.For the isotope 17O, the situation is highly dependent onthe stellar mass because the main production of 17O is con-centrated in the inner part. Fig. 4a which shows the case ofa 1.4M⊙ as an example, illustrates that in low mass stars(M6 2M⊙) envelope convection does not completely smearout the 17O peak. This makes the 17O profile sensitive tomixing in stars of M6 2M⊙, so that any additional mixingbelow the envelope will increase its surface abundance. Thiseffect is less pronounced in stars with M > 3M⊙ (Fig. 4bshows the case of a 5M⊙ as an example in this mass range),where the 17O bump is fully engulfed by the formal convec-tive envelope, so extra mixing will not significantly alter itssurface abundance in this mass range.
Table 3 summarizes the values of 16O/17O, 12C/13C and14N/15N after the FDUP and SDUP (if any, as we showlater) in the case of standard convective mixing, togetherwith those inferred from observations by Tsuji08 and otherindependent field star observations. The stars in the sampleof Tsuji08 are advanced in evolution, but did not experiencethe third dredge up during the AGB phase. This is evidentfrom the carbon surface abundances (Tsuji 2014, privatecommunication). Thus, the comparison can be restricted tothe effects of FDUP and SDUP only.
It is not easy to make a direct comparison betweenpredicted surface abundances and observations, since thiscomparison is model-dependent on theoretical and observa-tional grounds. Deriving the isotopic ratios observationallyinvolves several sources of uncertainty like the dispersion inthe ratios obtained from different lines, and inaccuracy inthe atmospheric model parameters. Systematic errors mayalso be present, such as the uncertainty in the continuum po-sition and departures from local thermodynamic equilibrium(LTE) (Abia et al. 2012), in addition to the difficulties thatare inherent in the spectral analysis of very cool stars. Thefact that atmospheric values are model-dependent causesdiscrepancies between observational results among differentgroups, and consequently, affect the subsequent discussion(Ramstedt & Olofsson 2014). On the other hand, theoreti-cal models are also challenged by uncertainties in convectivemixing, mass loss and nuclear reaction rates, where standardFDUPmodels often face difficulties in explaining carbon andoxygen surface abundances, particularly in low-mass stars.While being vigilant to these limitations, a careful compar-ison is useful for the sake of a better understanding.
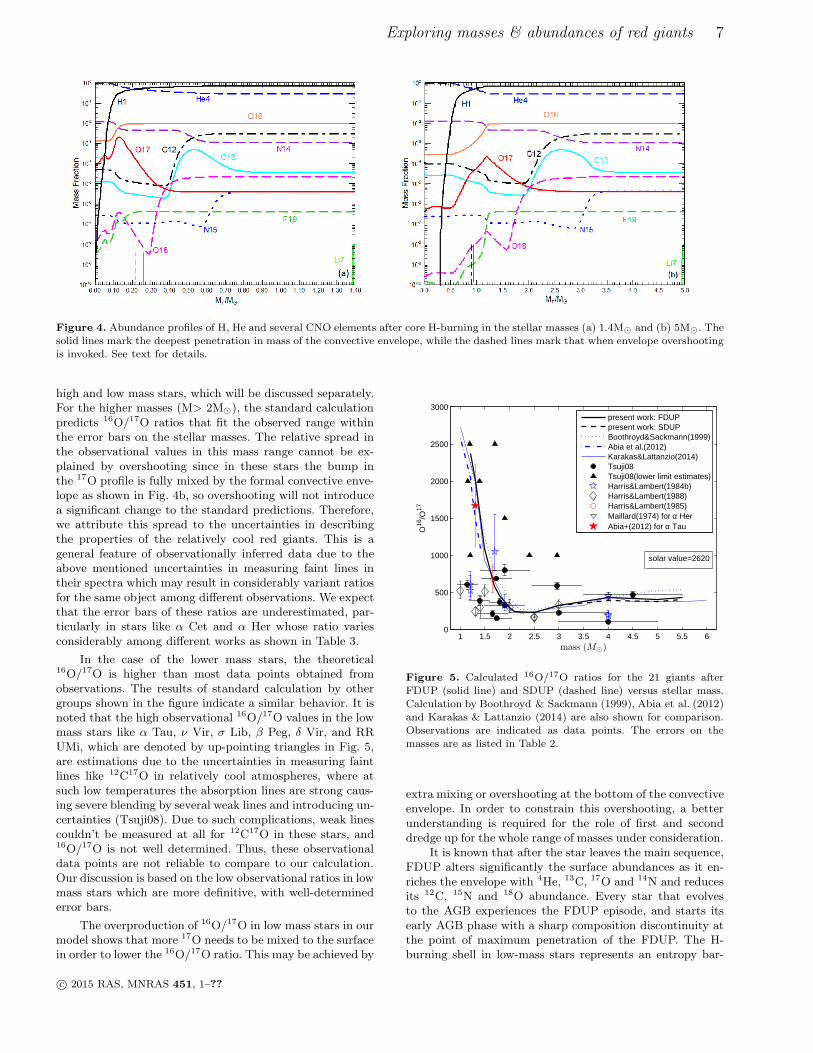
Fig. 5 shows the 16O/17O ratios as a functionof stellar mass, along with the theoretical predictionsby Boothroyd & Sackmann (1999), Abia et al. (2012),Karakas & Lattanzio (2014) and the available observations.The predicted 16O/17O shows a distinct behavior between
c© 2015 RAS, MNRAS 451, 1–??
Exploring masses & abundances of red giants 7
Figure 4. Abundance profiles of H, He and several CNO elements after core H-burning in the stellar masses (a) 1.4M⊙ and (b) 5M⊙. Thesolid lines mark the deepest penetration in mass of the convective envelope, while the dashed lines mark that when envelope overshootingis invoked. See text for details.
high and low mass stars, which will be discussed separately.For the higher masses (M> 2M⊙), the standard calculationpredicts 16O/17O ratios that fit the observed range withinthe error bars on the stellar masses. The relative spread inthe observational values in this mass range cannot be ex-plained by overshooting since in these stars the bump inthe 17O profile is fully mixed by the formal convective enve-lope as shown in Fig. 4b, so overshooting will not introducea significant change to the standard predictions. Therefore,we attribute this spread to the uncertainties in describingthe properties of the relatively cool red giants. This is ageneral feature of observationally inferred data due to theabove mentioned uncertainties in measuring faint lines intheir spectra which may result in considerably variant ratiosfor the same object among different observations. We expectthat the error bars of these ratios are underestimated, par-ticularly in stars like α Cet and α Her whose ratio variesconsiderably among different works as shown in Table 3.
In the case of the lower mass stars, the theoretical16O/17O is higher than most data points obtained fromobservations. The results of standard calculation by othergroups shown in the figure indicate a similar behavior. It isnoted that the high observational 16O/17O values in the lowmass stars like α Tau, ν Vir, σ Lib, β Peg, δ Vir, and RRUMi, which are denoted by up-pointing triangles in Fig. 5,are estimations due to the uncertainties in measuring faintlines like 12C17O in relatively cool atmospheres, where atsuch low temperatures the absorption lines are strong caus-ing severe blending by several weak lines and introducing un-certainties (Tsuji08). Due to such complications, weak linescouldn’t be measured at all for 12C17O in these stars, and16O/17O is not well determined. Thus, these observationaldata points are not reliable to compare to our calculation.Our discussion is based on the low observational ratios in lowmass stars which are more definitive, with well-determinederror bars.
The overproduction of 16O/17O in low mass stars in ourmodel shows that more 17O needs to be mixed to the surfacein order to lower the 16O/17O ratio. This may be achieved by
1 1.5 2 2.5 3 3.5 4 4.5 5 5.5 60
500
1000
1500
2000
2500
3000
mass (M⊙)
O16
/O17
present work: FDUPpresent work: SDUPBoothroyd&Sackmann(1999)Abia et al.(2012)Karakas&Lattanzio(2014)Tsuji08Tsuji08(lower limit estimates)Harris&Lambert(1984b)Harris&Lambert(1988)Harris&Lambert(1985)Maillard(1974) for α HerAbia+(2012) for α Tau
solar value=2620
Figure 5. Calculated 16O/17O ratios for the 21 giants afterFDUP (solid line) and SDUP (dashed line) versus stellar mass.Calculation by Boothroyd & Sackmann (1999), Abia et al. (2012)and Karakas & Lattanzio (2014) are also shown for comparison.Observations are indicated as data points. The errors on themasses are as listed in Table 2.
extra mixing or overshooting at the bottom of the convectiveenvelope. In order to constrain this overshooting, a betterunderstanding is required for the role of first and seconddredge up for the whole range of masses under consideration.
It is known that after the star leaves the main sequence,FDUP alters significantly the surface abundances as it en-riches the envelope with 4He, 13C, 17O and 14N and reducesits 12C, 15N and 18O abundance. Every star that evolvesto the AGB experiences the FDUP episode, and starts itsearly AGB phase with a sharp composition discontinuity atthe point of maximum penetration of the FDUP. The H-burning shell in low-mass stars represents an entropy bar-
c© 2015 RAS, MNRAS 451, 1–??

8 G. M. Halabi & M. El Eid
Table 3. MRGB (in solar units) and the surface number abundances after FDUP and SDUP (if any, listed in parenthesis): a: surfaceabundances with standard mixing (present work), b: Tsuji08, g: Harris and Lambert (1984b), h: H85: Harris et al. (1985), i: Smith andLambert (1990), j: Decin et al. (2003), k: Maillard (1974), l: Hinkle et al. (1976).
Object MRGB16O/17Oa 16O/17Ob 16O/17O 12C/13Ca 12C/13Cb 12C/13C 14N/15Na
δ Vir 1.19 2370 > 2500 32 12.3± 1.2 16± 4i 551
α Tau 1.2 2370 > 1000 600−150g+130
30 10.6± 1.0 10± 2i,j 551
525−125g+250 9± 1g
RRUMi 1.15 2006 > 2000 30 10.0± 0.8 598
RZ Ari 1.14 2006 607 ± 48 30 7.9± 0.8 598
δ Oph 1.39 1500 387 ± 68 29 11.1± 0.9 690
ν Vir 1.39 1500 > 2000 29 8.7± 1.3 12± 2i 690
τ4 Eri 1.73 461 687 ± 14 24 12.4± 0.3 963
10 Dra 1.74 461 151 ± 11 24 14.8± 1.6 12± 3i 963
β Peg 1.7 462 > 2500 1050−250g+500 24 7.7± 0.5 8± 2i 963
> 100g 5± 3j
30g Her 1.65 462 211 ± 42 675+175−175
h 24 12.5± 1.1 10± 2 i 963
σ Lib 1.9 301 > 1500 22 7.5± 0.3 1126
R Lyr 1.8 301 368 ± 44 22 6.4± 0.3 1126
µ Gem 1.9 301 798 ± 73 325−75 g+150
22 10.5± 1.2 13± 2i 1126
> 100g
OP Her 1.9 246 329 ± 31 22 11.3± 1.2 1103
ρ Per 2.4 234 > 1000 22 9.7± 1.0 15± 2i 1307
α Cet 2.96 318(317) 586 ± 47 21(21) 11.1± 0.8 10± 2j 1460(1501)
λ Aqr 2.96 318(317) > 1000 21(21) 7.9± 1.4 1460(1501)
XY Lyr 3.0 424(395) 223 ± 16 21(20) 15 ± 0.4 1528(1610)
δ2 Lyr 4.5 400(378) 465 ± 41 21(20) 16.2± 1.5 1503(1629)
α Her 4.0 424(402) 102 ± 8 180−50g+70 21(20) 11.1± 0.7 17± 4g,l 1538/1642
200−25g+25
≈ 450g
450−50k+50
BS 6861 5.35 424(402) > 1000 21(20) 48.5± 2.9 1538(1642)
Initial 2620 90 270
rier that prevents any deeper penetration of the convectiveenvelope, and thus no further change in the surface abun-dances takes place. However, for solar metallicity stars ofmasses above 3-4M⊙, the gravitational energy release dueto the contracting core and the increased energy flux fromthe burning He-shell lead to an expansion so that the H-shellis pushed outwards in mass to low temperatures causing atemporary extinction in the H-burning shell. This situation,coupled to the drop in the temperature of the expanding lay-ers and the increase in the opacity (Iben & Renzini 1983),causes convection to deepen in a second dredge up (SDUP)
event and mixes out the composition discontinuity left overby the FDUP. Therefore, SDUP introduces further changesin the surface abundances of stars of masses & 4M⊙.
Fig. 6 shows the maximum penetration of the convec-tive envelope at FDUP and SDUP as a function of the initialstellar mass. It is clear from the figure that for M< (4-5)M⊙,SDUP doesn’t penetrate deeper than the FDUP, and thus, itdoes not introduce significant change to the surface composi-tion. This is in agreement with Karakas & Lattanzio (2014),for their solar metallicity case. Their Fig. 7 exhibits similargeneral features and also indicates a deepest penetration of
c© 2015 RAS, MNRAS 451, 1–??

Exploring masses & abundances of red giants 9
1 2 3 4 5 6 7 8
0.16
0.18
0.2
0.22
0.24
0.26
0.28
M (M⊙)
(MD
UP
/Mto
t)
Figure 6. Fractional mass reached by the convective envelopeat FDUP (dashed line) and SDUP (solid line). SDUP is deeperthat FDUP only in models of stellar masses > 5M⊙. The masson the y-axis is given as the mass reached by the dredge up overthe total initial stellar mass, in solar units.
FDUP in ≈ 2.5M⊙ stars. For stars of M>6M⊙, the expan-sion is strong and convection extends deeper inwards. Sincelow mass stars do not experience SDUP, this implies thattheir observed surface abundances on the AGB phase areactually “inherited” from the RGB phase. Therefore, oneway to account for the discrepancy between calculated andobservationally inferred values of 16O/17O in these stars isto invoke extra mixing below the convective envelope on theRGB phase.
3.2.2 Predictions of surface abundances with extra mixing
Overshooting is applied as outlined in Section 2.1 and wefind that f = 0.125 provides the best estimation for its ef-ficiency in low mass stars. Fig. 7 shows the 16O/17O ratiosof our star sample in the standard case and with overshoot-ing. The low observational 16O/17O in low mass stars cannow be fitted quite well within the error bars on the stellarmasses. It is noted how overshooting has a minor effect instars of M > 3M⊙. This is expected due to the shape of the17O abundance profile in these stars as discussed earlier inconnection with the shape of the 17O profile in these stars.The calculated and observationally inferred values for thesestars are generally in a good agreement.
Fig. 8 shows the predicted carbon and nitrogen abun-dances in the standard case and with overshooting. Observa-tions are also shown for comparison. A well-known problemarises in explaining the surface carbon abundances in stars ofM6 2M⊙, where our extra mixing treatment cannot explainthe low carbon observed in these giants. Calculations us-ing standard mixing by Boothroyd & Sackmann (1999) andKarakas & Lattanzio (2014) show a similar problem. A dif-ferent non-standard mixing process seems to be required inlow-mass stars (< 2M⊙) which can reduce the abundanceof 12C by mixing it to the hotter regions of the H-burningshell, allowing for some nuclear processing. Such mixing pro-
1 1.5 2 2.5 3 3.5 4 4.5 5 5.5 60
500
1000
1500
2000
2500
mass (M⊙)
O16
/O17
standard casewith overshootingTsuji08Tsuji08(lower limit estimates)Harris&Lambert(1984b)Harris&Lambert(1988)Harris&Lambert(1985)Maillard(1974) for α Her
solar value=2620
Figure 7. The 16O/17O ratios obtained in the standard caseand in the case of envelope overshooting with f=0.125. Severalobservations are shown for comparison.
cess is linked to the long evolutionary time of the low-massstars while ascending the RGB. As discussed in some detailsin Karakas & Lattanzio (2014), the so-called “thermohalinemixing” or “salt-finger instability” seems to be one possibledescription of this extra mixing in low-mass red giant stars.This is still an unsettled problem in stellar modeling. Nitro-gen abundances, on the other hand, show a scatter in theobserved data. This will be discussed in connection with the14N/15N ratios in Section 3.3.2. In general, Fig. 8b showsthat the observations pose no serious contradiction with thevalues predicted by the stellar models which, on average,reasonably reproduce the observationally inferred data.
3.3 Effect of modified nuclear reaction rates
3.3.1 The 16O/17O ratio
In order to investigate the effect of the 17O productionand destruction reaction rates on the 16O/17O ratios,four different evaluations of the proton-capture reactions16O(p, γ)17F, 17O(p, γ)18F and 17O(p, α)14N are used. Inparticular, we use the compilations by Sergi et al. (2014)(SE14), Sallaska et al. (2013) (SA13), Iliadis et al. (2010)(IL10) and Chafa et al. (2007) (CH07). The 16O/17O ra-tios obtained are shown in Fig. 9 for both cases: standardmixing (Fig. 9a) and envelope overshooting with f = 0.125(Fig. 9b). The four sets of rates give very similar 16O/17Ovalues in the considered mass range. None provides a reason-able agreement between model predictions and observationsunless overshooting is included. This consistency shows thatthe existing discrepancy cannot be removed without invok-ing deeper mixing. Fig. 9b shows a better fit of the observeddata within the error bars in the low mass stars.
The effect of the reaction rates uncertainties is alsoworth exploring. Since the SA13 compilation is based ona Monte Carlo simulation and the rates have statisticallywell-defined uncertainties (Longland et al. 2010; Longland
c© 2015 RAS, MNRAS 451, 1–??

10 G. M. Halabi & M. El Eid
1 2 3 4 5 6 77.6
7.8
8
8.2
8.4
8.6
8.8
9
mass (M⊙)
logA
(C)
Standard caseWith overshootingTsuji08Smith&Lambert(1990)Decin+(2003)solar value
1 2 3 4 5 6 77.7
7.8
7.9
8
8.1
8.2
8.3
8.4
8.5
8.6
8.7
mass (M⊙)
logA
(N)
Standard caseWith overshootingTsuji08solar value
Figure 8. The predicted surface abundances of (a) carbon and (b) nitrogen with observations as shown. The initial solar values of carbonand nitrogen are 8.5601 and 8.0499, respectively and are indicated by a star symbol.
0.8 1 1.2 1.4 1.6 1.8 2 2.20
500
1000
1500
2000
2500
mass (M⊙)
O16
/O17
SE14SA12IL10CH07T08T08(low.lim.)H&L(1984b)H&L(1988)H&L(1985)
1 1.2 1.4 1.6 1.8 2 2.20
500
1000
1500
2000
2500
mass (M⊙)
O16
/O17
SE14SA12IL10CH07T08T08(low.lim.)H&L(1984b)H&L(1988)H&L(1985)
Figure 9. The 16O/17O ratios calculated for the 21 giants, with four different sets of compilations of relevant reaction rates (see textfor details). Left panel shows the case with standard mixing and the right panel is that with overshooting (f = 0.125). Observationaldata are also included.
2012; Iliadis et al. 2014), the 16O/17O ratios are calculatedusing the recommended, high and low rates, where the rateboundaries correspond to a 95% coverage probability. Therates uncertainty has a very minor effect on the tracks duringH-shell burning but none along the RGB, and hence it doesnot affect our mass determination. However, the 16O/17Oratios show a larger sensitivity to these uncertainties, asshown in Fig. 10. It is found that the observational data canbe better explained when the whole range of uncertainty onthe involved reaction rates is considered since the discrep-ancy between predictions and observations becomes less pro-nounced. On the other hand, the 12C/13C ratios are foundto be immune to the uncertainties on the considered rates.The difference in 12C/13C obtained with the high rates andlow rates does not exceed 3%.
3.3.2 The 14N/15N ratio
The surface 14N/15N ratio is worth considering in connec-tion with the latest evaluation of the 14N(p, γ)15O rate(Marta et al. 2011). This ratio is calculated for the massrange under consideration after FDUP and SDUP. It isfound that our values are higher by ∼ 20% relative to thoseby El Eid (1994) in stars of masses > 3M⊙. This is expectedand due to the NACRE 14N(p, γ)15O rate (Angulo et al.1999) used in that work, which is almost a factor of 2higher than the revised rate at stellar temperatures (seeHalabi, El Eid & Champagne (2012) for the expression ofthis rate and explicit discussion). However, our 14N/15N isabout 12% lower in the low-mass stars.
It is quite unfeasible to verify our findings since 14N/15Nratios are difficult to measure in RGB stars from CN linesbecause they are too weak even in very high resolution spec-tra. In fact, the 14N/15N ratio is difficult to measure di-
c© 2015 RAS, MNRAS 451, 1–??

Exploring masses & abundances of red giants 11
1 1.2 1.4 1.6 1.8 2 2.20
500
1000
1500
2000
2500
3000
mass (solar)
O16
/O17
Figure 10. The SA13 set of rates in the standard case. Shownare the results with the recommended set of rates (solid line), thehigh rates (dotted) and low rates (dashed). Observational dataare the same as in Fig. 9.
rectly for molecules containing carbon (Roueff et al. 2015).On the other hand, stars in the early AGB phase are O-rich and then their spectra would be dominated by oxidemolecules and not by C-bearing molecules. Oxide moleculeslike NO cannot be observed in the visual or near-IR regionin these stars (Carlos Abia, private communication). Ob-servations in radio-wavelengths can in principle detect someN-bearing molecules from which 14N/15N may be derived,but in this case one would probably be looking at the cir-cumstellar envelope of the star not the photosphere. Cir-cumstellar N ratios might be affected by the incoming UVradiation from the ISM triggering non-kinetic equilibriumchemistry and thus, might not represent the stellar photo-spheric ratios (Hedrosa et al. 2012). Theoretical predictionsof the 14N/15N ratios, particularly the changes induced bythe revision of the 14N(p, γ)15O reaction rate may benefitfrom future observations or one may resort to the chemicalanalysis of pre-solar grains originating from the envelopes oflate AGB stars.
4 CONCLUSIONS
A sample of observed RGB and early AGB stars was con-sidered and their masses were obtained using extended evo-lutionary tracks. This was done without the need of extrap-olating the evolutionary tracks at lower effective tempera-tures as it has been done in the work by Tsuji08. The presentevolutionary tracks include the effect of mass-loss, which be-comes important during the red giant phases, especially forthe higher stellar masses under consideration. This investi-gation includes an analysis of the physical conditions in theovershooting region and the effect of this overshooting onthe abundance yields. We find that overshooting is neededto reconcile observational oxygen abundances with modelpredictions particularly in low mass red giants. Although
Tsuji08 has interpreted the discrepancies between the pred-icated and observational abundances as an effect of extramixing, he did not provide models including this extra mix-ing to see how the discrepancies may be understood. Weshowed that extra mixing based on the mixing of chemicalelements by diffusion explains reasonably the observation-ally inferred oxygen isotopic ratios. It is important to realizethe challenges facing such observations and the uncertain-ties involved in the available data. In this regard, the spreadin the observational data in the low and high mass rangeswas discussed in connection with the inherent difficulties inanalyzing the spectra of these relatively cool stars and theuncertainties involved in measuring faint lines like 12C16O.Our overshooting treatment cannot, however, explain thelow surface carbon abundances in low mass stars. Anothermixing mechanism seems to be required during the long evo-lutionary time needed for the low-mass stars to ascend thered giant branch.
Furthermore, the present calculations were carried outusing recent determinations of proton-capture rates whichhave reliable statistical error bars. This allows us to drawconclusions on the uncertainties involving CNO surfaceabundances. In particular, the effect of recent evaluationsof the reaction rates on the production and destruction of17O was explored. The experimentally suggested uncertaintyof these rates provides a better fit of the 16O/17O observedin low mass stars yet does not exclude the need to invokeovershooting. Additional mixing beyond the convective en-velope as determined by the Schwarzschild criterion is foundto be necessary to better explain the observational 16O/17Osurface abundances, especially in low mass stars. Moreover,the effect of 14N(p, γ)15O rate on the 14N/15N ratios wasstudied in the considered mass range.
As a final remark, our approach in the present studywas to consider a sample of red giant stars to see how farstandard calculation predictions agree with observations. Acomprehensive comparison between stellar models and ob-servations based on the analysis of the effect of extra mixingwas presented and linked to the uncertainties in key nu-clear reaction rates affecting the CNO abundances in redgiants. Comparing theoretical predictions of stellar modelsto available observations is required in order to constrainparametrized approaches in determining the efficiency andextension of mixing at convective boundaries. Future multi-dimensional simulations of convection may introduce an im-proved local description of this mixing and provide insighttowards a better understanding of the physical processes in-volved.
This work was supported by the Lebanese NationalCouncil for Scientific Research (CNRS) under grant awardnumber 11179-102899. The authors wish to thank ChristianIlliadis and Richard Longman for providing the nuclear re-action rates and for their valuable input and discussions onthe manuscript. The authors also acknowledge the anony-mous referee for the constructive comments and suggestionsthat helped improve the quality of this work.
REFERENCES
Abia, C., Palmerini, S., Busso, M., & Cristallo, S. 2012,A&A, 548, A55
c© 2015 RAS, MNRAS 451, 1–??

12 G. M. Halabi & M. El Eid
Angulo, C., Arnould, M., Rayet, M., et al. 1999, Nucl. Phys.A, 656, 3A
Baschek, B., Scholz, M., & Wehrse, R. 1991, A&A, 246,374
Bildsten, L., Paxton, B., Moore, K., Macias, P. J. 2012,ApJ, 744L, 6B
Blackwell, D. E., Petford, A. D., & Shallis, M. J. 1980,A&A, 82, 249
Boothroyd, A. I. & Sackmann, I.-J. 1999, ApJ, 510, 232Bowen, G. H., 1988, ASSL, 148, 3BBusso, M., Trippella, O., Maiorca, E., Palmerini, S. 2014,AIPC, 1595, 41B
Caughlan, G. R., & Fowler, W. A. 1988, Atomic Data andNucl. Data Tables, 40, 283
Chafa, A. et al., 2007, PRC 75, 035810Charbonnel, C. 1994, A&A 282, 811Charbonnel, C., & Do Nascimento, J. D. 1998, A&A, 336,915
Claret, A. 2004, A&A, 424, 919Cyburt et al. 2010, ApJS 189, 240Decin, L., Cohen, M., Eriksson, K., Gustafsson, B., Huy-gen, E., Morris, P., Plez, B., Sauval, J., Vandenbussche,B., Waelkens, C. 1997, ESASP, 419, 185D
Decin, L., Vandenbussche, B., Waelkens, C., et al. 2003,A&A, 400, 709
Denissenkov, P., VandenBerg, D., Hartwick, D., Herwig,F., Weiss, A., Paxton, B. 2015, MNRAS, 448, 3314
El Eid, M. F. 1994, A&A, 285, 915El Eid, M. F., The, L.-S., & Meyer, B. 2009, Space Sci.Rev., 147, 1
Freytag, R., Ludwig, H., & Steffen, M. 1996, A&A, 313,497
Gilroy, K. K. & Brown, J. A. 1991, ApJ 371, 578Gratton, R. G., Sneden, C., Carretta, E., & Bragaglia, A.2000, A&A, 354, 169
Halabi, G. M., El Eid, M., Champagne, A., 2012, ApJ, 761,10
Harris, M. J., Lambert, D. L. & Smith, V.V. 1988, ApJ,325, 768
Harris, M. J. & Lambert, D. L., 1984a, Ap,J 281, 739Harris, M. J. & Lambert, D. L., 1984b, Ap,J 285, 674Harris, M. J., Lambert, D. L. & Smith, V. V. 1985, ApJ,299, 375
Hedrosa, R. P., Abia, C., Plez, B., & Domınguez, I. 2012,PoS(NIC XII)006
Iben, I., Jr., Renzini, A., 1983, Ann. rev. Astron. Astro-phys. 21, 271
Iliadis, C., Longland, R., Champagne, A., Coc, A. 2010,Nucl.Phys. A841, 251-322
Iliadis, C., Longland, R., Coc, A.,Timmes, F., X., Cham-pagne, A. 2014, J. Phys. G: Nucl. Part. Phys., 42, 034007
Karakas, A. & Lattanzio J. 2014, arXiv:1405.0062Kippenhahn, R., & Weigert, A. 1990, Stellar Structure andEvolution (Berlin: Springer-Verlag)
La Cognata, M. et al. 2010, APJ, 708, 796Lambert, D. L., Gustafsson, B., Eriksson, K., Hinkle, K.H. 1986, ApJ Suppl. 62, 373
Lambert, D. L. & Ries L. M. 1981, ApJ 248, 228Langer, N., El Eid, M. F., & Fricke, K. J. 1985, A&A, 145,179
Lebzelter, T., Nowotny, W., Hofner, S., Lederer, M. T.,Hinkle, K. H., & Aringer, B. 2010, A&A 517, A6
Longland, R., Iliadis, C., Champagne, A., Newton, J.,Ugalde, C., Cocc, A., Fitzgerald, R. 2010, Nucl. Phys.A, 841, 1
Logland, R. 2012, A&A, 548A, 30LLuck, R. E. 1994, ApJS, 91, 309Maillard, J. P. 1974, Highlights Astron., 3, 269Marta et al. 2011, Phys. Rev. C, 83, 045804Mocak, M., Campbell, S. W., Muller, E., Kifonidis, K.2010, A&A, 520, 114
Palmerini, S., La Cognata, M., Cristallo, S., & Busso, M.2011, ApJ, 729, 3
Palmerini, S., Sergi, M. L., La Cognata, M., Lamia, L.,Pizzone, R. G., Spitaleri, C. 2013, ApJ, 764, 128P
Piau, L., Kervella, P., Dib, S. & Hauschildt P. 2011, A&A526, A100
Pilachowski, C., Sneden, C., Freeland, E., & Casperson, J.2003, AJ, 125, 794
Ramstedt, S. & Olofsson, H. 2014, A&A, 566A, 145RRecio-Blanco, A., & de Laverny, P. 2007, A&A, 461, L13Reimers, D. 1975, Mem. Soc. R. Sci Liege, 8, 369Roueff, E., Loison, J. C. & Hickson, K. M. 2015, A&A 576,A99
Sallaska, A. L., Iliadis, C., Champange, A. E., Goriely, S.,Starrfield, S., Timmes, F. X. 2013, ApJS 207, 18
Sergi, L. et al. 2014, AIPC, 1594, 201SShetrone, M. D. 2003, ApJ, 585, L45Smith, V. V. & Lambert D. L., 1985, ApJ, 294, 326Smith, V. V., & Lambert, D. L. 1990, ApJS, 72, 387Tautvaisiene, G., Edvardsson, B., Tuominen, I., & Ilyin, I.2000, A&A, 360, 499
Tautvaisiene, G., Edvardsson, B., Puzeras, E., & Ilyin, I.2005, A&A, 431, 933
Tautvaisiene, G., Edvardsson, B., Puzeras, E., Barisevicius,G. & Ilyin, I. 2010, Mon. Not. R. Astron. Soc. 409, 1213
Tsuji, T. 1991, A&A, 245, 203Tsuji, T. 2008, A&A 489, 1271Vassiliadis, E., & Wood, P. R., 1992, Proc. ASA, 10, 1Woo, J. H. & Demarque, P. 2001, AJ, 122, 1602W
c© 2015 RAS, MNRAS 451, 1–??