Exploring Two-Variable Data
18
AP STATISTICS UNIT Exploring Two-Variable Data 2 5–7 % AP EXAM WEIGHTING ~10–11 CLASS PERIODS © 2019 College Board Course Framework V.1 | 51 AP Statistics Course and Exam Description
Transcript of Exploring Two-Variable Data

AP STATISTICS
UNIT
Exploring Two-Variable Data
2
5–7%
AP EXAM WEIGHTING
~10–11CLASS PERIODS
© 2019 College BoardCourse Framework V.1 | 51AP Statistics Course and Exam Description

Remember to go to AP Classroom to assign students the online Personal Progress Check for this unit.
Whether assigned as homework or completed in class, the Personal Progress Check provides each student with immediate feedback related to this unit’s topics and skills.
Personal Progress Check 2Multiple-choice: ~35 questions Free-response: 2 questions
§ Exploring Data § Investigative Task
© 2019 College BoardCourse Framework V.1 | 52AP Statistics Course and Exam Description

5–7% AP EXAM WEIGHTING
Building Course Skills2.C 2.D 4.B
In Unit 2, students are looking at the relationship between variables. The ability to calculate and describe statistical values, such as a conditional relative frequency or the slope of a regression line, is critical for data analysis because students must be able to analyze patterns before drawing conclusions about the data. Students should be allowed to perform their calculations using technology to help them become more aware of procedural errors. Students will also need practice translating output from technology (“calculator speak”) into appropriate statistical language.
As any statistician will assert, a numerical calculation is only as good as one’s ability to interpret what it means in the real world. Rather than just reporting values from their calculations, students must be able to connect their numerical results to the scenario’s context and formulate a verbal response that makes that connection clear. Teachers can model good communication and provide high-quality feedback to help students use accurate statistical language
when comparing side-by-side bar graphs, for example, and to avoid common errors in reasoning, such as using the word “line” to explain why a relationship is linear.
Preparing for the AP ExamStudents need ongoing practice with interpretation of vocabulary and calculated values in context. It is typically not sufficient to speak generally about the direction of a relationship, for example. If the question is about a linear model for predicting the weight of a wolf based on its length, students should write that a positive relationship means that longer wolves tend to have higher weights (see 2017 FRQ 1). Students can communicate statistical uncertainty by using words such as “tend to have” and “on average,” being careful to be precise with language. For example, when explaining evidence of a linear relationship, the difference between discussing a rate of change, as opposed to a change, is the difference between right and wrong. For the sake of clarity, the word “correlation” should be reserved for discussions about relationships between two quantitative variables.
BIG IDEA 1Variation and Distribution VAR
§ Does the fact that the number of shark attacks increases with ice cream sales necessarily mean that ice cream sales cause shark attacks?
BIG IDEA 2Patterns and Uncertainty UNC
§ How might you represent incomes of individuals with and without a college degree to help describe similarities and/or differences between the two groups?
BIG IDEA 3Data-Based Predictions, Decisions, and Conclusions DAT
§ How can you determine the effectiveness of a linear model that uses the number of cricket chirps per minute to predict temperature?
UNIT
2
Developing UnderstandingBuilding on Unit 1, students will explore relationships in two-variable categorical or quantitative data sets. They will use graphical and numerical methods to investigate an association between two categorical variables. Skills learned while working with two-way tables will transfer to calculating probabilities in Unit 4.
Students will describe form, direction, strength, and unusual features for an association between two quantitative variables. They will assess correlation and, if appropriate, use a linear model to predict values of the response variable from values of the explanatory variable. Students will interpret the least-squares regression line in context, analyze prediction errors (residuals), and explore departures from a linear pattern.
~10–11 CLASS PERIODS
Exploring Two-Variable Data
© 2019 College BoardCourse Framework V.1 | 53AP Statistics Course and Exam Description

Exploring Two-Variable DataUNIT
2
UNIT AT A GLANCE
Endu
ring
Unde
rsta
ndin
g
Topic Skills
Class Periods
~10–11 CLASS PERIODS
VA
R-1 2.1 Introducing Statistics:
Are Variables Related?1.A Identify the question to be answered or problem to be solved (not assessed).
UN
C-1
2.2 Representing Two Categorical Variables
2.D Compare distributions or relative positions of points within a distribution.
2.3 Statistics for Two Categorical Variables
2.C Calculate summary statistics, relative positions of points within a distribution, correlation, and predicted response.
2.D Compare distributions or relative positions of points within a distribution.
UN
C-1
, D
AT-
1 2.4 Representing the Relationship Between Two Quantitative Variables
2.B Construct numerical or graphical representations of distributions.
2.A Describe data presented numerically or graphically.
DA
T-1
2.5 Correlation 2.C Calculate summary statistics, relative positions of points within a distribution, correlation, and predicted response.
4.B Interpret statistical calculations and findings to assign meaning or assess a claim.
2.6 Linear Regression Models 2.C Calculate summary statistics, relative positions of points within a distribution, correlation, and predicted response.
2.7 Residuals 2.B Construct numerical or graphical representations of distributions.
2.A Describe data presented numerically or graphically.
2.8 Least Squares Regression 2.C Calculate summary statistics, relative positions of points within a distribution, correlation, and predicted response.
4.B Interpret statistical calculations and findings to assign meaning or assess a claim.
2.9 Analyzing Departures from Linearity
2.A Describe data presented numerically or graphically.
2.C Calculate summary statistics, relative positions of points within a distribution, correlation, and predicted response.
Go to AP Classroom to assign the Personal Progress Check for Unit 2. Review the results in class to identify and address any student misunderstandings.
© 2019 College BoardCourse Framework V.1 | 54AP Statistics Course and Exam Description

Exploring Two-Variable DataUNIT
2
SAMPLE INSTRUCTIONAL ACTIVITIESThe sample activities on this page are optional and are offered to provide possible ways to incorporate various instructional approaches into the classroom. They were developed in partnership with teachers from the AP community to share ways that they approach teaching some of the topics in this unit. Please refer to the Instructional Approaches section beginning on p. 207 for more examples of activities and strategies.
Activity Topic Sample Activity
1 2.52.8
QuickwriteGive students a scatterplot and its associated computer output. Have them identify and describe the meaning of the following values in the context of the problem: slope, y-intercept, coefficient of determination, and standard error of the residuals. Also have them calculate the correlation and explain how they found it. Have students compare their write-ups in groups of three to four.
2 2.7 Reversing InterpretationsInstead of asking students to interpret a residual, give them the residual and the equation of the least-squares regression line and ask them to make a prediction for a particular observation (e.g., “One wolf in the pack had a length of 1.4 m and a residual of −9.87. What does that −9.87 tell us about that particular wolf?”)
3 2.8 Build the Model SolutionProvide students with strips of paper containing portions of the model solution for 2018 FRQ 1 and have them work to assemble the phrases into a solution for the FRQ. Words can be grouped for part a, as follows: [The estimate of the intercept is] [72.95]. [It is] [estimated that] [the average time to] [finish checkout] [if there are no other customers in line] [is 72.95 seconds]. Additional numbers or phrases for part a could include [174.40], [is 174.50 seconds], and [the time to].
4 2.9 Predict and ConfirmHave students toss a handful of M&Ms and record how many land M side up. This is trial 1. Then have them remove the ones that were M side up. For trial 2, have students toss the remaining candies (the ones left over after removing the ones that landed M side up) and record how many land M side up on the second toss. Ask students to think about the trend and make a prediction: Will it be linear? A scatterplot of many trials should show a nonlinear relationship.
© 2019 College BoardCourse Framework V.1 | 55AP Statistics Course and Exam Description

Exploring Two-Variable DataUNIT
2
Required Course Content Required Course Content
TOPIC 2.1
Introducing Statistics: Are Variables Related?
SKILL
Selecting Statistical Methods
1.A
Identify the question to be answered or problem to be solved.
ENDURING UNDERSTANDINGVAR-1
Given that variation may be random or not, conclusions are uncertain.
LEARNING OBJECTIVEVAR-1.D
Identify questions to be answered about possible relationships in data. [Skill 1.A]
ESSENTIAL KNOWLEDGEVAR-1.D.1
Apparent patterns and associations in data may be random or not.
© 2019 College BoardCourse Framework V.1 | 56AP Statistics Course and Exam Description

Exploring Two-Variable DataUNIT
2
Required Course Content
TOPIC 2.2
Representing Two Categorical Variables
SKILL
Data Analysis
2.D
Compare distributions or relative positions of points within a distribution.
ENDURING UNDERSTANDINGUNC-1
Graphical representations and statistics allow us to identify and represent key features of data.
LEARNING OBJECTIVEUNC-1.P
Compare numerical and graphical representations for two categorical variables. [Skill 2.D]
ESSENTIAL KNOWLEDGEUNC-1.P.1
Side-by-side bar graphs, segmented bar graphs, and mosaic plots are examples of bar graphs for one categorical variable, broken down by categories of another categorical variable.UNC-1.P.2
Graphical representations of two categorical variables can be used to compare distributions and/or determine if variables are associated.UNC-1.P.3
A two-way table, also called a contingency table, is used to summarize two categorical variables. The entries in the cells can be frequency counts or relative frequencies.UNC-1.P.4
A joint relative frequency is a cell frequency divided by the total for the entire table.
© 2019 College BoardCourse Framework V.1 | 57AP Statistics Course and Exam Description
Exploring Two-Variable DataUNIT
2
Required Course Content
TOPIC 2.3
Statistics for Two Categorical Variables
SKILLS
Data Analysis
2.C
Calculate summary statistics, relative positions of points within a distribution, correlation, and predicted response.2.D
Compare distributions or relative positions of points within a distribution.
UNC-1.R.1
Summary statistics for two categorical variables can be used to compare distributions and/or determine if variables are associated.
ENDURING UNDERSTANDINGUNC-1
Graphical representations and statistics allow us to identify and represent key features of data.
LEARNING OBJECTIVEUNC-1.Q
Calculate statistics for two categorical variables. [Skill 2.C]
ESSENTIAL KNOWLEDGEUNC-1.Q.1
The marginal relative frequencies are the row and column totals in a two-way table divided by the total for the entire table.UNC-1.Q.2
A conditional relative frequency is a relative frequency for a specific part of the contingency table (e.g., cell frequencies in a row divided by the total for that row).
UNC-1.R
Compare statistics for two categorical variables. [Skill 2.D]
© 2019 College BoardCourse Framework V.1 | 58AP Statistics Course and Exam Description
Exploring Two-Variable DataUNIT
2SKILLS
Data Analysis
2.B
Construct numerical or graphical representations of distributions.2.A
Describe data presented numerically or graphically.
Required Course Content
TOPIC 2.4
Representing the Relationship Between Two Quantitative Variables
ENDURING UNDERSTANDINGUNC-1
Graphical representations and statistics allow us to identify and represent key features of data.
LEARNING OBJECTIVEUNC-1.S
Represent bivariate quantitative data using scatterplots. [Skill 2.B]
ESSENTIAL KNOWLEDGEUNC-1.S.1
A bivariate quantitative data set consists of observations of two different quantitative variables made on individuals in a sample or population.UNC-1.S.2
A scatterplot shows two numeric values for each observation, one corresponding to the value on the x-axis and one corresponding to the value on the y-axis.UNC-1.S.3
An explanatory variable is a variable whose values are used to explain or predict corresponding values for the response variable.
continued on next page
© 2019 College BoardCourse Framework V.1 | 59AP Statistics Course and Exam Description

Exploring Two-Variable DataUNIT
2
LEARNING OBJECTIVEDAT-1.A
Describe the characteristics of a scatter plot. [Skill 2.A]
ESSENTIAL KNOWLEDGEDAT-1.A.1
A description of a scatter plot includes form, direction, strength, and unusual features.DAT-1.A.2
The direction of the association shown in a scatterplot, if any, can be described as positive or negative.DAT-1.A.3
A positive association means that as values of one variable increase, the values of the other variable tend to increase. A negative association means that as values of one variable increase, values of the other variable tend to decrease.DAT-1.A.4
The form of the association shown in a scatterplot, if any, can be described as linear or non-linear to varying degrees.DAT-1.A.5
The strength of the association is how closely the individual points follow a specific pattern, e.g., linear, and can be shown in a scatterplot. Strength can be described as strong, moderate, or weak.DAT-1.A.6
Unusual features of a scatter plot include clusters of points or points with relatively large discrepancies between the value of the response variable and a predicted value for the response variable.
ENDURING UNDERSTANDINGDAT-1
Regression models may allow us to predict responses to changes in an explanatory variable.
© 2019 College BoardCourse Framework V.1 | 60AP Statistics Course and Exam Description

Exploring Two-Variable DataUNIT
2
Required Course Content
SKILLS
Data Analysis
2.C
Calculate summary statistics, relative positions of points within a distribution, correlation, and predicted response.
Statistical Argumentation
4.B
Interpret statistical calculations and findings to assign meaning or assess a claim.
TOPIC 2.5
Correlation
continued on next page
ESSENTIAL KNOWLEDGEDAT-1.B.1
The correlation, r, gives the direction and quantifies the strength of the linear association between two quantitative variables.DAT-1.B.2
The correlation coefficient can be calculated by:
11
i i
x y
x x y yrn s s
− −= −
. However,
the most common way to determine r is by using technology.DAT-1.B.3
A correlation coefficient close to 1 or −1 does not necessarily mean that a linear model is appropriate.
LEARNING OBJECTIVEDAT-1.B
Determine the correlation for a linear relationship. [Skill 2.C]
ENDURING UNDERSTANDINGDAT-1
Regression models may allow us to predict responses to changes in an explanatory variable.
© 2019 College BoardCourse Framework V.1 | 61AP Statistics Course and Exam Description

Exploring Two-Variable DataUNIT
2
ESSENTIAL KNOWLEDGEDAT-1.C.1
The correlation, r, is unit-free, and always between −1 and 1, inclusive. A value of 0r indicates that there is no linear association. A value of 1r or 1r indicates that there is a perfect linear association.DAT-1.C.2
A perceived or real relationship between two variables does not mean that changes in one variable cause changes in the other. That is, correlation does not necessarily imply causation.
LEARNING OBJECTIVEDAT-1.C
Interpret the correlation for a linear relationship. [Skill 4.B]
© 2019 College BoardCourse Framework V.1 | 62AP Statistics Course and Exam Description
Exploring Two-Variable DataUNIT
2
Required Course Content
SKILL
Data Analysis
2.C
Calculate summary statistics, relative positions of points within a distribution, correlation, and predicted response.
TOPIC 2.6
Linear Regression Models
ENDURING UNDERSTANDINGDAT-1
Regression models may allow us to predict responses to changes in an explanatory variable.
LEARNING OBJECTIVEDAT-1.D
Calculate a predicted response value using a linear regression model. [Skill 2.C]
ESSENTIAL KNOWLEDGEDAT-1.D.1
A simple linear regression model is an equation that uses an explanatory variable, x, to predict the response variable, y.DAT-1.D.2
The predicted response value, denoted by y , is calculated as y a bx= + , where a is the y-intercept and b is the slope of the regression line, and x is the value of the explanatory variable.DAT-1.D.3
Extrapolation is predicting a response value using a value for the explanatory variable that is beyond the interval of x-values used to determine the regression line. The predicted value is less reliable as an estimate the further we extrapolate.
© 2019 College BoardCourse Framework V.1 | 63AP Statistics Course and Exam Description

Exploring Two-Variable DataUNIT
2
Required Course Content
SKILLS
Data Analysis
2.B
Construct numerical or graphical representations of distributions. 2.A
Describe data presented numerically or graphically.
TOPIC 2.7
Residuals
ENDURING UNDERSTANDINGDAT-1
Regression models may allow us to predict responses to changes in an explanatory variable.
LEARNING OBJECTIVEDAT-1.E
Represent differences between measured and predicted responses using residual plots. [Skill 2.B]
DAT-1.F
Describe the form of association of bivariate data using residual plots. [Skill 2.A]
ESSENTIAL KNOWLEDGEDAT-1.E.1
The residual is the difference between the actual value and the predicted value: residual = ˆy y− .DAT-1.E.2
A residual plot is a plot of residuals versus explanatory variable values or predicted response values.
DAT-1.F.1
Apparent randomness in a residual plot for a linear model is evidence of a linear form to the association between the variables.DAT-1.F.2
Residual plots can be used to investigate the appropriateness of a selected model.
© 2019 College BoardCourse Framework V.1 | 64AP Statistics Course and Exam Description

Exploring Two-Variable DataUNIT
2
Required Course Content
SKILLS
Data Analysis
2.C
Calculate summary statistics, relative positions of points within a distribution, correlation, and predicted response.
Statistical Argumentation
4.B
Interpret statistical calculations and findings to assign meaning or assess a claim.
TOPIC 2.8
Least Squares Regression
ENDURING UNDERSTANDINGDAT-1
Regression models may allow us to predict responses to changes in an explanatory variable.
LEARNING OBJECTIVEDAT-1.G
Estimate parameters for the least-squares regression line model. [Skill 2.C]
ESSENTIAL KNOWLEDGEDAT-1.G.1
The least-squares regression model minimizes the sum of the squares of the residuals and contains the point ( , )x y .DAT-1.G.2
The slope, b, of the regression line can
be calculated as y
x
sb r
s
=
where r is the
correlation between x and y, sy is the sample standard deviation of the response variable, y, and sx is the sample standard deviation of the explanatory variable, x.DAT-1.G.3
Sometimes, the y-intercept of the line does not have a logical interpretation in context.DAT-1.G.4
In simple linear regression, 2r is the square of the correlation, r. It is also called the coefficient of determination. 2r is the proportion of variation in the response variable that is explained by the explanatory variable in the model.
continued on next page
© 2019 College BoardCourse Framework V.1 | 65AP Statistics Course and Exam Description

Exploring Two-Variable DataUNIT
2
LEARNING OBJECTIVEDAT-1.H
Interpret coefficients for the least-squares regression line model. [Skill 4.B]
ESSENTIAL KNOWLEDGEDAT-1.H.1
The coefficients of the least-squares regression model are the estimated slope and y-intercept.DAT-1.H.2
The slope is the amount that the predicted y-value changes for every unit increase in x.DAT-1.H.3
The y-intercept value is the predicted value of the response variable when the explanatory variable is equal to 0 . The formula for the y-intercept, a, is a y bx= − .
© 2019 College BoardCourse Framework V.1 | 66AP Statistics Course and Exam Description
Exploring Two-Variable DataUNIT
2
Required Course Content
SKILLS
Data Analysis
2.A
Describe data presented numerically or graphically. 2.C
Calculate summary statistics, relative positions of points within a distribution, correlation, and predicted response.
TOPIC 2.9
Analyzing Departures from Linearity
continued on next page
ENDURING UNDERSTANDINGDAT-1
Regression models may allow us to predict responses to changes in an explanatory variable.
LEARNING OBJECTIVEDAT-1.I
Identify influential points in regression. [Skill 2.A]
ESSENTIAL KNOWLEDGEDAT-1.I.1
An outlier in regression is a point that does not follow the general trend shown in the rest of the data and has a large residual when the Least Squares Regression Line (LSRL) is calculated.DAT-1.I.2
A high-leverage point in regression has a substantially larger or smaller x-value than the other observations have.DAT-1.I.3
An influential point in regression is any point that, if removed, changes the relationship substantially. Examples include much different slope, y-intercept, and/or correlation. Outliers and high leverage points are often influential.
© 2019 College BoardCourse Framework V.1 | 67AP Statistics Course and Exam Description
Exploring Two-Variable DataUNIT
2
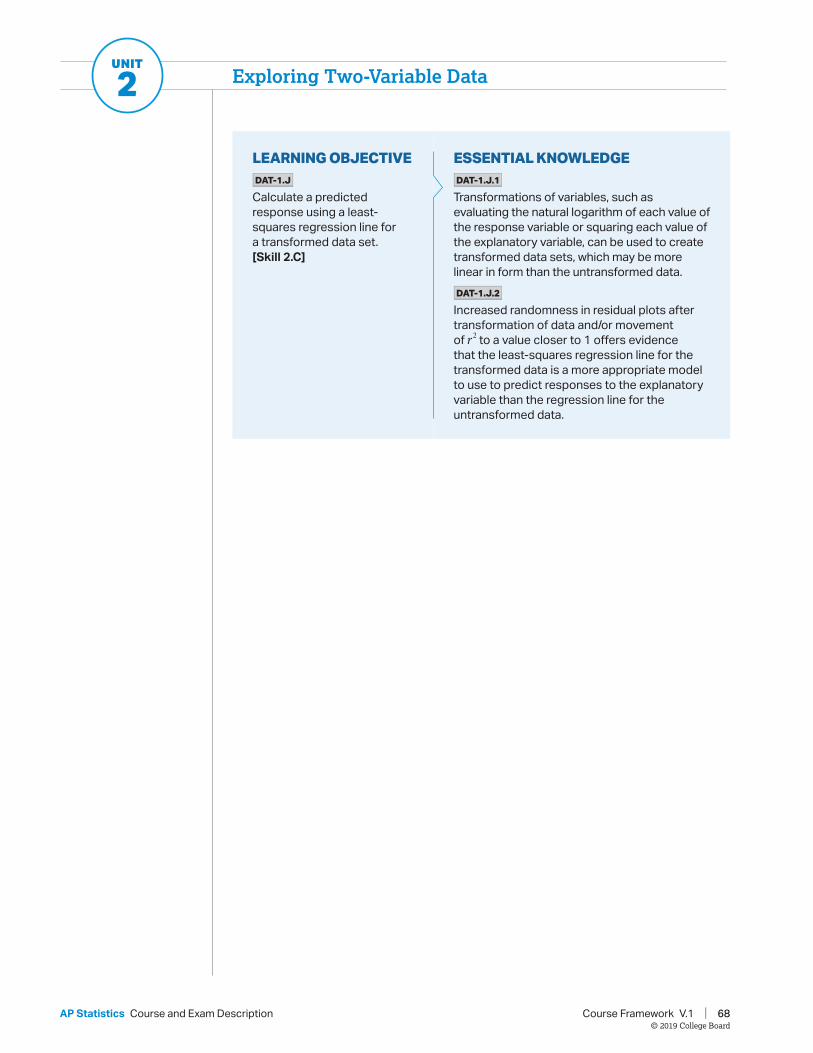
LEARNING OBJECTIVEDAT-1.J
Calculate a predicted response using a least-squares regression line for a transformed data set. [Skill 2.C]
ESSENTIAL KNOWLEDGEDAT-1.J.1
Transformations of variables, such as evaluating the natural logarithm of each value of the response variable or squaring each value of the explanatory variable, can be used to create transformed data sets, which may be more linear in form than the untransformed data.DAT-1.J.2
Increased randomness in residual plots after transformation of data and/or movement of 2r to a value closer to 1 offers evidence that the least-squares regression line for the transformed data is a more appropriate model to use to predict responses to the explanatory variable than the regression line for the untransformed data.
© 2019 College BoardCourse Framework V.1 | 68AP Statistics Course and Exam Description


![TWO-VARIABLE LINEAR PROGRAMMING: A GRAPHICAL TOOL … · solution(s). Examples of theses applets are the ‘Exploring linear programming’ [8], the ‘Linear programming applet’](https://static.fdocuments.us/doc/165x107/5cc9df8588c993570d8ced7f/two-variable-linear-programming-a-graphical-tool-solutions-examples-of-theses.jpg)