Exploring relationships between demographic variables and social ...

Exploring the Relationships Between Sensory, Consumer, Volatile, and
Physicochemical Analyses and Their Impact on Flavor in High-Quality
Apples
by
Jordan R. MacKenzie
A Thesis
presented to
The University of Guelph
In partial fulfilment of requirements
for the degree of
Master of Science
in
Food Science
Guelph, Ontario, Canada
© Jordan R. MacKenzie, May, 2021

ABSTRACT
EXPLORING THE RELATIONSHIPS BETWEEN SENSORY, CONSUMER, VOLATILE, AND
PHYSICOCHEMICAL ANALYSES AND THEIR IMPACT ON FLAVOR
IN HIGH-QUALITY APPLES
Jordan Robert MacKenzie Advisors:
University of Guelph, 2021 Dr. Lisa M. Duizer
Dr. Amy J. Bowen
The purpose of this study was to further the understanding of flavor within apples. The
foundation of this research was based on a previous Apple Sweet Spot model created by Dr. Amy
J. Bowen at the Vineland Research and Innovation Centre. Apples used in the present study were
top performers in this developed model, with this research acting to further differentiate these
highly rated apples to determine which characteristics are driving liking among consumers.
Research was conducted through sensory descriptive analysis, a large-scale consumer evaluation,
and instrumental techniques such as aroma volatile and physicochemical measurements. By
combining these evaluation methods, it allowed for an understanding of sensory descriptors and
unique apple varieties that are liked or disliked by consumers. In addition, correlations were made
to specific volatile compound groups and other instrumental methodologies that will ultimately
serve a role in breeding programs to screen apples based on these desired characteristics.

iii
Acknowledgements
First and foremost, I would like to thank my co-advisors Dr. Amy Bowen and Dr. Lisa
Duizer who I worked most closely with, for their overwhelming support, guidance, life lessons,
and for encouraging me to put my personal needs first. I am grateful for the opportunity to
complete my degree under such caring supervision and I am extremely appreciative of the
patience that you have both shown to me.
I would also like to thank my committee member Dr. Loong-Tak Lim for the continued
support, enthusiasm, and knowledge that you have provided throughout the process, inspiring me
to think critically of project details and allowing me to excel in these areas of research.
To the Consumer Insights group at Vineland, thank you for welcoming me into your team
with open arms. I have learned many great lessons that I hope to carry forward in my career. A
special thank you to all of the sensory panelists for your commitment and enthusiasm expressed
each week. To Amy Blake, thank you for your positive attitude and never failing to greet me
with a smile, as well as encouraging me to step outside of my comfort zone on many occasions
to broaden my horizons and gain a deeper appreciation for sensory and consumer research. To
David Ly, thank you for all of your hard work and long hours preparing for apple panel days,
your positivity, and for always being a great friend through it all. To Jessica Tureček, thank you
for instilling a love for statistics that I was otherwise unaware (and afraid!) of. Lastly, thank you
to my apple brother, Min Sung (Kevin) Kim for the journey, problem solving, and many laughs
we shared along the way.
To Dr. David Liscombe, thank you for your continual support, guidance, and making
science fun! I looked forward to each day I was able to spend in your lab and was genuinely
enthused by the work that you have guided me through. To the rest of the biochemistry team, a
special thank you to Tom Hern, Rosalie Zielinski, and Kevin Hooton for your assistance and
support.
Thank you to Dr. Michelle Edwards for your teachings of statistics and providing office
hours where we were able to work out specific project details. To Dr. Gopi Paliyath, thank you
for your genuine interest in my research project and many teachings of everything there is to
know about apples. I am very grateful to have taken both of your courses.
A very special thank you to my fiancée, Sarah, for keeping me grounded, allowing me to
endlessly practice presentations and bounce ideas off of you, and your continuous love and
encouragement. To my parents Rob and Carrie in Cape Breton, thank you for your continuous
support both inside and outside of school, and always cheering me on each step of the way. To
my (future) in-laws Craig and Sally, thank you for your support and many discussions and taste
tests of apples. To the entire Thurtell family, thank you for turning Ontario into my home away
from home, and for all of the support and encouragement along the way. To my entire medical
team, thank you for making this possible and enabling me to continuously better myself while
putting me in the best position to succeed.
Lastly, to the rest of my family and friends both near and far, thank you all for believing
in me through this journey. I would not have been anywhere near where I am today without such
a network of support that you have all provided for me.

iv
Table of Contents
Abstract............................................................................................................................................ii
Acknowledgements........................................................................................................................iii
List of Tables.................................................................................................................................vii
List of Figures...............................................................................................................................viii
List of Abbreviations......................................................................................................................ix
List of Appendices...........................................................................................................................x
1 General introduction.....................................................................................................................1
2 Literature review...........................................................................................................................4
2.1 Apple breeding and creation of new apple varieties......................................................4
2.1.1 Identifying and maintaining a high-quality apple...........................................5
2.2 Understanding apple flavor............................................................................................8
2.2.1 Taste, aroma, and flavor..................................................................................8
2.2.2 Apple flavor..................................................................................................11
2.3 Evaluation techniques..................................................................................................13
2.3.1 Descriptive sensory evaluation.....................................................................13
2.3.2 Consumer sensory evaluation.......................................................................16
2.3.3 Instrumental analysis....................................................................................18
2.3.3.1 Physicochemical analysis...............................................................18
2.3.3.2 Aroma and flavor measurements...................................................19
2.4 Conclusions and future research..................................................................................21

v
3 Apple Flavor and Its Effect on Sensory Characteristics and Consumer Preference...................22
3.1 Introduction..................................................................................................................23
3.2 Materials and methods.................................................................................................26
3.2.1 Products.........................................................................................................26
3.2.2 Maturity determination and apple handling..................................................28
3.2.3 Trained sensory panel evaluation..................................................................28
3.2.4 Consumer hedonic evaluation.......................................................................31
3.2.5 Statistical analysis.........................................................................................33
3.3 Results..........................................................................................................................35
3.3.1 Descriptive analysis......................................................................................35
3.3.2 Creating a sensory map and formation of apple groupings..........................37
3.3.3 Consumer evaluation....................................................................................41
3.3.4 Defining consumer groups and mapping sensory properties........................41
3.3.5 Generating a preference map........................................................................44
3.3.6 Understanding an ideal apple........................................................................50
3.3.7 Demographics, purchase behavior, and consumption habits........................51
3.3.8 Visual evaluation..........................................................................................52
3.4 Discussion....................................................................................................................55
3.4.1 Understanding taste and flavor profiles of apples.........................................55
3.4.2 Consumer preference and ideal apples.........................................................58
3.4.3 Generation of a preference map....................................................................59
3.5 Conclusions..................................................................................................................61

vi
4 Implementation of Aroma Volatile and Physicochemical Measurement Techniques for the
Determination of Flavor Properties in Apple Fruit........................................................................64
4.1 Introduction..................................................................................................................65
4.2 Materials and methods.................................................................................................67
4.2.1 Products.........................................................................................................68
4.2.2 Maturity determination, handling, and storage.............................................68
4.2.3 Aroma volatile collection and analysis by GC-MS......................................69
4.2.4 Physicochemical evaluation..........................................................................71
4.2.5 Trained sensory panel evaluation..................................................................72
4.2.6 Data organization and statistical analyses.....................................................74
4.3 Results..........................................................................................................................77
4.3.1 Analysis of variance......................................................................................77
4.3.2 Regression analysis.......................................................................................77
4.3.3 Principal component analysis.......................................................................81
4.3.4 Generalized procrustes analysis....................................................................84
4.3.5 Multi-factor analysis.....................................................................................87
4.4 Discussion....................................................................................................................94
4.4.1 Flavor characteristics of volatile organic compounds..................................94
4.4.2 Other instrumental measurements responsible for taste and flavor............102
4.5 Conclusions and future research................................................................................103
5 General conclusions and future research..................................................................................105
References....................................................................................................................................108
Appendices...................................................................................................................................117

vii
List of Tables
Table 2.1 Characteristics associated with apple quality..................................................................6
Table 2.2 Summary of recent studies conducted using DA to describe apples.............................15
Table 3.1 Apple varieties selected for analysis across both years.................................................27
Table 3.2 Basic taste, mouthfeel, and aroma reference tray standards with recipes......................30
Table 3.3 Texture reference tray with weak and intense anchors..................................................31
Table 3.4 Mean intensity scores (0-100) from a 15 cm line scale.................................................36
Table 3.5 Year 1: Summary of correlations for sensory evaluation PCA.....................................38
Table 3.6 Mean liking scores by each consumer group for apples evaluated in Year 1................43
Table 3.7 Year 1: Summary of correlations for consumer evaluation PCA..................................44
Table 3.8 Predicted liking scores for Years 1 and 2......................................................................45
Table 3.9 Estimation of consumer satisfaction..............................................................................47
Table 3.10 A comparison of reach and frequency for apple varieties...........................................53
Table 3.11 List of the characteristics defined by consumers in the visual evaluation...................55
Table 4.1 Volatile organic compound list grouped based on chemical structure..........................69
Table 4.2 Basic taste, mouthfeel, and aroma reference tray standards with recipes......................74
Table 4.3 Statistically significant sensory attributes across volatile groups regression................78
Table 4.4 Year 2: Summary of PCA correlations for sensory attributes and volatile groups........83
Table 4.5 Year 3: Summary of PCA correlations for sensory attributes and volatile groups........84
Table 4.6 Year 2 and Year 3 correlations of sensory, volatile, and physicochemical data...........86
Table 4.7 Summary of MFA results in Years 2 and 3...................................................................88
Table 4.8 Volatile compounds and their established odor/flavor profiles.....................................95
Table 4.9 Summary of sensory attributes strongly correlated to a VOC group...........................100

viii
List of Figures
Figure 2.1 Schematic of aroma perception pathways....................................................................10
Figure 3.1 PCA generated from sensory DA data in Year 1.........................................................39
Figure 3.2 PCA generated from sensory DA data in Year 2.........................................................41
Figure 3.3 Preference map conducted on Year 1 data (Factors 1 and 2).......................................48
Figure 3.4 Preference map conducted on Year 1 data (Factors 1 and 3).......................................49
Figure 3.5 Preference map conducted on Year 1 data (Factors 2 and 3).......................................50
Figure 4.1 A MFA representation of Year 2 data (Factors 1 and 2)..............................................90
Figure 4.2 A MFA representation of Year 2 data (Factors 1 and 3)..............................................91
Figure 4.3 A MFA representation of Year 3 data (Factors 1 and 2)..............................................92
Figure 4.4 A MFA representation of Year 3 data (Factors 1 and 3)..............................................93

ix
List of Abbreviations
AHC - Agglomerative hierarchical clustering
ANOVA – Analysis of variance
CA – Controlled atmosphere
CATA – Check-all-that-apply
DA – Descriptive analysis
FA – Factor analysis
GC – Gas chromatography
GPA – Generalized procrustes analysis
GTA – Greater Toronto Area
ISO – International Organization for Standardization
KMO – Kaiser-Meyer-Olkin
MFA – Multi-factor analysis
MS – Mass spectrometry
O – Olfactometry
OAG - Ontario Apple Growers
PCA – Principal component analysis
PLS – Partial least squares
RV – Random-variable
SI – Starch iodine
SSC – Soluble solids content
TA – Titratable acidity
TURF – Total unduplicated reach and frequency
Vineland – Vineland Research and Innovation Centre
VOC – Volatile organic compounds
x
List of Appendices
Appendix 1: Consent to participate in research...........................................................................117
Appendix 2: Consumer evaluation example instructions............................................................118
Appendix 3: Series of questions asked during the consumer evaluation.....................................119
Appendix 4: Consumer evaluation visual preference paper ballot..............................................125

1
1 General introduction
Apples (Malus x domestica) are a staple in the diets of people around the world as they
provide a nutritional snack that can be enjoyed in a wide variety of ways, such as juice, cider,
sauce, pie, or simply as a whole fruit. This statement holds true in Canada, where in 2019, apples
were recognized as the largest marketed fruit produced at 368 thousand tonnes (39.4% of all fruit
production), as well as having the second highest farmgate value (i.e. the market value of a
product after subtracting the sales costs), contributing $240.0 million to the Canadian economy
(Statistics Canada, 2019). In addition to this, the consistent development of new apple varieties is
necessary as consumer expectations are dictating the demand for new and improved apple
varieties to be commercialized (Bowen et al., 2018). This continual push within the industry has
led to an increase of new product development within the Canadian fruit sector, of which 44% of
the growth has been focused on new variety and range extensions between 2015-2019 (Statistics
Canada, 2019).
In general, the breeding of an apple variety from initial cross to eventual establishment
within a market is a very long process and can take a research team anywhere between 15-20
years (Bowen et al., 2018). With the increasing knowledge of consumer attitudes and purchase
behaviors, apple breeders and farmers have begun to base the earliest developmental stages of an
apple on a business-to-consumer approach, as opposed to the traditional business-to-business
approach which focused primarily on increasing yield and improving disease resistance (Tesfaye
et al., 2012). Not only is this approach important for the satisfaction of consumers, but a wide
range of economic implications can be lessened, including the cost of maintaining crops, time-
management of farm employees, opportunity cost of agricultural space, and the replacement of
older heritage apple varieties for more profitable newer varieties.
With consumer appeal leading the shift within the apple industry, it is important for apple
breeders and farmers to understand what is driving consumer liking and to act accordingly when
developing new apple varieties. In apples, the decision-making process of a consumer is based
on product familiarity, past experiences, price, and visual appearance, as consumers are not able
to judge the taste, flavor, and textural experiences until after making their purchasing decision
(Sansavini et al., 2004; Yue and Tong, 2011). Once a purchase decision is made on a novel apple

2
variety, it is at this point that the overall acceptability of an apple variety will be evaluated, thus
dictating future purchase decisions based on this initial consumer experience.
Determination of consumer perception among apples has been established through
previous sensory descriptive analysis (DA) and consumer evaluations. For example, Bowen et al.
(2018) had identified two different groups of consumers, the largest representing 89% of the
tested population, who liked apples with a sweet taste, fresh red apple aroma, crisp and juicy
texture, and a lack of mealiness. Similarly, a second and smaller consumer group, representing
11% of the tested population liked apples with an acidic taste, fresh green apple aroma, crisp and
juicy texture, and a lack of mealiness. Interestingly, many studies have found that taste and
texture attributes play the largest role in the determination of consumer liking. These areas of
study have been extensively researched, with consistent findings that consumers typically like
either sweet or acidic tastes paired with crisp and juicy textures (Daillant-Spinnler et al., 1996;
Symoneaux et al., 2012). Although these taste and texture attributes have proven to be necessary
in the development of a consumer-centric apple, it is believed that flavor is what ultimately
differentiates the top performing apples on the market, and an understanding of flavor attributes
in relation to consumer liking is essential for a new variety to succeed (Yahia, 1994; Song and
Forney, 2007).
Although sensory and consumer evaluation are the most established methods to obtain an
understanding of consumer expectations and quality of an ideal apple, these methods may not
always be feasible due to numerous reasons including time, cost, and product availability.
Therefore, rapid and efficient methods should be taken into consideration while making breeding
selections across thousands of new prospective apple varieties. Previous research has shown that
indicators may be available through instrumental techniques such as aroma volatile and
physicochemical analyses. For example, unique aroma volatile organic compounds (VOCs) or
compound groups have been found to contribute characteristic aromas that can help to classify
the aroma properties of an apple. Additionally, physicochemical properties may serve as
potential indicators due to the related sweetness (i.e. soluble solids content [SSC]), or acidity (i.e.
pH, titratable acidity [TA]) of an apple.
The purpose of this research project was to ultimately identify the key flavor attributes
that are responsible for attraction or detraction of apple varieties among consumers. The

3
hypothesis was that these key flavor attributes are responsible for driving preference and are
dependent on each unique variety. Additionally, it was hypothesized that there will be
instrumental indicators which will serve to identify and connect these flavor attributes to unique
VOC groups within each apple. For the present research, this was carried out through sensory
DA, consumer evaluation, physicochemical analysis (i.e. pH, SSC, TA), and VOC analysis (via
gas chromatography-mass spectrometry [GC-MS]). The objectives of the present study served to
build upon previous information collected from Bowen et al. (2018), who identified an “Apple
Sweet Spot” in which apples within this specific region of an external preference map
represented the interests of the largest identified consumer group. The first phase of the project
was to determine a relationship between sensory and consumer evaluation. This was
accomplished by first determining the flavor attributes associated with different apple varieties
through sensory DA. Then, consumer evaluation and questionnaires were used to determine
which apple varieties consumers preferred and to identify which varieties they classify as their
ideal apple. Finally, these identified flavor attributes would then be used to determine which
attributes contribute to consumer liking. For the second part of the present research, VOCs were
identified, measured, and related to consumer liking. Then, additional instrumental
measurements such as pH, SSC, and TA, were used to provide additional insight into the
variability among taste/flavor perceptions.

4
2 Literature review
2.1 Apple breeding and creation of new apple varieties
Apples are an incredibly complex fruit. Their positive nutritional profile (i.e. high in
vitamins, minerals, dietary fibers, and antioxidants) has contributed to an ever-expanding role
within the global fresh fruit market (Musacchi and Serra, 2018). Between 1975 – 2005, the
number of apples produced internationally grew by 30% in Europe, and 300% in Asia, with
North America, South America, Africa, and Oceania all increasing their production by a modest
amount (Sansavini et al., 2004). These growth trends have continued, with fresh apples now
ranking as the 2nd highest fruit commodity on a global scale, with China producing 37 million
metric tons of apples, followed by the USA (4.11 tons), Turkey (2.89 tons), Poland (2.88 tons),
and India (2.20 tons) as the top five producers (Tsao, 2016).
Originally, apple varieties were naturally bred through open pollination and chance
seedlings (Iwanami, 2011). The earliest known experimentation to challenge the natural breeding
patterns of apples is credited to Thomas Andrew Knight (1759-1835), who deliberately bred
apple varieties via artificial hybridization to rid varieties of disease, thus improving overall fruit
quality and yield (Iwanami, 2011). Throughout history, traditional apple breeding programs were
driven by these same objectives; to develop a long-lasting, disease resistant (e.g. scab, mildew,
fire blight) apple variety with an appealing appearance and sensorial composition (Sansavini et
al., 2004; Iwanami, 2011). These efforts have persisted through modern times, where apple
growers and breeders continue to focus on the development of new technologies to aid in the
breeding, production, and postharvest qualities of apples (Song and Forney, 2007). Although
progress has been made in each of these areas, a balance of these three qualities within a singular
variety has proven difficult, as there are numerous other limitations (e.g. initial investment, field
trials, patents and intellectual property, and lack of consumer familiarity or knowledge) that halts
progress and leads to a weaker response in the commercialization of new varieties (Sansavini et
al., 2004).
One of the most progressive areas of apple research has been in the understanding of
disease resistance (Iwanami, 2011). These developments have led to an increase in the overall
yield of varieties, and as a result, the focus within the apple industry has now primarily shifted to

5
improving the overall quality aspects of new varieties in the eyes of a consumer (Jaeger et al.,
1998; Iwanami, 2011; Tesfaye et al., 2012). This recent push has changed the traditional
business-to-business level approach to a consumer-focused approach. Consumer preference
influences even the earliest stages of apple breeding and product development, in order to create
a high-quality apple that will be commercially successful (Tesfaye et al., 2012).
2.1.1 Identifying and maintaining a high-quality apple
A high-quality apple is crucial for consumer appeal and success on the market. Many
different definitions exist for what makes an apple “high-quality” on a global scale, as can be
seen in Table 2.1. Although the perspective of apple quality varies based on where along the
supply chain this term is used, this review will define apple quality in terms of edible/consumer
quality expectations (Musacchi and Serra, 2018). Therefore, for the purpose of this literature
review, apples of high quality will consist of the ideal internal (i.e. taste, texture, aroma/flavor,
nutritional value) and external (i.e. color, shape, size, absence of defects) characteristics as
defined by apple consumers (Musacchi and Serra, 2018).
The challenge with production of a high-quality apple is that apple consumers have
begun to set expectations for apples to exhibit the desired appearance, taste, and texture of an in-
season fresh fruit after months in post-harvest storage (Dixon and Hewett, 2000). For apple
breeders and growers, this presents a very difficult challenge, as the longevity of these quality
characteristics may not always be achievable. For instance, pre-harvest conditions are difficult to
control, as they can be impacted through various environmental, genetic, and agronomical
conditions (Musacchi and Serra, 2018). With this knowledge, apple farmers must consistently
monitor their product to ensure the ideal harvesting time prior to the apple reaching the market.
If the apples are not harvested within their ideal window, a lower quality fruit with less than ideal
internal and external characteristics will reach the market for purchase by consumers (Dixon and
Hewett, 2000; Song and Forney, 2007). Traditionally, pre-mature apples were harvested prior to
reaching their optimal maturity, as they would continue to ripen over the time spent in transit and
storage (Song and Forney, 2007; Musacchi and Serra, 2018). However, with modern technology,
chemical agents are now being introduced to the apple fruit pre-harvest, thus delaying harvesting
windows and allowing for the fruit to mature on the tree and become a higher quality product at

6
the time of harvest. With this knowledge, the best practices for growers to ensure longevity of
quality traits include shipping conditions, storage conditions, and maturity at time of harvest
(Song and Forney, 2007).
Table 2.1 Characteristics associated with apple quality.
Author (Year) Definition of quality in terms of apples
Song and Forney (2007) Appearance, color, texture, flavor, and nutritional value
Kouassi et al. (2008) External appearance, texture, and taste
Iwanami (2011) Crisp, juicy, sweet, and acid (as a sign of freshness)
Galmarini et al. (2012) Texture, visual, and flavor qualities with importance of juicy,
crunchy, and sweet
Tesfaye et al. (2012) Freshness, nutritional value, flavor
Corollaro et al. (2013) Shape, size, color, SSC, TA, penetrometer measurements
Sansavini et al. (2015) Appearance, sensory traits, storability, and shelf-life
Musacchi and Serra (2018) External (color, shape, size, absence of defects) and internal (taste,
texture, aroma, nutritional value, sweetness, acidity, shelf-life, lack of
defects) characteristics
Apples are a climacteric fruit, meaning that, as they mature, a noticeable increase of
ethylene hormone production will occur leading to an increase in respiration and ultimately the
onset of ripening within the fruit (Sung and Forney, 2007; Yang et al., 2013; Muche, 2016;
Musacchi and Serra, 2018). As defined by ISO 7563 (International Organization for
Standardization [ISO], 1998), ripening is a “process of development between physiological
maturity and the state of being ripe when the fruit or vegetable possesses its highest quality”. The
ripening process impacts the size, color, acid/sugar ratio, flavor, and texture of the fruit in a
desirable progression, thus leading to an ideal quality fruit prior to becoming overripe (Corollaro
et al., 2013). As apples continuously ripen, they begin to undergo senescence which will
accelerate the deterioration of the cellular structure (Beaudry and Watkins, 2001). To combat this
process, a number of ethylene inhibitors have been introduced, including 1-methylcyclopropene
(1-MCP), diphenylamine (DPA), aminoethoxyvinylglycine (AVG), and diazocyclopentadiene
(DACP) which all work to either inhibit volatile biosynthesis, or delay the action of ethylene

7
affecting the maturation of the fruit and will therefore extend the shelf-life of the apple (Fan et
al., 1998; Beaudry and Watkins, 2001; Bai et al., 2005; Yang et al., 2013; Muche, 2016).
Of the commercially available ethylene inhibitors, one of the most discussed within the
literature is 1-MCP. This chemical agent works by binding to ethylene receptors and decreasing
the affinity of the receptor to ethylene hormones, thus delaying the effects of ethylene on the
apple (Beaudry and Watkins, 2001; Bai et al., 2005). As a result of this competitive binding, 1-
MCP has been found to delay and decrease respiration due to a lower presence of ethylene, thus
providing better conditions for storage post-harvest including increased firmness, maintenance of
TA and color, as well as a decrease in physiological disorders (Beaudry and Watkins, 2001; Bai
et al., 2005).
Although the use of 1-MCP and other ethylene inhibitors seems like a step in the right
direction for the maintenance of a high-quality apple, there are also downsides to using these
chemical agents. First, with the constant push for natural products free of chemical-use, apples
exposed to 1-MCP have run into export issues, where international markets are wary of fruit
treated with 1-MCP (Mditshwa et al., 2017). Additionally, although 1-MCP is beneficial for the
external qualities of the fruit, it is detrimental to the overall taste and flavor of the apple (Yahia,
1994; Defilippi et al., 2005; Song and Forney, 2007). This is because ethylene production is
responsible for the development of VOCs within the apple (Defilippi et al., 2005). With this
process being delayed, there are also delays in respiration and aroma production (Beaudry and
Watkins, 2001; Defilippi et al., 2005).
Another common method to control post-harvest maturation of apples is controlled
atmosphere (CA) storage, as it enhances the preservation of overall fruit quality (Dixon and
Hewett, 2000). With this approach, the storage climate can be adjusted to maintain low
temperatures, low oxygen levels, and high carbon dioxide concentrations (Dixon and Hewett,
2000; Beaudry and Watkins, 2001). However, if apples are stored in this condition for too long,
the overall flavor and aroma characteristics of the fruit will begin to diminish (Dixon and
Hewett, 2000). Previous research has shown that these flavor and aroma changes become
noticeable to apple consumers after only six months of storage, as the amount of volatile
production decreases by 30-60% when exposed to these conditions (Dixon and Hewett, 2000).
Other changes found in long-term CA storage include a reduction of fatty acids when exposed to

8
low oxygen (Dixon and Hewett, 2000). This will resultantly diminish the number of esters, the
primary compound group contributing to a “fruity” aroma, by decreasing the available biological
precursors for ester production (Dixon and Hewett, 2000).
2.2 Understanding apple flavor
2.2.1 Taste, aroma, and flavor
Taste has developed within mammals through the evolutionary process to serve as a
mechanism in the detection of nutrient quality within a food source, as well as aiding in the
critical avoidance of environmental toxins (Chandrashekar et al., 2000; Huang et al., 2006; Jiang
et al., 2008). To classify as a primary taste, a perception must meet six eligibility criteria: the
taste has an ecological consequence, is generated through distinctive chemicals, acts to activate
specialized receptors, is detected through the gustatory nerves and processed in taste centers, is
unique and does not overlap with other primary tastes, and evokes a behavioral and/or
physiological response (Running et al., 2015). When introduced to the tongue or oral cavity,
tastes can be distinguished through six inherent basic taste modalities: sweet, bitter, umami, sour,
salty, and the recent recognition of oleogustus (Huang et al., 2006; Running et al., 2015; Challis
and Ma, 2016). Although the chemical pathway for all tastes are not fully understood, a clear
understanding of sweet, bitter, and umami exists in that they are regarded as the taste
mechanisms that dictate our acceptance for food (Temussi, 2009). This holds true when diving
deeper into the chemical processes of taste.
To begin, sweet taste serves as a tool to recognize sugars and has evolutionarily
developed as a mechanism to identify a natural source of energy (Temussi, 2009). This
recognition occurs by the binding of sweet compounds to T1R2-T1R3 receptors (Jiang et al.,
2008; Temussi, 2009). Similarly, umami taste has developed to serve as a mechanism to
recognize natural protein sources by identifying potential sources of amino acids and peptides
within food (Temussi, 2009). Umami taste is elicited by T1R1-T1R3 receptors, which are in the
same family of class C G-protein-coupled receptors as the sweet receptors (Temussi, 2009).
Bitter, on the other hand, has served an evolutionary purpose to help mammals detect foods with
toxic compounds, and thus provide a necessary role for the avoidance of foods (Chandrashekar et
al., 2000; Temussi, 2009). The receptors responsible for bitter taste perception include the class

9
A G-protein-coupled receptors, which cover a wide range of T2Rs, all responsible for detecting
numerous bitter or potentially toxic compounds (Chandrashekar et al., 2000; Temussi, 2009).
Salty taste relies on a number of ion channels which react synaptically through a series of action
potentials when introduced to a food stimulus (Mouritsen, 2015; Roper, 2015). Although the
specific channels of interest are not for certain, Roper (2015) identified that epithelial sodium
channels play a large role in the transduction of Na+ which ultimately leads to a salty perception
when stimulated. The least understood of the basic tastes is sour (Ye et al., 2015). Sour taste has
evolutionarily developed to act as a warning signal for acidic food sources that may be spoiled or
unripe and thus presenting a danger to consumption among mammals (Huang et al., 2006).
Huang et al. (2006) have identified the polycystic-kidney-disease-like channel of PKD2L1 as a
potential receptor for sour taste. Most recently, Ye et al. (2015) discussed that a potential
amplification pathway for sour taste may exist via intracellular acidification which serves to
excite the sour taste cells by blocking K+ channels, specifically KIR2.1, which may impact the
physiological sensitivity to sour-inducing chemicals (Ye et al., 2015). The last basic taste,
oleogustus, acts via an oral response to nonesterified, medium-chain and short-chain fatty acids,
aiding the detection of fat among food sources and serves an ecological purpose to ultimately
detect fermented or rancid food products (e.g. nonesterified fatty acids, sourness [short-chain
fatty acids], or irritants [medium-chain fatty acids]) (Running et al., 2015).
Umami, salty, and oleogustus tastes are uncommon in apples, with sweet, acid, and bitter
being the predominant taste characteristics (Passam et al., 2011). Sweetness in apples is due to a
combination of three sugars: sucrose, glucose, and fructose (Yahia 1994). The primary
component responsible for acid perception within apples is malic acid, although citric acid is also
found in smaller quantities (Yahia 1994). Sweet or acidic measurements alone do not serve as
indicators of a high quality apple, as most fruit-breeding programs seek to create a balanced ratio
of the two as they have been found to indicate an increased sweetness perception in consumers
(Diamanti et al., 2011).
Both sweet and acid concentrations can be measured through numerous instrumental
analyses including pH, SSC (measured as °Brix), and TA. However, due to the complexity of
apples and the differences among varieties, these instrumental measurements alone do not
provide adequate information to predict the perceived sweetness or acidity of an apple as

10
perceived by a consumer (Mehinagic et al., 2006). Bitter perception, although not commonly
found to be in high intensities (unless specifically in the apple skin), can be attributed to a higher
phenolic content in the apple (Yahia, 1994). This typically occurs in unripe apples, as the
phenolic content is higher in immature apples and will gradually decline as ripening occurs
(Yahia, 1994).
As defined by ISO 7563 (ISO, 1998), flavor is a term used to describe the combination of
gustatory (taste), olfactory (smell), and trigeminal (tactile and thermal) sensations that are
perceivable. This means that the six basic tastes are combined with aroma sensations as well as
other trigeminal perceptions (e.g. astringency, menthol, capsaicin, carbonation) to generate a
perceivable flavor (Lawless and Heymann, 2010). Aromas are perceived via two primary
systems known as the ortho- and retro- nasal olfaction systems, as seen in Figure 2.1 (Landis et
al., 2005; Blankenship et al., 2019). Orthonasal aromas are perceived directly from external
sources and are introduced to the olfactory system via inhalation through the nostrils, while
retronasal aromas are internally sourced via the mouth and back of throat when a stimulus is
present within the mouth (Blankenship et al., 2019). These two systems have the capacity to
recognize and differentiate between approximately 10,000 unique aroma sensations (Ulrich and
Olbricht, 2011). Trigeminal sensations act on the trigeminal nerve to produce a chemesthetic
reaction and are induced by a chemical stimulus within the mouth, nose, or eyes (Lawless and
Heymann, 2010).
Figure 2.1 Schematic of aroma perception pathways, detailing the difference between orthonasal
(directly through the nostrils) and retronasal (through the back of the mouth) olfactory systems
(Blankenship et al., 2019).

11
2.2.2 Apple flavor
When it comes to apples, taste and texture parameters are regarded as the predominant
qualifiers of consumer preference (Yahia, 1994). However, according to Song and Forney (2007)
and Yahia (1994), it may be flavor that is the most important factor in determining the overall
quality characteristics of the fruit. A unique flavor composition can help to characterize an apple
variety, allowing it to excel in the commercialization process.
Apples are comprised of more than 300 aroma VOCs, with different combinations of
these VOCs resulting in a variety of flavor perceptions, making apples a very complex natural
product (Yahia, 1994; Dixon and Hewett, 2000; Song and Forney, 2007; Aprea et al., 2012;
Nieuwenhuizen et al., 2013; Ting et al., 2015). These VOCs can be divided into two main
groups: primary and secondary VOCs. Primary VOCs are perceptible from the intact fruit and
are easily identifiable by sniffing the aroma of the apple prior to consuming the product (Yahia,
1994; Song and Forney, 2007). Secondary VOCs are released at the expense of tissue fracture,
whether it be through mastication or cutting the apple open (Yahia, 1994; Song and Forney,
2007). The perception of both VOC classifications is dependent on the chemical concentration
within the fruit, as well as the aroma perception thresholds of the individual person (Song and
Forney, 2007). The development of VOCs is dependent on the maturation cycle of apples, which
varies based on several factors and is specific to the fruit species and cultivar (Dixon and Hewett,
2000). The typical chemical profile of an apple is composed of aldehydes, alcohols, esters,
ketones, carboxylic acids, sesquiterpenoids, and terpenes (Dixon and Hewett, 2000; Song and
Forney, 2007; Aprea et al., 2012; Nieuwenhuizer et al., 2013; Espino-Diaz et al., 2016), with the
majority of these being represented by esters (78-92%) and alcohols (6-16%) (Dixon and Hewett,
2000; Aprea et al., 2012). Alcohols and aldehydes have been found to act as precursors for ester
synthesis as the apple ripens, and therefore also contribute to the overall aroma (Dixon and
Hewett, 2000; Song and Forney, 2007).
Of the approximately 300 recognizable compounds, only about 20 have been identified as
flavor impact compounds which are responsible for characteristic apple aromas (Yahia, 1994;
Dixon and Hewett, 2000; Song and Forney, 2007; Zhu et al., 2020). These impact compounds
can be characterised as a group of compounds, such as acetate esters which are linked to overall

12
apple aroma (Aprea et al., 2012), or as singular compounds, such as hexanal and (E)-2-hexenal
describing green apple-like aromas (Aprea et al., 2012). Aprea et al. (2012) also notes that
acetate esters are linked to pear, banana, and apple aromas, and are represented by a mixture of
the individual compounds butyl acetate, hexyl acetate, amyl acetate, isobutyl acetate, (z)-3-
hexenyl acetate, and butyl propionate. Another group discussed by Aprea et al. (2012) includes
lemon and grapefruit aromas being represented by butanoate esters. As an example from a whole
fruit perspective, a distinctive Fuji apple aroma has been shown to be distinguished by the
character impact compounds of ethyl butanoate, ethyl 2-methylbutanoate, 2-methylbutyl acetate,
ethyl hexanoate, and hexyl acetate (Song and Forney, 2007). Dixon and Hewett (2000) have also
identified specific apple varieties that are characterized by their ester type, including Calville
Blanc and Golden Delicious characterised by acetate esters, Belle de Boskoop, Canada Blanc,
and Richared characterised by butanoate esters, Reinette du Mans, Richared, and Starking being
represented by propanoate esters, and Starking again also being represented by ethanolic esters.
Similarly, Atkinson (2018) identified that phenylpropene VOCs, and specifically estragole,
which are commonly recognized as floral aromas, have been shown to characterise Spartan and
Ellison’s Orange apples with an aniseed-like aroma. Some of these character impact compounds
may be present in low concentrations, but due to their low aroma thresholds, a perceptible aroma
is expressed due to a high aroma intensity and/or aroma quality (Dixon and Hewett, 2000).
As we begin to understand the complexity of flavor, there are also external and
environmental sources that exist which modulate aroma volatiles within the apple. Some of these
include the growing region and climate, fruit maturity, and pre- and post- harvesting processes
(Zhu et al., 2020). This increased complexity of flavor makes it difficult to pinpoint flavor
profiles in natural food products as there are many internal and external variables that influence
the overall development of the fruit, thus leading to a change in chemical composition even
between fruit from the same variety and therefore not allowing a consistently reproducible
product (Hampson et al., 2000).
Unfortunately, apple flavors are not well understood, as the historical focus within the
industry has been to increase yield and disease resistance, then shifting to satisfy the optimal
taste and texture thresholds as defined by consumers, and ultimately neglecting the
understanding of flavor properties. This is partially due to the complexity of flavor, as it is a

13
dynamic experience for a consumer when eating the fruit (Ting et al., 2012). Not only do the
extrinsic and environmental factors play a role in the formation of aroma VOCs, but once the
apple is ready for consumption, there are many physiological factors that will alter the flavor
experience during mastication. These include structure deformation via chewing, thus leading to
an unregulated release of secondary VOCs within the mouth, the mixture with saliva, hydration
levels, and the inherent physiological differences among each unique consumer (Ting et al.,
2012). The consumer experience will also vary due to modulation of aroma VOCs influencing
the taste perception (Aprea et al., 2017). An example of this is reported by Aprea et al. (2017), as
they showed that when measuring sweetness, direct sugar quantification and SSC measurements
are the best indicators, however, aroma VOCs also play a large role in defining the sweetness of
the apple.
2.3 Evaluation techniques
2.3.1 Descriptive sensory evaluation
Descriptive analysis is the most commonly used method for providing a fully
encompassing description of the quantitative and qualitative characteristics of a food product
through the use of a trained panel of expert assessors (Murray et al., 2001; Lawless and
Heymann, 2010; Aprea et al., 2012; Corollaro et al., 2013). Sensory panelists are typically
screened and recruited based on their sensory acuity, and then trained based on the specific
project objectives (Murray et al., 2001). One of the most important segments in training is the
development of a sensory lexicon. This process is accomplished by the panelists being
introduced to a set of products which span any and all expected descriptive terms that they may
come across throughout the product testing stages (Murray et al., 2001; Lawless and Heymann,
2010). Sensory panels will typically use a consensus method to determine which lexical
attributes are most important and act to create a succinct list of these terms for an established
sensory lexicon (Aprea et al., 2012). As outlined by Lawless and Heymann (2010), these terms
should act to discriminate differences among products, be non-redundant and have no relations to
other terms, relate to consumer acceptance/rejection, relate to instrumental or physical
measurements, use a one-dimensional descriptive term, be precise and reliable, achieve
consensus from the sensory panel, be unambiguous, have an easily obtainable reference standard,

14
accurately portray the sensory profile, and they must ultimately relate to reality. A panel leader
will often introduce reference standards to help with panel agreement and with concept
alignment (Murray et al., 2001; Lawless and Heymann, 2010). Lexicons developed for DA will
ultimately measure various tastes/mouthfeels, textures, aromas/flavors, appearances, and sounds
of the product in question through quantitative intensity ratings (Murray et al., 2001; Chambers
IV and Koppel, 2013). By utilizing human assessment, DA provides the most accurate source of
data as the panelists are regularly trained and calibrated to act as an objective measuring unit and
can therefore be used as reference when calibrating instrumental methods (Murray et al., 2001;
Corollaro et al., 2013).
Sensory DA in apples has proven to be successful by highlighting key varieties and
sensory characteristics that are optimal for market success (Cliff et al., 2016). Texture, taste, and
flavor are the most commonly evaluated, with a summary of these attributes found in Table 2.2.
With sensory DA, intensity scores of these attributes can be analyzed to identify commonalities
within the tested varieties. For example, Bowen et al. (2018) identified four product groups
through a clustering analysis. These groups were discriminated based on their sensory profiles,
and included an aromatic-sweet group composed of apples with crisp, juicy, and sweet traits, an
acidic group defined by juicy and crisp textures with an acidic taste, a balanced group which had
no particular attributes standing out with high or low intensities, and a mealy group which was
characterized purely by the texture qualities of high mealiness and low juicy and crisp (Bowen et
al., 2018). Similar to Bowen et al. (2018), Aprea et al. (2012) highlighted five different groups of
apples based on their sensory descriptors; Group 1 included only Granny Smith apples which
were described as being the most herbaceous of the varieties, Group 2 was found to be less
herbaceous with notes of citrus aroma, Group 3 had almost no herbaceous aromas but were
defined as being high in quince, tea, and hay, Group 4 was the well-balanced group in this study,
while apples in Group 5 were found to be the fruity varieties with pear and banana aromas
(Aprea et al., 2012). Jaeger et al. (1998) used sensory DA data to correlate similar and dissimilar
terms to create profiles for ‘fresh’, ‘mid-point’, and ‘mealy’ apples. These results found two
main components which were responsible for discrimination between the sensory attributes, one
being characterised primarily by mealy texture, and the second being characterised by aroma and
flavor differences (Jaeger et al., 1998).

15
Table 2.2 Summary of recent studies conducted using DA to describe apples, including number
of panelists, number of apples, and the sensory attributes.
Author Number
of
panelists
Number
of
apples
Sensory attributes
Aprea et al.
(2012)
n=13 n=18 Almond, apple, banana, concord grape, cooked
apple, grapefruit, kiwi fruit, lemon, melon, Moscato
grape, overripe apple, pear, pineapple, quince, cut
grass, cucumber, hay, pumpkin, tea, tobacco, anise,
cloves, pepper, vanilla, acacia, camomile,
geranium, honey, orange blossoms, rose, violet
Corollaro et al.
(2013)
n=13,
n=14
n=29 Green flesh, yellow flesh, hardness, juiciness,
crunchiness, flouriness, fibrousness, graininess,
sweet taste, sour taste, astringency
Cliff et al.
(2016)
n=10 n=20 Crispness, hardness, juiciness, skin toughness,
astringency, sweetness, tartness, cooked apple
flavor, floral/perfume/spicy flavor, other fruit flavor
Amyotte et al.
(2017)
n=20 n=85 Acid, bitter, sweet, earthy, floral, fresh green apple,
fresh red apple, honey, lemony, oxidized red apple,
astringent, chewy, juicy, mealy, rate of melt, skin
thickness
Aprea et al.
(2017)
n=19 n=17 Sweetness, sourness
Bowen et al.
(2018)
n=10 n=63,
n=76
Oxidized red apple, earthy, hay, honey, floral,
lemony, fresh green apple, fresh red apple, sweet,
acid, bitter, astringent, skin thickness, crisp, juicy,
chewy, mealy, rate of melt
Although DA allows for a thorough understanding of descriptive properties, it also comes
with a downside. Sensory testing methods can be expensive, laborious, and time consuming to
complete, and for this reason, it is important to search for alternative methods to lower the
frequency of using sensory panels (Aprea et al., 2012; Chambers IV and Koppel, 2013; Ting et
al., 2015). These challenges can be overcome by pairing descriptive analysis data with consumer
and instrumental measurements to ultimately generate a prediction model to achieve the purpose
of the research project.

16
2.3.2 Consumer sensory evaluation
Consumer evaluation allows for the understanding of how much consumers like a food
product. Consumer studies are typically housed in a central location with anywhere between 50-
300 participants involved in the study (Daillant-Spinnler et al., 1996; Lawless and Heymann,
2010). Ideally, these panelists are selected based on the fulfillment of an equal representation of
the population and demographic that would be purchasing and/or consuming the product
(Meilgaard et al., 1999; Stone and Sidel, 2004; Hough et al., 2006; Lawless and Heymann,
2010).
Consumer testing is a common approach to help build an understanding of the potential
marketability and success of a product on the market (Lawless and Heymann, 2010). Unlike
sensory DA, the purpose of a consumer evaluation is to determine the degree of liking for a
product rather than providing a full description of the product. As described by Lawless and
Heymann (2010), there are two main approaches in conducting a consumer evaluation: the first
is to identify preference in comparison to another product, and the second is to determine
acceptance, where a consumer is asked to rate their level of liking for a product. Of the two,
acceptance testing is considered the best consumer evaluation practice, as it allows for a liking
rating while also allowing for future interpretations of preference from this data (Lawless and
Heymann, 2010). Difficulties exist in consumer studies, as liking among consumers is not
uniform across a population (Guinard, 2002). Therefore, it is often necessary to divide
consumers into groups, as drivers of liking differ based on segmentation within the market
(Guinard, 2002; Varela, 2014). In addition to this, consumer liking data is one-dimensional, and
allows for consumers to dictate whether or not they like the product but does not allow for them
to describe why this is the case (van Kleef et al. 2006). To combat these difficulties, multivariate
statistics can be used to generate groupings of the tested consumer population based on their
likes and dislikes of the product. Additional data can be collected through a check-all-that-apply
(CATA) questionnaire in which consumers are able to describe a product at the time of tasting,
as well as to highlight traits that they would use to define an ideal product (Dupas de Matos et
al., 2018). Lastly, it is possible to pair this data with sensory DA to create a prediction tool,
known as preference mapping, that can pair liking data with descriptive qualities of the products
(van Kleef et al., 2006).

17
Preference mapping is a tool to generate a product space which shows variables
contributing to consumer preference. This information can be used to optimize a product prior to
commercialization in order to satisfy the desires of a consumer. It is suggested that a minimum
of six products are used to generate a preference map, although Guinard (2002) recommends
implementing a minimum of ten. Internal preference mapping utilizes consumers and products to
create a principal component analysis (PCA) biplot. Due to the large number of datapoints in a
consumer evaluation, consumers are often grouped through a cluster analysis to simplify and
provide more clarity towards the preferences of the tested population (Guinard, 2002; van Kleef
et al., 2006). Similarly, external preference mapping uses a PCA biplot to map consumer
evaluation data and either sensory DA data, or instrumental analysis data (Guinard, 2002; van
Kleef et al., 2006). The sensory/instrumental data will be used to generate the biplot, and the
consumer preference data will then be related to the dimensions of the external preference map.
Clustering is also used for external preference mapping in order to allow the model to show the
most meaningful data (Guinard, 2002). Limitations of preference mapping exist, as the model
will not be able to explain all of the variance within the tested products and will only be able to
map a portion of the overall variance onto a number of meaningful dimensions (Guinard, 2002).
As described by Corollaro et al. (2013), the largest driving factor in consumer
consumption behavior is the eating quality of the fruit. In addition to this, Harker et al. (2003)
and Ting et al. (2015) have stated that texture is the most important in factor in determining fruit
quality. To align with both statements, we can see in several studies (Daillant-Spinnler et
al.,1996; Jaeger 1998; Bonany et al., 2014) that both texture as well as taste are the main drivers
of liking among consumers. Cliff et al. (2016) combined consumer evaluation and sensory DA
data to determine consumer liking based on two different preference maps, one for texture and
one for flavor. In the texture preference map, three groups of consumers were segmented (Cliff
et al., 2016). The largest group of consumers (82%) preferred apples with firm, crisp, hard, and
juicy textures. The second largest group (14%) liked apples that were less firm, crisp, hard, and
juicy while also having an increased astringency and tougher skin. The smallest group of
consumers (4%) preferred apples with a medium intensity of textural qualities while having a
low skin toughness and astringency (Cliff et al., 2016). In the flavor preference map, two
different groups of consumers were clustered (Cliff et al., 2016). Consumers in the first group

18
(88%) liked apples with sweet taste and floral, perfume, and spicy aromas (Cliff et al., 2016). In
the second group (12%), consumers preferred apples with a tart taste and cooked-apple aroma.
Jaeger et al. (1998) also conducted a consumer evaluation to generate an internal preference map.
Results of this study showed that across the two main dimensions, one represented the
differences among flavors and included sweet, red apple, and floral/fruity aromas serving as the
most preferred flavor attributes (Jaeger et al., 1998). On the second dimension of the preference
map, Jaeger et al. (1998) found that differences in texture were causing segmentation,
specifically the attributes hard, juicy, and crisp representing the most preferred apples.
2.3.3 Instrumental analysis
2.3.3.1 Physicochemical analysis
Physicochemical analyses can be used to determine the potential sweetness and acidity of
an apple variety, which are important factors in defining consumer preference (Daillant-Spinnler
et al., 1996; Jaeger et al., 1998; Harker et al., 2002). Techniques frequently used for
physicochemical analysis include measurements of SSC and TA. These instrumental practices
serve as an objective measurement and are often paired with objective sensory DA data and
subjective consumer evaluation data.
Soluble solids content is an instrumental measure to approximate sugar content in apple
fruit (Amyotte et al., 2017) and work has been conducted to examine the efficacy of SSC to
predict perceived sweetness of apples. Soluble solids content can be measured quickly and easily
by using a refractometer with juice extracted from the apple via compression of the fruit
(Corollaro et al., 2014; Ting et al., 2015; Aprea et al., 2017). However, results of previous
studies have indicated that SSC has no significant differences (p<0.05) across tested apple
varieties (Corollaro et al., 2014), or has a low correlation (r=0.41; Harker et al., 2002) to
sweetness and has instead been found to be correlated with fruity ester aromas (r=0.57; Ting et
al., 2015). Due to the lack of clarity achieved by SSC in predicting the sweetness of the fruit, it is
recommended to complement this instrumental data with an assessment by an expert trained
sensory panel in order to find meaningful predictions within the data (Harker et al., 2002).

19
Titratable acidity measurements act as a physicochemical predictor in determining the
concentrations of acids in a food, therefore serving as an indicator of acid taste. Similar to that of
SSC, recommendations for TA measurements in apples exist in which the analysis should be
conducted on apple juice which has been extracted through compression of a fruit sample and
then titrated using NaOH to an endpoint pH of 8.16 with the results being expressed as malic
acid equivalents per a defined volume of juice (Corollaro et al., 2014; Ting et al., 2015; Amyotte
et al., 2017). TA has been correlated (p<0.05) with acid/sour taste (r=0.86; Harker et al., 2002;
unreported correlation, Corollaro et al., 2014; r=0.98, Ting et al., 2015), astringency (r=0.89;
Ting et al., 2015), overall flavor (unreported correlation; Harker et al., 2002), apple flavor
(unreported correlation; Harker et al., 2002), juiciness (unreported correlation; Corollaro et al.,
2014), and a negative correlation to sweet (r=-0.88; Ting et al., 2015).
With the knowledge of these studies, and due to the complexity of human perception of
taste characteristics, it has been advised that instrumental data is not used alone, and should
instead be used in conjunction with sensory DA data (Harker et al., 2002). Although this may not
always be feasible, Harker et al. (2002) suggests that breeders may use TA to measure the
predicted acidity of apples but advises not to rely on SSC data.
2.3.3.2 Aroma and flavor measurements
Instrumental methodologies to evaluate aroma and flavor have been adopted starting in
the 1950s, with the introduction of GC and MS (Yahia, 1994; Delahunty et al., 2006). Since then,
more than 10,000 VOCs have been identified, with only a fraction of these contributing to the
overall aroma of a food product (Song and Liu, 2018). By using GC, it is now feasible to
separate individual compounds out of a mixture of VOCs, which can then be identified based on
their structural composition via retention times, quantified, and paired to a reference standard as
part of MS (Delahunty et al., 2006; Song and Liu, 2018). In addition to these two practices, it is
also possible and even encouraged to add an olfactometry (O) component to the previously
identified analysis methods. This GC-O or GC-O-MS system works by allowing the individual
VOCs to split within the GC detector, and then be directed to a port outside of the oven for a
human panelist to sniff the eluent in order to characterize the produced aroma by each individual

20
VOC, or to identify the threshold of the aroma (Yahia, 1994; Delahunty et al., 2006; Aprea et al.,
2012; Song and Liu, 2018).
In apples, VOCs are commonly extracted using a headspace collection technique, where
the fruit is left intact, cut, or macerated and then enclosed in an inert space (Song and Forney,
2007; Aprea et al., 2017) with either forced air (Rowan et al., 2009; Kumar et al., 2020) or a
vacuum (Mehinagic et al., 2006) being used to direct the VOCs for collection. The VOCs can
then be contained using an adsorbent resin trap (Mehinagic et al., 2006; Kumar et al., 2020), and
are eluted using chemicals such as diethyl ether (Rowan et al., 2009) or dicholoromethane
(Mehinagic et al., 2006; Kumar et al., 2020). This dynamic headspace collection process is an
ideal method found in the literature, as the technique allows for a good testing sensitivity and can
also be used on almost all fruits (Song and Forney, 2007). After this process, samples can be run
using GC, GC-MS, GC-O, or GC-O-MS to identify, quantify, and characterize each unique
VOC.
Identification of VOCs is typically conducted by using a reference database such as the
National Institute of Standards and Technology Standard Reference Database, or by utilizing an
authentic reference standard (Aprea et al., 2017; Kumar et al., 2020). However, the identification
of a singular VOC compound is typically not useful due to the complexity of a natural food
product, and the tested VOCs should therefore be grouped through multivariate statistics in order
to draw conclusions on the perceptible aromas in relation to other sensory attributes (Aprea et al.,
2012). Harker et al. (2002) used a PCA which identified two dimensions contributing 61.4% of
the variation within their model. Unfortunately, due to the low amount of variability attained
through the PCA, they were not able to infer any conclusions in relation to flavor. Aprea et al.
(2012) was able to identify 72 VOCs through solid-phase microextraction GC-MS within 18
unique apple varieties. This team also used PCA and hierarchical clustering analysis to conclude
that their “fruity” apple group was found to be high in acetate esters, in line with other literature
who have had similar findings (Plotto et al., 1999; Lopez et al., 2000; Mehinagic et al., 2006).
Relationships between sensory descriptors and volatile compounds had also been analyzed by
utilizing other multivariate statistical testing include partial least squares (PLS), generalized
procrustes analysis (GPA), and multi-factor analysis (MFA). Through the use of PLS, Aprea et
al. (2012) discovered that the compounds butyl acetate, hexyl acetate, amyl acetate, isobutyl

21
acetate, (Z)-3-hexenyl, and butyl propionate have the top variable importance in projection
scores across the apple, pear, and banana aromas, with different concentrations being seen across
each (Aprea et al., 2012). Du et al. (2010) used GPA to map the relationship between sensory
attributes and odor activity values of blackberries. Generalized procrustes analysis is an
intriguing methodology as it acts to scale, rotate, and translate the data for the best fit of each
individual dataset onto a common model (Chung et al., 2003). Ting et al. (2015) used MFA to
link sensory, volatile, and textural datasets to determine apple flavor. In addition, Lignou et al.
(2014) used MFA to analyze the relationship between sensory and instrumental properties of
cantaloupe melons. In accordance with Dehlholm et al. (2012), an MFA is able to combine
multiple quantitative (i.e. PCA) and qualitative (i.e. multiple correspondence analysis) analyses
to allow for the grouping of variables based on their likeness to each other. This is completed by
determining the relationship based on orientations and configurations of each dataset.
With this information, it solidifies the importance of aroma and flavor instrumental
measurements and their contribution to sensory and consumer datasets in order to properly
qualify and quantify specific aromas generated by VOCs as they relate to consumer preference
(Aprea et al., 2017).
2.4 Conclusions and future research
As stated in Section 2.1, the apple industry has recently begun to shift from a traditional
business-to-business approach which was primarily focused on disease resistance and fruit yield,
to now becoming a consumer-centric industry. This was a necessary change within the industry,
as the needs of a consumer do not necessarily align with those of apple growers and breeders
(Tesfaye et al., 2012). Recently, an emphasis has been placed on providing the highest quality
fruit in terms of taste, texture, and aroma/flavor. However, the intricacies of taste and texture
quality have become the forefront of this research, leaving aroma/flavor research to fall behind.
Therefore, the focus of the current research project is to expand on flavor research in apple fruit.
This will allow breeding programs to focus on these flavor quality components in the future to
create and select new apple varieties targeted for the desires of consumers.

22
3 Apple Flavor and Its Effects on Sensory Characteristics and
Consumer Preference
This chapter has been submitted to the Journal of Sensory Studies and adapted for this thesis.
Jordan R. MacKenziea,b, Lisa M. Duizera, Amy J. Bowenb
a Department of Food Science, University of Guelph, Guelph, ON, Canada
b Vineland Research and Innovation Centre, Vineland, ON, Canada
Author MacKenzie conducted the research, analyzed the data, and wrote the manuscript. Author
Duizer reviewed and edited the manuscript. Author Bowen received funding for the project,
oversaw the work, and reviewed and edited the manuscript.
Abstract
The focus within the apple industry is to identify varieties most preferred by consumers.
To help with this, it is necessary to emphasize the discovery of flavor perceptions responsible for
consumer preference in apples. The present study aimed to determine which flavor attributes are
associated with different apple varieties, determine which apple varieties consumers prefer, and
to determine which flavor attributes are contributing to consumer preference. Over two
subsequent years, an expert panel (n=10, n=15) evaluated 27 and 28 varieties, respectively.
Intensity ratings of taste, flavor, and texture characteristics of each apple variety were recorded.
This data was paired with an untrained consumer hedonic evaluation (n=226) using a subset of
apple varieties (n=16). Results revealed that two large groups of apple consumers exist. Group 1
(29%) emphasized the importance of texture, while Group 2 (49%) was primarily driven by
sweet taste, and honey and floral flavors with less focus on texture.
Practical applications
The results of this research provide insight into the positive and negative preference
drivers of apple consumers. By understanding flavors associated with consumer preference, the
information can be used as a tool to aid breeding programs in the creation of consumer-centric
apples that will be commercialized. Additionally, through the creation of an external preference
map, a point-of-reference has been created to serve as a predictor for upcoming apple varieties to
the Ontario apple industry.
Keywords
apple; flavor; descriptive analysis; consumer preference; preference map

23
3.1 Introduction
The primary focus of apple research is on the creation and identification of a high-quality
fruit. Musacchi and Serra (2018) defined two main avenues of quality parameters: 1) Appearance
(color, size, shape, and absence of defects), and 2) Eating quality (taste, texture, flavor, and
absence of defects). Similarly, Sansavini et al. (2004) described apple quality as defined by
appearance, sensory traits, storability, and shelf-life. Consumers are known to select apples based
on their previous experiences in relation to sensory attributes and internal characteristics of the
fruit (Jaeger et al., 2018). However, when looking into the sensory attributes of an apple, the
focus is consistently on producing an appealing taste and texture for the consumer.
Unfortunately, apple flavor is commonly overlooked, and when ideal taste and texture
parameters have been met, it is believed that the inclusion of preferred flavors will help to put
one variety ahead of another in the increasingly competitive apple market (Yahia 1994). In order
to achieve the identification of unique flavor characteristics that will drive the purchasing habits
of a consumer, it is common practice to conduct sensory evaluation techniques such as DA to
measure the intensities of each sensory attribute, while pairing this with measurements of
consumer liking.
Descriptive analysis is the optimal sensory evaluation method for food products as it is
practical for evaluating the perceived intensities of an established lexicon by independently and
objectively assessing each sensory attribute. Data collected from DA can be analyzed using an
analysis of variance (ANOVA) to identify if differences exist among products, such as apple
varieties. Multivariate statistical techniques can also be used. Agglomerative hierarchical
clustering (AHC) outlines the similarities among clusters of the varieties, and PCA define the
relationships of the characteristics of each variety (Aprea et al., 2012; Boumaza et al., 2010;
Bowen et al., 2018; Eggink et al., 2012; Iglesias et al., 2008). Limitations within DA exist. The
functional use of DA is to describe the intensity of the sensory properties of a tested product and
compare them to other products within the set. However, it does not tell you which properties are
most important or associated with consumer acceptance. In order to determine what is driving
the preference of a product, it is essential to pair this with other evaluation methods.

24
Hedonic consumer evaluation allows for the understanding of liking and preference
among tested products. With this approach, untrained consumer panelists taste and rate their
individual liking score for each product evaluated. However, there are also limitations that exist
within consumer evaluation. Differentiating the properties of liked or disliked products can be
challenging, and, without pairing the collected data with DA, there is no way to measure how
much these properties play a role in acceptance.
To optimize our understanding of preference among apples, it is essential to combine the
advantages of trained sensory and untrained consumer evaluations, to ultimately create a tool that
will allow a research team to best understand the sensory and consumer space. Fortunately, the
combination of sensory intensity scores of products with hedonic consumer ratings can be
completed using external preference mapping.
External preference mapping pairs the objective intensity evaluation scores of sensory
attributes with the subjective liking evaluation scores of consumer hedonic ratings to uncover the
true meaning of what is driving the preference within the sensory space for consumers (Lawless
& Heymann, 2010). External preference mapping works by creating regression models to
essentially build a mapping model of the consumer hedonic scores and the sensory space from a
PCA generated from the perceptual sensory product characteristics (van Kleef et al., 2006). This
same approach has been adapted within the apple industry and can be seen in recent literature
from Cliff et al. (2016), and Bowen et al. (2018). The development of the sensory space will
create opportunity for identification of apple varieties tailored to the desires of consumers based
on the newfound understanding of consumer liking. For example, a preference map created by
Bowen et al. (2018) evaluating approximately 80 apples over two years showed a clear
separation of apples with high liking versus low liking. The information from the preference map
was used to predict which sensory characteristics were driving or detracting liking among the
tested apple varieties and served as the forefront of the current research (Bowen et al.,
unpublished).
The current understanding of consumer liking among apples is that the primary indicators
of preference are based on textures (crisp, juicy, and lack of mealy), with the secondary factor
being taste (sweet or acidic). Flavor and appearance are minor indicators; however, they have not
been as extensively researched as the other sensory modalities (Daillant-Spinnler et al., 1996).
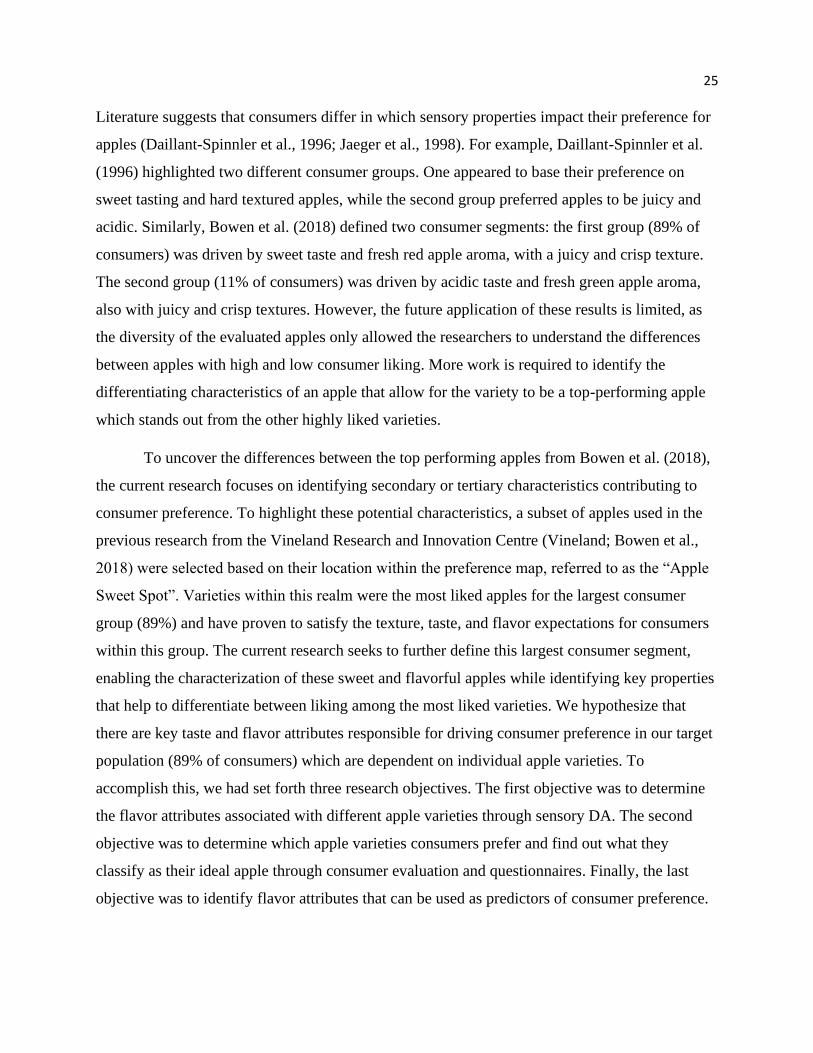
25
Literature suggests that consumers differ in which sensory properties impact their preference for
apples (Daillant-Spinnler et al., 1996; Jaeger et al., 1998). For example, Daillant-Spinnler et al.
(1996) highlighted two different consumer groups. One appeared to base their preference on
sweet tasting and hard textured apples, while the second group preferred apples to be juicy and
acidic. Similarly, Bowen et al. (2018) defined two consumer segments: the first group (89% of
consumers) was driven by sweet taste and fresh red apple aroma, with a juicy and crisp texture.
The second group (11% of consumers) was driven by acidic taste and fresh green apple aroma,
also with juicy and crisp textures. However, the future application of these results is limited, as
the diversity of the evaluated apples only allowed the researchers to understand the differences
between apples with high and low consumer liking. More work is required to identify the
differentiating characteristics of an apple that allow for the variety to be a top-performing apple
which stands out from the other highly liked varieties.
To uncover the differences between the top performing apples from Bowen et al. (2018),
the current research focuses on identifying secondary or tertiary characteristics contributing to
consumer preference. To highlight these potential characteristics, a subset of apples used in the
previous research from the Vineland Research and Innovation Centre (Vineland; Bowen et al.,
2018) were selected based on their location within the preference map, referred to as the “Apple
Sweet Spot”. Varieties within this realm were the most liked apples for the largest consumer
group (89%) and have proven to satisfy the texture, taste, and flavor expectations for consumers
within this group. The current research seeks to further define this largest consumer segment,
enabling the characterization of these sweet and flavorful apples while identifying key properties
that help to differentiate between liking among the most liked varieties. We hypothesize that
there are key taste and flavor attributes responsible for driving consumer preference in our target
population (89% of consumers) which are dependent on individual apple varieties. To
accomplish this, we had set forth three research objectives. The first objective was to determine
the flavor attributes associated with different apple varieties through sensory DA. The second
objective was to determine which apple varieties consumers prefer and find out what they
classify as their ideal apple through consumer evaluation and questionnaires. Finally, the last
objective was to identify flavor attributes that can be used as predictors of consumer preference.

26
3.2 Materials and methods
3.2.1 Products
Apples were sourced from Ontario growers whenever possible through the Ontario Apple
Growers (OAG; St. Catharines, Canada). Apples varieties not grown in Ontario were sourced
from local grocery retail. Inclusion of apple varieties for both years of the study were based on
the representation of varieties with the most Ontario market share, and the top selections from
Canadian breeding programs. Additionally, for Year 1 (2017-2018) of the study, apples were
primarily selected based on previous results of the defined “Apple Sweet Spot,” which identified
apple varieties that are liked by a large segment (89%) of the population (Bowen et al., 2018).
For Year 2 (2018-2019), apple varieties were selected based on a combination of results from
Year 1, and inclusion of additional varieties located in the “Apple Sweet Spot”.
This study collected two years of data to account for seasonal and environmental
differences. This allowed for repeatability measures to be tested across both years and provided
validation of the prediction model created. Results were based on information from 27 apple
varieties in Year 1, and 28 varieties in Year 2 with research being conducted at Vineland. The
majority of apple varieties obtained for this study were coded to anonymize the data and can be
found in Table 3.1.
Upon delivery to Vineland, apples were counted and examined to ensure the absence of
visual defects (e.g. bruising, injury, mold, etc.). They were then placed in plastic storage
containers as a single layer and stored on shelves in a designated apple cooler maintained at 2-
4°C through room cooling (Boyette et al., 1990). Apples were held in storage for a minimum of
seven days prior to any evaluation. This method was applied to allow for the standardization of
the internal ethylene concentration within apples, therefore slowing the maturation process
(Muche, 2016).

27
Table 3.1 Apple varieties selected for analysis across both years. All apples were assessed at
optimal maturity, with select apples being re-profiled if not originally profiled within three
weeks of consumer evaluation.
Profiled by DA Profiled by Consumers Re-profiled by DA†
Year 1
(2017-2018)
Year 2
(2018-2019)
Year 1
(2017-2018)
Year 1
(2017-2018)
Gala Gala Gala 55Cb
Ginger Gold Ginger Gold Granny Smith 60Cb
Granny Smith Granny Smith 55C 63Cb
55Ca 41H 58C 73Cb
56C 55C 60C 74C
58C 58C 61C 75Cb
60Ca 60C 63C 84Cb
61C 61C 70C 85Cb
63Ca 63C 73C 91Cb
64C 64C 74C
65C 65C 75C
68C 68C 84C
70C 70C 85C
73Ca 73C 91C
74C 74C 93C
75Ca 75C
80C 80C
81C 81C
82C 85C
84Ca 87C
85Ca 88C
86C 89C
88C 90C
89C 91C
91Ca 92C
92C 93C
93C 94C
94C
† indicates an apple that was not profiled within three weeks prior to consumer evaluation as we
know properties change through storage, apples were re-profiled by DA to compare the
differences at optimal maturity and at the time of consumer evaluation
C denotes a commercial variety (representing a commercially available variety)
H denotes a heritage variety (representing an older variety that is no longer commercially grown)

28
3.2.2 Maturity determination and apple handling
In order to test apples at their ideal maturity, starch iodine (SI) measurements were
applied in accordance with literature from Cornell University (Blanpied & Silsby, 1992). Apples
were removed 24 hours prior to evaluation to acclimatize to room temperature and then tested for
their current SI index to ensure that all apples were within their optimal range (5-7 SI) for
consumption.
The method used for testing the SI index included first cutting the apples in half through
the equator. One half was dipped into a solution containing 60 parts 0.1 N iodine solution (Fisher
Scientific, USA) and 40 parts milli-Q water (MilliporeSigma, USA) and then placed flesh-up on
a paper towel. To allow the solution to soak into the flesh and the starch pattern to develop,
samples were left for 2-3 minutes prior to maturity determination. This process was completed
upon receipt of apples, once weekly to observe the ongoing maturity status of the apple, and
within 24-hours of consumption.
Once an apple variety was determined to be at its ideal maturity range, apples were
removed from cold storage. To allow for acclimatization of samples, the apples were left at room
temperature (approximately 20°C) for 24-hours prior to any sensory evaluation and consumer
panel analyses.
3.2.3 Trained sensory panel evaluation
Trained sensory panelists were employed as part of an in-house sensory panel at
Vineland. The members of the panel are specialized in the evaluation of a variety of horticultural
products while using numerous sensory evaluation techniques and are well-practiced in DA
(Lawless & Heymann, 2010). Performance monitoring took place weekly to track the accuracy
and reliability of the results. The apple sensory lexicon used for this study was first established in
2013 and carried through for this study (Bowen et al., 2018). Training exercises were routinely
used to assess the sensory acuity of the panelists, focusing on their ability to perceive basic tastes
and mouthfeels (sweet, acid, bitter, astringent), textures (skin thickness, crisp, juicy, chewy,
mealy, rate of melt), and aromas/flavors (oxidized apple, earthy, hay, honey, lemony, floral,
grassy/vegetal, overall aromatic intensity) of this 18-attribute lexicon.

29
In Year 1, 27 apple varieties were profiled using DA in eight 1.5-hour sessions over four
months (October 2017 to January 2018), based on the maturity of each variety, by the trained
sensory panel (n=10, average). In Year 2, 28 apple varieties were profiled using DA in eight 1.5-
hour sessions over four months (October 2018 to January 2019), based on the maturity of each
variety, by a trained sensory panel (n=15, average).
A taste and aroma reference tray containing reference standards was provided to panelists
at the start of each session to help calibrate their senses prior to evaluation. Texture reference
trays were provided at the start of the profiling period in October and again in January for
recalibration of the textural properties. Specific descriptions and ingredient recipes for the taste
and aroma/flavor reference standards can be found in Table 3.2, and texture reference standards
in Table 3.3.
For testing, panelists evaluated the apples in the dedicated sensory tasting room at
Vineland at room temperature in white semi-isolated booths with red lighting to mask any
differences in color or other distinguishing properties of the apple. Panelists were asked to reset
their palate by rinsing their mouth with unfiltered water and/or eating unsalted crackers
(Premium Plus) between samples. Apples were freshly washed and cut prior to evaluation to
avoid oxidation of the apple and to delay disruption of apple volatiles when the apple sample was
cut (Ting et al., 2012). Apples were cut into 6-8 wedges based on size and were presented
monadically to panelists in a clear 2 oz cup in a randomized balanced design with randomized 3-
digit codes. Tastings were conducted by duplicating each variety to test repeatability, with two
wedges (skin-on) per repetition. Intensity ratings for each attribute were evaluated using
EyeQuestion software (Logic8, Netherlands), and used a 15 cm line scale with anchors of
“weak” to “intense”, indented at the 10% and 90% positions respectively.

30
Table 3.2 Basic taste, mouthfeel, and aroma reference tray standards with recipes.
Reference Preparation Method
Sweet 6.0 g sucrose + 400 mL applesauce†
Acid 1.0 g malic acid + 400 mL applesauce†
Bitter 0.10 g caffeine + 400 mL applesauce†
Astringent 0.90 g Kalum (potassium aluminum sulphate dodecahydrate) + 400 mL
applesauce†
Earthy 18 µL earthy (#11)‡ + 400 mL applesauce†
Honey 20 g honey§ + 400 mL applesauce†
Grassy/vegetal ½ pot cat grass + 600 mL filtered water
Soak 30 minutes, filter, + 1 mL ‘Green’ solution¶ + 400 mL filtered
water
Oxidized apple Cut one Red Delicious apple, allowing to oxidize for 30 minutes
Hay 270 µL hay (#38) ‡ + 600 mL filtered water
Floral 10 mL rose water‖ + 800 mL filtered water
Lemony 360 µL lemon extract + 800 mL filtered water
Overall aromatic intensity 40 mL applesauce†
† Mott’s Fruitsations unsweetened applesauce ‡ Le nez du vin “The Masterkit 54 aromas” § BillyBee pure natural pasteurized honey ¶ 500 mL filtered water, 9 µL green pepper (#30)‡ ‖ Cortas rose water
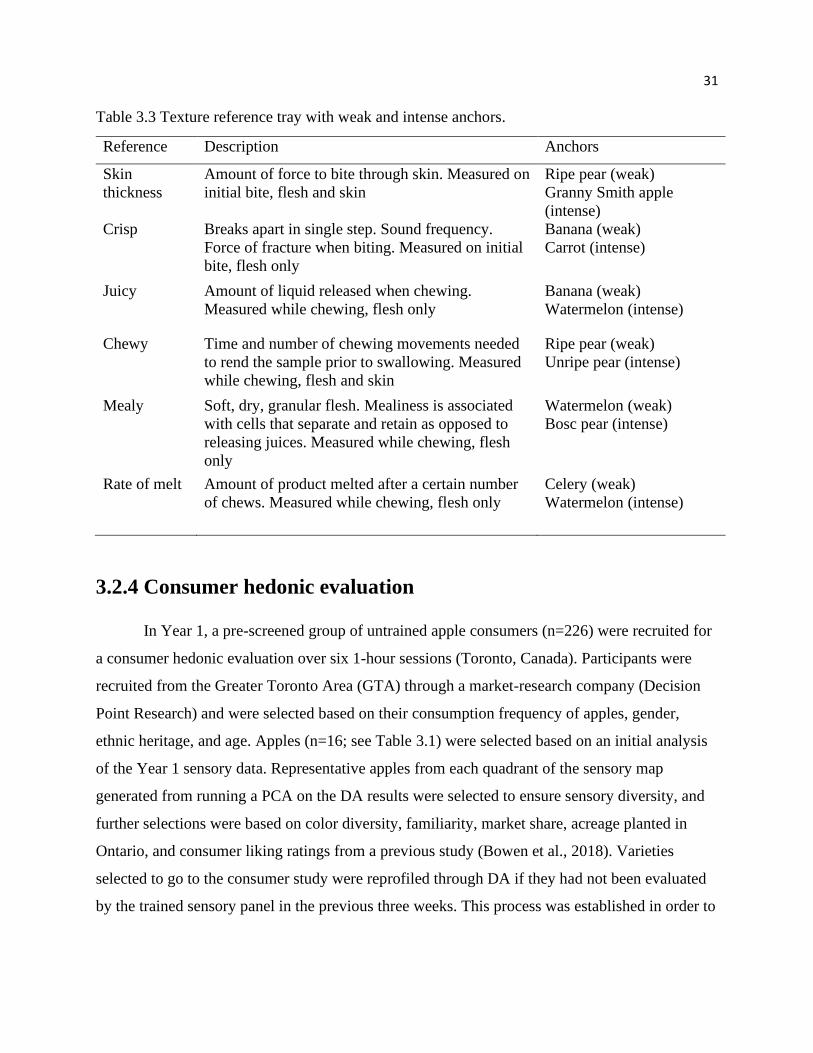
31
Table 3.3 Texture reference tray with weak and intense anchors.
Reference Description Anchors
Skin
thickness
Amount of force to bite through skin. Measured on
initial bite, flesh and skin
Ripe pear (weak)
Granny Smith apple
(intense)
Crisp Breaks apart in single step. Sound frequency.
Force of fracture when biting. Measured on initial
bite, flesh only
Banana (weak)
Carrot (intense)
Juicy Amount of liquid released when chewing.
Measured while chewing, flesh only
Banana (weak)
Watermelon (intense)
Chewy Time and number of chewing movements needed
to rend the sample prior to swallowing. Measured
while chewing, flesh and skin
Ripe pear (weak)
Unripe pear (intense)
Mealy Soft, dry, granular flesh. Mealiness is associated
with cells that separate and retain as opposed to
releasing juices. Measured while chewing, flesh
only
Watermelon (weak)
Bosc pear (intense)
Rate of melt Amount of product melted after a certain number
of chews. Measured while chewing, flesh only
Celery (weak)
Watermelon (intense)
3.2.4 Consumer hedonic evaluation
In Year 1, a pre-screened group of untrained apple consumers (n=226) were recruited for
a consumer hedonic evaluation over six 1-hour sessions (Toronto, Canada). Participants were
recruited from the Greater Toronto Area (GTA) through a market-research company (Decision
Point Research) and were selected based on their consumption frequency of apples, gender,
ethnic heritage, and age. Apples (n=16; see Table 3.1) were selected based on an initial analysis
of the Year 1 sensory data. Representative apples from each quadrant of the sensory map
generated from running a PCA on the DA results were selected to ensure sensory diversity, and
further selections were based on color diversity, familiarity, market share, acreage planted in
Ontario, and consumer liking ratings from a previous study (Bowen et al., 2018). Varieties
selected to go to the consumer study were reprofiled through DA if they had not been evaluated
by the trained sensory panel in the previous three weeks. This process was established in order to

32
capture any changes in sensory characteristics due to the natural variability that comes along
with maturation.
The consumers provided consent to participate in the study and were compensated for
their time (Appendix 1). Each participant was required to complete the following: 1) evaluation
of products based on the degree of liking for each variety with a selection of attributes they
would use to define each variety, 2) to describe their ideal apple, 3) complete a questionnaire
pertaining to demographic, purchase history, and consumption behavior, and finally, 4) a visual
exercise to determine the top and bottom three varieties that a consumer would choose to
purchase, with their reasons why.
For the first exercise, results were recorded using an iPad (Apple, USA) running
EyeQuestion (Logic8, NL) data collection software. Consumers were separated into pre-
numbered semi-isolated booths. Study conditions were conducted at room temperature, and
samples were evaluated blind under fluorescent commercial lighting.
Prior to tasting, apples were freshly washed and cut into 6-8 wedges based on size. One
wedge (skin-on) was placed in a clear 2 oz plastic cup labelled with a unique randomized 3-digit
code following a randomized balanced design made up of four sets of four products in each.
Upon tasting, panelists were instructed to monadically evaluate samples from left to right. They
were then asked to bite into the apple wedge and consume both skin and flesh of the apple. Two
questions were asked: 1) “How much do you like this apple?” and 2) “Check off all of the
attributes that describe this apple” (Appendix 2). To answer the first question, a 15 cm
continuous line-scale was provided with indented anchors of "dislike extremely" to "like
extremely" placed at 10% and 90% of the scale, respectively. Results of this testing were
automatically converted to a score out of 100, through the EyeQuestion (Logic8, NL) software.
The first sample served to each panelist was a Red Delicious apple which, unknowingly to the
panelist, served as a practice sample to avoid bias by an order effect (Wakeling & MacFie,
1995). Results of this apple were removed from the final consumer data analysis. Once each
apple sample was finished, panelists were asked to rinse their palates with filtered water and/or
eat an unsalted cracker before moving to the next sample.

33
Following the hedonic evaluation, participants were required to answer a questionnaire
regarding their consumption behavior, purchase habits, and demographic information (Appendix
3). Before exiting the evaluation room, a booth was setup containing each of the 16 apple
varieties. The apples displayed were selected to be free of blemishes and bruises, and uniform in
size. Each variety was placed on a white plate and labeled with a randomized 3-digit code and
consumers were asked to identify their three most and least liked apples based only on
appearance. The specific evaluation terms and instructions can be found in Appendix 4.
3.2.5 Statistical analysis
A 3-way mixed model ANOVA with 2-way interactions was conducted on the dataset
from DA. Qualitative variables of assessor, product, and replicate were paired with quantitative
variables, our sensory attribute intensities. A Tukey’s Honestly Significant Difference test and
Fisher’s Least Square Difference test were used for post-hoc analyses. In Year 1, there were no
violations of the test assumptions for the homogeneity of variance (Levene’s k-sample
comparison of variances). However, in Year 2, four attributes of the 18 violated these
assumptions and were subsequently subjected to a 1-way ANOVA using the Welch statistic and
Games-Howell post-hoc analysis. Following this, attribute intensity scores were averaged and
used to run a PCA with a covariance structure (n-1). This helped to create a sensory map, and
using factor analysis (FA), four and three factors for Years 1 and 2 respectively, were used to
explain the model. Agglomerative hierarchical clustering was then used to cluster the sensory
profiles of 27 (Year 1) and 28 (Year 2) apple varieties using Ward’s method of agglomeration
based on their dissimilarities. The PCA and AHC models created from sensory evaluation data
were used to define the sensory diversity of the apple set and identify similarly grouped apples,
information that was used for the selection of apples to be used for the consumer evaluation.
Consumer evaluation was conducted in Year 1 of the experiment only. A 1-way ANOVA
was used with Games-Howell post-hoc analysis and Welch statistic to differentiate the
differences of liking among products. Next, an AHC using Euclidean distance and Ward’s
method of agglomeration was used to determine that three consumer groups existed. Following
this, the ANOVA procedure as listed above was repeated on each of the three consumer groups.
Here, Groups 1 and 2 needed to be transformed as they had heterogeneous variances, while the
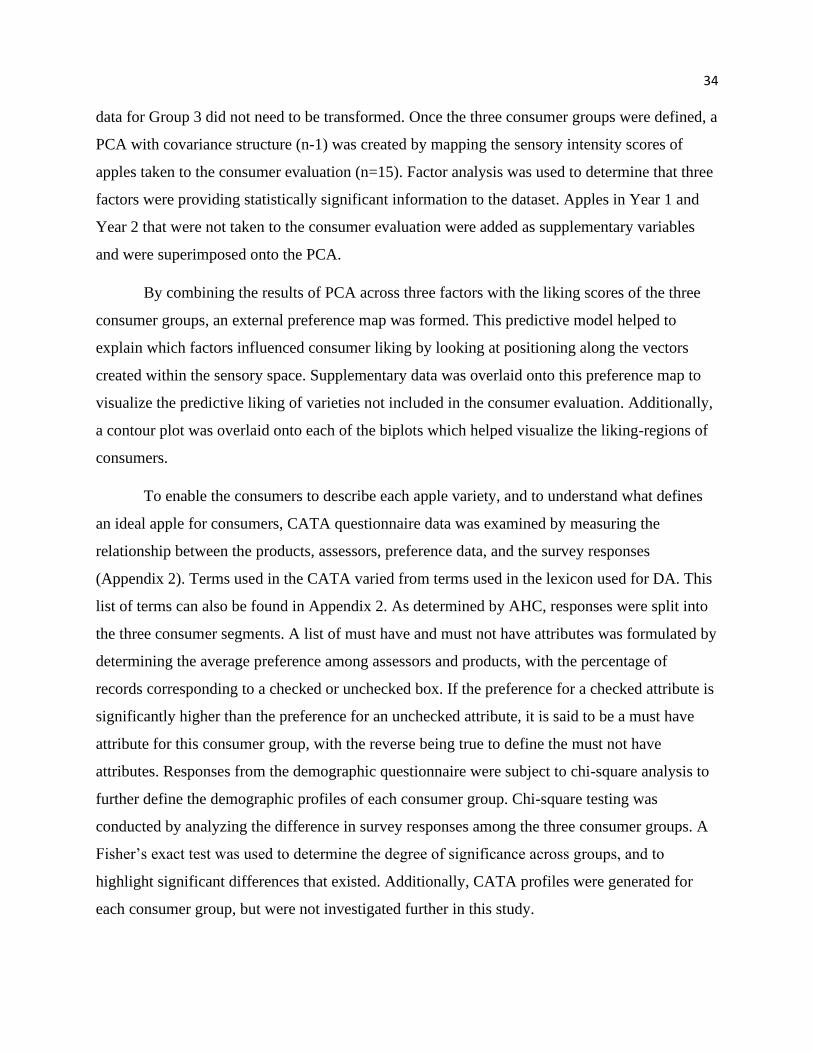
34
data for Group 3 did not need to be transformed. Once the three consumer groups were defined, a
PCA with covariance structure (n-1) was created by mapping the sensory intensity scores of
apples taken to the consumer evaluation (n=15). Factor analysis was used to determine that three
factors were providing statistically significant information to the dataset. Apples in Year 1 and
Year 2 that were not taken to the consumer evaluation were added as supplementary variables
and were superimposed onto the PCA.
By combining the results of PCA across three factors with the liking scores of the three
consumer groups, an external preference map was formed. This predictive model helped to
explain which factors influenced consumer liking by looking at positioning along the vectors
created within the sensory space. Supplementary data was overlaid onto this preference map to
visualize the predictive liking of varieties not included in the consumer evaluation. Additionally,
a contour plot was overlaid onto each of the biplots which helped visualize the liking-regions of
consumers.
To enable the consumers to describe each apple variety, and to understand what defines
an ideal apple for consumers, CATA questionnaire data was examined by measuring the
relationship between the products, assessors, preference data, and the survey responses
(Appendix 2). Terms used in the CATA varied from terms used in the lexicon used for DA. This
list of terms can also be found in Appendix 2. As determined by AHC, responses were split into
the three consumer segments. A list of must have and must not have attributes was formulated by
determining the average preference among assessors and products, with the percentage of
records corresponding to a checked or unchecked box. If the preference for a checked attribute is
significantly higher than the preference for an unchecked attribute, it is said to be a must have
attribute for this consumer group, with the reverse being true to define the must not have
attributes. Responses from the demographic questionnaire were subject to chi-square analysis to
further define the demographic profiles of each consumer group. Chi-square testing was
conducted by analyzing the difference in survey responses among the three consumer groups. A
Fisher’s exact test was used to determine the degree of significance across groups, and to
highlight significant differences that existed. Additionally, CATA profiles were generated for
each consumer group, but were not investigated further in this study.

35
Visual evaluation results were evaluated using a total unduplicated reach and frequency
(TURF) analysis to determine the percentage of reach for each variety and descriptor, and k-
proportion analysis to determine the percentage that a variety would be accepted based on visual
appearance alone. In this section, “reach” was defined as the apples that are most selected
(positively or negatively) by the consumer groups, and “frequency” represents how many times
an apple variety was selected as most likely to be purchased in comparison to the total amount of
times selected (most or least likely to purchase). The visual evaluation was divided into the three
previously defined consumer groups. The full list of questions from the questionnaire can be
found in Appendix 4.
Data analysis was conducted using XLStat versions 2018 and 2019 (Addinsoft, France).
A significance level of 5% was used, with the exception of 10% significance used for the
analysis of chi-square responses.
3.3 Results
3.3.1 Descriptive analysis
Significant product effects (p≤0.001) occurred across both product sets for all attributes
(oxidized apple, earthy, hay, honey, floral, grassy/vegetal, lemony, and overall aromatic intensity
aromas/flavors; sweet, acid, bitter, and astringent tastes and mouthfeels; and skin thickness,
crisp, juicy, chewy, mealy, and rate of melt textures) in both years, with the exception of hay in
Year 2 (p=0.100). Thus, hay aroma was not used for further analysis in Year 2. The mean values
for each attribute are listed in Table 3.4.

36
Table 3.4 Mean intensity scores (0-100) from a 15 cm line scale, standard deviations and level of
significance when comparing product effects across individual apple varieties for sensory
attributes in Year 1 and Year 2 sensory evaluation.
Sensory attribute Year 1 Year 2
Mean ±
Standard
deviation
p-value f-statistic Mean ±
Standard
deviation
p-value f-statistic
Oxidized apple 22.1 ± 16.79 <0.0001 4.3 25.7 ± 13.36 0.001 2.2
Earthy 12.5 ± 14.47 <0.0001 3.6 20.0 ± 12.20 <0.0001 3.4
Hay 23.0 ± 14.86 0.001 2.0 25.3 ± 11.34 0.100* 1.4
Honey 20.5 ± 18.95 <0.0001 5.0 25.0 ± 15.89 <0.0001 8.1
Lemony 15.7 ± 14.35 <0.0001 4.8 19.6 ± 12.81 <0.0001 5.3
Floral 18.7 ± 17.40 <0.0001 2.6 19.5 ± 13.66 <0.0001 4.3
Grassy/vegetal 18.1 ± 15.42 <0.0001 2.6 19.7 ± 10.82 <0.0001 3.3
Overall aromatic
intensity
26.3 ± 14.39 <0.0001 2.7 27.8 ± 10.95 <0.0001 4.1
Sweet 34.9 ± 16.35 <0.0001 7.2 32.3 ± 12.48 <0.0001 5.8
Acid 29.5 ± 16.70 <0.0001 10.8 28.7 ± 14.31 <0.0001 15.3
Bitter 19.0 ± 16.91 <0.0001 2.6 19.1 ± 10.60 <0.0001 6.4
Astringent 25.8 ± 17.20 <0.0001 3.3 25.7 ± 12.01 <0.0001 5.4
Skin thickness 56.6 ± 19.52 <0.0001 8.3 55.2 ± 18.25 <0.0001 8.9
Crisp 59.9 ± 17.55 <0.0001 15.4 51.5 ± 19.17 <0.0001 56.1
Juicy 54.1 ± 16.82 <0.0001 5.0 50.4 ± 17.45 <0.0001 15.7
Chewy 62.6 ± 16.29 <0.0001 5.1 60.8 ± 15.51 <0.0001 5.0
Mealy 18.1 ± 17.59 <0.0001 3.4 29.0 ± 20.08 <0.0001 7.1
Rate of melt 53.3 ± 19.58 <0.0001 5.2 57.2 ± 19.44 <0.0001 15.5
* indicates a product effect that was not significant at p<0.05

37
3.3.2 Creating a sensory map and formation of apple groupings
A sensory map was created using average intensity ratings for each attribute from DA.
The procedures for this section varied, and will therefore be written as Year 1, followed by Year
2.
In Year 1, an initial PCA was run on the full dataset. Kaiser-Meyer-Olkin (KMO) scores
indicating the level of sampling adequacy were observed. To obtain an accurate representation of
our sensory map, a cut-off of 0.50 KMO score was applied to sensory attributes, while the entire
model had a minimum KMO score of 0.70. Both threshold values were used in accordance with
Mooi and Sarstedt (2011), outlining the acceptable tolerance levels for sampling adequacy.
Using this approach, earthy flavor (KMO=0.38) was removed from our dataset as the KMO
value did not reach the specified threshold. This allowed the KMO value of the dataset to be
0.71. As discussed in Section 3.2.5, FA was used within the Statistical Package for the Social
Sciences software (2018, 2019; IBM, USA) to identify four factors correlating with the 17
remaining sensory attributes. A secondary PCA with a varimax rotation was used to reorient all
17 attributes to a correlated factor, explaining 84.8% of the total variation within the projected
model. Factor 1 (22.8% of variation) was positively correlated with acid, lemony, astringent,
grassy/vegetal, and bitter. Factor 2 (29.8% of variation) was positively correlated with mealy,
skin thickness, oxidized apple, and negatively correlated with crisp, and juicy. Factor 3 (15.8%
of variation) was positively correlated with chewy, and negatively correlated with rate of melt.
Factor 4 (16.3% of variation) was positively correlated with honey, overall aromatic intensity,
floral, sweet, and hay. A full summary of these correlations can be found in Table 3.5 and a
depiction of the factors related to flavor (Factor 1 and Factor 4) are shown in Figure 3.1.

38
Table 3.5 Year 1: Summary of correlations for sensory evaluation PCA.
Sensory attribute Factor 1
(22.8%)
Factor 2
(29.8%)
Factor 3
(15.8%)
Factor 4
(16.3%)
Oxidized apple 0.164 0.676 -0.218 0.378
Hay 0.077 0.026 0.125 0.698
Honey -0.433 -0.198 0.006 0.839
Lemony 0.916 -0.114 -0.013 0.052
Floral -0.307 -0.077 -0.178 0.766
Grassy/vegetal 0.708 0.064 0.218 -0.116
Overall aromatic intensity 0.287 0.325 -0.046 0.793
Sweet -0.553 -0.176 -0.155 0.742
Acid 0.926 0.040 0.047 -0.234
Bitter 0.632 0.348 0.041 -0.224
Astringent 0.725 0.260 0.249 0.106
Skin thickness 0.262 0.725 0.384 -0.399
Crisp -0.053 -0.937 0.285 0.076
Juicy 0.209 -0.750 -0.306 -0.071
Chewy 0.244 0.223 0.858 -0.157
Mealy 0.311 0.851 -0.001 -0.072
Rate of melt -0.137 0.277 -0.899 -0.083
Values in bold denote a strong correlation (r>0.6 when rounded to one decimal place)

39
Figure 3.1 PCA generated from sensory DA data in Year 1. This image is depicting Factors 1
(22.8%) and 4 (16.3%) for a total variation of 39.2%, as these are the factors related to apple
flavor.
Results from the Year 1 AHC showed that four groupings of apple varieties existed
within the dataset. To help differentiate the characteristics of these groups, the class centroids
(representing the projected means for each group) were collected and superimposed onto the
PCA as supplementary data. Apple varieties represented by Group A (n=8) were described as
having the highest rate of melt with a non-chewy texture. They also had low levels of lemony
and grassy/vegetal aromas, low acid, bitter and astringent tastes or mouthfeels. Varieties in
Group B (n=10) had the most balanced profiles as these varieties were highly perceived as
chewy apples with a low rate of melt. Apples in Group C (n=5) were described as having the
highest oxidized apple aroma, skin thickness and mealiness and were also found to be low in
crisp and juicy textures. Finally, apples in Group D (n=5) identified with having the lowest levels

40
of hay, honey, floral, and overall aromatic intensity aromas, as well as sweetness. Varieties in
Group D were also highest in lemony and grassy/vegetal aromas, and acid, bitter, and astringent
tastes or mouthfeels.
A sensory map for Year 2 of the study was conducted using the same procedure as Year
1. However, low KMO scores resulted in the removal of lemony (KMO=0.42), and when
retested, earthy (KMO=0.52), oxidized apple (KMO=0.48), rate of melt (KMO=0.45), mealy
(KMO=0.51), and crisp (KMO=0.41). This allowed for the KMO of the dataset to be above our
threshold at 0.73. The final PCA was therefore evaluating 11 of the 17 remaining attributes.
In Year 2, a FA identified three factors providing statistically significant information.
These factors described 86.9% of the total variation within our model, while correlating to the
remaining 11 sensory attributes. Factor 1 (49.1% of variation) was positively correlated with skin
thickness, chewy, acid, bitter, astringent, and grassy/vegetal, while being negatively correlated
with sweet, honey, and floral. Factor 2 (25.1% of variation) was positively correlated with juicy,
acid, and astringent. Factor 3 (12.6% of variation) was positively correlated with overall
aromatic intensity and chewy. A full summary of these correlations can be found in Table 3.4
and depiction of the factors related to flavor (Factor 1 and Factor 2) are shown in Figure 3.2.
Next, an AHC was conducted following the same parameters as Year 1. These results
identified four groups of apples that existed based on dissimilarity. These groups were
superimposed onto the sensory map formed by the PCA. Group A (n=10) was defined by
varieties high in honey, overall aromatic intensity, floral, and sweetness but were low in
astringent and acid. Group B (n=9) was defined by being high in juicy, with otherwise very
balanced attributes (having middling attribute intensities). Group C (n=4) was defined by being
low in sweet, honey, and juicy, with high skin thickness, acid, astringent, and chewy. Group D
(n=4) was defined by low overall aromatic intensity, floral, and acid.

41
Figure 3.2 PCA generated from sensory DA data in Year 2. This image is depicting Factors 1
(49.1%) and 4 (25.1%) for a total variation of 74.2%, as these are the factors related to apple
flavor.
3.3.3 Consumer evaluation
The initial ANOVA on the whole consumer dataset proved that the liking among
products was statistically significant (p<0.05). Heterogeneity was seen across liking for each
variety (p<0.0001) from the Levene’s test with a non-normal distribution. To avoid generalities,
and as stated in Section 3.3.2, consumer segmentation was applied to the dataset to enable a
more specific understanding of preference.
3.3.4 Defining consumer groups and mapping sensory properties
Results of the AHC identified three consumer segments from our initial group (n=226):
Group 1 (n=65) represented 28.9% of the population, Group 2 (n=110) was the largest of the

42
groups representing 48.7% of the tested population, and Group 3 (n=51) represented 22.6% of
the population. All three groups were not normally distributed (Groups 1 and 2: p<0.0001,
Group 3: p<0.001). Groups 1 and 2 were found to have heterogeneous variances (Group 1:
p=0.004, Group 2: p<0.0001) while Group 3 had homogeneous variances (p=0.146). Results of
the 1-way ANOVA conducted on each group found that Group 1 had a distribution of liking
scores ranging from 47.6 to 76.5 out of a possible 100. Similarly, liking scores of Group 2
ranged from 23.5 to 73.5 and results of Group 3 showed a very limited range of liking scores
spanning from 39.2 to 54.9. A summary of these liking scores can be seen in Table 3.6. Next, a
sensory map was created using the sensory intensity ratings from the sub-set of 15 apple varieties
taken to the consumer evaluation. Note that earthy was removed from this list of attributes, as it
was a non-significant contributor in the previous statistical analysis. Supplementary observations
were included and contained the remaining 21 apple varieties included in the original analysis,
with nine varieties that were profiled two times: once at ideal maturity, and once prior to
consumer evaluation (See Table 3.1).
Astringent, lemony, hay, and overall aromatic intensity did not provide significant
information, and resultantly an oblimin rotation with Kaiser normalization was used to reorient
the dataset to successfully have 15 of the 17 remaining attributes correlating to a factor. Hay and
overall aromatic intensity were the exceptions in this case as the correlations to a factor did not
exceed 0.6 when rounding to the nearest tenth. Results of the PCA showed that 82.4% of the
variability was captured within the model. Factor 1 represented 41.8% of the variability and was
primarily defined by acid, sweet, honey, grassy/vegetal, bitter, lemony, floral, astringent, and
chewy. Factor 2 represented 28.1% of the variability defined by juicy, skin thickness, crisp, and
mealy. Factor 3 represented 12.5% of the variability and was composed of rate of melt, oxidized
apple, and crisp. Correlations for each factor can be found in Table 3.7.

43
Table 3.6 Mean liking scores by each consumer group for apples evaluated in Year 1.
Apple variety
Group 1
(n=65; 29%)
Group 2
(n=110; 49%)
Group 3
(n=51, 22%)
Gala 70.0 58.6 43.4
Granny Smith 59.2 34.7 45.8
55C 71.3 73.4 45.9
58C 76.5 67.2 54.9
60C 76.2 62.3 51.3
61C 65.9 39.5 45.0
63C 47.6 23.5 43.7
70C 71.5 52.1 43.0
73C 72.9 64.3 41.9
74C 73.2 40.2 50.4
75C 62.7 45.7 50.2
84C 68.1 48.6 40.6
85C 64.8 51.7 42.2
91C 66.6 34.3 49.8
93C 70.0 52.2 39.2
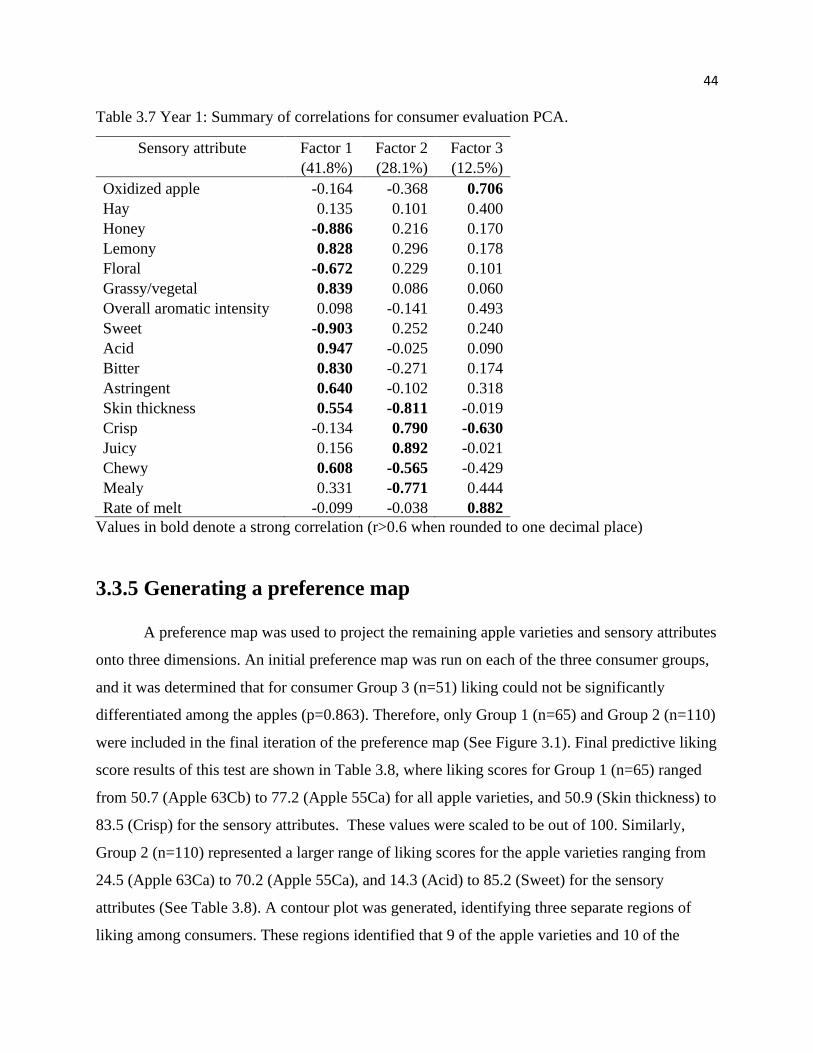
44
Table 3.7 Year 1: Summary of correlations for consumer evaluation PCA.
Sensory attribute Factor 1 Factor 2 Factor 3
(41.8%) (28.1%) (12.5%)
Oxidized apple -0.164 -0.368 0.706
Hay 0.135 0.101 0.400
Honey -0.886 0.216 0.170
Lemony 0.828 0.296 0.178
Floral -0.672 0.229 0.101
Grassy/vegetal 0.839 0.086 0.060
Overall aromatic intensity 0.098 -0.141 0.493
Sweet -0.903 0.252 0.240
Acid 0.947 -0.025 0.090
Bitter 0.830 -0.271 0.174
Astringent 0.640 -0.102 0.318
Skin thickness 0.554 -0.811 -0.019
Crisp -0.134 0.790 -0.630
Juicy 0.156 0.892 -0.021
Chewy 0.608 -0.565 -0.429
Mealy 0.331 -0.771 0.444
Rate of melt -0.099 -0.038 0.882
Values in bold denote a strong correlation (r>0.6 when rounded to one decimal place)
3.3.5 Generating a preference map
A preference map was used to project the remaining apple varieties and sensory attributes
onto three dimensions. An initial preference map was run on each of the three consumer groups,
and it was determined that for consumer Group 3 (n=51) liking could not be significantly
differentiated among the apples (p=0.863). Therefore, only Group 1 (n=65) and Group 2 (n=110)
were included in the final iteration of the preference map (See Figure 3.1). Final predictive liking
score results of this test are shown in Table 3.8, where liking scores for Group 1 (n=65) ranged
from 50.7 (Apple 63Cb) to 77.2 (Apple 55Ca) for all apple varieties, and 50.9 (Skin thickness) to
83.5 (Crisp) for the sensory attributes. These values were scaled to be out of 100. Similarly,
Group 2 (n=110) represented a larger range of liking scores for the apple varieties ranging from
24.5 (Apple 63Ca) to 70.2 (Apple 55Ca), and 14.3 (Acid) to 85.2 (Sweet) for the sensory
attributes (See Table 3.8). A contour plot was generated, identifying three separate regions of
liking among consumers. These regions identified that 9 of the apple varieties and 10 of the

45
sensory attributes were predicted to satisfy 0-20% of the consumers when compared to an
average apple, 6 apple varieties and 2 sensory attributes satisfied 40-60% of consumers, and 20
apple varieties with 5 sensory attributes satisfied 80-100% of the consumers. This breakdown of
the contour plots can be found in Table 3.9, with a figure of the preference map with contour
plots overlaid in Figures 3.3, 3.4, and 3.5.
Table 3.8 Predicted liking scores for Years 1 and 2 of both apple varieties and sensory attributes
based on DA and consumer evaluation results.
Apple variety/Sensory
attribute
Predicted liking scores of
Group 1
Predicted liking scores of
Group 2
Gala 69.5 53.1
Ginger Gold 72.4 56.3
Granny Smith 60.2 29.8
55Ca 77.2 70.2
55Cb 73.7 67.9
56C 61.3 45.5
58C 73.3 67.5
60Ca 74.4 61.8
60Cb 73.6 57.4
61C 61.8 33.7
63Ca 52.0 24.5
63Cb 50.7 27.2
64C 68.4 50.3
65C 69.4 53.9
68C 76.2 64.6
70C 73.6 57.5
73C 73.0 60.2
74Ca 72.6 47.3
74Cb 70.6 45.7
75Ca 59.1 35.9
75Cb 59.6 45.1
80C 73.8 54.7
81C 74.4 57.4
82C 75.0 59.1
84Ca 71.1 54.0
84Cb 69.0 57.7
85Ca 73.0 54.8
85Cb 65.8 53.1
86C 67.5 40.1
88C 66.5 48.9

46
Table 3.8 Continued.
Apple variety/Sensory
attribute
Predicted liking scores of
Group 1
Predicted liking scores of
Group 2
89C 65.9 56.5
91Ca 70.1 42.8
91Cb 67.9 36.9
92C 61.5 25.8
93C 74.0 55.5
94C 73.8 50.8
Acid 53.9 14.3
Overall aromatic intensity 61.1 44.7
Astringent 55.5 25.0
Bitter 52.0 16.8
Chewy 56.1 23.5
Crisp 83.5 61.4
Floral 78.8 76.5
Grassy/vegetal 56.9 19.2
Hay 64.1 45.2
Honey 81.1 84.4
Juicy 76.2 50.7
Lemony 58.6 21.0
Mealy 51.0 31.4
Oxidized apple 60.4 52.5
Rate of melt 62.1 52.4
Skin thickness 50.9 23.2
Sweet 81.2 85.2

47
Table 3.9 Estimation of consumer satisfaction for both apple varieties and sensory attributes
when compared to an average apple, based on contour plot analysis.
0-20% satisfaction 40-60% satisfaction 80-100% satisfaction
Granny Smith 74Ca Gala
56C 74Cb Ginger Gold
61C 85Cb 55Ca
63Ca 89C 55Cb
63Cb 91Ca 58C
75Ca 91Cb 60Ca
75Cb Oxidized apple 60Cb
86C Rate of melt 64C
88C 65C
92C 68C
Acid 70C
Overall aromatic intensity 73C
Astringent 80C
Bitter 81C
Chewy 82C
Grassy/vegetal 84Ca
Hay 84Cb
Lemony 85Ca
Mealy 93C
Skin thickness 94C
Crisp
Floral
Honey
Juicy
Sweet

48
Figure 3.3 Preference map conducted on Year 1 sensory DA data (PCA) and consumer hedonic
scores. This figure represents Factor 1 (D1, x-axis) and Factor 2 (D2, y-axis), with contour plot
overlaid (Red = 80-100% satisfaction, Green = 40-60% satisfaction, Blue = 0-20% satisfaction).
Factor 1 is represented by lemony, grassy/vegetal, acid, bitter, astringent, skin thickness, and
chewy in the positive direction, and honey, floral, and sweet in the negative direction. Factor 2 is
represented by crisp and juicy in the positive direction, and skin thickness, chewy, and mealy in
the negative direction.

49
Figure 3.4 Preference map conducted on Year 1 sensory DA data (PCA) and consumer hedonic
scores. This figure represents Factor 1 (D1, x-axis) and Factor 3 (D3, y-axis), with contour plot
overlaid (Red = 80-100% satisfaction, Green = 40-60% satisfaction, Blue = 0-20% satisfaction).
Factor 1 is represented by lemony, grassy/vegetal, acid, bitter, astringent, skin thickness, and
chewy in the positive direction, and honey, floral, and sweet in the negative direction. Factor 3 is
represented by oxidized apple and rate of melt in the positive direction, and crisp in the negative
direction.

50
Figure 3.5 Preference map conducted on Year 1 sensory DA data (PCA) and consumer hedonic
scores. This figure represents Factor 2 (D2, x-axis) and Factor 3 (D3, y-axis), with contour plot
overlaid (Red = 80-100% satisfaction, Green = 40-60% satisfaction, Blue = 0-20% satisfaction).
Factor 2 is represented by crisp, and juicy in the positive direction, and skin thickness, chewy,
and mealy in the negative direction. Factor 3 is represented by oxidized apple and rate of melt in
the positive direction, and crisp in the negative direction.
3.3.6 Understanding an ideal apple
Results of the CATA questionnaire, where consumers were asked to describe and define
their ideal apple, are as follows:
Consumer Group 1 (n=65) showed significant differences between their liking of apples
(p<0.0001), as well as all sensory attributes (p<0.001). A sensory map indicating preference was
created using a two-factor PCA. A cumulative variability of 81.2% was represented by Factor 1

51
(57.0% of variability), and Factor 2 (24.2% of variability). Results indicated that an ideal apple
for Group 1 must have the CATA terms of thin skin with a sweet, crisp, juicy, or aromatic profile
and must not have thick skin or a sour taste.
Consumer Group 2 (n=110) showed significant differences between their liking of apples
(p<0.0001), as well as all sensory attributes (p≤0.0001). A sensory map indicating preference
was created using a two-factor PCA. A cumulative variability of 85.2% was represented by
Factor 1 (70.2% of variability), and Factor 2 (15.0% of variability). An ideal apple for Group 2
must have the CATA terms of thin skin with a sweet, flavorful, juicy, or crisp profile and must
not have thick skin or a sour taste. Additionally, a strong correlation was found for liking in
Group 2 with sweet taste (r=0.591), showing that liking among this group is heavily driven by
sweetness.
Consumer Group 3 (n=51) showed significant differences between their liking of apples
(p<0.0001), as well as all sensory attributes (p≤0.0001), with the exception of aromatic
(p=0.212), and off-flavor (p=0.689) attributes, meaning that aromatic and off-flavor were not
helping the panelists to discriminate the products. A sensory map indicating preference was
created using a two-factor PCA. A cumulative variability of 76.2% was represented by Factor 1
(44.0% of variability), and Factor 2 (32.3% of variability). An ideal apple for Group 3 must have
the CATA terms of thin skin with a flavorful, sweet, juicy, and crisp characteristics and must not
have thick skin or bland or sour characteristics.
3.3.7 Demographics, purchase behavior, and consumption habits
Demographic results from the chi-square for Group 1 showed significant differences
(p<0.10). This group typically had no children less than 19 years of age (p=0.05) and did not
have two or more children (p=0.10). This group was less likely to be Chinese (p=0.05) and were
more likely to be born in Canada (p=0.10) than not (p=0.05). From an education standpoint, this
group was less likely to have a bachelor’s degree (p=0.10). Consumers in this group were more
likely to have purchased Granny Smith apples (p=0.05) within the past 12 months. When
purchasing apples, this group did not typically purchase for everyone in their family equally
(p=0.05).

52
Group 2 chi-square results showed that these members do not have zero children (p=0.10)
and typically had one child less than 19 years of age (p=0.05).This group was less likely to be
Canadian (p=0.05), and more likely to be Chinese (p=0.05). Consumers in this group were more
likely to not be born in Canada (p=0.05) and more likely to have a bachelor’s degree (p=0.05).
This group was more likely to have purchased apple 58C (p=0.05), and less likely to have
purchased Granny Smith (p=0.05) within the past 12 months. Members of Group 2 were more
likely to equally purchase for everyone in their family, and not just for themselves (p=0.05).
Factors that impact the purchasing of apples for consumers in Group 2 were: no external damage,
being firm, skin color, and familiarity (p=0.10).
Individuals in Group 3 showed a significantly different response. They typically had two
or more children less than 19 years of age (p=0.10). Consumers in this group were more likely
to come from Canadian heritage (p=0.05), and less likely from East/South East Asian (p=0.05) or
other backgrounds (p=0.05). Additionally, these consumers were more likely to select that they
were born in Canada (p=0.05). This group was less likely to have a graduate degree (p=0.05).
Within this group, the consumers did not purchase apple 58C (p=0.05), or Gala (p=0.10) within
the past 12 months. Data does not reveal whom individuals in this group purchase apples for but
did identify that no external damage, firmness, skin color, and familiarity were not as important
when making their purchasing decisions in comparison to the other two consumer groups
(p=0.10).
3.3.8 Visual evaluation
The visual evaluation test mentioned in Section 3.2.4 compared apples that consumers
would be most likely to purchase versus apples they would be least likely to purchase based
solely on appearance, represented in terms of reach and frequency (See Table 3.10). In addition,
participants were asked to list their three reasons driving their decisions for both most and least
likely to purchase apples. Consistencies existed across each of the three groups, wherein
consumers were more likely to purchase apples that appear healthy, red, vibrant, and familiar. On
the contrary, consumers in each group were less likely to purchase apples that appeared
unhealthy or irregularly shaped (See Table 3.10).

53
Table 3.10 A comparison of reach and frequency for apple varieties used in the apple consumer
visual evaluation.
Apple variety Color† Group 1 Group 2 Group 3
Reach Frequency Reach Frequency Reach Frequency
Gala Red 35.9% 96.8% 42.1% 84.4% 25.5% 72.2%
Granny Smith Green 39.1% 74.3% 25.2% 59.6% 37.3% 50.0%
55Cb Yellow 9.4% 18.5% 9.3% 9.1% 2.0% 25.0%
58C Red 10.9% 12.5% 15.0% 46.5% 5.9% 50.0%
60Ca Red 28.1% 77.8% 9.3% 41.7% 21.6% 35.7%
61C Red 17.2% 78.9% 23.4% 80.0% 29.4% 66.7%
63Cb Red 10.9% 14.3% 6.5% 25.0% 15.7% 28.6%
65C Red 26.6% 73.9% 24.3% 61.3% 17.6% 80.0%
70C Red 25.0% 84.2% 21.5% 55.6% 11.8% 37.5%
73C Red 7.8% 34.8% 14.0% 45.5% 17.6% 46.2%
74Cb Red 14.1% 65.0% 17.8% 26.8% 17.6% 65.0%
75Cb Red 12.5% 80.0% 25.2% 79.2% 25.5% 56.5%
84Cb Yellow 12.5% 23.5% 15.9% 50.0% 17.6% 28.0%
85Cb Yellow 10.9% 28.1% 9.3% 24.4% 9.8% 27.3%
91Cb Red 26.6% 53.3% 27.1% 92.3% 31.4% 94.7%
93C‡ Red 12.5% 11.8% 14.0% 55.9% 13.7% 43.8% † Indicates the primary color of the apple
‡ Indicates a non-commercialized variety, involved in an active breeding program
To summarize these findings, Group 1 rated Granny Smith (a popular green apple) as the
variety with the highest reach (39.1%), with a frequency of 74.3% of these selections being most
likely to purchase this apple. This is consistent with results in Section 3.3.7, showing that
members of Group 1 had purchased Granny Smith apples in the past 12 months. Gala (a popular
red apple) had a high reach (35.9%) with the highest frequency of 96.8% of those being likely to
purchase this apple. Other notable results include a 12.5% reach for Apple 93C (a red apple, still
in a breeding program), with the lowest likelihood of purchase at 11.8%. Apple 73C (a popular
red apple, newer to commercialization) had the lowest reach of the group with 7.8%, and Apple
55Cb (a yellow apple, not commonly marketed) which was the most preferred apple in this group
only had a reach of 9.4% and a frequency of 18.5% of these consumers who are likely to
purchase this variety. The familiarity of varieties, as shown by Granny Smith and Gala, appeared
to drive the overall reach of the product, however, because Gala is a red apple, it scored a higher
frequency of being purchased.

54
In Group 2, Gala had the highest reach of 42.1%, with a high likelihood of purchase at a
frequency of 84.4%. Apple 91Cb (a red apple, newer to commercialization) also had a high reach
of 27.1%, with the highest frequency at 92.3%. Apple 55Cb, the most preferred apple in Group 2
when tasted, had a very low reach at 9.3%, and the lowest frequency of 9.1% of these consumers
being likely to purchase the apple.
Finally, results of Group 3 concluded that Granny Smith had the highest reach of 37.3%,
however it had a low frequency of 50.0%. Apple 91Cb had a high reach at 31.4% and a very high
frequency of 94.7%. Apple 55Cb had the lowest reach with 2.0%, and only a 25.0% likelihood
frequency of purchase. A summary of the reach and frequency values for each apple variety can
be found in Table 3.10.
In addition, a list of commonly used consumer-friendly attributes was given to the
consumers, and they were asked to identify which qualities of an apple that lead to a purchasing
decision. These results showed that apples that were healthy looking, red, vibrant, familiar, and
symmetrical were found to be acceptable by all consumer groups. Results also showed that
Group 1 was most accepting of larger apples (30% approval; Group 2 = 17% approval, Group 3
= 25% approval), Group 2 was not as accepting of green apples (18% approval; Group 1 = 30%
approval, Group 3 = 29% approval), and Group 3 was most receptive to apples that were
multicolored (35% approval; Group 1 = 27% approval, Group 2 = 28% approval). Attributes
leading to the least likely to purchase apples were universally agreed upon as unhealthy,
irregularly shaped apples. Group 1 was most accepting of apples that are yellow (20%
disapproval; Group 2 = 30% disapproval, Group 3 = 30% disapproval), as well as unfamiliar
apples (19% disapproval; Group 2 = 32% disapproval, Group 3 = 25% disapproval), and was not
receptive to apples that were too large (20% disapproval; Group 2 = 9% disapproval, Group 3 =
8% disapproval). Consistent with Group 2 was their lack of acceptance of green apples (23%
disapproval; Group 1 = 9% disapproval, Group 3 = 12% disapproval). A full summary of the
visual preference evaluation can be found in Table 3.11.

55
Table 3.11 List of the characteristics defined by consumers in the visual evaluation that would
make them most likely or least likely to purchase an apple variety, expressed as percentages for
each term.
Attribute Most likely to purchase Least likely to purchase
Group
1 (%)
Group
2 (%)
Group
3 (%)
Group
1 (%)
Group
2 (%)
Group
3 (%)
Bland/dull 57.8 65.4 58.8
Familiar 56.3 58.9 45.1 4.7 4.7 3.9
Green 29.7 17.8 29.4 9.4 23.4 11.8
Healthy 81.3 71.0 66.7
Irregularly shaped 3.1 2.8 0.0 39.1 29.9 23.5
Large 29.7 16.8 25.5 20.3 9.3 7.8
Multi-colored 26.6 28.0 35.3 18.8 19.6 21.6
Red 60.9 72.0 60.8 6.3 6.5 7.8
Small 10.9 16.8 15.7 10.9 12.1 15.7
Symmetrical 43.8 35.5 37.3 7.8 7.5 3.9
Unfamiliar 0.0 0.9 0.0 18.8 31.8 25.5
Vibrant 67.2 46.7 51.0
Yellow 14.1 18.7 13.7 20.3 52.3 56.9
3.4 Discussion
3.4.1 Understanding taste and flavor profiles of apples
This research hypothesized that key flavor attributes exist within apple varieties that are
responsible for driving consumer preference. To test this hypothesis, this study first determined
the attributes associated with different apple varieties through sensory DA. Results of DA
showed all attributes having a significant product effect (apart from hay in Year 2), indicating
that the trained panel was able to use the sensory lexicon to discriminate among the flavor
properties of each apple variety. Panel performance metrics were also assessed, and any problem
variables were further investigated for inclusion following the methods of Cliff et al. (2016).
Overall, it was found that the identification and removal of outliers did not influence the overall
product effect for these variables, and therefore all information remained in the dataset.
To further understand the relationships of these flavor attributes and their contributions to
taste and flavor perception within different apple varieties, the sensory maps created by PCA

56
from both years were investigated. The PCA of Year 1 showed four significantly contributing
factors. Factor 2 (29.8% of variation) and Factor 3 (15.8% of variation) were defined as
predominantly texture-loaded factors and accounted for 45.6% of the total variability within the
model. Alternatively, Factor 1 (22.8% of variation) and Factor 4 (16.3% of variation) were both
related to taste and flavor, accounting for approximately 39.2% of the variability within the
model (See Figure 3.1). Based on this large amount of variability being represented by taste and
flavor, this proves the importance of these sensory characteristics in achieving a complete
understanding of an apple variety. Observations of the PCA for Year 2 did not clearly delineate
between texture and flavor, as these models were represented by three factors with a combination
of texture, taste, and flavor attributes on each. It is speculated that this is due to the selection of
apples in Year 2, as they were chosen based on their differences in aroma volatile and texture
differences. The attributes positively correlated to Factor 1 (49.1% of variation; skin thickness,
chewy, acid, bitter, astringent, grassy/vegetal) of the PCA were later shown to be negative
drivers of preference based on the consumer evaluation. Additionally, the negatively correlated
attributes on Factor 1 (sweet, honey, floral) were all positive preference drivers in the consumer
evaluation, and further signifies the importance of this factor when describing the sensorial
composition of these apple varieties from a consumer liking perspective. Factor 2 (25.1% of
variation) of the Year 2 PCA showed a positive correlation to the attributes of astringent, juicy,
and acid. While not a focus of the present study, these results are consistent with previous
literature (Daillant-Spinnler et al., 1996; Bowen et al., 2018) who have identified the importance
of a secondary group of consumers who prefer juicy and acidic apples. Lastly, Factor 3 (12.6%
of variation) represented the attributes chewy and overall aromatic intensity in the positive
direction. With this information, the results of Year 2 can be simplified as Factor 1 representing
the positive and negative preference drivers of apple taste and flavor, and Factor 2 explaining
apples outside of the targeted “Apple Sweet Spot” which are preferred by a secondary group of
consumers who are not the target of this study (Bowen et al., 2018). The interpretation of results
from Factor 3 of the PCA are less clear, as this factor is also influenced in the positive direction
by honey, floral, and sweet, albeit to a lesser degree. Therefore, further investigation of the
attributes overall aromatic intensity and chewy may be required to determine their impact on
consumer liking. Additionally, a further understanding of the complexity of chewy is required as
it is influencing both Factors 2 and 3, which are linked to negative preference drivers and

57
positive preference drivers, respectively. The key factors representing flavor can be seen in
Figure 3.2.
In both years, apples were grouped into four clusters by AHC based on differences in
sensory profiles. When interpreting the results, apples were clearly separated by either their
differences in texture, or differences in taste and flavor. Apples primarily characterized by their
textural attributes can be seen in Groups B (n=10) and C (n=5) in Year 1, and Group B (n=9) in
Year 2 (See Section 3.2). The remaining groups were primarily described by their taste and
flavor profiles. In Year 1, Group A (n=8) and Group D (n=5) were found to have differing
profiles, with Group A having typically low lemony and grassy/vegetal aromas with low acid,
bitter, and astringent tastes while Group D had the highest intensities of grassy/vegetal aroma, as
well as overall aromatic intensity aromas, and low sweetness levels. Furthermore, when
segmenting apples by AHC in Year 2, Group A (n=10) consisted of apples high in honey, overall
aromatic intensity, and floral aromas with high sweet and low astringent and acid
tastes/mouthfeels. Group C (n=4) was the opposite of Group A, having low honey aroma and
sweet taste, with high acid and astringent tastes. Apples within Group D (n=4) were categorized
based on their low overall aromatic intensity and floral aromas, and acid taste. Based on the
established understanding of consumer preference among texture and taste attributes (Daillant-
Spinnler et al., 1996; Cliff et al., 2016; Bowen et al., 2018), it is therefore important to explore
the distinguishing characteristics of apple volatiles that will ultimately play a role in the
differentiation of apple flavor. By focusing on these properties, this research paper will therefore
place a lesser importance on the understanding of texture. Kim (2020) conducted a similar study
in parallel to this research focusing on texture qualities of the same sub-set of apples.
Additionally, we will still be considering the taste and mouthfeel attributes, as these can be
manipulated by flavor volatiles in a process known as odor-induced enhancement of taste
perception (Aprea et al., 2017). It is expected that this process will lead to a further
understanding of apple flavor, and which flavors are necessary to make an apple that is highly
liked by consumers.

58
3.4.2 Consumer preference and ideal apples
The next objective was to determine which apple varieties consumers prefer and to find
out what they would classify as their ideal apple. As the consumer evaluation results have
indicated, this research was able to identify three primary consumer groups. Although all
consumers were screened based on their consumption of apples prior to participating, consumers
in Group 3 (n=51) were found to dislike the majority of apples within the study. This group
provided no predictable differences among their liking scores, which ranged from a mere 39.2 to
54.9 out of 100 (See Table 3.6). It is expected that these consumers either fit into the smaller
consumer segment outlined by Bowen et al. (2018) which represented 11% of the population
who preferred acidic apples, that consumers in this group purchased apples for other purposes
(ex. juices, ciders, sauces, etc.), or that these consumers do not like eating whole apples. Thus,
this discussion section will primarily focus on the profiles of consumer Groups 1 (n=65) and 2
(n=110) that showed liking differences for the apples.
For Group 1 (n=65) liking was found to be heavily driven by texture. Preference among
these consumers was driven by the crisp attribute, then followed by sweet, honey, floral, and
juicy. This group was found to not dislike any apples within the selected varieties taken to
consumer testing, as their liking scores ranged from 47.6 to 76.5 out of a possible 100 (See Table
3.6). These high ratings were expected as many of the varieties evaluated were selected based on
their placement within the “Apple Sweet Spot” (Bowen et al., 2018). By using varieties in this
zone, we know that the texture of the tested varieties should fulfill the desired profiles of this
consumer group as previous results found that most consumers liked apples with crisp and juicy
characteristics (Bowen et al., 2018). Group 2 (n=110) was primarily driven by sweet taste within
the varieties with honey and floral flavors complementing this profile. Apple varieties that did
not meet the desired sweet and flavorful profile for this consumer group were reflected by lower
liking scores when sweetness intensity decreased. Scores ranged from as low as 23.5 to 73.4 out
of 100 (See Table 3.6).
When consumers were asked to describe their ideal apple after the tasting session, the
descriptors they provided matched their identified preference from the tasting experiment. For
example, the preference for consumers in Group 2 was found to be heavily driven by apples that

59
were described as sweet by DA, and at the same time this group listed the sweet attribute as their
highest ranked must have attribute. However, as shown by the results from the visual evaluation
test, this may not always translate when deciding on the purchase of apples, as seen with the
highest predicted liking of an apple having the lowest visual acceptance of the group, and some
of the most recognizable varieties (ex. Granny Smith, Gala) having high reach and frequency
(See Section 3.3.8). All apples were presented blind in this study, meaning that visual familiarity
and recognition may have been impacted as consumers are known to make purchase decisions
based on their previous experiences and expectations with familiar variety names (Yue and
Tong, 2011). This is further shown with varieties that are either newer to the market or not yet
available commercially as some of these have much lower reach and frequency in comparison,
while having higher predicted liking among consumers. All three groups agreed with the fact that
apples must have a thin skin with a flavorful, sweet, crisp, and juicy profile. In addition, Group 1
was found to value crisp and juicy higher than the other two groups, consistent with the findings
of the preference map, and Group 2 was found to have a strong correlation with sweet, further
cementing the evidence suggesting that preference for this consumer group is heavily driven by
sweet taste and volatiles that enhance sweetness perception. A point of interest within consumer
Groups 1 and 2 is that Group 1 identifies an ideal apple as first being flavorful, surpassing their
appreciation of texture attributes. Group 2 values flavorful apples very highly, ranking second
only to sweetness. These results show the value of flavor across both consumer groups and
signify the importance of delving deeper into what makes an ideal and “flavorful” apple going
forward. Additionally, as the term flavorful is subjective and encompassing to all flavors, it is
important to pair this information with our DA results, allowing for the determination of which
flavors being portrayed in an ideal sense. To help pinpoint the definition of flavorful for each
consumer group, an ideal apple for each group can be projected onto the preference map,
indicating the respective flavors contributing to preference.
3.4.3 Generation of a preference map
The creation of a preference map through the combination of consumer liking data and
the sensory map from the subset of apples taken to the consumer evaluation allowed for the
further clarification of the second objective and the completion of the third objective by first

60
identifying which apple varieties consumers prefer, and then identifying the key flavor attributes
that can be used as predictors of consumer preference.
When the general preference for consumer Groups 1 and 2 were imposed onto the
preference map, preference for both groups was loaded towards the negative direction on Factor
1 (taste/flavor), the positive direction on Factor 2 (texture), and differed on Factor 3. This
preference map showed that Factor 1 (41.8% of variation) accounted for the largest amount of
variability, and was defined by lemony, grassy/vegetal, acid, bitter, astringent, and chewy in the
positive direction (least preferred) on the axis, and honey, floral, and sweet in the negative
direction (most preferred). Interestingly, Factor 1 was primarily represented by taste and flavor
sensory attributes (excluding chewy). Factor 2 (28.1% of variation) was described in the positive
direction on the axis by crisp and juicy (most preferred), with skin thickness and mealy going in
the negative direction (least preferred). Consistent with previously generated preference maps
(Daillant-Spinnler et al., 1996; Bowen et al., 2018), these results were represented by the most
important texture attributes in terms of consumer preference. Factor 3 (12.5% of variation)
explained rate of melt and oxidized apple in the positive direction, with crisp being positioned
negatively along the axis. However, preference along Factor 3 is not as conclusive as Factors 1
and 2. With crisp influencing the direction of Factors 2 and 3, we can interpret this as a complex
sensory attribute. This is an especially important finding, as we know that consumers in Group 1
are primarily driven by crisp. However, due to the scope of this research study, the multi-
dimensionality of crisp was not investigated further (see Kim 2020).
In conjunction with Section 3.4.3, and most relevant to this research and the defining
properties of a flavorful apple, preference on Factor 1 is shown to be moving in the direction of
sweet, honey, and floral attributes while moving away from lemony, grassy/vegetal, acid,
astringent, bitter, overall aromatic intensity, and hay. This appears to be the case for both
consumer groups and helps to prove the importance of these flavor attributes in relation to
consumer preference. When cross-referencing this to Section 3.4.3, we can conclude that the
ideal flavors within our defined flavorful term would be comprised of the honey and floral
attributes. Factor 2 was most represented by texture attributes, and thus will not be discussed
further as it outside of the scope of this research project. Factor 3 was represented by oxidized
apple aroma in the positive direction along with rate of melt. On this third factor, Group 1 was

61
heavily influenced by crisp in the negative direction, while Group 2 stayed almost neutral.
Consumers in Group 2 do value texture qualities, but once the juicy and crisp textures have
reached a sufficient intensity, they are then focused on the taste and flavor of the apple. In terms
of flavor, both groups were influenced in the opposite direction of oxidized apple aroma,
suggesting that this is a detractor of preference. Based on these results, it is important in future
flavor research to target aroma volatiles that contribute to the honey and floral perceptions within
apples while avoiding compounds contributing to the lemony, grassy/vegetal, overall aromatic
intensity, hay, and oxidized apple aromas. By further identifying compounds responsible for
these liked and disliked flavor characteristics, it is possible to develop apple varieties tailored to
the desires of a consumer, providing future breeding programs with clarity towards what will
make a highly competitive apple on the market, and potentially replace existing “good” varieties,
with “great” new varieties based on these subtle differences.
3.5 Conclusions
The rationale for this research study was to build on previous information from Bowen et al.
(2018), who showed the effectiveness of combining sensory and consumer evaluations to create
an external preference map. Results from Bowen et al. (2018) were used to preface this current
experiment, primarily using apple varieties from the “Apple Sweet Spot” to identify a hole in the
market when it comes to key taste and flavor attributes among apple varieties, to determine if
consumer liking segments exist amongst the most liked apples and what sensory attributes define
them.
By applying DA across two consecutive growing seasons, the sensory characteristics of 27
(Year 1) and 28 (Year 2) varieties were quantified based on their intensity ratings and enabled
the distinction of these taste and flavor characteristics among the varieties. This allowed for the
completion of our first objective, determining which flavor attributes are associated with
different apple varieties by showing that oxidized apple, earthy, hay, honey, lemony, floral,
grassy/vegetal, and overall aromatic intensity are all contributing to the flavor profiles of apples
within this study. In terms of our second objective, hedonic testing was completed by consumers
who regularly purchase fresh market apples. For varieties already known to be highly preferred
by consumers, this research was able to conclude that many subtle differences still existed

62
among these top varieties. Consumers divide into two liking groups, with the largest groups
(49%) liking apples with sweet taste, and honey and floral flavors which allowed these varieties
to excel in comparison with other high-performing apples (when paired with crisp and juicy
textures). Thus, honey and floral flavors were shown to be drivers of liking and provided a
definition of the term “flavorful” used by the consumers when describing their ideal apples and
can serve as a target for future volatile chemical analysis.
Additionally, the second part of this research objective was completed by allowing the
consumers to respond through a questionnaire with what they envision as an ideal apple.
Consumers in Group 1 listed their ideal apple as being flavorful with juicy and crisp texture
properties, while consumers in Group 2 primarily wanted sweet and flavorful apples, with
texture not playing as important of a role in their definition of ideal. Our last objective, being
able to identify which flavor attributes can be used as potential predictors of consumer
preference was completed through a combination of sensory DA, a consumer hedonic evaluation,
and the formation of an external preference map. With this information, we can confirm our
hypothesis by highlighting honey and floral to be the key preference drivers of flavor when
paired with sweet, and the key detractors of preference to be the lemony, grassy/vegetal, overall
aromatic intensity, hay, and oxidized apple aromas when paired with acid, bitter, or astringency.
The future direction of this research is to integrate the results of this study into the apple
breeding program at Vineland and use the preference mapping tool to identify apples to advance
and commercialize with the ultimate goal of developing new consumer driven apples varieties
for the Ontario apple industry. This may include testing apple varieties currently on the market,
or varieties created within apple breeding programs. It may also serve to identify holes in the
industry such as an apple that targets the desires of a large proportion of the population or
targeting a niche segment that is untouched by other varieties. This can all be done by driving a
consumer-centric approach to the breeding of future apple varieties. Furthermore, the
methodology used in the present study can be used in other research programs globally to help
identify characteristics of apples, or other horticultural products, that consumers are seeking in
their local area. Finally, it is necessary to further develop an understanding of these key flavor
properties by understanding the volatile composition that is creating the aroma/flavor profiles
responsible for driving and detracting consumer preference. Based on results from this study,

63
future research should focus on the identification of volatiles leading to attributes associated
positively with liking (honey, floral), while avoiding attributes negatively associated with
preference (lemony, grassy/vegetal, overall aromatic intensity, hay, and oxidized apple). Thus,
this research will play a pivotal a role in future breeding programs and the evolution of the fresh
apple market by allowing new varieties tailored to the desires of consumers onto the market
using a consumer-driven approach.

64
4 Implementation of Aroma Volatile and Physicochemical
Measurement Techniques for the Determination of Flavor
Properties in Apple Fruit
This chapter is intended to be submitted to the Journal of Agricultural and Food Chemistry and
has been adapted for this thesis.
Jordan R. MacKenziea,b, Lisa M. Duizera, David K. Liscombeb, Amy J. Bowenb
a Department of Food Science, University of Guelph, Guelph, ON, Canada
b Vineland Research and Innovation Centre, Vineland, ON, Canada
Author MacKenzie conducted the research, analyzed the data, and wrote the manuscript. Author
Duizer reviewed and edited the manuscript. Author Liscombe oversaw the work and reviewed
and edited the manuscript. Author Bowen received funding for the project, oversaw the work,
and reviewed and edited the manuscript.
Abstract
A recent shift within the apple industry has shown the role that flavor plays in consumer
satisfaction. This research investigates instrumental methods of GC-MS and physicochemical
techniques (i.e. pH, titratable acidity, and soluble solids content) to identify taste and flavor
properties within apples. Apples varieties (n=27, n=29) were tested across two subsequent years
with volatiles (n=40) measured through GC-MS and physicochemical testing conducted on each
variety. Results were paired with sensory DA intensity ratings using a lexicon of taste and flavor
attributes (n=12). Ultimately, results revealed that positive preference drivers of sweet taste and
honey flavor can be linked to the pH, acetate, hexyl, and butyl esters, while floral flavor can be
linked to acetate esters and pH. Additionally, negative preference drivers within apples can be
linked to ethyl, propyl, and acetate esters, medium-chain aldehydes, fatty alcohols, primary
alcohols, ketones, and sesquiterpenoids as well as titratable acidity and TA/°Brix ratio.
Practical applications
Results of this research will allow apple growers and breeding programs to use sensory
and instrumental testing protocols to identify desirable characteristics within their fruit by using
the information to screen new and current apple varieties, thus allowing an understanding of how
the apple will perform on the market.
Keywords:
Descriptive analysis; physicochemical; volatile; flavor; apples

65
4.1 Introduction
Apples are a complex fruit with many unique taste, texture, and flavor properties. Recent
technological advancements have allowed for the texture of apples to be consistently maintained
at a desirable level to consumers (Yahia, 1994; Ting et al., 2015). While these technologies may
be beneficial for the maintenance of firm and juicy textures, they may also be detrimental to the
production of volatile chemicals responsible for the creation of the intrinsic aromas of the apple,
thus leading to undesirable flavor outcomes (Ting et al., 2015). To allow for the optimization of
apple flavor within commercially available varieties, it is necessary to understand the flavors in
which consumers desire and use these characteristics to guide apple breeding programs to create
a flavorful apple fruit. To achieve this, a combination of sensory DA to determine the intensity of
each sensory attribute, VOC analysis to identify and quantify present chemical compounds
within the apple fruit through GC-MS, and physicochemical analyses (i.e. pH, °Brix, TA, and
TA/°Brix ratio) to measure the sweetness and acidity of the apple fruit is necessary.
Sensory analysis, and specifically DA, is considered the gold standard in measuring and
identifying perceptible taste and flavor characteristics of food products (Yahia, 1994; Ting et al.,
2015). A trained DA panel allows for an objective evaluation of a sensory lexicon containing
taste and aroma/flavor descriptors. Conclusions can be drawn from these results through an
ANOVA, showing whether true differences exist among the products for evaluated
characteristics (Du et al., 2010; Lignou et al., 2014; Ting et al., 2015; Kim et al., 2018; Bowen et
al., 2018; MacKenzie et al., unpublished).
In addition, multivariate statistics allow this data to be used alongside instrumental data
(ex. VOCs or physicochemical) via PCA (Lignou et al. 2014; Kim et al., 2018; Bowen et al.,
2018; MacKenzie et al., unpublished), GPA (Du et al., 2010), or MFA (Lignou et al., 2014; Ting
et al., 2015). These statistical methods are used to showcase the complexity of the product and
increase the amount of predictable variation by the generated model by identifying correlations
among variables. For this research, DA will be used to identify the flavor characteristics that
differentiate each individual apple variety. This information will be cross-referenced with
information from Vineland, who have shown with recently published research by Bowen et al.
(2018) that preference among apple varieties can be divided into two groups of consumers:

66
Group 1 which represented 89% of the tested population liked apples with sweet taste, crisp and
juicy textures, and a fresh red apple aroma/flavor. Apple varieties falling within this zone are
classified as being in the “Apple Sweet Spot”, and thereby satisfy the liking needs of the
majority of the tested consumer groups. Group 2, representing 11% of the population preferred
apples with an acidic taste, crisp and juicy textures, and a fresh green apple aroma/flavor. Most
recently, MacKenzie et al. (unpublished) conducted a complementary study to this research to
further clarify apple varieties and sensory attributes with connections to consumer liking within
the defined Apple Sweet Spot. This research showed similarities on the basis of consumer liking,
where the tested population was divided into three consumer groups based on their preferences.
Group 1 (29% of the population) was primarily driven by the texture of the apple, with sweet
taste and honey and floral flavors coming as secondary/tertiary desires. Group 2 (49% of the
population) was primarily driven by sweet taste and honey and floral flavors. In this group, the
importance of texture qualities came as secondary preference drivers, if the intensities of texture
attributes allowed for the apple to be crisp, juicy, and not mealy. This research also identified a
third group (23% of the population) who regularly purchase apples but did not show any
indicators of preference. Interestingly, when the consumers in this study were asked about their
ideal apple, all three consumer groups identified the term “flavorful” as being the most important
driver of consumer liking. This research is similar to other studies highlighting the importance of
sweet and acidic tastes aligning with preference, as well as the preferred texture profiles of crisp
and juicy (Daillant-Spinnler et al., 1996; Symoneaux et al., 2012). However, the least understood
part of the puzzle remains as to which flavor properties are responsible for driving consumer
liking.
To fully understand the flavor characteristics of apples, it is necessary to evaluate an
apple variety at a chemical level. However, this is a difficult process as apples are complex fruit,
composed of over 300 identified VOCs (Dixon and Hewett, 2000). Based on research from
MacKenzie et al. (unpublished), which ran parallel to this experiment, it is now understood that
consumer liking is driven by honey and floral aromas, while grassy/vegetal, overall aromatic
intensity, hay, and oxidized apple aromas serve as detractors of consumer liking. The present
research uses GC-MS to evaluate the concentration of 40 pre-determined VOCs that may be
responsible for some of these attractors or detractors of liking. These VOCs have been selected

67
based on previous literature of apple biochemistry, as well as preliminary testing to identify
compounds to include in the study. Additionally, the physicochemical properties of each variety
were collected to help further define the relationship between the chemical composition of the
apple and its respective taste/flavor.
As shown in MacKenzie et al. (unpublished), extrinsic factors (ex. appearance,
demographic, etc.) are not reliable indicators for consumer preference when compared to
intrinsic factors (ex. sensory attributes). Similarly, it is expected that additional intrinsic
properties such as VOCs or physicochemical qualities will lead to further discovery of impactful
flavors in relation to consumer liking and can serve a purpose within the apple industry to
identify potential chemical-breeding targets.
The aim of the current research was to determine the VOCs or other instrumental
measurements (ex. physicochemical data) that were related to both consumer liking and
disliking, to ultimately aid in the selection of high-quality apples to market competitively. The
hypothesis of this research was that key aroma volatiles and physicochemical properties exist
which are responsible for the creation of unique flavor perception and can be linked to consumer
liking. The identification of these VOC targets will decrease the need to run extensive sensory
and consumer research trials, as these are expensive, time-consuming, and labor-intensive
(Murray et al., 2001).
To achieve this hypothesis, two objectives were identified. First, VOCs responsible for
the creation of flavor perceptions in relation to consumer liking were identified and measured.
Second, other instrumental measurements (ex. physicochemical analyses) were used to provide
any additional insight into the variability among taste/flavor perceptions. These objectives will
be paired with prior results from MacKenzie et al. (unpublished) which had identified positive
and negative taste and flavor preference drivers in relation to consumer liking.
4.2 Materials and methods
The present experiment served as a complementary study to the data outlined in Chapter
3.

68
4.2.1 Products
Apple varieties were sourced locally from the OAG (St. Catharines, Canada) whenever
possible. Additional apples were provided through Vineland and other Canadian breeding
programs to help identify the characteristics of novel apple varieties. When Ontario-grown
resources were unavailable, apples were sourced from local grocery retail.
Selection of apple varieties occurred across three experimental years. In the first year
(2017-2018), apples were chosen by incorporating varieties that represented a large segment of
the Ontario market share, leading apple varieties in Canadian apple breeding programs, or results
of previous research conducted by Bowen et al. (2018). Data collected in Year 1 was used to
identify which VOCs were present in apples and to refine method development. Apples tested in
Year 2 (n=27; 2018-2019) and Year 3 (n=29; 2019-2020) were selected based on results of Year
1. Results in Year 2 were used for further refinement of apples for testing in Year 3. Additional
apples tested included varieties (n=2) from Canadian breeding programs to provide insight into
their respective flavor characteristics, and in Year 3 a group of top-performing varieties derived
from the Vineland apple breeding program (n=5).
Apples delivered to Vineland were sorted and stored in a designated apple cooler. Apples
with visual defects (ex. bruising, injury, mold, etc.) were discarded, and the remaining apples
were placed into a plastic storage container as a single layer. The temperature of the cooler was
maintained at 2-4°C through room cooling as defined by Boyette et al. (1990).
4.2.2 Maturity determination, handling, and storage
Apple maturity and handling were consistent with the previously reported data from
MacKenzie et al. (unpublished) and relied on the SI index as described by Blanpied and Silsby
(1992). The SI index was routinely monitored and once an apple variety had reached its ideal
maturity, sensory and instrumental testing ensued. Additional handling parameters were used to
allow for volatile collection and for the analysis of the physicochemical properties of each
variety.
For handling of apples used in volatile collection, each apple was first cut into small
squares (skin on, excluding core) and weighed to a total of 100 g on a Quintix® scale (Sartorius,

69
Germany). Then, samples were loaded into a glass tube and capped on each side to entrap any of
the released volatiles within the tube. This testing procedure was completed in quadruplicate for
each unique apple variety.
Handling of apples for the purpose of physicochemical analyses (ex. pH, °Brix, TA,
TA/°Brix) involved cutting the apple (skin on, excluding core) into pieces, and then placing
these into a HealthSmart® Juice Extractor (Hamilton Beach, USA) where juice was separated
from the solid content. This was completed in triplicate for each variety. For each individual
apple sample, the juice was poured into a 50 mL polypropylene tube (Fisher Scientific, USA),
labelled, and then centrifuged at 4700 rpm for 10 minutes using a Fiberlite™ F13-14 x 50cy
fixed angle rotor (Thermo Scientific, USA) and Sorvall™ Legend™ X1 centrifuge (Thermo
Scientific, USA). The supernatant (the clear liquid derived from the separation of solids and
liquids) of this juice was removed and placed into two 15 mL polypropylene tubes (Fisher
Scientific, USA), where each of the three replications were later tested in duplicate. At the time
of extraction, pH, and SSC measured in °Brix were both measured and recorded. The juice
samples were then frozen in a Forma™ -40°C Lab Freezer (Thermo Scientific, USA) for future
measurements of TA.
4.2.3 Aroma volatile collection and analysis by GC-MS
Aroma volatiles from fresh apples were collected, concentrated, and analyzed by GC-MS
as described for fresh nectarines by Kumar et al. (2020), with modifications to focus on apples.
Volatile compounds were identified by comparison to authentic standards listed in Table 4.1.
Table 4.1 Volatile organic compound list grouped based on chemical structure.
Compound group Volatile organic compound
Anisoles Estragole
Acetate esters 2-methylbutyl acetate
5-hexene-1-ol, acetate
Butyl acetate
Hexyl acetate
2-methylpropyl acetate

70
Table 4.1 Continued.
Compound group Volatile organic compound
Acetate esters (continued) Isopentyl acetate
Propyl acetate
Pentyl acetate
Z-2-hexen-1-ol, acetate
Methyl esters Methyl butyrate
Ethyl esters Ethyl propionate
Ethyl butyrate
Ethyl hexanoate
Propyl esters Isopropyl butyrate
2-methylpropyl butanoate
Propyl propionate
Propyl butyrate
Propyl hexanoate
Butyl esters Butyl 2-methylbutanoate
Butyl butyrate
Butyl propionate
Butyl octanoate
Butyl hexanoate
Amyl esters 3-methylbutyl hexanoate
Hexyl esters Hexyl 2-methylbutanoate
Hexyl hexanoate
Hexyl octanoate
Hexyl propionate
Fatty alcohols 1-hexanol
(R)-Sulcatol
3-hexen-1-ol
Ketones Sulcatone

71
Table 4.1 Continued.
Compound group Volatile organic compound
Medium-chain aldehydes 2-Hexenal
Hexanal
(Z)-3-Hexenal
Primary alcohols 1-butanol
1-pentanol
(S)-2-methyl-1-butanol
Sesquiterpenoids α-farnesene
4.2.4 Physicochemical evaluation
To gather other instrumental measurements on the apple varieties, a combination of pH,
°Brix, and TA analyses were conducted on each variety.
The pH was measured using an Accumet Basic pH meter (Fisher Scientific) and Accumet
probe (Fisher Scientific). Prior to evaluation, three standard buffer solutions were used (pH 4.00,
pH 7.00, pH 10.00; Fisher Scientific) to allow for calibration of the pH meter, thus generating
accurate measurements for each sample. Once this was complete, the probe was placed into the
apple juice, allowed to stabilize, and the value from the pH meter was recorded. Before moving
to the next sample, the probe was cleaned with MilliQ (MQ; MilliporeSigma, USA) water and
dried with a Kimwipe (Kimberley Science, USA). This was completed in triplicate for each
variety.
The SSC was measured and expressed as °Brix. Evaluation of each sample was
conducted in triplicate, using an Atago Pocket Refractometer (PAL-1; Atago, Japan). To perform
this analysis, 300 μL of apple juice was pipetted onto the lens of the refractometer and then
measured. Results were recorded and then the device was cleaned using MQ water
(MilliporeSigma) and a Kimwipe (Kimberley Science).
Titratable acidity was measured using an 848 Titrino plus (Metrohm, Switzerland) with
an 801 Stirrer attachment (Metrohm). Apple juice was thawed prior to evaluation and left at

72
room temperature. Titrations were conducted creating a solution of 2 mL of apple juice sample
mixed with 50 mL MilliQ water (MilliporeSigma), then 0.1 N NaOH (Fisher Scientific) as a
titrant to reach an endpoint of pH 8.2 in the sample. Results were calculated using an established
equation from Nielsen (2019; see below) and expressed as g/L of malic acid. After each titration
was complete, the pH electrode was rinsed with MQ water (MilliporeSigma) and gently dried
using a clean Kimwipe (Kimberley Clark). The following equation was extracted from Fisher
Scientific Application Note 010 (2014) and was adapted to suit the malic acid milliequivalence,
as well as the %Acid being converted to g/L of acid by multiplying by a factor of ten. This
equation was then used to calculate the acid concentration for each apple juice sample:
%𝐴𝑐𝑖𝑑 =𝑚𝐿𝑠 𝑁𝑎𝑂𝐻 ∗ 0.1𝑁 ∗ 0.067 ∗ 100
2𝑔 𝑜𝑓 𝑠𝑎𝑚𝑝𝑙𝑒
4.2.5 Trained sensory panel evaluation
Sensory panel evaluation data was collected using the DA method. These methods were
conducted at Vineland using their employed and trained in-house sensory panel. Details of the
training and purpose of this trained sensory panel can be found in MacKenzie et al.
(unpublished). Sensory attributes were used as part of an established 18-attribute lexicon which
included taste, flavor, and texture attributes. For the purpose of this study, only the
taste/mouthfeel (n=4) and aroma/flavor attributes (n=8) were taken into consideration. These
included sweet, acid, bitter, and astringent as tastes/mouthfeels, and oxidized apple, earthy, hay,
honey, lemony, floral, grassy/vegetal, and overall aromatic intensity for aroma/flavors.
In Year 2, apple varieties (n=28) were evaluated in eight individual 1.5-hour DA sessions
by the panelists (n=15, average). These sessions took place throughout the apple season, starting
in October 2018 and continuing until January 2019. Selection and profiling date of each apple
variety for DA was based on the maturity of each variety, as described in Section 4.2.2.
Similarly, in Year 3, DA was conducted across seven individual 1.5-hour sessions. Apple
varieties (n=29) were evaluated by the Vineland trained sensory panel (n=14, average). Sessions
in Year 3 took place from October 2019 to January 2020. The sensory DA data collected in Year
1 was not included in this study.

73
A taste and aroma reference tray was provided to each panelist at the beginning of each
session to help calibrate their senses prior to evaluation. This reference tray included a reference
standard for each attribute used in the sensory lexicon with a standardized recipe that can be
found in Table 4.2.
Full testing procedures can be found in MacKenzie et al. (unpublished), with details
outlining the preparation protocols, room specifications, and tasting procedure. All samples were
tested in duplicate and presented in a randomized balanced design. Intensity measurements were
recorded by panel members using EyeQuestion software (Logic8, Netherlands). This software
allowed for panelists to rate the intensity of each sensory attribute using a 15 cm line scale with
anchors of “weak” denoted at the 10% mark of the scale, and “intense” at the 90% position of the
scale.

74
Table 4.2 Basic taste, mouthfeel, and aroma reference tray standards with recipes.
Reference Preparation Method
Sweet 6.0 g sucrose + 400 mL applesauce†
Acid 1.0 g malic acid + 400 mL applesauce†
Bitter 0.10 g caffeine + 400 mL applesauce†
Astringent 0.90 g Kalum (potassium aluminum sulphate dodecahydrate) +
400 mL applesauce†
Earthy 18 µL earthy (#11)‡ + 400 mL applesauce†
Honey 20 g honey§ + 400 mL applesauce†
Grassy/vegetal ½ pot cat grass + 600 mL filtered water
Soak 30 minutes, filter, + 1 mL ‘Green’ solution¶ + 400 mL
filtered water
Oxidized apple Cut one Red Delicious apple, allowing to oxidize for 30 minutes
Hay 270 µL hay (#38) ‡ + 600 mL filtered water
Floral 10 mL rose water‖ + 800 mL filtered water
Lemony 360 µL lemon extract + 800 mL filtered water
Overall aromatic intensity 40 mL applesauce†
† Mott’s Fruitsations unsweetened applesauce ‡ Le nez du vin “The Masterkit 54 aromas” § BillyBee pure natural pasteurized honey ¶ 500 mL filtered water, 9 µL green pepper (#30)‡ ‖ Cortas rose water
4.2.6 Data organization and statistical analyses
Sensory data was extracted from EyeQuestion (Logic8, Netherlands) software and
exported into Microsoft Excel (Microsoft, USA). The mean intensity values of each unique taste
and flavor sensory attributes (n=12; oxidized apple, earthy, hay, honey, lemony, floral,
grassy/vegetal, overall aromatic intensity, sweet, acid, bitter, astringent) were assigned to each
corresponding apple variety in Years 2 and 3.
For analysis of the volatile data collected using GC-MS, as certain aromas are produced
based on a cocktail of chemical compounds, it was decided to group each of the aroma VOCs

75
based on their chemical composition instead of as individual chemicals. With reference to The
Human Metabolome Database (See hmdb.ca), the 40 individual compounds were split into 13
unique groups as outlined in Table 4.1. These included anisoles (n=1), acetate esters (n=9),
methyl esters (n=1), ethyl esters (n=3), propyl esters (n=5), butyl esters (n=5), amyl esters (n=1),
hexyl esters (n=4), fatty alcohols (n=3), ketones (n=1), medium-chain aldehydes (n=3), primary
alcohols (n=3), and sesquiterpenoids (n=1).
Prior to VOC analysis, the ion chromatogram generated in the MSWS 8 Bruker GC/MS
software (Scion Instruments) was observed. The first check in the process was to ensure that a
nonyl acetate peak (used to standardize the data) was present at a concentration of 2 ppm. If this
peak was not present, the replication was removed. Start and endpoint integration to measure the
area under the curve was used to calculate the concentration of each VOC in the chromatogram.
Once each concentration was established, VOC data was extracted and the raw data files were
uploaded to the online platform, MetaboAnalyst 4.0 (Chong et al., 2019). The uploaded data was
represented by the concentrations of each VOC and were then normalized by sum. Next, the data
was scaled by mean-centering and divided by the standard deviation of each variable. This
allowed for normalization of the data, and a clearer representation of the relationship of the
VOCs to each other. The final VOC results were represented in relative abundances, as the
relative concentration of each VOC to the total concentration of VOCs on a sample-by-sample
basis. For data analysis, all relative abundances within each VOC group were summed and used
going forward in the statistical analyses.
A one-way ANOVA was used to analyze combined sensory and VOC datasets. All apple
varieties (products) were assigned as qualitative variables, with the sensory attribute intensities
and VOC relative abundances being defined as the quantitative variables. Due to the inability to
measure the sensory traits of the identical apples for each variety, it was decided to use mean
intensity values for each sensory attribute while keeping each replication of a VOC separate for
the ANOVA. This led to no variance in the sensory attributes, and only a measurement of the
variance across VOC groups. In addition to an ANOVA, a normality test (Shapiro-Wilk) and test
of heterogeneity (Levene’s test) were also employed to determine the normality and
homogeneity of each variable. Next, a linear regression was conducted wherein dependent
variables (sensory attributes) were compared with independent variables (VOCs) to discover any

76
meaningful relationships among the datasets. A PCA was used to generate a map of the sensory
attributes and VOC groups. For this test, average intensity ratings of each sensory attribute were
paired with each of the three or four VOC sample replicates, dependent on variety. Results from
this analysis differed across years, and thus will be analyzed separately. In accordance with Mooi
and Sarstedt (2011), acceptable tolerance levels of KMO scores were established to ensure
accuracy of the sampling adequacy of the generated models. Thresholds were applied, sensory
and VOC groups with KMO scores higher than 0.500 were retained, as well as an overall KMO
score threshold of 0.700 was applied to the whole model.
Finally, physicochemical data including the instrumental measurements of pH, °Brix,
TA, and TA/°Brix ratio for each variety were averaged across replications and recorded into
Excel (Microsoft). This physicochemical data was paired with the sensory and VOC data, to
create a dataset encompassing each apple variety with relevant taste/flavor sensory data, relative
abundances of each VOC group, and physicochemical data.
To best understand the relationship between the sensory and VOC data, a GPA was
conducted. For simplicity of the results, and to allow for a clearer picture to be shown, the means
of each dataset were used and assigned to each corresponding apple variety. This analysis was
again divided into two individual years. In addition to this, and to generate a fully encompassing
map of the relationship between sensory, volatile, and physicochemical characteristics, the three
datasets were also combined for use in a MFA. To gather a better understanding of the model
and its relationship between sensory and VOC variables, the mean values for each of the datasets
were used and assigned to their corresponding apple variety, with the physicochemical data
included only as supplementary data. The reasoning for omitting the physicochemical data from
the GPA, and only including the physicochemical data as supplementary data in the MFA can be
found in Section 4.4.2.
Statistical analyses were conducted using XLSTAT (Addinsoft, France) and
MetaboAnalyst software (See metaboanalyst.ca). A significance level of 5% was used across all
tests.

77
4.3 Results
4.3.1 Analysis of variance
In Year 2, a Shapiro-Wilk normality test was conducted which showed that all taste and
flavor sensory attributes (oxidized apple, earthy, hay, honey, floral, lemony, overall aromatic
intensity, grassy/vegetal, sweet, acid, bitter, astringent) and VOC groups (acetate esters, anisoles,
methyl esters, methyl esters, propyl esters, butyl esters, amyl esters, hexyl esters, fatty alcohols,
ketones, medium-chain aldehydes, primary alcohols, and sesquiterpenoids) were not normally
distributed (p<0.05). Additionally, a Levene’s test of homogeneity of variance had shown that
among the VOC groups, acetate esters had homogeneous variances (p<0.057), with the
remaining VOCs having heterogeneous variances (p<0.05).
Results for the normality test differed in Year 3, where the sensory attributes of honey
(p=0.059) and overall aromatic intensity (p=0.061) aromas were found to be normally
distributed, while all other sensory attributes and VOC groups were found to not be normally
distributed (p<0.05). In addition, the Levene’s test of homogeneity of variance showed that all
groups of volatile compounds had homogeneous variances (p>0.05), except for ethyl esters
(p=0.012) which had heterogeneous variances.
In both Year 2 and Year 3, statistically significant product effects existed for all groups of
VOCs (p<0.0001). Therefore, these results prove that true differences exist among the apple
varieties and their respective VOCs.
4.3.2 Regression analysis
Regression analysis results for Years 2 and 3 are shown in Table 4.3. In Year 2,
significant differences (p<0.05) existed across all sensory attributes, apart from acid (p=0.080),
and astringent (p=0.193). When observing each VOC group, significant differences existed for
anisoles (hay, honey, floral, overall aromatic intensity, sweet, bitter), acetate esters (earthy),
methyl esters (grassy/vegetal, bitter), ethyl esters (oxidized apple, earthy), propyl esters (hay,
floral), butyl esters (oxidized apple, overall aromatic intensity), amyl esters (floral), hexyl esters
(earthy), and medium-chain aldehydes (oxidized apple, earthy, hay), primary alcohols (oxidized

78
apple, hay, honey, overall aromatic intensity, sweet), and sesquiterpenoids (oxidized apple,
earthy, grassy/vegetal, overall aromatic intensity). Significant differences (p<0.05) did not exist
for fatty alcohols or ketones.
Results of the linear regression in Year 3 showed that significant differences (p<0.05)
existed across all sensory attributes. Additionally, acetate esters (earthy), methyl esters (oxidized
apple, lemony, overall aromatic intensity, grassy/vegetal, acid, bitter, astringent), ethyl esters
(hay, lemony, acid), propyl esters (oxidized apple, hay), butyl esters (oxidized apple, earthy, hay,
overall aromatic intensity), amyl esters (earthy, hay, overall aromatic intensity), hexyl esters
(oxidized apple, earthy, hay, grassy/vegetal), fatty alcohols (overall aromatic intensity, bitter),
ketones (honey, lemony, sweet, acid), primary alcohols (oxidized apple, honey, floral, lemony,
overall aromatic intensity, grassy/vegetal, sweet, acid, bitter, astringent), and sesquiterpenoids
(earthy, hay, honey, floral, lemony, grassy/vegetal, sweet, acid) were shown to have significant
differences with their corresponding sensory attributes. However, anisoles and medium-chain
aldehydes had no significant differences across their respective sensory attributes.
Table 4.3 Statistically significant sensory attributes across volatile groups from linear regression.
VOC group Sensory attribute Year 2 (2018) Year 3 (2019)
p-value p-value
Anisoles hay 0.001
honey 0.000
floral <0.0001
overall aromatic intensity 0.024
bitter 0.050
sweet 0.003
Acetate esters earthy 0.015 0.039
Methyl esters grassy/vegetal 0.010 0.0132
lemony 0.001
overall aromatic intensity 0.016
oxidized apple 0.002
acid 0.002

79
Table 4.3 Continued.
VOC group Sensory attribute Year 2 (2018) Year 3 (2019)
p-value p-value
Methyl esters (continued) astringent <0.0001
bitter 0.000 0.013
Ethyl esters earthy 0.050
hay 0.000
lemony 0.039
oxidized apple 0.026
acid 0.046
Propyl esters floral 0.003
hay 0.031 0.011
oxidized apple 0.024
Butyl esters earthy <0.0001
hay 0.032
overall aromatic intensity 0.002 0.000
oxidized apple 0.022 0.002
Amyl esters earthy <0.0001
floral 0.040
hay 0.003
overall aromatic intensity 0.011
Hexyl esters earthy 0.000 <0.0001
grassy/vegetal 0.001
hay 0.003
oxidized apple 0.019
Fatty alcohols overall aromatic intensity 0.006
bitter 0.035
Ketones honey 0.003
lemony 0.014

80
Table 4.3 Continued.
VOC group Sensory attribute Year 2 (2018) Year 3 (2019)
p-value p-value
Ketones (continued) acid 0.042
sweet 0.005
Medium-chain aldehydes earthy 0.000
hay 0.005
oxidized apple 0.048
Primary alcohols floral 0.000
grassy/vegetal 0.000
hay 0.001
honey 0.022 <0.0001
lemony 0.002
overall aromatic intensity 0.019
oxidized apple 0.007 0.049
acid <0.0001
astringent <0.0001
bitter 0.002
sweet 0.008 <0.0001
Sesquiterpenoids earthy <0.0001 0.002
floral 0.001
grassy/vegetal 0.003 0.031
hay 0.004
honey 0.011
lemony 0.000
overall aromatic intensity 0.048
oxidized apple 0.023
acid 0.003
sweet 0.012

81
4.3.3 Principal component analysis
An initial PCA of the Year 2 data indicated that low levels of sampling adequacy existed,
starting with a low KMO score (KMO=0.344) in the group of hexyl esters. Thus, it was decided
to remove this group from the analysis. This process was repeated for all sensory attributes and
VOC groups, until all scores remained above 0.500, as described in Section 4.2.6. Using this
process, methyl esters (KMO=0.481) and butyl esters (KMO=0.465) were subsequently
removed. Once this threshold was fulfilled, the overall robustness of the model was observed as
KMO=0.705, meaning that the overall sampling adequacy was ‘middling’, and therefore high
enough to proceed with the analysis. Results of the PCA with specific volatile groups removed
led to the creation of a four-factor model with 14 of the remaining 22 sensory attributes/volatile
groups loaded onto one of the principal components. To increase the number of variables
correlated to a component, a varimax rotation was used to reorient and optimize the model, thus
leading to 17 of the remaining 22 variables being correlated to a factor (r>0.6, when rounded).
These four principal components (factors) were shown to represent 85.8% of the variability
within the model. Factor 1 (32.8% of variability) was positively correlated with lemony, acid,
and astringent. Factor 2 (15.2% of variability) was positively correlated with acetate esters and
primary alcohols. Factor 3 (26.9% of variability) was positively correlated with hay, honey,
floral, overall aromatic intensity, sweet, and negatively correlated with bitter. Factor 4 (10.9% of
variability) was positively correlated with oxidized apple, earthy, ethyl esters, propyl esters,
medium-chain aldehydes, and sesquiterpenoids. Grassy/vegetal, anisoles, amyl esters, fatty
alcohols, and ketones were not strongly correlated to any of the four factors. A full summary of
these correlations can be found in Table 4.4.
In the Year 3 dataset, the initial PCA again indicated that low levels of sampling
adequacy existed, starting with a low KMO score (KMO=0.300) in the group of acetate esters.
Following the same procedure as Year 2, earthy (KMO=0.205), hay (KMO=0.333), hexyl esters
(0.375), butyl esters (0.325), anisoles (0.384), and oxidized apple (0.468) were subsequently
removed. The overall robustness of the model was observed as KMO=0.704, and therefore high
enough to proceed with the analysis. Results of the PCA with specific sensory attributes and
volatile groups removed led to the creation of a three-factor model with 15 of the remaining 18
sensory attributes/volatile groups loaded onto one of the principal components. To increase the

82
number of variables correlated to a component, a varimax rotation was used to reorient and
optimize the model, leading to 16 of the remaining 18 variables being correlated to a factor
(r>0.6, when rounded). These three principal components were shown to represent 87.4% of the
variability within the model. Factor 1 (47.9% of variability) was positively correlated with
lemony, acid, and astringent, while being negatively correlated to sweet. Factor 2 (30.4% of
variability) was positively correlated with honey, floral, overall aromatic intensity, and sweet,
while being negatively correlated to grassy/vegetal, and bitter. Factor 3 (9.2% of variability) was
positively correlated with methyl esters, ethyl esters, propyl esters, amyl esters, fatty alcohols,
medium-chain aldehydes, and primary alcohols. Ketones and sesquiterpenoids were not strongly
correlated to any of the three factors. A full summary of these correlations can be found in Table
4.5.

83
Table 4.4 Year 2: Summary of PCA correlations for sensory attributes and volatile groups.
Sensory attribute/VOC group Factor 1
(32.8%)
Factor 2
(15.2%)
Factor 3
(26.9%)
Factor 4
(10.9%)
Oxidized apple -0.181 -0.133 0.130 0.908
Earthy -0.081 -0.331 -0.132 0.751
Hay 0.126 -0.313 0.570 0.237
Honey -0.295 0.084 0.931 -0.006
Lemony 0.897 0.136 -0.081 0.153
Floral -0.169 0.006 0.871 0.121
Grassy/vegetal 0.358 -0.099 -0.479 0.463
Overall aromatic intensity -0.025 0.104 0.843 0.123
Sweet -0.423 -0.009 0.848 -0.184
Acid 0.955 0.049 -0.252 0.093
Bitter 0.292 -0.181 -0.626 0.263
Astringent 0.787 -0.015 -0.381 0.102
Anisoles 0.014 0.263 0.329 -0.054
Acetate esters 0.068 0.958 0.232 -0.059
Ethyl esters 0.181 0.011 0.016 0.749
Propyl esters 0.158 0.116 -0.023 0.674
Amyl esters -0.034 0.547 -0.011 0.085
Fatty alcohols 0.106 0.407 0.012 0.414
Ketones 0.136 0.329 0.081 0.457
Medium-chain aldehydes 0.220 0.235 0.020 0.725
Primary alcohols 0.057 0.802 -0.009 0.016
Sesquiterpenoids 0.022 0.025 -0.037 0.566
Values in bold denote a strong correlation (r>0.6 when rounded to one decimal place)

84
Table 4.5 Year 3: Summary of PCA correlations for sensory attributes and volatile groups.
Sensory attribute/VOC group Factor 1
(47.9%)
Factor 2
(30.4%)
Factor 3
(9.2%)
Honey -0.466 0.811 -0.239
Lemony 0.936 -0.127 0.224
Floral -0.199 0.893 -0.058
Grassy/vegetal 0.342 -0.662 0.120
Overall aromatic intensity 0.025 0.848 -0.100
Sweet -0.626 0.710 -0.190
Acid 0.942 -0.322 0.057
Bitter 0.162 -0.742 0.009
Astringent 0.732 -0.399 -0.105
Methyl esters -0.089 -0.129 0.672
Ethyl esters 0.231 0.033 0.911
Propyl esters 0.164 0.160 0.858
Amyl esters -0.066 -0.171 0.683
Fatty alcohols 0.063 -0.050 0.754
Ketones -0.092 -0.103 0.456
Medium-chain aldehydes 0.252 -0.033 0.748
Primary alcohols 0.236 -0.315 0.576
Sesquiterpenoids 0.265 -0.314 0.375
Values in bold denote a strong correlation (r>0.6 when rounded to one decimal place)

85
4.3.4 Generalized procrustes analysis
Results of a GPA in Year 2 highlighted three individual factors that best represented the
variation within the model. Factor 1 was responsible for 34.0% of sensory variation and 51.6%
of volatile variation. Factor 2 represented 32.5% of the sensory variation and 28.4% of the
volatile variation. Factor 3 represented 19.0% of sensory variation and 5.8% of volatile variation.
Within the three factors, a total of 85.5% of sensory and 85.8% of volatile variations were
accounted for. As a whole model, the GPA encompassed 41.6% of the variability on Factor 1,
30.4% on Factor 2, and 12.4% of the variability on Factor 3 for a total of 84.4% cumulative
variability.
Through further analysis, Factor 1 is strongly correlated in the positive direction by
honey, overall aromatic intensity, sweet, acetate esters, hexyl esters, and butyl esters (Table 4.6).
Variables negatively correlated to Factor 1 included grassy/vegetal and bitter. On Factor 2,
lemony, acid, astringent, ethyl esters, propyl esters, fatty alcohols, ketones, and medium-chain
aldehydes were all positively correlated. Factor 3 was represented by oxidized apple, earthy, and
floral all being positively correlated, with no VOC groups having strong correlations.
Results of the data in Year 3 were also represented across four individual factors as
shown in Table 4.6. Factor 1 accounted for 57.6% of the sensory variation and 30.7% of the
volatile variation. Factor 2 was primarily represented by the VOC groups, as it contained 2.9% of
the sensory variation and 38.4% of the volatile variation. Factor 3 represented 14.7% of the
sensory variation, and 11.3% of the volatile variation. And lastly, Factor 4 accounted for 11.0%
of the sensory variation and 5.9% of the volatile variation. Overall, 86.1% of the sensory
variability was accounted for in the model along with 86.4% of volatile variability. As a whole
model, the GPA encompassed 45.4% of the variability on Factor 1, 18.5% on Factor 2, 13.8% on
Factor 3, and 8.4% of the variability on Factor 4, for a total of 86.2% of the variation.
Further analysis of Year 3 showed strong correlations on Factor 1 in the positive direction
for lemony, grassy/vegetal, acid, astringent, medium-chain aldehydes, and sesquiterpenoids. In
the negative direction, Factor 1 was correlated with honey, floral, and sweet. Factor 2 was
negatively correlated with acetate esters, ethyl esters, propyl esters, butyl esters, and amyl esters.

86
Factor 3 was only correlated in the positive direction to oxidized apple, and Factor 4 was only
correlated in the negative direction to earthy.
Table 4.6 Year 2 (2018-2019) and Year 3 (2019-2020) correlations of sensory and volatile data
through GPA.
Variables
Year 2 Year 3
Factor 1
(41.6%)
Factor 2
(30.4%)
Factor 3
(12.4%)
Factor 1
(45.4%)
Factor 2
(18.5%)
Factor 3
(13.8%)
Factor 4
(8.4%)
Earthy -0.496 0.123 0.612 -0.114 -0.196 0.345 -0.688
Floral 0.533 -0.018 0.556 -0.604 -0.077 0.217 0.419
Grassy/vegetal -0.570 0.397 0.023 0.621 -0.039 -0.394 -0.387
Hay 0.067 0.000 0.467 -0.264 0.141 0.199 -0.345
Honey 0.704 -0.140 0.474 -0.784 0.156 0.232 0.310
Lemony -0.195 0.805 -0.228 0.761 -0.210 -0.213 0.403
Overall aromatic
intensity
0.599 0.092 0.467 -0.443 -0.115 0.399 0.365
Oxidized apple -0.229 0.234 0.870 0.219 -0.315 0.790 -0.207
Acid -0.357 0.758 -0.354 0.815 -0.070 -0.303 0.203
Astringent -0.456 0.616 -0.369 0.672 0.019 -0.357 -0.057
Bitter -0.640 0.195 -0.122 0.471 -0.047 -0.299 -0.472
Sweet 0.680 -0.380 0.358 -0.819 0.111 0.375 0.112
Acetate esters 0.828 0.415 -0.178 -0.506 -0.671 -0.467 -0.005
Amyl esters 0.310 0.280 -0.196 0.213 -0.612 -0.187 -0.273
Anisoles 0.415 0.151 0.026 -0.220 -0.046 -0.266 0.159
Butyl esters 0.576 0.489 0.132 -0.200 -0.690 0.206 -0.260
Ethyl esters -0.336 0.618 0.520 0.513 -0.633 0.229 0.250
Fatty alcohols -0.011 0.616 0.070 0.400 -0.525 0.084 -0.192
Hexyl esters 0.600 0.325 0.081 -0.475 -0.288 -0.001 0.232
Ketones 0.020 0.591 0.162 0.120 -0.403 -0.223 -0.287
Medium-chain
aldehydes
-0.233 0.733 0.394 0.609 -0.411 0.231 0.038

87
Table 4.6 Continued.
Variables
Year 2 Year 3
Factor 1
(41.6%)
Factor 2
(30.4%)
Factor 3
(12.4%)
Factor 1
(45.4%)
Factor 2
(18.5%)
Factor 3
(13.8%)
Factor 4
(8.4%)
Methyl esters -0.036 0.089 0.061 0.356 -0.372 0.421 -0.159
Primary alcohols 0.494 0.478 -0.339 0.543 -0.449 -0.258 -0.294
Propyl esters -0.236 0.610 0.475 0.332 -0.657 0.310 0.379
Sesquiterpenoids -0.174 0.374 0.357 0.617 -0.070 0.016 -0.100
Values in bold denote a strong correlation (r>0.6 when rounded to one decimal place)
4.3.5 Multi-factor analysis
An initial MFA was run on the sensory DA, VOC, and physicochemical datasets. As an
indicator of the strength of the relationship between each dataset, the random-variable (RV)
coefficient was observed as 0.793 for sensory data, 0.560 for VOC data, and 0.751 for
physicochemical data in Year 2, and 0.745 for sensory data, 0.561 for VOC data, and 0.770 for
physicochemical data in Year 3. Due to the low RV coefficient values for the VOC data, the
physicochemical data was assigned as supplementary data. This allowed for a better
understanding of the true relationship between sensory and VOC analyses.
Results of the final MFA showed that 84.3% of the total variation was captured by four
factors in Year 2 (Table 4.7). Figures 4.1 and 4.2 show plots of Factors 1, 2, and 3. Of these
factors, Factor 1 (33.9% of variation) represented honey, overall aromatic intensity, sweet,
acetate esters, butyl esters, and hexyl esters being strongly correlated in the positive direction,
and grassy/vegetal, bitter, and astringent opposing these in the negative direction. Factor 2
(28.9% of variation) represented lemony, acid, astringent, primary alcohols, TA (as a
supplementary variable), and TA/°Brix ratio (as a supplementary variable). Factor 3 (13.8% of
variation) represented oxidized apple, earthy, ethyl esters, propyl esters, and medium-chain
aldehydes in the positive direction. Factor 4 (7.7% of variation) did not have a strong correlation

88
to any of the sensory attributes or volatile compound groups but did have a strong positive
correlation to the supplementary variable of °Brix.
For Year 3, the final MFA captured 72.4% of the variation across three factors (Table
4.7). Plots of Factors 1, 2, and 3 can be found in Figures 4.3 and 4.4. On Factor 1 (33.0% of
variation), strong positive correlations existed for lemony, grassy/vegetal, acid, bitter,
sesquiterpenoids, and the supplementary variables of TA and TA/°Brix ratio. Alternatively,
Factor 1 was represented in the negative direction by honey, floral, sweet, acetate esters, and the
supplementary variable pH. Factor 2 (25.2% of variation) was represented in the positive
direction by acetate esters. Factor 3 (14.1% of variation) was composed of oxidized apple,
methyl esters, ethyl esters, propyl esters, fatty alcohols, and medium-chain aldehydes, all in the
negative direction.
Table 4.7 Summary of MFA results in Years 2 and 3, with strength of correlations found on four
factors (Year 2), and three factors (Year 3).
Year 2 Year 3
Variables Factor 1
(33.9%)
Factor 2
(28.9%)
Factor 3
(13.8%)
Factor 4
(7.7%)
Factor 1
(33.0%)
Factor 2
(25.2%)
Factor 3
(14.1%)
Oxidized Apple -0.117 -0.060 0.803 -0.202 0.146 -0.008 -0.684
Earthy -0.399 -0.093 0.578 -0.206 -0.148 -0.019 -0.274
Hay 0.048 -0.197 0.392 0.516 -0.239 -0.178 0.041
Honey 0.725 -0.346 0.389 0.397 -0.748 -0.424 -0.130
Lemony -0.325 0.778 0.124 0.333 0.729 0.456 0.106
Floral 0.548 -0.265 0.499 0.428 -0.599 -0.224 -0.238
Grassy/vegetal -0.555 0.366 0.188 -0.141 0.593 0.303 0.180
Overall aromatic
intensity 0.579 -0.104 0.412 0.492 -0.439 -0.144 -0.246
Sweet 0.704 -0.516 0.187 0.351 -0.794 -0.445 -0.237
Acid -0.496 0.787 -0.015 0.353 0.805 0.418 0.273
Bitter -0.644 0.273 -0.074 -0.187 0.448 0.276 0.190
Astringent -0.554 0.659 -0.047 0.185 0.667 0.325 0.323

89
Table 4.7 Continued.
Year 2 Year 3
Variables Factor 1
(33.9%)
Factor 2
(28.9%)
Factor 3
(13.8%)
Factor 4
(7.7%)
Factor 1
(33.0%)
Factor 2
(25.2%)
Factor 3
(14.1%)
Anisoles 0.402 0.125 0.107 0.158 -0.221 0.065 0.141
Acetate esters 0.797 0.582 -0.110 -0.071 -0.621 0.760 0.149
Methyl esters 0.007 0.092 0.072 -0.389 0.260 0.123 -0.675
Ethyl esters -0.266 0.291 0.821 -0.207 0.375 0.419 -0.718
Propyl esters -0.177 0.344 0.716 -0.190 0.205 0.399 -0.712
Butyl esters 0.550 0.540 0.139 0.035 -0.308 0.525 -0.332
Amyl esters 0.342 0.330 0.014 -0.288 0.070 0.504 -0.429
Hexyl esters 0.616 0.446 0.051 -0.323 -0.501 0.251 0.018
Fatty alcohols 0.060 0.426 0.520 -0.327 0.267 0.335 -0.628
Ketones 0.075 0.402 0.527 -0.222 0.007 0.348 -0.290
Medium-chain
aldehydes -0.164 0.432 0.786 -0.215 0.500 0.233 -0.636
Primary alcohols 0.506 0.577 -0.042 -0.319 0.419 0.497 -0.277
Sesquiterpenoids -0.109 0.185 0.520 -0.182 0.580 0.079 -0.221
TA1 -0.407 0.672 0.105 0.445 0.596 0.299 0.313
pH1 0.540 -0.484 -0.196 -0.225 -0.744 -0.261 -0.218
°Brix1 0.022 0.054 -0.136 0.572 -0.436 -0.194 0.049
TA/°Brix ratio1 -0.453 0.725 0.180 0.327 0.733 0.353 0.264
1Indicates a variable that was added into the data as supplementary data, therefore not altering
results
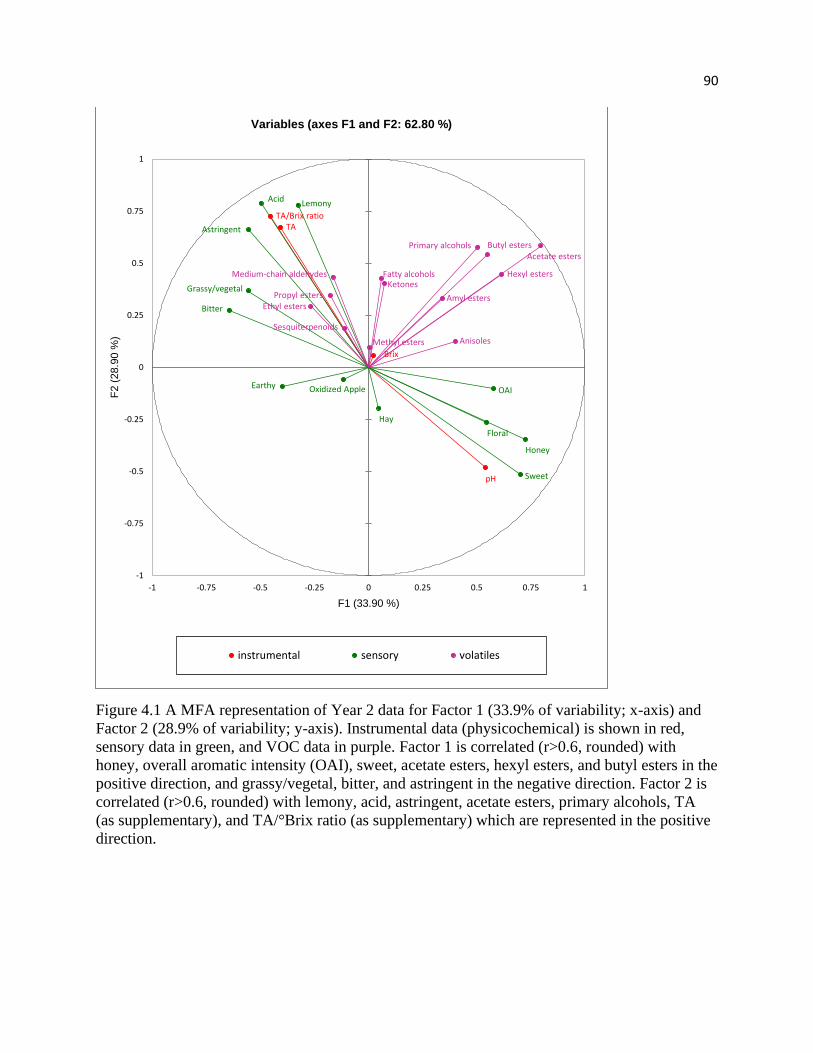
90
Figure 4.1 A MFA representation of Year 2 data for Factor 1 (33.9% of variability; x-axis) and
Factor 2 (28.9% of variability; y-axis). Instrumental data (physicochemical) is shown in red,
sensory data in green, and VOC data in purple. Factor 1 is correlated (r>0.6, rounded) with
honey, overall aromatic intensity (OAI), sweet, acetate esters, hexyl esters, and butyl esters in the
positive direction, and grassy/vegetal, bitter, and astringent in the negative direction. Factor 2 is
correlated (r>0.6, rounded) with lemony, acid, astringent, acetate esters, primary alcohols, TA
(as supplementary), and TA/°Brix ratio (as supplementary) which are represented in the positive
direction.
TA
pH
Brix
TA/Brix ratio
Oxidized AppleEarthy
Hay
Honey
Lemony
Floral
Grassy/vegetal
OAI
Sweet
Acid
Bitter
Astringent
Anisoles
Acetate esters
Methyl esters
Ethyl estersPropyl esters
Butyl esters
Amyl esters
Hexyl estersFatty alcoholsKetones
Medium-chain aldehydes
Primary alcohols
Sesquiterpenoids
-1
-0.75
-0.5
-0.25
0
0.25
0.5
0.75
1
-1 -0.75 -0.5 -0.25 0 0.25 0.5 0.75 1
F2
(28.9
0 %
)
F1 (33.90 %)
Variables (axes F1 and F2: 62.80 %)
instrumental sensory volatiles

91
Figure 4.2 A MFA representation of Year 2 data for Factor 1 (33.9% of variability; x-axis) and
Factor 3 (13.8% of variability; y-axis). Instrumental data (physicochemical) is shown in red,
sensory data in green, and VOC data in purple. Factor 1 is correlated (r>0.6, rounded) with
honey, overall aromatic intensity (OAI), sweet, acetate esters, hexyl esters, and butyl esters in the
positive direction, and grassy/vegetal, bitter, and astringent in the negative direction. Factor 3 is
correlated (r>0.6, rounded) with oxidized apple, earthy, ethyl esters, propyl esters, and medium-
chain aldehydes, all in the positive direction.
TA
pHBrix
TA/Brix ratio
Oxidized Apple
Earthy
Hay
Honey
Lemony
Floral
Grassy/vegetal
OAI
Sweet
Acid
BitterAstringent
Anisoles
Acetate esters
Methyl esters
Ethyl esters
Propyl esters
Butyl esters
Amyl estersHexyl esters
Fatty alcoholsKetones
Medium-chain aldehydes
Primary alcohols
Sesquiterpenoids
-1
-0.75
-0.5
-0.25
0
0.25
0.5
0.75
1
-1 -0.75 -0.5 -0.25 0 0.25 0.5 0.75 1
F3
(13.7
7 %
)
F1 (33.90 %)
Variables (axes F1 and F3: 47.67 %)
instrumental sensory volatiles

92
Figure 4.3 A MFA representation of Year 3 data for Factor 1 (33.0% of variability; x-axis) and
Factor 2 (25.2% of variability; y-axis). Instrumental data (physicochemical) is shown in red,
sensory data in green, and VOC data in purple. Factor 1 is correlated (r>0.6, rounded) with
lemony, grassy/vegetal, acid, astringent, sesquiterpenoids, TA (as supplementary), and TA/°Brix
ratio (as supplementary) in the positive direction, and honey, floral, sweet, acetate esters, and pH
(as supplementary) in the negative direction. Factor 2 is correlated (r>0.6, rounded) with acetate
esters in the positive direction.
TA
pHBrix
TA/Brix
Oxidized appleEarthy
Hay
Honey
Lemony
Floral
Grassy/vegetal
OAI
Sweet
Acid
Bitter
Astringent
Anisoles
Acetate esters
Methyl esters
Ethyl estersPropyl esters
Butyl esters Amyl esters
Hexyl esters
Fatty alcoholsKetones
Medium-chain aldehydes
Primary alcohols
Sesquiterpenoids
-1
-0.75
-0.5
-0.25
0
0.25
0.5
0.75
1
-1 -0.75 -0.5 -0.25 0 0.25 0.5 0.75 1
F2
(25.2
3 %
)
F1 (33.01 %)
Variables (axes F1 and F2: 58.25 %)
instrumental sensory volatiles

93
Figure 4.4 A MFA representation of Year 3 data for Factor 1 (33.0% of variability; x-axis) and
Factor 3 (14.1% of variability; y-axis). Instrumental data (physicochemical) is shown in red,
sensory data in green, and VOC data in purple. Factor 1 is correlated (r>0.6, rounded) with
lemony, grassy/vegetal, acid, astringent, sesquiterpenoids, TA (as supplementary), and TA/°Brix
ratio (as supplementary) in the positive direction, and honey, floral, sweet, acetate esters, and pH
(as supplementary) in the negative direction. Factor 3 is correlated (r>0.6, rounded) with
oxidized apple, methyl esters, ethyl esters, propyl esters, fatty alcohols, and medium-chain
aldehydes in the negative direction.
TA
pH
Brix
TA/Brix
Oxidized apple
Earthy
Hay
Honey
Lemony
Floral
Grassy/vegetal
OAISweet
Acid
Bitter
Astringent
AnisolesAcetate esters
Methyl estersEthyl estersPropyl esters
Butyl esters
Amyl esters
Hexyl esters
Fatty alcohols
Ketones
Medium-chain aldehydes
Primary alcohols
Sesquiterpenoids
-1
-0.75
-0.5
-0.25
0
0.25
0.5
0.75
1
-1 -0.75 -0.5 -0.25 0 0.25 0.5 0.75 1
F3
(14.1
3 %
)
F1 (33.01 %)
Variables (axes F1 and F3: 47.14 %)
instrumental sensory volatiles

94
4.4 Discussion
As previously stated, the hypothesis of this research paper is that key aroma VOCs exist
which are responsible for the creation of unique flavor perceptions and can therefore be related
to consumer liking. In order to explore this hypothesis, it is essential to build on previous results
identified in Chapter 2, which identified that sweet taste, and honey and floral aromas served as
positively influential drivers in consumer liking. With the present research, it is necessary to
identify the VOC(s) responsible for creating these perceptions, and to then discover additional
intrinsic properties of an apple that may be responsible for the creation of these desired
perceptions, which will be explored as the physicochemical properties of the apple.
4.4.1 Flavor characteristics of volatile organic compounds
The first research objective aimed to determine the VOCs responsible for the flavor
perceptions and relate those to consumer liking. Based on previous research, it is understood that
apples are composed of hundreds of individual VOCs which may or may not play a role in the
overall flavor of an apple (Dixon and Hewett, 2000; Ting et al., 2015). Along with this, Dixon
and Hewett (2000) have described over 20 VOCs known as character-impact volatiles. These
character-impact volatiles are the compounds that may be dominant contributors to the flavor
profiles of apples, whether it be through typical aroma/flavors, aroma intensity, or aroma quality
(Dixon and Hewett, 2000). As described by Dixon and Hewett (2000), these dominant VOCs can
be found in varying quantities across many differing apple varieties. For example, apple varieties
with yellow skin have been reported to produce primarily acetic acid esters, while red-skinned
varieties produce primarily butyric acid esters. More specifically, unique apple varieties have
been described in the literature to be characterized by single VOCs, or VOC groups, such as
Cox’s Orange Pippin, Elstar, Golden Delicious, Jonagold, and Delbard Jubilée (hexyl and butyl
acetates), Granny Smith, Nico, Paula Red, and Summer Red (ethyl butanoate and hexan-1-ol), or
Boskoop and Jacques Lebel (α-farnesene and hexyl 2-methylbutanoate) (Dixon and Hewett,
2000). Although these unique VOCs may be present in high concentrations in apples, it is
important to uncover the impact that these have on sensory perception and consumer liking.
To further understand the impact that these VOCs may have on flavor, two different
flavor databases (Flavornet, 2004; The Good Scents Company, 2021) were accessed, and the

95
flavor profiles of each VOC used in this study were recorded. This information can be found in
Table 4.8. This table shows an individual VOC has a flavor profile composed of a wide variety
of different terms. These flavors will provide an apple with its own unique profile based on
presence of character-impact compounds, other VOCs, and their concentrations found within the
variety. The creation of these compounds varies from year-to-year, dependent on a combination
of the environmental, genetic, and agronomic factors, as depicted by Musacchi and Serra (2018),
thus ultimately influencing the VOC composition and the overall quality of each apple variety.
Table 4.8 Volatile compounds and their established odor/flavor profiles.
Volatile compound Compound grouping Flavor profile
Estragole Anisoles Sweet1, licorice1,2, phenolic1, weedy1,
spice1, celery-like1, anise2
2-methylbutyl acetate Acetate esters Sweet1, banana1, fruity1, estery1,
ripe1, juicy1, fruit/fruity1,2
5-hexene-1-ol, acetate Acetate esters N/A
Butyl acetate Acetate esters Sweet1, fruity1, banana1, tutti frutti1,
pear2
Hexyl acetate Acetate esters Fruit/fruity1,2, green1, fresh1, sweet1,
banana peel1, apple1, pear1, herb2
2-methylpropyl acetate Acetate esters Sweet1, fruit/fruity1,2, banana1, tutti
frutti, apple2, banana2
Isopentyl acetate Acetate esters Sweet1, fruity1, banana1, green1, ripe1
Propyl acetate Acetate esters Estery1, fruity1, ethereal1, tutti frutti1,
banana1, honey1
Pentyl acetate Acetate esters Fruity1, pear1, banana1, ripe1,
banana1, sweet1
Z-2-hexen-1-ol, acetate Acetate esters N/A
Methyl butyrate Methyl esters Fusel1, fruity1, estery1, dairy1, acidic1
Ethyl propionate Ethyl esters Ethereal1, fruit/fruity1,2, sweet1,
winey1, bubble gum1, apple1, grape1
Ethyl butyrate Ethyl esters Fruity1, sweet1, tutti frutti1, apple1,2,
fresh1, ethereal1

96
Table 4.8 Continued.
Volatile compound Compound grouping Flavor profile
Ethyl hexanoate Ethyl esters Sweet1, pineapple1, fruit/fruity1,2,
waxy1, banana1, green1, estery, apple
peel2
Isopropyl butyrate Propyl esters Sweet1, fruity1, estery1, ethereal1,
pineapple1, ripe1
2-methylpropyl
butanoate
Propyl esters Sweet1, fruity1, pineapple1, apple1,
rummy1, bubble gum1, tutti frutti1,
fruit1, overripe fruit1, tropical fruit1
Propyl propionate Propyl esters Sweet1, tropical1, green1, fruity1
Propyl butyrate Propyl esters Sweet1, fruity1, tutti frutti1, bubble
gum1, pineapple1,2, green1, solvent2
Propyl hexanoate Propyl esters Pineapple1, fruit/fruity1,2, sweet1,
tropical1, fresh1, green1, juicy1
Butyl 2-methylbutanoate† Butyl esters Green1, fruity1, cocoa1
Butyl butyrate Butyl esters Sweet1, fruity1, ethereal1, tropical1,
rummy1, cherry1, ripe fruit1,
elderberry1, fatty1
Butyl propionate Butyl esters Fruity1, sweet1, banana1, tropical1,
tutti frutti1
Butyl octanoate† Butyl esters Buttery1, ethereal1, herbal1, fruit2
Butyl hexanoate Butyl esters Fruit/fruity1,2, pineapple1, green1,
waxy1, tutti frutti1, juicy1,
fermented1, fruity1
3-methylbutyl hexanoate Amyl esters Fruity1, sweet1, pineapple1, pungent1,
sour1, cheesy1
Hexyl 2-methylbutanoate Hexyl esters Green1, waxy1, fruity1, apple1,
banana1, woody1, tropical1, spicy1
Hexyl hexanoate Hexyl esters Sweet1, fruity1, green1, tropical1,
apple peel2, peach2
Hexyl octanoate Hexyl esters Green1,2, apple1, fruity1, berry1,
fresh1, waxy1, herb1,2, oil1

97
Table 4.8 Continued.
Hexyl propionate† Hexyl esters Pear1, green1, fruity1, musty1,
overripe fruit1
1-hexanol Fatty alcohols Green1,2, fruity1, apple skin1, oily1,
resin2, flower2
(R)-Sulcatol† Fatty alcohols Sweet1, oily1, green1, coriander1
3-hexen-1-ol† Fatty alcohols Green1, leafy1, grass2, moss2, fresh2
Sulcatone Ketones Green1, vegetable1, musty1, apple1,
banana1, green bean1
2-Hexenal† Medium-chain aldehydes Sweet1, bitter almond1, fruity1,
green1,2, leafy1, apple1,2, plum1,
vegetable1
Hexanal Medium-chain aldehydes Green1, woody1, vegetable1, apple1,
grassy1,2, citrus1, orange1, fresh1,
tallow2, fat2
(Z)-3-Hexenal Medium-chain aldehydes Sharp1, green1,2, grassy1, cooked
apple1, apple skin1, leaf2
1-butanol Primary alcohols Banana1, fusel1
1-pentanol Primary alcohols Fusel1, fermented1, bready1, cereal1,
fruity1
(S)-2-methyl-1-butanol† Primary alcohols Roasted1, winey1, onion1, fruity1,
fusel1, alcoholic1, whiskey1
α-farnesene Sesquiterpenoids Fresh1, green1, vegetable1, celery1,
hay1, fatty1, tropical1, fruity1, wood2,
sweet2
1Data collected from TheGoodScentsCompany.com
2Data collected from Flavornet.org
†Represents odor information only for TheGoodScentsCompany.com
To determine which VOCs are responsible for unique flavor characteristics, results from
the PCA, GPA, and MFA statistical analyses were compared across both years. There were many
similarities among the tests which proves that unique flavor profiles do exist among apple
varieties.

98
Positive drivers of consumer liking were described as sweet taste with honey and floral
aroma/flavors. Based on the results of this research, sweet taste is strongly correlated to acetate
esters, hexyl esters, and butyl esters. Similarly, honey flavor is also linked to acetate, hexyl, and
butyl esters, whereas floral flavor is associated only with acetate esters (See Table 4.9).
Comparing this to the established flavor databases as described in Table 4.8, common
terminology appears for these three different VOC groups. Acetate esters are commonly defined
as sweet, fruity, and ripe, while hexyl esters identify as green, apple, and fruity, and butyl esters
which similarly identify as being sweet, fruity and tropical. These flavor perceptions align with
the expected characteristics as perceived through sensory DA, and VOC quantification and
qualification through GC-MS. Although this is a promising relationship between a potential
correlation of consumer liking and internal VOCs, more information will be needed to justify
these relationships. As seen across both years, relationships between sweet, honey, and floral
with acetate esters are the only relationships shown to be reproducible across both Year 2 and
Year 3. This is hypothesized to be due to differences in the environmental conditions across the
two years. To justify this, the researchers reviewed growing seasons from the OAG (OAG, 2018;
OAG, 2019) who compose a yearly review of the Ontario apple season. In Year 2 of the study,
apples were said to have faced an increase in disease throughout the summer due to extreme
summer temperatures (OAG, 2018; OAG, 2019). Additionally, due to this unique year in
weather, approximately 10-50% of some apple varieties (ex. Honeycrisp) were lost due to drop
(apples falling from the tree prior to ripening; OAG, 2019). Although these environmental
conditions provided added stressors for apple farmers, the weather was said to provide
exceptional flavor to those apples that did make it to market (OAG, 2018). In contrast, the
growing season in Year 3 was said to have faced the wettest spring in the past 45 years (OAG,
2019). This spring weather led to more sprays for scab (a fungal disease; OAG, 2019). As
described in Section 4.1, these sprays may lead to a better overall texture quality in apples,
however they are also detrimental to the flavor, thus influencing the expected results in this study
(Yahia, 1994; Ting et al., 2015).
In addition to identifying the VOC groups that are linked to positive preference drivers
among consumers, it is also beneficial to observe the groups that are correlated to the negative
drivers of liking among consumers. Although these groups may not serve as the primary focus

99
for the top selections coming out of a breeding program, they may help with screening for
avoidance of the specific compound groups. For example, the sensory attribute of overall
aromatic intensity, which was correlated to acetate esters, hexyl esters, and butyl esters, which
were also previously reported to be indicators of positive consumer liking. It is expected that this
is due to a finding described in MacKenzie et al. (unpublished) where consumers described the
most important characteristic of an ideal apple is for it to be flavorful, yet it was found to be a
negative driver of preference when put into practice. Future research should explore this
relationship and aim to delve deeper into which of these specific overall aromatic intensity
flavors consumers like or dislike. Other negative preference drivers included oxidized apple
flavor, which was linked to ethyl esters, propyl esters, medium-chain aldehydes, and
sesquiterpenoids. Earthy flavor was correlated to ethyl esters, propyl esters, medium-chain
aldehydes, and sesquiterpenoids. Lemony flavor was linked to medium-chain aldehydes, ethyl
esters, propyl esters, fatty alcohols, ketones, acetate esters, primary alcohols, and
sesquiterpenoids. Acid taste was correlated to medium-chain aldehydes, ethyl esters, propyl
esters, fatty alcohols, ketones, acetate esters, primary alcohols, and sesquiterpenoids. Astringent
mouthfeel was linked to medium-chain aldehydes, ethyl esters, propyl esters, fatty alcohols,
ketones, acetate esters, primary alcohols, and sesquiterpenoids. Finally, grassy/vegetal flavor was
correlated to sesquiterpenoids and medium-chain aldehydes. Similar to the positive drivers of
liking, these results were not always found to be consistent across both years of the study, but the
trends noted in this research paper may serve as indicators of potential VOC groups that can be
responsible for consumer dislike among apple varieties. See Table 4.9 for a summary of these
findings.

100
Table 4.9 A summary of sensory attributes which were found to be strongly correlated (r>0.6,
rounded) to a common factor with a VOC group, and the listed statistical analyses identifying a
relationship. Correlations are shown based on the corresponding year and factor.
Sensory attribute Statistical test
(ryear,factor)
Compound group Statistical test
(ryear,factor)
Sweet GPA (r2,1=0.680) Acetate esters GPA (r2,1=0.828)
MFA (r2,1=0.704) MFA (r2,1=0.797)
MFA (r3,1=-0.794) MFA (r3,1=-0.621)
Hexyl esters GPA (r2,1=0.600)
MFA (r2,1=0.616)
Butyl esters GPA (r2,1=0.576)
MFA (r2,1=0.550)
Honey GPA (r2,1=0.704) Acetate esters GPA (r2,1=0.828)
MFA (r2,1=0.725) MFA (r2,1=0.797)
MFA (r3,1=-0.748) MFA (r3,1=-0.621)
Hexyl esters GPA (r2,1=0.600)
MFA (r2,1=0.616)
Butyl esters GPA (r2,1=0.576)
MFA (r2,1=0.550)
Floral GPA (r3,1=-0.599) Acetate esters MFA (r3,1=-0.621)
Overall aromatic
intensity
GPA (r2,1=0.599) Acetate esters GPA (r2,1=0.828)
MFA (r2,1=0.579) MFA (r2,1=0.797)
Hexyl esters GPA (r2,1=0.600)
MFA (r2,1=0.616)
Butyl esters GPA (r2,1=0.576)
MFA (r2,1=0.550)
Oxidized apple PCA (r2,4 = 0.908) Ethyl esters PCA (r2,4=0.749)
MFA (r2,3=0.803) MFA (r2,3=0.821)
MFA (r3,3=-0.684) MFA (r3,3=-0.718)
Propyl esters PCA (r2,4=0.674)
MFA (r2,3=0.716)
Medium-chain
aldehydes
PCA (r2,4=0.725)
MFA (r2,3=0.786)
Sesquiterpenoids PCA (r2,4=0.566)
Earthy PCA (r2,4=0.751) Ethyl esters PCA (r2,4=0.749)
MFA (r2,3=0.578) MFA (r2,3=0.821)
Propyl esters PCA (r2,4=0.674)
MFA (r2,3=0.716)
Medium-chain
aldehydes
PCA (r2,4=0.725)
MFA (r2,3=0.786)
101
Table 4.9 Continued.
Sensory attribute Statistical test
(ryear,factor)
Compound group Statistical test
(ryear,factor)
Lemony GPA (r2,2=0.805)
GPA (r3,1=0.761)
Medium-chain
aldehydes
GPA (r2,2=0.733)
MFA (r2,2=0.778) GPA (r3,1=0.609)
MFA (r3,1=0.729) Ethyl esters GPA (r2,2=0.618)
Propyl esters GPA (r2,2=0.610)
Fatty alcohols GPA (r2,2=0.616)
Ketones GPA (r2,2=0.591)
Acetate esters MFA (r2,2=0.582)
Primary alcohols MFA (r2,2=0.577)
Sesquiterpenoids GPA (r3,1=0.617)
MFA (r3,1=0.580)
Acid GPA (r2,2=0.758) Medium-chain
aldehydes
GPA (r2,2=0.733)
GPA (r3,1=0.815) GPA (r3,1=0.609)
MFA (r2,2=0.787) Ethyl esters GPA (r2,2=0.618)
MFA (r3,1=0.805) Propyl esters GPA (r2,2=0.610)
Fatty alcohols GPA (r2,2=0.616)
Ketones GPA (r2,2=0.591)
Acetate esters MFA (r2,2=0.582)
Primary alcohols MFA (r2,2=0.577)
Sesquiterpenoids GPA (r3,1=0.617)
MFA (r3,1=0.580)
Astringent GPA (r2,2=0.616) Medium-chain
aldehydes
GPA (r2,2=0.733)
GPA (r3,1=0.672) GPA (r3,1=0.609)
MFA (r2,2=0.659) Ethyl esters GPA (r2,2=0.618)
MFA (r3,1=0.667) Propyl esters GPA (r2,2=0.610)
Fatty alcohols GPA (r2,2=0.616)
Ketones GPA (r2,2=0.591)
Acetate esters MFA (r2,2=0.582)
Primary alcohols MFA (r2,2=0.577)
Sesquiterpenoids GPA (r3,1=0.617)
MFA (r3,1=0.580)
Grassy/vegetal GPA (r3,1=0.621) Sesquiterpenoids GPA (r3,1=-0.617)
MFA (r3,1=0.593) MFA (r3,1=0.580)
Medium-chain
aldehydes
GPA (r3,1=0.609)

102
4.4.2 Other instrumental measurements responsible for taste and
flavor
The second research objective was to determine whether physicochemical analyses (ex.
pH, °Brix, TA, TA/°Brix ratio) can be related to flavor characteristics. Previous literature has
found that, in comparison to sensory DA, physicochemical properties of an apple are not reliable
indicators of sweet or acid tastes (Iwanami, 2011). These relationships can also be found in
Hoehn et al. (2003), who had attempted to predict consumer liking of apples based on the SSC
content (°Brix) and TA. Furthermore, Harker et al. (2002) determined that SSC was not a reliable
indicator of sweetness in fruit and recommended to pair this instrumental analysis with an expert
sensory panel to increase the reliability of the data. Hoehn et al. (2003) was able to show that
these intrinsic indicators were able to show correlations in some apple varieties, while others had
weak correlations.
As shown in the present research, the addition of physicochemical data into the sensory
and VOC datasets resultantly lowered the strength of the relationships of the sensory DA and
VOC groupings. When a trial of GPA with added physicochemical data was run, the
physicochemical data were highly correlated with each other (TA and TA/°Brix ratio, inverse to
pH) and the tastes of sweet (pH, °Brix) and acid (TA, TA/°Brix ratio). Similarly, when the
physicochemical data was added into the MFA, the RV coefficients, representing the strength of
the relationship, were lowered for the VOC dataset, while having strong correlations for the
sensory and physicochemical data, again representing the correlations between sweet and acid
tastes as well as TA, °Brix, TA/°Brix ratio, and pH. For these reasons, the physicochemical data
was used only as supplementary data in the MFA, and excluded from the GPA, thus not
influencing the results of the sensory DA and VOC groups. Interestingly, the MFA results of the
supplementary physicochemical data still managed to highlight potential connections between
the negative preference drivers, as TA and TA/°Brix ratio were found to be on the same factor
(Factor 2) as lemony, acid, astringent, acetate esters, and primary alcohols in Year 2, and on
Factor 1 in Year 3, with TA and TA/°Brix ratio found in the positive direction along with
lemony, grassy /vegetal, acid, astringent, and sesquiterpenoids, and pH being in the negative
direction along with the positive preference drivers of honey, floral, sweet, and acetate esters.

103
This information helps to explain the final objective, as we can relate pH with our positive
drivers of consumer liking. High concentration of TA, or a high TA/°Brix ratio can be linked to a
negative impact of consumer liking and should therefore be used as an indicator of consumer
dislike among apple varieties.
4.5 Conclusions and future research
The present research elaborates on the work of MacKenzie et al. (unpublished) and
Bowen et al. (2018) at Vineland. Bowen et al. (2018) combined sensory DA data with consumer
evaluation data to create an external preference map, which identified a preference region now
known as the “Apple Sweet Spot” (Bowen et al., 2018). A continuation of this research was
developed by MacKenzie et al. (unpublished), who targeted apples within this “Apple Sweet
Spot” to uncover the differences between “good” and “great” apple varieties through
distinguishing taste and flavor properties. MacKenzie et al. (unpublished) highlighted two groups
of consumers, one which primarily liked apples with sweet taste, and honey and floral flavors,
with texture coming as a secondary contributor to liking. A second group was also identified who
primarily liked apples based on their texture, with taste and flavor coming as a secondary factor
(MacKenzie et al., unpublished). The research described in this study examined whether the
instrumental measurements of VOCs or physicochemical data (pH, °Brix, TA, TA/°Brix ratio)
can be used as predictors of consumer liking.
To achieve this goal, two research objectives were identified. The first objective was to
identify VOCs responsible for the creation of flavors related to consumer liking, and the second
objective was to determine if the physicochemical analyses of pH, °Brix, TA, and TA/°Brix ratio
may add any additional information to these relationships.
Completion of the first objective was based on previous results from MacKenzie et al.
(unpublished), which identified sweet taste and honey and floral flavors to be responsible for
driving consumer liking. This first objective was conducted through the qualification and
quantification of each VOC by GC-MS. This data was then paired with sensory DA through
multivariate statistics and highlighted unique groups of VOCs that are responsible for preference
in apple varieties both in the positive and negative directions. The second objective was
completed through use of a variety of physicochemical analyses which included pH, °Brix, TA

104
and TA/°Brix ratio. Results from both research objectives have shown that sweet taste and honey
flavor can be linked to acetate esters, hexyl esters, butyl esters, and pH, while floral flavor can be
linked to acetate esters and pH. In addition to these findings, the research has also found an
abundance of VOCs related to consumer dislike, including ethyl esters, propyl esters, acetate
esters, medium-chain aldehydes, fatty alcohols, primary alcohols, ketones, and sesquiterpenoids
as well as physicochemical indicators of dislike which were identified as TA and TA/°Brix ratio.
The findings of this research will be integrated into the apple breeding program at
Vineland and have the potential to be applied as screening parameters to identify apple varieties
that will likely satisfy the desires of apple consumers. This will ultimately save time, money, and
agricultural resources as the breeding program can instead be fast-tracked by the advancement of
the most promising apples from within the breeding program. By putting these screening
parameters into place, a breeding team will be able to highlight potentially unique and flavorful
apples, thus leading to a more consumer-centric approach when taking new apple varieties to the
Ontario market. In addition, as the chemical composition of all apple varieties share many
commonalities, these results can be applied universally within the apple industry and within
other apple breeding programs.
Future research should focus on the collection of additional datapoints through many
differing growing seasons. This will allow the determination of whether the unique growing
conditions described in the two seasons collected for this study are accurate, or whether they may
be outliers which could be causing discrepancies between years.

105
5 General conclusion and future research
The premise of this thesis was based on previous information determined by Bowen et al.
(2018), who combined sensory DA and consumer hedonic evaluations in order to generate an
external preference map to successfully map consumer liking across a large group of diverse
apples. To build on to this research, the aim of the present research acted to answer two
hypotheses. First, Chapter 3 hypothesized that individual apple varieties have characteristic taste
and flavor attributes responsible for driving consumer preference within the “Apple Sweet Spot”
as defined by Bowen et al. (2018). In Chapter 4, the hypothesis was that key aroma volatiles
exist which are responsible for the creation of unique flavor perception and that these can be
linked to consumer liking.
To test the first hypothesis, Chapter 3 set out three main objectives. First, sensory DA
was used to determine the flavor attributes associated with different apple varieties. This
objective was achieved by evaluating apple varieties across two consecutive growing seasons to
identify the intensity of sensory characteristics for 27 (Year 1) and 28 (Year 2) apple varieties.
Ultimately, this information allowed for the generation and understanding of unique taste and
flavor profiles of each individual apple variety. Second, hedonic consumer evaluation paired
with CATA, as well as questionnaires pertaining to consumer demographics and purchasing
attitudes and behaviors were used to determine which apple varieties consumers like. This was
conducted using a group of untrained consumers screened to be a diverse representation of the
population within the GTA (Canada) who regularly purchase and consume fresh-market apples.
By completing this objective, consumers were able to give a collective liking score for each
tested apple variety and allowed for the classification of consumer groups based on similarities in
liking. In addition to this, the CATA questionnaire allowed for an understanding of the properties
that consumers perceived while tasting the product, as well as the ideation of an ideal apple and
its’ respective characteristics. Other data gathered from questionnaires allowed for an
understanding of consumer profiles and to explore relationships between demographics,
consumer attitudes, and purchase behaviors. The last objective was to combine the sensory and
consumer evaluation data to identify key flavor attributes that can be used as predictors of
consumer liking. This was accomplished via generation of an external preference map focused
on the apples that have already been established as high performing varieties in respect to

106
consumer appeal. This preference map allowed for the separation and identification of unique
taste and flavor profiles of this subset of apples, and highlighted that when paired with juicy and
crisp textures, sweet taste and honey and floral aroma/flavors were the primary drivers of
consumer liking across two different consumer groups (Group 1, 29%; Group 2, 49%). In
addition to this, the preference map helped to identify taste and flavor characteristics such as
acid, bitter, astringent, lemony, and grassy/vegetal which all served as detractors of liking when
found in high intensity within a variety. This data also helped to show the relationship between
each of these consumer groups and their liking towards each individual apple variety as they
were projected onto a map of the sensory and consumer space.
Chapter 4 focused on two primary objectives. The first objective was to identify and
quantify the VOCs responsible for the creation of the liked flavor attributes of honey and floral
perception, while also seeking to define those VOCs responsible for perceptions related to
dislike: lemony and grassy/vegetal. Completion of this objective through GC-MS analysis
allowed for the understanding that the positive preference driver of honey flavor can be linked to
acetate esters, butyl esters, and hexyl esters, while floral can be related to acetate esters. The
negative preference drivers of lemony and grassy/vegetal were successfully linked to ethyl
esters, propyl esters, acetate esters, medium-chain aldehydes, fatty alcohols, primary alcohols,
ketones, and sesquiterpenoids. The second objective of Chapter 4 was to determine whether
physicochemical measurements would provide further insight into an association with positive or
negative preference drivers in respect to consumer liking. This objective was achieved through
TA, pH, and °Brix measurements. Measurements of pH showed relationships with positive
preference drivers (i.e. sweet, honey, floral), while TA and TA/°Brix ratio indicated a
relationship with negative preference drivers (i.e. acid, astringent, lemony). However, as
previously discussed, these relationships may not serve as reliable indicators based on other
results in the literature (Harker et al., 2002; Hoehn et al., 2003; Iwanami, 2011). However, these
results support the principles of the testing procedures, whereas a higher pH would lead to a less
acidic apple, potentially leading to a greater perception of sweetness and its related attributes of
floral and honey. In addition, a higher TA or TA/°Brix ratio indicates a higher level of acidity,
which has been shown to be a negative driver of preference.

107
Therefore, by answering both outlined hypotheses through the written objectives, it can
be concluded that individual apple varieties have unique taste and flavor profiles that are
responsible for consumer preference. Additionally, the sensory characteristics which serve as
attractors or detractors of preference can be explained using instrumental techniques such as GC-
MS or other physicochemical analyses. By understanding these objectives, breeding programs
can implement these instrumental indicators or principles as a means to predict consumer liking
using a much more efficient testing structure, ultimately limiting the necessity for sensory and
consumer evaluation until further along in the breeding process where a smaller group of
products can be evaluated in an efficient manner that is less time consuming, less expensive, and
not as laborious.
Future research should focus on the combination of sensory, consumer, and instrumental
datasets in order to generate predictive models that can help fast track the early stages of apple
breeding to be able to quickly screen apples that will succeed in the market, thus leading to
profitability for businesses, and satisfaction for consumers. If reliable sensorial markers can be
identified and implemented into apple breeding programs, this will pave the way for new apple
varieties with superior fruit quality tailored to the desires of consumers.

108
References
Amyotte, B., Bowen, A. J., Banks, T., Rajcan, I., & Somers, D. J. (2017). Mapping the sensory
perception of apple using descriptive sensory evaluation in a genome wide association
study. PLoS ONE, 12(2). https://doi.org/10.1371/journal.pone.0171710
Aprea, E., Corollaro, M. L., Betta, E., Endrizzi, I., Demattè, M. L., Biasioli, F., & Gasperi, F.
(2012). Sensory and instrumental profiling of 18 apple cultivars to investigate the relation
between perceived quality and odour and flavour. Food Research International, 49(2), 677–
686. https://doi.org/10.1016/j.foodres.2012.09.023
Aprea, E., Charles, M., Endrizzi, I., Laura Corollaro, M., Betta, E., Biasioli, F., & Gasperi, F.
(2017). Sweet taste in apple: The role of sorbitol, individual sugars, organic acids and
volatile compounds. Scientific Reports, 1–10. https://doi.org/10.1038/srep44950
Atkinson, R. G. (2018). Phenylpropenes: Occurrence, Distribution, and Biosynthesis in Fruit.
Journal of Agricultural and Food Chemistry, 66(10), 2259–2272.
https://doi.org/10.1021/acs.jafc.6b04696
Bai, J., Baldwin, E. A., Goodner, K. L., Mattheis, J. P., & Brecht, J. K. (2005). Response of four
apple cultivars to 1-methylcyclopropene treatment and controlled atmosphere storage.
HortScience, 40(5), 1534–1538. https://doi.org/10.21273/hortsci.40.5.1534
Beaudry, R., & Watkins, C. (2001). Use of 1-MCP on Apples. Perishables Handling Quarterly,
(108), 12–16.
Blankenship, M. L., Grigorova, M., Katz, D. B., & Maier, J. X. (2019). Retronasal Odor
Perception Requires Taste Cortex, but Orthonasal Does Not. Current Biology, 29(1), 62-
69.e3. https://doi.org/10.1016/j.cub.2018.11.011
Blanpied, G. D., & Silsby, K. J. (1992). Predicting Harvest Date Window for Apples. Inform.
Bull. 221. Cornell Coop. Ext. Retrieved from
http://www.uvm.edu/~fruit/treefruit/tf_horticulture/AppleHortBasics/Readings/Predicting+
Harvest+Date+Window+for+Apples.pdf
Bonany, J., Brugger, C., Buehler, A., Carbó, J., Codarin, S., Donati, F., Echevveria, G., Egger,
S., Guerra, W., Hilaire, C., Höller, I., Iglesias, I., Jesionkowska, K., Konopacka, D.,
Kruczynska, D., Martinelli, A., Petiot, C., Sansavini, S., Stehr, R., & Schoorl, F. (2014).
Preference mapping of apple varieties in Europe. Food Quality and Preference, 32(PC),
317–329. https://doi.org/10.1016/j.foodqual.2013.09.010
Boumaza, R., Huché-Thélier, L., Demotes-Mainard, S., Coz, E. Le, Leduc, N., Pelleschi-Travier,
S., Qannari, E. M., Sakr, S., Santagostini, P., Symoneaux, R., & Guérin, V. (2010). Sensory
profiles and preference analysis in ornamental horticulture: The case of the rosebush. Food
Quality and Preference, 21(8), 987–997. https://doi.org/10.1016/j.foodqual.2010.05.003

109
Bowen, A. J., Blake, A., Tureček, J., & Amyotte, B. (2018). External preference mapping: A
guide for a consumer-driven approach to apple breeding. Journal of Sensory Studies,
(January), e12472. https://doi.org/10.1111/joss.12472
Boyette, M., Wilson, L. G., & Estes, E. (1990). Postharvest Cooling and Handling of Apples.
Proceedings of the 20th USENIX Security Symposium. NC State Extension Publications.
Retrieved from https://content.ces.ncsu.edu/postharvest-cooling-and-handling-of-apples#
Chambers IV, E., & Koppel, K. (2013). Associations of volatile compounds with sensory aroma
and flavor: The complex nature of flavor. Molecules, 18(5), 4887–4905.
https://doi.org/10.3390/molecules18054887
Chandrashekar, J., Mueller, K. L., Hoon, M. A., Adler, E., Feng, L., Guo, W., Zuker, C. S., &
Ryba, N. J. P. (2000). T2Rs function as bitter taste receptors. Cell, 100(6), 703–711.
https://doi.org/10.1016/S0092-8674(00)80706-0
Chong, J., Wishart, D. S., & Xia, J. (2019). Using MetaboAnalyst 4.0 for Comprehensive and
Integrative Metabolomics Data Analysis. Current Protocols in Bioinformatics, 68(1), 1–
128. https://doi.org/10.1002/cpbi.86
Chung, S. J., Heymann, H., & Grün, I. U. (2003). Application of GPA and PLSR in correlating
sensory and chemical data sets. Food Quality and Preference, 14(5–6), 485–495.
https://doi.org/10.1016/S0950-3293(03)00010-7
Cliff, M. A., Stanich, K., Lu, R., & Hampson, C. R. (2016). Use of descriptive analysis and
preference mapping for early-stage assessment of new and established apples. Journal of
the Science of Food and Agriculture, 96(6), 2170–2183. https://doi.org/10.1002/jsfa.7334
Corollaro, M. L., Aprea, E., Endrizzi, I., Betta, E., Demattè, M. L., Charles, M., Bergamaschi,
M., Costa, F., Biasioli, F., Grappadelli, L. C., & Gasperi, F. (2014). A combined sensory-
instrumental tool for apple quality evaluation. Postharvest Biology and Technology, 96,
135–144. https://doi.org/10.1016/j.postharvbio.2014.05.016
Corollaro, M. L., Endrizzi, I., Bertolini, A., Aprea, E., Demattè, M. L., Costa, F., Biasioli, F., &
Gasperi, F. (2013). Sensory profiling of apple: Methodological aspects, cultivar
characterisation and postharvest changes. Postharvest Biology and Technology, 77, 111–
120. https://doi.org/10.1016/j.postharvbio.2012.10.010
Daillant-Spinnler, B., MacFie, H. J. H., Beyts, P. K., & Hedderley, D. (1996). Relationships
between perceived sensory properties and major preference directions of 12 varieties of
apples from the Southern Hemisphere. Food Quality and Preference, 7(2), 113–126.
https://doi.org/10.1016/0950-3293(95)00043-7
Defilippi, B. G., Dandekar, A. M., & Kader, A. A. (2005). Relationship of ethylene biosynthesis
to volatile production, related enzymes, and precursor availability in apple peel and flesh

110
tissues. Journal of Agricultural and Food Chemistry, 53(8), 3133–3141.
https://doi.org/10.1021/jf047892x
Delahunty, C. M., Eyres, G., & Dufour, J. P. (2006). Gas chromatography-olfactometry. Journal
of Separation Science, 29(14), 2107–2125. https://doi.org/10.1002/jssc.200500509
Dehlholm, C., Brockhoff, P. B., Meinert, L., Aaslyng, M. D., & Bredie, W. L. P. (2012). Rapid
descriptive sensory methods - Comparison of Free Multiple Sorting, Partial Napping,
Napping, Flash Profiling and conventional profiling. Food Quality and Preference, 26(2),
267–277. https://doi.org/10.1016/j.foodqual.2012.02.012
Diamanti, J., Battino, M., & Mezzetti, B. (2011). Breeding for Fruit Nutritional and
Nutraceutical Quality. In M.A. Jenks & P.J. Bebeli (Eds.), Breeding for Fruit Quality
(pp. 61-79). Wiley-Blackwell. 10.1002/9780470959350
Dixon, J., & Hewett, E. W. (2000). Factors affecting apple aroma/flavour volatile concentration:
A review. New Zealand Journal of Crop and Horticultural Science, 28(3), 155–173.
https://doi.org/10.1080/01140671.2000.9514136
Du, X. F., Kurnianta, A., McDaniel, M., Finn, C. E., & Qian, M. C. (2010). Flavour profiling of
“Marion” and thornless blackberries by instrumental and sensory analysis. Food Chemistry,
121(4), 1080–1088. https://doi.org/10.1016/j.foodchem.2010.01.053
Dupas de Matos, A., Magli, M., Marangon, M., Curioni, A., Pasini, G., & Vincenzi, S. (2018).
Use of verjuice as an acidic salad seasoning ingredient: evaluation by consumers’ liking and
Check-All-That-Apply. European Food Research and Technology, 244(12), 2117–2125.
https://doi.org/10.1007/s00217-018-3120-6
Eggink, P. M., Maliepaard, C., Tikunov, Y., Haanstra, J. P. W., Bovy, A. G., & Visser, R. G. F.
(2012). A taste of sweet pepper: Volatile and non-volatile chemical composition of fresh
sweet pepper (Capsicum annuum) in relation to sensory evaluation of taste. Food
Chemistry, 132(1), 301–310. https://doi.org/10.1016/j.foodchem.2011.10.081
Fan, X., Mattheis, J. P., & Buchanan, D. (1998). Continuous Requirement of Ethylene for Apple
Fruit Volatile Synthesis. Journal of Agricultural and Food Chemistry, 46(5), 1959–1963.
https://doi.org/10.1021/jf970877q
Flavornet. (2004). Flavornet. Retrieved from https://flavornet.org/flavornet.html
Galmarini, M. V., Symoneaux, R., Chollet, S., & Zamora, M. C. (2013). Understanding apple
consumers’ expectations in terms of likes and dislikes. Use of comment analysis in a cross-
cultural study. Appetite, 62, 27–36. https://doi.org/10.1016/j.appet.2012.11.006
Guinard, J. X. (2002). Internal and external preference mapping: Understanding market
segmentation and identifying drivers of liking. ACS Symposium Series, 825, 227–242.
https://doi.org/10.1021/bk-2002-0825.ch018

111
Hampson, C. R., Quamme, H. A., Hall, J. W., MacDonald, R. A., King, M. C., & Cliff, M. A.
(2000). Sensory evaluation as a selection tool in apple breeding. Euphytica, 111(2), 79–90.
https://doi.org/10.1023/A:1003769304778
Harker, F. R., Marsh, K. B., Young, H., Murray, S. H., Gunson, F. A., & Walker, S. B. (2002).
Sensory interpretation of instrumental measurements 2: Sweet and acid taste of apple fruit.
Postharvest Biology and Technology, 24(3), 241–250. https://doi.org/10.1016/S0925-
5214(01)00157-0
Harker, F. R., Gunson, F. A., & Jaeger, S. R. (2003). The case for fruit quality: An interpretive
review of consumer attitudes, and preferences for apples. Postharvest Biology and
Technology, 28(3), 333–347. https://doi.org/10.1016/S0925-5214(02)00215-6
Hoehn, E., Gasser, F., Guggenbühl, B., & Künsch, U. (2003). Efficacy of instrumental
measurements for determination of minimum requirements of firmness, soluble solids, and
acidity of several apple varieties in comparison to consumer expectations. Postharvest
Biology and Technology, 27(1), 27–37. https://doi.org/10.1016/S0925-5214(02)00190-4
Hough, G., Wakeling, I., Mucci, A., Chambers IV, E., Gallardo, I. M., & Alves, L. R. (2006).
Number of consumers necessary for sensory acceptability tests. Food Quality and
Preference, 17(6), 522–526. https://doi.org/10.1016/j.foodqual.2005.07.002
Huang, A. L., Chen, X., Hoon, M. A., Chandrashekar, J., Guo, W., Tränkner, D., Ryba, N. J. P.,
& Zuker, C. S. (2006). The cells and logic for mammalian sour taste detection. Nature,
442(7105), 934–938. https://doi.org/10.1038/nature05084
Iglesias, I., Echeverría, G., & Soria, Y. (2008). Differences in fruit colour development,
anthocyanin content, fruit quality and consumer acceptability of eight “Gala” apple strains.
Scientia Horticulturae, 119(1), 32–40. https://doi.org/10.1016/j.scienta.2008.07.004
International Organization for Standardization. (1998). Fresh fruits and vegetables - Vocabulary
(ISO/DIS Standard No. 7563). Retrieved from https://www.iso.org/standard/14346.html
Iwanami, H. (2011). Breeding for Fruit Quality in Apple. In M.A. Jenks & P.J. Bebeli
(Eds.), Breeding for Fruit Quality (pp. 175-200). Wiley-
Blackwell. 10.1002/9780470959350
Jaeger, S. R., Andani, Z., Wakeling, I. N., & MacFie, H. J. H. (1998). Consumer preferences for
fresh and aged apples: A cross-cultural comparison. Food Quality and Preference, 9(5),
355–366. https://doi.org/10.1016/S0950-3293(98)00031-7
Jaeger, S. R., Antúnez, L., Ares, G., Swaney-Stueve, M., Jin, D., & Harker, F. R. (2018). Quality
perceptions regarding external appearance of apples: Insights from experts and consumers
in four countries. Postharvest Biology and Technology, 146(July), 99–107.
https://doi.org/10.1016/j.postharvbio.2018.08.014

112
Jenks, M. A., & Bebeli, P. J. (2011). Breeding for Fruit Quality. Breeding for Fruit Quality.
https://doi.org/10.1002/9780470959350
Jiang, P., Cui, M., Osman, R., Max, M., & Margolskee, R. F. (2008). Making sense of the sweet
taste receptor. Acs, 48–64. Retrieved from
http://oasys.acs.org/acs/231nm/techprogram/P928561.HTM
Kim, M. K., Jang, H. W., & Lee, K. G. (2018). Sensory and instrumental volatile flavor analysis
of commercial orange juices prepared by different processing methods. Food Chemistry,
267(July 2017), 217–222. https://doi.org/10.1016/j.foodchem.2017.10.129
Kim, M. S. (2020). Investigating the Use of Instrumental Techniques to Evaluate Apple Texture
Quality.
Kouassi, A. B., Durel, C. E., Costa, F., Tartarini, S., van de Weg, E., Evans, K., Fernandez-
Fernandez, F., Govan, C., Boudichevskaja, A., Dunemann, F., Antofie, A., Lateur, M.,
Stankiewicz-Kosyl, M., Soska, A., Tomala, K., Lewandowski, M., Rutkovski, K., Zurawicz,
E., Guerra, W., & Laurens, F. (2009). Estimation of genetic parameters and prediction of
breeding values for apple fruit-quality traits using pedigreed plant material in Europe. Tree
Genetics and Genomes, 5(4), 659–672. https://doi.org/10.1007/s11295-009-0217-x
Krishna Kumar, S., Hern, T., Liscombe, D., Paliyath, G., Sullivan, J. A., & Subramanian, J.
(2020). Changes in the volatile profile of ‘Fantasia’ nectarines [Prunus persica (L.) Batsch,
var. nectarina] treated with an enhanced freshness formulation (EFF) containing hexanal.
Horticulture Environment and Biotechnology, 61(3), 525–536.
https://doi.org/10.1007/s13580-020-00228-8
Landis, B. N., Frasnelli, J., Reden, J., Lacroix, J. S., & Hummel, T. (2005). Differences Between
Orthonasal and Retronasal Olfactory Functions in Patients With Loss of the Sense of Smell.
Archives of Otolaryngology - Head & Neck Surgery, 131, 977–981. Retrieved from
papers2://publication/uuid/65B3B46C-5887-4273-BD14-3DD298D14E2F
Lawless, H. T., & Heymann, H. (2010). Sensory Evaluation of Food: Principles and Practices,
2nd Ed. Food Science Text Series (Second). New York, USA: Springer.
https://doi.org/10.1017/CBO9781107415324.004
Lignou, S., Parker, J. K., Baxter, C., & Mottram, D. S. (2014). Sensory and instrumental analysis
of medium and long shelf-life Charentais cantaloupe melons (Cucumis melo L.) harvested
at different maturities. Food Chemistry, 148, 218–229.
https://doi.org/10.1016/j.foodchem.2013.10.045
MacKenzie, J. R., Duizer, L., & Bowen, A. J. (unpublished). Apple Flavor and Its Effects on
Sensory Characteristics and Consumer Preference.
McGinn, C. (2015). The science of taste. Metaphilosophy, 46(1), 84–103.
https://doi.org/10.1111/meta.12116
113
Mditshwa, A., Fawole, O. A., Vries, F., van der Merwe, K., Crouch, E., & Opara, U. L. (2017).
Minimum exposure period for dynamic controlled atmospheres to control superficial scald
in ‘Granny Smith’ apples for long distance supply chains. Postharvest Biology and
Technology, 127, 27–34. https://doi.org/10.1016/j.postharvbio.2016.12.009
Mehinagic, E., Royer, G., Symoneaux, R., Jourjon, F., & Prost, C. (2006). Characterization of
odor-active volatiles in apples: Influence of cultivars and maturity stage. Journal of
Agricultural and Food Chemistry, 54(7), 2678–2687. https://doi.org/10.1021/jf052288n
Mooi, E., & Sarstedt, M. (2011). A Concise Guide to Market Research. The Process, Data, and
Methods Using IBM SPSS Statistics. Journal of Chemical Information and Modeling (Vol.
53). https://doi.org/10.1017/CBO9781107415324.004
Muche, B. M. (2016). Effect of 1-methylcyclopropene (1-MCP) on the flavour metabolites of
apple juice, (January), 45–46.
Murray, J. M., Delahunty, C. M., & Baxter, I. A. (2001). Descriptive sensory analysis: Past,
present and future. Food Research International, 34(6), 461–471.
https://doi.org/10.1016/S0963-9969(01)00070-9
Musacchi, S., & Serra, S. (2018). Apple fruit quality: Overview on pre-harvest factors. Scientia
Horticulturae, 234(July 2017), 409–430. https://doi.org/10.1016/j.scienta.2017.12.057
Nielsen, S. S. (2019). Food Analysis Laboratory Manual (Third). Springer. Retrieved from
http://cst.ur.ac.rw/library/Food Science books/batch1/Food Analysis Laboratory Manual
Second Edition.pdf
Newilah, G. B. N., Njapndounke, B., Tembe, T. J., Nkouandou, M., Ngombi, N. E., Kendine, V.
C., Manjia, N., Solange, U., & Zambou, N. F. (2018). Optimization of process conditions
for jam production from plantain-like hybrid (CARBAP K74) grown in two agro-ecological
zones of Cameroon. International Journal of …, 6(April), 50–63. Retrieved from
https://www.cabdirect.org/cabdirect/abstract/20193394799
Nieuwenhuizen, N. J., Green, S. A., Chen, X., Bailleul, E. J. D., Matich, A. J., Wang, M. Y., &
Atkinson, R. G. (2013). Functional genomics reveals that a compact terpene synthase gene
family can account for terpene volatile production in apple. Plant Physiology, 161(2), 787–
804. https://doi.org/10.1104/pp.112.208249
Ontario Apple Growers. (2018). Ontario Apple Growers Annual Report - Year Ending October
31, 2018.
Ontario Apple Growers. (2019). Ontario Apple Growers Annual Report - Year Ending October
31, 2019.

114
Passam, H.C., Karapanos, I.C., & Alexopoulos, A.A. (2011). The Biological Basis of Fruit
Quality. In M.A. Jenks & P.J. Bebeli (Eds.), Breeding for Fruit Quality (pp. 5-38).
Wiley- Blackwell. 10.1002/9780470959350
Plotto, A., McDaniel, M. R., & Mattheis, J. P. (2000). Characterization of changes in `Gala’
apple aroma during storage using osme analysis, a gas chromatography-olfactometry
technique. Journal of the American Society for Horticultural Science, 125(6), 714–722.
Roper, S. D. (2015). The taste of table salt. Pflugers Archiv European Journal of Physiology,
467(3), 457–463. https://doi.org/10.1007/s00424-014-1683-z
Rowan, D. D., Hunt, M. B., Dimouro, A., Alspach, P. A., Weskett, R., Volz, R. K., Gardiner, S.
E., & Chagné, D. (2009). Profiling fruit volatiles in the progeny of a “royal gala” x “granny
smith” apple (Malus x domestica) cross. Journal of Agricultural and Food Chemistry,
57(17), 7953–7961. https://doi.org/10.1021/jf901678v
Running, C. A., Craig, B. A., & Mattes, R. D. (2015). Oleogustus: The unique taste of fat.
Chemical Senses, 40(7), 507–516. https://doi.org/10.1093/chemse/bjv036
Sansavini, S., Donati, F., Costa, F., & Tartarini, S. (2004). Advances in apple breeding for
enhanced fruit quality and resistance to biotic stresses: new varieties for the european
market. Journal of Fruit and Ornamental Plant Research, 12(Special ed.), 13–52.
Song, H., & Liu, J. (2018). GC-O-MS technique and its applications in food flavor analysis.
Food Research International, 114(April), 187–198.
https://doi.org/10.1016/j.foodres.2018.07.037
Song, J., & Forney, C. (2007). Flavour volatile production and regulation in apple fruit.
Canadian Journal of Plant Science, 3(2). https://doi.org/10.2212/spr.2007.2.2
Statistics Canada. (2019). Statistical Overview of the Canadian Fruit Industry.
Stone, H., & Sidel, J. L. (2004). Sensory Evaluation Practices. Sensory Evaluation Practices.
https://doi.org/10.1016/b978-012672690-9/50011-1
Symoneaux, R., Galmarini, M. V., & Mehinagic, E. (2012). Comment analysis of consumer’s
likes and dislikes as an alternative tool to preference mapping. A case study on apples. Food
Quality and Preference, 24(1), 59–66. https://doi.org/10.1016/j.foodqual.2011.08.013
Temussi, P. A. (2009). Sweet, bitter and umami receptors: a complex relationship. Trends in
Biochemical Sciences, 34(6), 296–302. https://doi.org/10.1016/j.tibs.2009.02.005
Tesfaye, L. M., Bink, M. C. A. M., van der Lans, I. A., Gremmen, B., & van Trijp, H. C. M.
(2012). Bringing the voice of consumers into plant breeding with Bayesian modelling.
Euphytica, 189(3), 365–378. https://doi.org/10.1007/s10681-012-0765-2

115
The Good Scents Company. (2021). The Good Scents Company. Retrieved from
https://thegoodscentscompany.com
Ting, V. J. L., Soukoulis, C., Silcock, P., Cappellin, L., Romano, A., Aprea, E., Bremer, P. J.,
Mark, T. D., Gasperi, F., & Biasioli, F. (2012). In Vitro and In Vivo Flavor Release from
Intact and Fresh-Cut Apple in Relation with Genetic, Textural, and Physicochemical
Parameters. Journal of Food Science, 77(11). https://doi.org/10.1111/j.1750-
3841.2012.02947.x
Ting, V. J. L., Romano, A., Silcock, P., Bremer, P. J., Corollaro, M. L., Soukoulis, C., Cappellin,
L., Gasperi, F., & Biasioli, F. (2015). Apple Flavor: Linking Sensory Perception to Volatile
Release and Textural Properties. Journal of Sensory Studies, 30, 195–210.
https://doi.org/10.1111/joss.12151
Tsao, R. (2016). Apples. Guelph: Encyclopedia of Food and Health.
https://doi.org/https://doi.org/10.1016/B978-0-12-384947-2.00040-4
Ulrich, D., & Olbricht, K. (2011). Fruit Organoleptic Properties and Potential for Their Genetic
Improvement. In M.A. Jenks & P.J. Bebeli (Eds.), Breeding for Fruit Quality (pp. 61-79).
Wiley- Blackwell. 10.1002/9780470959350
van Kleef, E., van Trijp, H. C. M., & Luning, P. (2006). Internal versus external preference
analysis: An exploratory study on end-user evaluation. Food Quality and Preference, 17(5),
387–399. https://doi.org/10.1016/j.foodqual.2005.05.001
Varela, P., Beltrán, J., & Fiszman, S. (2014). An alternative way to uncover drivers of coffee
liking: Preference mapping based on consumers’ preference ranking and open comments.
Food Quality and Preference, 32, 152–159. https://doi.org/10.1016/j.foodqual.2013.03.004
Vigneau, E., Charles, M., & Chen, M. (2014). External preference segmentation with additional
information on consumers: A case study on apples. Food Quality and Preference, 32, 83–
92. https://doi.org/10.1016/j.foodqual.2013.05.007
Wakeling, I. N., & MacFie, H. J. H. (1995). Designing consumer trials balanced for first and
higher orders of carry-over effect when only a subset of k samples from t may be tested.
Food Quality and Preference, 6(4), 299–308. https://doi.org/10.1016/0950-3293(95)00032-
1
Yahia, E. (1994). Apple Flavor.pdf. Hermosillo, Sonora, Mexico: Centro de Investigacion en
Alimentacion y Desarrollo, A.C.A.P.
Yang, X., Song, J., Campbell-Palmer, L., Fillmore, S., & Zhang, Z. (2013). Effect of ethylene
and 1-MCP on expression of genes involved in ethylene biosynthesis and perception during
ripening of apple fruit. Postharvest Biology and Technology, 78, 55–66.
https://doi.org/10.1016/j.postharvbio.2012.11.012

116
Ye, W., Chang, R. B., Bushman, J. D., Tu, Y. H., Mulhall, E. M., Wilson, C. E., Cooper, A. J.,
Chick, W. S., Hill-Eubanks, D. C., Nelson, M. T., Kinnamon, S. C., & Liman, E. R. (2015).
The K+ channel KIR2.1 functions in tandem with proton influx to mediate sour taste
transduction. Proceedings of the National Academy of Sciences of the United States of
America, 113(2), E229–E238. https://doi.org/10.1073/pnas.1514282112
Yue, C., & Tong, C. (2011). Production and Marketing Reports: Consumer Preferences and
Willingness to Pay for Existing and New Apple Varieties: Evidence from Apple Tasting
Choice Experiments. HortTechnology, 21(3), 376–383.
https://doi.org/10.21273/HORTTECH03578-16
Zhu, D., Ren, X., Wei, L., Cao, X., Ge, Y., Liu, H., & Li, J. (2020). Collaborative analysis on
difference of apple fruits flavour using electronic nose and electronic tongue. Scientia
Horticulturae, 260. https://doi.org/10.1016/j.scienta.2019.108879

117
Appendices
Appendix 1: Consent to participate in research, provided to each consumer
panelist

118
Appendix 2: Consumer evaluation example instructions, with description of
apple followed by description of an ideal apple

119
Appendix 3: Series of questions asked during the consumer evaluation
regarding consumption behavior, purchase habits, and demographic
information

120
Appendix 3 Continued.

121
Appendix 3 Continued.

122
Appendix 3 Continued.

123
Appendix 3 Continued.

124
Appendix 3 Continued.

125
Appendix 4: Consumer evaluation visual preference paper ballot