EXPLORING THE MARINE ECOSYSTEMS OF NIUE ISLAND AND ... · National Geographic Pristine Seas, in...
84
EXPLORING THE MARINE ECOSYSTEMS OF NIUE ISLAND AND BEVERIDGE REEF SCIENTIFIC REPORT TO THE GOVERNMENT OF NIUE September–October 2016 A collaboration between National Geographic Pristine Seas, the government of Niue, Oceans 5, and the Pacific Community
Transcript of EXPLORING THE MARINE ECOSYSTEMS OF NIUE ISLAND AND ... · National Geographic Pristine Seas, in...

EXPLORING THE MARINE ECOSYSTEMS OF NIUE ISLAND
AND BEVERIDGE REEF
SCIENTIFIC REPORT TO THE GOVERNMENT OF NIUE
September–October 2016
A collaboration between National Geographic Pristine Seas, the government of Niue, Oceans 5, and the Pacific Community
Citation: Friedlander AM, Arribas J, Ballesteros E, Betz J, Bosserelle P, Brown E, Caselle JE, Cramp JE, Gataua L, Helagi N, Mayorga J, McAloney D, Myers D, Pasisi B, Richmond’Rex A, Rose P, Salinas-de-León P, San Félix M, Thompson C, Turchik A, Sala E. 2017. Exploring the marine ecosystems of Niue and Beveridge Reef. Report to the government of Niue. National Geographic Pristine Seas.
Alan M Friedlander1,2, Jose Arribas1,3, Enric Ballesteros4,
Jon Betz1, Pauline Bosserelle5, Eric Brown6, Jennifer E Caselle7,
Jessica E. Cramp8,9, Launoa Gataua10, Jonatha Giddens2,
Nadia Helagi5,10, Juan Mayorga1,15,16, Dave McAloney1,
Dan Myers1, Brendon Pasisi10,11, Alana Richmond’Rex10,
Paul Rose1,12, Pelayo Salinas de León 1,13, Manu San Félix1,3,
Chris Thompson14, Alan Turchik1, Enric Sala1
1 National Geographic Pristine Seas 2 University of Hawaii 3 Vellmari, Formentera, Spain 4 Centre d’Estudis Avançats de Blanes-CSIC, Spain 5 Pacific Community, Nouméa, New Caledonia 6 Kalaupapa National Historical Park,
US National Park Service, Molokai, Hawaii 7 Marine Science Institute, University of California,
Santa Barbara (UCSB) 8 Oceans 5 9 Sharks Pacific, Rarotonga, Cook Islands 10 Department of Agriculture, Forestry, and Fisheries, Niue 11 Niue Ocean Wide Project (NOW) 12 Royal Geographic Society, London, UK 13 Charles Darwin Research Station, Galapagos 14 Centre for Marine Futures, University of Western Australia 15 Sustainable Fisheries Group 16 UCSB

TABLE OF CONTENTS
EXECUTIVE SUMMARY . . . . . . . . . . . . . . . . . . . . . . . . . . . . . . . . . . . . . . . . . . . . . . . . . . . . . . . . . . . . . . . 3
INTRODUCTION . . . . . . . . . . . . . . . . . . . . . . . . . . . . . . . . . . . . . . . . . . . . . . . . . . . . . . . . . . . . . . . . . . . . . . . . 7
RESULTS . . . . . . . . . . . . . . . . . . . . . . . . . . . . . . . . . . . . . . . . . . . . . . . . . . . . . . . . . . . . . . . . . . . . . . . . . . . . . . . . . 11Benthos
Corals
Algae
Echinoderms
Commercially important invertebrates
Connectivity studies
Fishes
Deep sea
Fishing effort in and around Niue’s EEZ
Microplastics
Micropaleontology
DISCUSSION . . . . . . . . . . . . . . . . . . . . . . . . . . . . . . . . . . . . . . . . . . . . . . . . . . . . . . . . . . . . . . . . . . . . . . . . . . 45
PRISTINE SEAS’ RECOMMENDATIONS . . . . . . . . . . . . . . . . . . . . . . . . . . . . . . . . . . . . . . . . 54
METHODS . . . . . . . . . . . . . . . . . . . . . . . . . . . . . . . . . . . . . . . . . . . . . . . . . . . . . . . . . . . . . . . . . . . . . . . . . . . . . . 57
REFERENCES . . . . . . . . . . . . . . . . . . . . . . . . . . . . . . . . . . . . . . . . . . . . . . . . . . . . . . . . . . . . . . . . . . . . . . . . . . 61
APPENDICES . . . . . . . . . . . . . . . . . . . . . . . . . . . . . . . . . . . . . . . . . . . . . . . . . . . . . . . . . . . . . . . . . . . . . . . . . . 64Appendix I . Expedition Team .
Appendix II . List of scleractinian (hard) corals at Niue and Beveridge Reef .
Appendix III . List of algae observed at Niue and Beveridge Reef .
Appendix IV . List of all invertebrate species recorded at Niue and Beveridge Reef .
Appendix V . List of fish species and families observed at Niue and Beveridge Reef .

EX
EC
UT
IVE
SU
MM
AR
Y

National Geographic Pristine Seas, in collaboration with the
government of Niue, Oceans 5, and the Pacific Community,
conducted an 18-day expedition to Niue in October 2016 to perform
comprehensive quantitative surveys of the health of its marine
environment, including the largely unknown Beveridge Reef . The
goals of the expedition were to assess the biodiversity of the marine
environment, build capacity of Niue’s fisheries department in survey
methodologies, and inform the island’s ongoing marine spatial
planning process . Prior to our expedition, there had not been a
comprehensive survey of Niue’s marine ecosystems .
We conducted in situ surveys of fishes (N = 370), corals and other components of the
shallow-water marine ecosystem (N = 70) at 34 locations around Niue and Beveridge Reef .
Baited Remote Underwater Video Systems (BRUVS) were deployed at 50 stations around
each island to assess sharks and other predators . We explored open ocean communities
using baited stereocameras at 10 sites each around Niue and Beveridge Reef with a total of
100 individual camera drops . National Geographic’s deep-sea dropcameras were deployed at
11 stations between 276 and 2,447 m depth . Macro-invertebrates were assessed using manta
tows at Niue (N = 6; 10 .8 km total) and Beveridge Reef (N = 4; 7 .2 km total) .
During the expedition, we recorded a total of 300 species of fishes . Fish biomass was more
than twice as large at Beveridge Reef than at Niue . In addition, biomass of piscivores was
7 .5 times larger at Beveridge Reef than at Niue . Fish biomass around Niue was some of the
lowest that we have observed in the Pacific . We found no differences in fish biomass between
the MPA and adjacent areas at Niue despite 20+ years of protection . Fishing line was evident
throughout the MPA, suggesting a lack of compliance with the no-take area .
EXECUTIVESUMMARY
3
EXPLORING THE MARINE ECOSYSTEMS OF NIUE ISLAND AND BEVERIDGE REEF | NATIONAL GEOGRAPHIC PRISTINE SEAS | MARCH 2017

Relative to other sites sampled during Pristine Seas expeditions, the open ocean fish
assemblage at Niue and Beveridge Reef was found to be depauperate . This low species
richness and abundance may reflect the low natural productivity of the region and/or the
result of overfishing . The little known Blainville’s beaked whale (Mesoplodon densirostris)
was observed at Beveridge Reef, which is the first record of this species from Niue’s waters .
Previous studies suggest strong site fidelity for this species, thus this may be a resident
population . Despite our sampling late in the season, humpback whales were commonly
observed close to the reef at Beveridge Reef . We observed mothers with calves, and males
were heard singing on several dives .
Four species of sharks and rays were observed on Baited Remote Underwater Video Systems:
grey reef shark (Carcharhinus amblyrhynchos), whitetip reef shark (Triaenodon obesus), spotted
eagle ray (Aetobatus narinari), and marbled stingray (Himantura oxyrhyncha) . Densities of grey
reef sharks at Beveridge Reef were much greater than recorded elsewhere around the world to
date using BRUVS . Relative to Beveridge Reef, a lower abundance of sharks and large predatory
fishes was recorded on Niue, which likely suggests overfishing of these socioeconomically
important species . Three species of globally endangered marine turtles were also recorded
on BRUVS: loggerhead sea turtle (Caretta caretta), green sea turtle (Chelonia mydas) and
hawksbill sea turtle (Eretmochelys imbricata) .
Our deep-sea video camera footage revealed a relatively diverse assemblage of species, with at
least 23 taxa of deepwater fishes from 14 families observed . We identified a smalltooth sand tiger
shark (Odontaspis ferox) at 506 m depth, representing the first record of this species at Niue .
We recorded 121 species of coral on the expedition . Percent coral cover was relatively low
overall (Niue = 19% and Beveridge Reef = 15%), with the lowest values at windward locations on
the south and east coastlines at both locations . Higher coral cover on the leeward side of Niue
(26% vs . 8% on the windward side) and similar size structure of coral colonies reflect growth
since Cyclone Heta in 2004 . The algal assemblage was depauperate on both reef ecosystems,
likely due to high herbivory and low productivity .
High densities of giant clams at Beveridge Reef suggest a healthy population with low fishing
pressure . In contrast, Niue had low densities of giant clams even on the windward side of the
reef, which receives less fishing pressure than the leeward coast .
4

Our results highlight both the global importance of Beveridge Reef as a shark refuge and the
low standing stock of nearshore fishes around Niue . Grey reef sharks, a globally threatened
species, were observed on nearly every dive at Beveridge Reef and accounted for more than
one-third of the total fish biomass at this remote atoll . These results indicate the extraordinary
natural value of Beveridge Reef, and the importance of protecting this resource in the longterm .
Our results also indicate that due to the low productivity and isolation of the region, Niue’s
marine ecosystems are highly vulnerable to both human and natural impacts, including fishing
activity, storm events, and climate change . Therefore, local marine resources require careful
management and effective enforcement to provide food security for the people of Niue
into the future . Measures should include establishing small no-take areas around Niue with
surrounding well-managed fishing areas . In addition, our results strongly suggest the need to
establish a world-class no-take marine reserve in and around Beveridge Reef . These actions will
raise Niue’s global profile as a pristine ecotourism destination, as will its contribution to global
marine conservation .
5
EXPLORING THE MARINE ECOSYSTEMS OF NIUE ISLAND AND BEVERIDGE REEF | NATIONAL GEOGRAPHIC PRISTINE SEAS | MARCH 2017

INT
RO
DU
CT
ION

INTRODUCTION
Niue is one of the world’s largest single raised coral atolls (259 km2)
with its highest peak 68 m above sea level and an Exclusive Economic
Zone (EEZ) of 318,144 km2 (Terry and Nunn 2003, FMI 2016) . Sea-level
changes during the Quaternary (2 .6 MYBP–present) produced a
“staircase” of marine terraces at several distinct heights around the
coast, with steep-walled coastal chasms and extensive cave networks
(Figure 1, Terry and Nunn 2003) . Unlike other raised atolls in the Pacific
(e .g ., Nauru, Line and Phoenix Islands), Niue lacks the thick phosphate
rock formed from guano deposition of pre-human seabird rookeries,
owing to the absence of nutrient-rich upwelling currents to support
fish stocks large enough to sustain significant seabird populations
(Stoddard and Scoffin 1983) .
FIGURE 1.
Niue is one of the
world’s largest raised
atoll with extensive
marine terraces
at distinct heights
around the coast .
7
EXPLORING THE MARINE ECOSYSTEMS OF NIUE ISLAND AND BEVERIDGE REEF | NATIONAL GEOGRAPHIC PRISTINE SEAS | MARCH 2017

Niue was colonized ~ 1900 YBP (Bell et al . 2015), most likely with people coming from Tonga
and Samoa (Clark 2010) . In 2011, the population of Niue was 1,611, with 20,200 Niueans living
in New Zealand, and an additional 1–2,000 in Australia . Niue is a self-governing parliamentary
democracy (Fono ekupule) in free association with New Zealand .
Niue’s EEZ contains a number of seamounts and at least three outlying coral reefs, which are
at or near the surface (Beveridge, Antipode, and Haran) . Of these, Beveridge Reef, 240 km to
the southeast of Niue, is the largest with a total area of ~ 56 km2, although it is a submerged
atoll with no emergent land . Beveridge Reef is a culturally significant area to the people of
Niue . Oral history from Rarotonga, Cook Islands, suggests the reef was once covered in coconut
palms until a cyclone swept the trees and the soil away (Best 1922) . In 1847 the British Captain
Lower-Tinger, commander of the brig Beveridge Reef cited the atoll and reported his discovery
to the Admiralty in London . Since much of the reef is visible only at low tide, it has been the site
of numerous shipwrecks over the years .
One of the most iconic marine species in Niue is the katuali or flat-tail sea snake (Laticauda
schistorhynchus), which is found only in Niue and is listed as Vulnerable by the International
Union for Conservation of Nature (IUCN) due to its restricted range and habitat requirements
(Figure 2) . However, much of Niue’s marine environment has not been extensively studied due
to its remoteness and lack of a safe harbor . Relatively few scientific surveys have taken place in
its EEZ, and Beveridge Reef has never undergone a thorough scientific investigation .
FIGURE 2.
The katuali or
flat-tail sea
snake (Laticauda
schistorhynchus)
is found only in
Niue’s waters .
8
In early 2015, the Niuean government approached Oceans 5 (an international funders’
collaborative comprised of new and experienced philanthropists dedicated to protecting the
world’s five oceans) to propose the development of a sustainable and integrated approach to
ocean conservation and management . Oceans 5 is supporting the local nonprofit Tofia Niue, in
partnership with the government of Niue in the Niue Ocean Wide (NOW) project to conserve
and sustainably manage Niue’s waters . Niue has begun a three-year planning process to
create a Marine Management Plan that will define a EEZ-wide network of resource use zones .
The intended goals of NOW are to
n improve fisheries management, both near-shore and pelagic;
n ensure long-term food security;
n increase the value of tourism;
n establish a large marine protected area in the EEZ;
n ensure that Niue’s environment remains as pristine as possible; and
n increase Niue’s global stature as a leader in conservation and tourism
OBJECTIVES OF THE EXPEDITION
The goals of the Pristine Seas project are to find, survey, and help protect the last wild places
in the ocean . It is essential that we let the world know that these places exist, that they
are threatened, and that they deserve to be protected . In Niue, there is strong support for
the creation of a large-scale, “globally significant Marine Protected Area .” To this end,
National Geographic Pristine Seas, in collaboration with the Niuean government, Oceans 5,
and the Pacific Community conducted an expedition to Niue Island and Beveridge Reef in
September–October 2016 to conduct the first-ever, comprehensive baseline survey of these
largely unknown marine ecosystems .
9
EXPLORING THE MARINE ECOSYSTEMS OF NIUE ISLAND AND BEVERIDGE REEF | NATIONAL GEOGRAPHIC PRISTINE SEAS | MARCH 2017

RE
SU
LTS

RESULTS
Benthos
Prior to our expedition, there had not been a comprehensive survey of Niue’s marine ecosystems .
We provide the first checklists for corals, algae, and fishes for the waters surrounding Niue and
Beveridge Reef, as well as comparisons of benthic community composition between islands,
depths, and wind exposures (i .e ., windward, east-facing shores and leeward, west-facing shores) .
BENTHIC COMMUNITY COMPOSITION
Benthic taxa were organized into functional groups as follows: hard corals, CCA (crustose coralline
algae), Lobophora (taxa within this genus of thalloid brown alga), erect algae (taxa > 2 cm
height except for Lobophora), turf algae, bare substrate, and other invertebrates (including soft
corals) . CCA accounted for 28% of the cover at Niue, followed by hard coral (19%), Lobophora
(17%), bare substrate (13%), and erect algae (12%) . At Beveridge Reef, bare substrate comprised
35% of benthic functional group cover, followed by CCA (27%), Lobophora (17%), and hard
coral (15%) . There were stark differences in cover by depth and habitat (Figure 3) . The shallow
(1 m) backreef sites at Beveridge Reef were dominated by bare substrate . Hard coral cover and
CCA were highest at 5 m sites at Niue and decreased with depth, whereas Lobophora showed
the opposite trend . Lobophora also showed an increase with depth at Beveridge Reef .
FIGURE 3.
Benthic functional
group cover by
island and depth .
11
EXPLORING THE MARINE ECOSYSTEMS OF NIUE ISLAND AND BEVERIDGE REEF | NATIONAL GEOGRAPHIC PRISTINE SEAS | MARCH 2017
0
20
40
60
80
Turf
Erect algae
Lobophora
Hard coral
Bare substrate
CCA
20m10m5m20m10m1m
BEVERIDGE REEF NIUE
PE
RC
EN
T C
OV
ER

Comparisons of benthic functional groups between islands and depths (10 and 20 m only)
showed a significant difference between islands (Pseudo-F1,70 – 11 .5, p = 0 .001), but not between
depths or their interaction (both p > 0 .05) . The first two axes of the multivariate principal
coordinates analysis (PCO) plot explained nearly 62% of the variation in benthic functional groups
(Figure 4) . Hard coral and erect algae explained much of the variation for Niue, while bare
substrate was responsible for explaining much of the benthic composition at Beveridge Reef .
There were significant differences in the benthic communities between Niue and Beveridge Reef
and between windward and leeward sides of both reef systems, with the differences much more
pronounced around Beveridge Reef compared with Niue (PERMANOVAs: all p < 0 .001, Figure
5, 6) . At Beveridge Reef, CCA was nearly two times higher at windward compared to leeward
exposures, and bare substrate was ~ 39% higher at windward exposures (Table 1) . Conversely,
the cover of Lobophora at Beveridge Reef was 5 .7 times higher at leeward areas compared to
windward locations, while hard coral cover was nearly two times higher at leeward exposures
(Figure 7) . Similar to Beveridge Reef, CCA also contributed the most to the dissimilarity
between windward and leeward areas at Niue with cover 2 .7 times higher at windward locations .
Hard coral cover at Niue was 3 .3 times higher at leeward compared to windward areas and
contributed more to the dissimilarity between wind exposures compared to Beveridge Reef .
Erect algae showed the largest difference in cover between wind exposures at Niue with cover
4 .7 times higher at leeward vs . windward areas .
FIGURE 4.
Comparison of
benthic functional
groups between
Niue and Beveridge
Reef using principal
coordinates
analysis (10 and
20 m stations
only) . Vector
direction and
length indicate the
relative importance
of specific
functional groups .
12
-10
0
10
20
30
-20
-30
PC
O2
(2
5.7
% O
F T
OT
AL
VA
RIA
TIO
N)
3020100-10-20 40
PCO1 (36.1% OF TOTAL VARIATION)
Niue
Beveridge Reef
Resemblance: S17 Bray Curtis similarity
Lobophora
Substrate
Hard coralCCAErect algae

FIGURE 5.
A . Leeward Niue,
B . Windward Niue,
C . Leeward
Beveridge Reef,
D . Windward
Beveridge Reef .
FIGURE 6.
Percent cover of
major benthic
functional groups
around A . Niue and
B . Beveridge Reef .
A B
C D
B
167°45'0"W
167°45'0"W
20°0
'0"S
20°0
'0"S
A
169°50'0"W169°55'0"W
169°50'0"W169°55'0"W
19°5
'0"S
19°0
'0"S
19°1
0'0
"S
19°0
'0"S
19°5
'0"S
19°1
0'0
"S
13
EXPLORING THE MARINE ECOSYSTEMS OF NIUE ISLAND AND BEVERIDGE REEF | NATIONAL GEOGRAPHIC PRISTINE SEAS | MARCH 2017
TurfErect algaeLobophoraCoralSubstrateCCA
Benthic cover
TurfErect algaeLobophoraCoralSubstrateCCA
Benthic cover

FIGURE 7.
Comparisons of
benthic functional
group cover
between islands and
wind exposures .
Beveridge Reef Leeward Windward Dissimilarity % Contribution
CCA 20 .95 41 .08 12 .61 28 .46
Lobophora 28 .65 5 .04 12 .11 27 .32
Bare substrate 25 .75 35 .72 9 .26 20 .90
Hard coral 20 .13 10 .40 6 .06 13 .66
Niue Leeward Windward Dissimilarity % Contribution
CCA 16 .33 44 .20 14 .76 30 .66
Hard coral 26 .27 8 .00 9 .53 19 .80
Lobophora 18 .89 20 .40 7 .08 14 .70
Erect algae 16 .91 3 .60 6 .87 14 .26
Bare substrate 16 .07 11 .80 4 .89 10 .16
TABLE 1.
Benthic
functional groups
contributing most
to the dissimilarity
between wind
exposures
(windward vs .
leeward) for
each island .
Dissimilarities
were calculated
using SIMPER
(similarity
percentage
analysis) .
14
0
20
40
60
80
100
WindwardLeewardWindwardLeeward
Turf
Erect algae
Lobophora
Hard coral
Bare substrate
CCA
BEVERIDGE REEF
PE
RC
EN
T C
OV
ER
NIUE

FIGURE 8.
Comparison of
coral species
between Niue and
Beveridge Reef
using principal
coordinates
analysis . Vector
direction and
length indicate the
relative importance
of specific
functional groups .
Corals
We recorded a total of 121 taxa of scleractinian (hard) corals from 12 families during our
expedition (Appendix II) . The most specious family was Acroporidae (n = 42), followed by
Faviidae (n = 23), Poritidae (n = 11), and Agariciidae (n = 9) . There were 102 coral taxa recorded
from Niue (90 on transect and 12 rare species observed, but not recorded on transect), and
78 from Beveridge Reef (72 on transect, 6 rare species) .
The coral species composition between Niue and Beveridge Reef showed a 82 .7% dissimilarity
and was well separated in ordination space (Figure 8) . The top three species by percent cover
at Niue were Acropora gemmifera (= 3 .3 ± 3 .9 SD), Acropora cytherea (= 2 .4 ± 4 .2 SD), and
Acropora nasuta (= 1 .9 ± 4 .2 SD), while the top three at Beveridge Reef were Acropora globiceps
(= 1 .6 ± 2 .0 SD), Montastrea curta (= 1 .4 ± 1 .4 SD), and Porites lobata (= 1 .1 ± 1 .4 SD) .
15
EXPLORING THE MARINE ECOSYSTEMS OF NIUE ISLAND AND BEVERIDGE REEF | NATIONAL GEOGRAPHIC PRISTINE SEAS | MARCH 2017
0
20
40
-20
-40
PC
O2
(12
.2%
OF
TO
TA
L V
AR
IAT
ION
)
200-20-40-60 40
PCO1 (16.8% OF TOTAL VARIATION)
Niue
Beveridge Reef
Transform: Square rootResemblance: S17 Bray Curtis similarity
Acropora horridaMontipora foveolata
Montipora caliculata
Acropora hyacinthusAcropora gemmifera
Favia matthaiiAcropora cytherea

Algae
A total of 59 algal taxa were identified during the expedition, with a composition typical of
the southwest tropical Pacific (Appendix III) . Rhodophyta (red algae) accounted for 49% of
the taxa, followed by Chlorophyta (green algae, 37%), Ochrophyta (brown algae, 8%), and
Cyanophyta (blue-green algae, 5%) .
A total of 56 algal taxa were recorded from Niue, while less than half as many (n = 27) were
found at Beveridge Reef . Distributions among algal divisions were similar between reef systems .
Rhodophyta comprised 50% of the algal taxa at Niue and 44% at Beveridge Reef . Chlorophyta
accounted for 36% of the algal taxa at Niue and 44% at Beveridge Reef . Ochrophyta and
Cyanophyta were minor components of the assemblages at both locations .
Encrusting coralline algae were comprised of several species of Peyssonnelia, Porolithon,
Neogoniolithon, and Haematocelis (Figure 9) . The thalloid brown alga Lobophora variegata
was mainly found in the encrusting form down to 20 m and the non-encrusting form below
30 m . Erect algae consisted of several species of Halimeda, and to a less extent Caulerpa,
Microdictyon, and a mix of other genera . The dominant species of Halimeda included Halimeda
opuntia, H. micronesica, and Halimeda lacunalis f. lata . We found two interesting algal taxa:
Halimeda pygmaea, recently described from Fiji, which was found attached to overhangs below
25 m, and Erythrymenia sp ., an undescribed species also reported from Fiji .
FIGURE 9.
A . Encrusting
coralline algae
Peyssonnelia sp .,
B . Halimeda
lacunalis f. lata,
C . Caulerpa
macrophysa,
D . Erythrymenia
sp ., an undescribed
algae species also
reported from Fiji .
A B
C D
16

Echinoderms
Sea urchins were the most abundant echinoderm (Phylum Echinodermata: e .g ., sea urchins,
sea stars, sea cucumbers, sea lilies, brittle stars) found on Niue’s reefs . Densities of sea urchins
were more than one order of magnitude higher overall at Beveridge Reef compared with Niue .
Echinostrephus aciculatus, a filter feeding sea urchin that collects drift algae, and the grazer
Echinometra mathaei were the most abundant sea urchins at Beveridge Reef; however, they
showed different depth distributions, with E. aciculatus most abundant at 10 m and E. mathaei
most abundant in the shallow backreef (Figure 10, 11) . Echinothrix diadema was the next most
abundant sea urchin at Beveridge Reef and was twice as abundant in the shallow backreef
compared with the 10 m forereef sites . This species was the most abundant sea urchin found
at Niue with densities two times higher at 5 vs . 10 m . Sea urchins were uncommon at the 20 m
sites at both islands, although an unidentified Echinothrix was observed in moderate densities
(= 0 .1 m-2) at Beveridge Reef at this deeper depth .
The sea lily Comaster sp . was common at some 20 m sites around Niue but not observed
anywhere else during the expedition . Two sea cucumbers (Thelenota ananas and Holothuria
atra) were observed on transects at Beveridge Reef but not around Niue . H. atra was observed
only along the shallow backreef sites (= 0 .27 m-2) and T. ananas was found in similarly low
densities at both the 10 and 20 m sites (= 0 .02 m-2) .
FIGURE 10.
Densities (number
10 m-2) of the
most common sea
urchins observed
at Beveridge Reef
and Niue by depth .
FIGURE 11.
A . The most
abundant sea urchin
at Beveridge Reef
was the filter feeder
Echinostrephus
aciculatus . B . The
grazer Echinothrix
diadema was most
common at Niue .
BA
17
EXPLORING THE MARINE ECOSYSTEMS OF NIUE ISLAND AND BEVERIDGE REEF | NATIONAL GEOGRAPHIC PRISTINE SEAS | MARCH 2017
BEVERIDGE REEF NIUE
Echinostrephus aciculatus
Echinometra mathaei
Echinothrix diadema
Echinothrix sp.
0
5
10
15
20
20m10m5m20m10m1m
DE
NS
ITY

Commercially important invertebrates
Populations of commercially important macro-invertebrates were surveyed using manta tows
and reef benthos transects (RBT) (Appendix IV) . Macro-invertebrate densities were relatively
low overall except for a few species such as giant clams (Tridacna spp .) and sea urchins
(Echinothrix spp . and Heterocentrotus mammillatus, Table 2) . Although generally abundant,
these species showed great spatial variation at each of the sites surveyed . Densities of
macro-invertebrates were likely influenced by wind and swell, with higher densities of Tridacna
spp . observed at leeward locations, both at Niue and Beveridge Reef (Figure 12) . Tridacna
spp . averaged ~ 2000 individual ha-1 at leeward sites around Beveridge Reef, and an order of
magnitude lower than that on the windward side as well as around the entire island of Niue .
RBTs were conducted only at Beveridge Reef, hence results regarding macro-invertebrate
abundance should be treated with caution . However, densities tended to follow the same
pattern as those found with manta tow surveys, with relatively high densities of sea urchins
and giant clams at the leeward site of the lagoon . Tridacna maxima densities at Beveridge
Reef approximated the regional reference densities for healthy stocks (750 ha-1, Table 2) . Other
macro-invertebrate species were found at relatively low densities .
Species Average ± SE
Regional reference density for healthy stocks (Pakoa et al. 2014)
Echinothrix diadema 9,250 .00 ± 2,752 .21 na
Echinometra mathaei 1,555 .56 ± 527 .78 na
Tridacna maxima 1,375 .00 ± 674 .86 750
Diadema sp. 1,013 .89 ± 972 .52
Holothuria atra 930 .56 ± 222 .22 5,600
Heterocentrotus mammillatus 736 .11 ± 427 .86 na
Echinothrix calamaris 194 .44 ± 174 .03 na
Turbo argyrostomus 180 .56 ± 160 .17 na
Tridacna sp.* 41 .67 ± 24 .06 na
Reishia armigera 41 .67 ± 24 .06 na
Holothuria whitmaei 41 .67 ± 24 .06 50
* Tridacna sp . showed shell details that may not be consistent with Tridacna maxima .
TABLE 2.
Densities
(individuals ha-1)
of common
macro-invertebrate
species (i .e . those
observed in at
least two of the
three stations
surveyed)
in Beveridge
Reef lagoon .
na = no regional
reference density
available .
18

FIGURE 12.
Densities of
macro-invertebrates
from manta tows .
A total of 99 Tridacna maxima were measured during the survey at Beveridge Reef . Measured
individuals ranged from 20 to 400 mm, with a modal length class of 111–120 mm (Figure 13) .
Eighty-six percent of the measured population was below the minimum legal harvest sale of
180 mm in effect for Niue .
FIGURE 13.
Size frequency
distribution of
Tridacna maxima
at Beveridge Reef
lagoon (n = 99) .
The red line
represents the
minimum legal
size for harvest
at Niue .
19
EXPLORING THE MARINE ECOSYSTEMS OF NIUE ISLAND AND BEVERIDGE REEF | NATIONAL GEOGRAPHIC PRISTINE SEAS | MARCH 2017
0
500
1000
1500
2000
2500
3000
WindwardLeewardWindwardLeeward
BEVERIDGE REEF NIUE
Tridacna spp.
Echinothrix spp.
Heterocentrotus mammillatus
IND
IVID
UA
LS
ha1
UPPER SIZE CLASS (mm)
FR
EQ
UE
NC
Y
0
2
4
6
8
250 300 350 400200150100500

Connectivity studies
Overall, a total of 175 samples, from two species of invertebrate and three fish species, were
collected from Beveridge Reef lagoon for genetic analysis (Table 3) . Pending collection of
comparable genetic tissue from Niue by the Department of Agriculture, Forestry and Fisheries,
these tissues will be examined to assess connectivity between Beveridge Reef and Niue .
Species No. of individual sampled Tissue sampled
Tridacna spp.* 89 Mantle
Acanthurus nigrofuscus 25 Muscle
Acanthurus triostegus 21 Muscle
Cephalopholis argus 20 Muscle
Echinometra mathaei 20 Gonad
* Samples of Tridacna individuals collected might not have been only composed of the species Tridacna maxima .
Fishes
SHALLOW WATER FISHES
A total of 295 shallow-water fish species from 41 families were observed during our survey
(Figure 14, Appendix V) . Fish assemblage characteristics (e .g ., species richness, numerical
abundance, and biomass) were all significantly different among island/depth (10 and 20 m only)
combinations (Figure 15) . Species richness was lowest at the 10 m sites at Beveridge Reef but
similar among all other island/depth combinations . Numerical abundance was highest at the
10 m Niue sites and similar among all others . Biomass showed large differences, with biomass
2 .3 times higher at Beveridge Reef compared with Niue, and highest at the 20 m Beveridge Reef
sites . At Beveridge Reef, sharks (primarily grey reefs—Carcharhinus amblyrhynchos) accounted
for 28% of the biomass at 10 m and 44% at 20 m . If sharks are excluded from the analysis,
then biomass is not significantly different between islands (F1,173 = 1 .8, p = 0 .17) or depth strata
(F1,173 = 0 .6, p = 0 .56), although there is a significant interaction (F1,173 = 3 .1, p = 0 .002) .
TABLE 3.
Summary of samples
collected from
Beveridge Reef for
genetic analysis .
20

Comparison of 10 m, 20 m, and shallow (~ 1–2 m) backreef habitats at Beveridge Reef showed
significant differences in fish assemblage characteristics (Figure 16) . Species richness was
significantly higher at the 20 m sites compared with 10 m and shallow backreef . The number of
individuals was significantly lower in the backreef compared with the two forereef depth strata .
Biomass was significantly higher at 20 m sites compared with either 10 m forereef sites or
backreef locations . If sharks are excluded, there is no significant difference in biomass among
depth strata at Beveridge Reef (F2,97 – 2 .7, p = 0 .07)
FIGURE 15.
Fish assemblage
characteristics
between islands and
depths . Red bars
denote biomass
of sharks . Species
richness – F3,173 –
4 .6, p = 0 .004 .
Numerical abundance
(number m-2) –
F3,173 – 7 .8, p < 0 .001 .
Biomass (t ha-1) –
F3,173 – 8 .4, p < 0 .001 .
Letters above bars
represent island-
depth combinations
that are not
significantly different
from one another
based on pair-wise
Tukey HSD multiple
comparison tests .
FIGURE 14.
A . The dwarf
hawkfish
(Cirrhitichthys
falco) and
B . Fire dartfish
(Nemateleotris
magnifica) are
common species
found on Niue’s
coral reefs .
BA
21
EXPLORING THE MARINE ECOSYSTEMS OF NIUE ISLAND AND BEVERIDGE REEF | NATIONAL GEOGRAPHIC PRISTINE SEAS | MARCH 2017
0
5
10
15
20
25
0
1
2
3
0
1
2
BEVERIDGE REEF NIUE
20m10m20m10m
BBAB
ABABB
AAABB
BIO
MA
SS
(t
ha-1)
IND
IVID
UA
LS
(no
. m-2)
SP
EC
IES

Comparisons of fish assemblage characteristics among depth strata at Niue also revealed
significant differences (Figure 16) . Species richness was similar among depth strata, while
number of individuals was highest in the 5 m depth strata and lowest at 20 m . Biomass at
Niue was lowest at 20 m and not significantly different between 5 and 10 m . No sharks were
enumerated on quantitative transects at Niue, although we did observe both grey reef and
whitetip reef (Triaenodon obesus) sharks during our dives .
Fish assemblage characteristics varied by wind exposure, with most characteristics typically
higher in leeward compared with windward locations between islands and within an island
(Figure 17, Table 4) . Biomass of sharks was two times higher at leeward areas of Beveridge Reef
compared with windward locations, although the relative percentage of shark biomass was
similar between exposures (38% leeward vs . 40% windward) .
FIGURE 16.
Fish assemblage
characteristics
between depths
within an island .
A . Beveridge Reef:
Species richness
(number transect-1) –
F2,97 – 11 .0, p < 0 .001,
Numerical abundance
(number m-2) - F2,97
– 7 .9, p < 0 .001,
Biomass (t ha-1) -
F2,97 – 3 .4, p = 0 .037 .
B . Niue: Species
richness (number
transect-1) – F2,129 – 2 .1,
p < 0 .123, Numerical
abundance (number
m-2) - F2,129 – 4 .0, p
= 0 .022, Biomass (t
ha-1) - F2,129 – 9 .3, p
< 0 .001 . Red bars
denote biomass of
sharks . Letters above
bars represent island-
depth combinations
that are not
significantly different
from one another
based on pair-wise
Tukey HSD multiple
comparison tests .
22
A
0
5
10
15
20
25
0
1
2
3
4
0
.5
1.5
1.0
2.0
BEVERIDGE REEF NIUE
10m 20mBackreef
BB
A AB
B AB AB
BIO
MA
SS
(t
ha-1)
IND
IVID
UA
LS
(no
. m-2)
SP
EC
IES
0
5
10
15
20
25
0
1
2
3
4
0
.5
1.5
1.0
2.0
10m 20mBackreef
A BA
AB BB
B

Assem. char. F3,173 p Island Exposure Multiple comparisons
Species 20 .7 < 0 .001 Niue > Bev lee > wind Niue_lee = Bev_lee > Niue_wind = Bev_wind
Number 10 .7 < 0 .001 Niue > Bev lee > wind Niue_lee > Bev_lee = Niue_wind = Bev_wind
Biomass 15 .6 < 0 .001 Bev > Niue lee > wind Bev_lee > Niue_lee = Bev_wind = Niue_wind
Biomass w/o sharks 11 .5 < 0 .001 Bev = Niue lee > wind Bev_lee > Niue_lee = Niue_wind > Bev_wind
FIGURE 17.
Fish assemblage
characteristics
between wind
exposures and
islands . Red
bars denote
biomass of sharks .
Letters above
bars represent
island-shore
combinations
that are not
significantly
different from one
another based on
pair-wise Tukey
HSD multiple
comparison tests .
TABLE 4.
Fish assemblage
characteristics
(Assem . char .) by
island (Niue and
Beveridge Reef =
Bev) and wind
exposure . Leeward =
lee, windward =
wind . Statistical
results of two-way
analysis of variance
(ANOVA) . Multiple
comparison results
of Tukey’s HSD
pair-wise tests .
23
EXPLORING THE MARINE ECOSYSTEMS OF NIUE ISLAND AND BEVERIDGE REEF | NATIONAL GEOGRAPHIC PRISTINE SEAS | MARCH 2017
0
5
10
15
20
25
0
1
2
3
0
.5
2.0
1.0
1.5
NIUEBEVERIDGE REEFNIUEBEVERIDGE REEF
BAAB
ABBB
AABB
BIO
MA
SS
(t
ha-1)
IND
IVID
UA
LS
(no
. m-2)
SP
EC
IES

EFFICACY OF MARINE PROTECTED AREA
Fish biomass in the no-take Alofi North Marine Protected Area (MPA) was not significantly
different from fish biomass at comparable leeward locations around Niue (F1,99 – 0 .92, p = 0 .34) .
In fact, fish biomass was higher, although not significantly so, in every depth stratum sampled
outside vs . inside the no-take MPA (Table 5) . There was no significant interaction between
management (MPA vs . open) and depth strata (F2,99 – 0 .90, p = 0 .41) .
FISH TROPHIC COMPARISONS
Piscivores (primarily sharks) made up 57% and 41% of the fish biomass in the 20 and 10 m depth
strata at Beveridge Reef, respectively (Figure 18), and were 7 .5 times higher at Beveridge Reef
compared with Niue . Biomass of this trophic group was low in all other island/depth strata
combinations . Herbivores were the dominant trophic group by weight overall, with the highest
values and highest percentages of total biomass present in the shallow backreef at Beveridge
Reef and the 5 m depth strata at Niue . Carnivores were relatively evenly represented across all
depth strata and planktivores had notably low abundance overall .
Depth (m) Alofi MPA Open % diff. F p
5 83 .1 (49 .1) 84 .8 (57 .7) -2 .0 0 .11 0 .74
10 55 .1 (36 .5) 72 .6 (36 .0) -24 .0 2 .23 0 .14
20 47 .6 (34 .9) 52 .4 (35 .2) -9 .0 0 .16 0 .69
FIGURE 18.
Trophic fish biomass
by island and
depth strata .
TABLE 5.
Fish biomass in
the Alofi marine
protected area Alofi
North MPA and
leeward locations at
Niue by depth strata .
Values are mean
fish biomass
(g m-2) with
standard deviations
in parentheses .
Statistical results
(F) of least squares
means planned
comparisons .
24
Planktivores
Herbivores
Carnivores
Piscivores
20m10m5m20m10mBackreef
BEVERIDGE REEF NIUE
0.0
0.5
1.0
1.5
2.0
BIO
MA
SS
(t
ha-1)

FISH SPECIES COMPOSITION
The dominant species by weight at Beveridge Reef was the grey reef shark (Carcharhinus
amblyrhynchos, = 40 .8 ± 96 .3 g m-2), which represented 33% of the total fish biomass
at Beveridge Reef (Figure 19) . This species was followed by bluelined surgeonfish (Acanthurus
nigroris, = 6 .8 ± 18 .7 g m-2), bristletooth tang (Ctenochaetus striatus, = 5 .4 ± 7 .0 g m-2), and
bullethead parrotfish (Chlorurus sordidus, = 4 .1 ± 6 .4 g m-2) . At Niue, the most abundant species
by weight were the bristletooth tang (= 3 .7 ± 5 .4 g m-2), followed by Forsten’s parrotfish (Scarus
forsteni, = 3 .2 ± 6 .3 g m-2), and peacock grouper (Cephalopholis argus, = 3 .1 ± 5 .7 g m-2) .
The fish assemblages between Niue and Beveridge Reef were highly dissimilar (SIMPER – 90 .9%
dissimilar) . The species accounting for most of the dissimilarity were grey reef sharks (11%),
bluelined surgeonfish (6%), bristletooth tang (5%), and peacock grouper (3%) (Table 6) . The
Niue and Beveridge Reef 10 and 20 m forereef sites were well separated from one another in
ordination space (Figure 20) . Grey reef sharks and blacktip grouper (Epinephelus fasciatus)
explained much of the separation at Beveridge Reef, while darkfin grouper (Cephalopholis
urodeta) and agile chromis (Chromis agilis) explained the separation at Niue . The 5 m forereef
sites at Niue and the shallow backreef sites at Beveridge Reef showed a great deal of overlap, with
fivestripe wrasse (Thalassoma quinquevittatum) and brighteye damselfish (Plectroglyphidodon
imparipennis) driving this concordance .
FIGURE 19.
Grey reef sharks
were the dominant
fish biomass at
Beveridge Reef
but were rarely
observed at Niue .
EXPLORING THE MARINE ECOSYSTEMS OF NIUE ISLAND AND BEVERIDGE REEF | NATIONAL GEOGRAPHIC PRISTINE SEAS | MARCH 2017
25

Species Common Name Beveridge Reef biomass
Niue biomass
Avg. diss. Cum. % diss.
Carcharhinus amblyrhynchos grey reef shark 40 .82 0 .00 10 .80 11 .89
Acanthurus nigroris bluelined surgeonfish 6 .83 2 .39 5 .52 17 .96
Ctenochaetus striatus bristletooth tang 5 .36 3 .70 4 .63 23 .05
Cephalopholis argus peacock grouper 2 .88 3 .15 3 .01 26 .37
Chlorurus sordidus bullethead parrotfish 4 .15 0 .40 2 .88 29 .54
Scarus forsteni Forsten’s parrotfish 1 .23 3 .23 2 .65 32 .46
Lutjanus bohar red snapper 2 .62 2 .82 2 .64 35 .37
Parupeneus crassilabris double-bar goatfish 2 .87 2 .13 2 .20 37 .79
Melichthys vidua pinktail triggerfish 2 .22 2 .10 2 .15 40 .16
Acanthurus nigrofuscus brown surgeonfish 1 .22 2 .76 2 .12 42 .49
FIGURE 20.
Comparison of
fish assemblage
structure based
on species
biomass
between Niue
and Beveridge
Reef and among
depth strata
using principal
coordinates
analysis . Vector
direction and
length indicate
the relative
importance of
the primary
species .
TABLE 6.
Fish species most
responsible for
the dissimilarity
between Niue
and Beveridge
Reef based on
Similarity of
Percentages
based on SIMPER
analysis . Values
are biomass
(g m-2) Avg .
diss . = average
dissimilarity,
Cum . % diss . =
cumulative
percent
dissimilarity .
26
0
20
40
-20
-40
PC
O2
(11
.1%
OF
TO
TA
L V
AR
IAT
ION
)
200-20-40 40
PCO1 (12.7% OF TOTAL VARIATION)
Bev_BRBev_10Bev_20
Niue_5Niue_10Niue_20
Transform: Log(X+1)Resemblance: S17 Bray Curtis similarity
Thal. quinquevittatum
Epin. fasciatus
Carch. amblyrhynchos
Ceph. urodetaChromis agilis
Plec. imparipennis

NEARSHORE PREDATORS
We deployed Baited Remote Underwater Video Systems (BRUVS) on the bottom in ~ 20 m of
water to survey the presence and relative abundance of sharks and other fish predators of the
nearshore environment . Four species of elasmobranchs (sharks and rays) were observed on
benthic BRUVS: grey reef shark (Carcharhinus amblyrhynchos), whitetip reef shark (Triaenodon
obesus), spotted eagle ray (Aetobatus narinari), and marbled stingray (Himantura oxyrhyncha)
(Figure 21) . Elasmobranchs were present in 66% of the drops, with a 34% occurrence around
Niue and a 98% occurrence at Beveridge Reef (Figure 22) . The highest number of individuals per
frame (MaxN = 15) was for grey reef sharks at Beveridge Reef . This species was present at 98% of
all deployments at Beveridge Reef and 30% of all deployments at Niue . The highest abundance of
whitetip reef sharks was only two sharks per frame per hour at Beveridge Reef and was present in
49% of all deployments at Beveridge Reef but only 6% at Niue . Spotted eagle rays were observed
only at Beveridge Reef, where they occurred in 18% of the samples . Marbled stingrays were also
observed only at Beveridge Reef, with two single observation out of the 49 deployments . The
mean number of elasmobranchs per frame per hour was nearly 12 times higher at Beveridge Reef
(= 6 .0) than at Niue (= 0 .50) . The MaxN of grey reef sharks was 2 .5 times higher than all other
elasmobranchs combined . Densities of grey reef sharks from BRUVS at Beveridge Reef were an
order of magnitude higher than recorded elsewhere around the world (Table 7) .
Location Reef Shark Species Mean MaxN Reference
Beveridge Reef Carcharhinus amblyrhynchos 5.10 This study
Palmyra Atoll Carcharhinus amblyrhynchos 1 .08 Bradley et al . In press
Raja Ampat Carcharhinus amblyrhynchos 0 .50 Jaiteh et al . 2016
Niue Carcharhinus amblyrhynchos 0.44 This study
GBR = Great Barrier Reef Carcharhinus amblyrhynchos 0 .26 Espinoza et al . 2014
Belize Carcharhinus perezi 0 .23 Bond et al . 2012
Fiji Carcharhinus amblyrhynchos 0 .20 Goetze & Fullwood 2013
TABLE 7.
Mean MaxN for
grey reef and
Caribbean reef
sharks from
various studies
around the world .
27
EXPLORING THE MARINE ECOSYSTEMS OF NIUE ISLAND AND BEVERIDGE REEF | NATIONAL GEOGRAPHIC PRISTINE SEAS | MARCH 2017

0
1
2
3
4
5
6
Ma
xN
Grey reef shark Red snapper Black jack Whitetip reef shark
Beveridge Reef
Niue
In addition to sharks and rays, the relative abundance of several other key species was noted
on our BRUVS . These included red snapper (Lutjanus bohar), black jack (Caranx lugubris),
dogtooth tuna (Gymnosarda unicolor), and the katuali (sea krait – Laticauda schystorhyncha),
which is endemic to Niue . Red snapper abundance, a species present in 76% of all deployments
(62% at Niue and 90% at Beveridge Reef, respectively) was nearly three times higher at
Beveridge Reef (MaxN = 4 .45 ± 0 .09 SE) compared to Niue (1 .66 ± 0 .03 SE) . Similarly, black
jacks were abundant at Beveridge Reef (3 .65 ± 0 .45 SE) and were virtually absent from Niue .
FIGURE 22.
Distribution
of dominant
predatory fishes
observed on
BRUVS around
A . Niue and
B . Beveridge Reef .
Values for pie
sizes at MaxN
per station .
FIGURE 21.
Maximum number
of individuals per
frame (MaxN)
for dominant
predatory
species observed
on BRUVS .
A
169°50'0"W169°55'0"W
169°50'0"W169°55'0"W
19°5
'0"S
19°0
'0"S
19°1
0'0
"S
19°0
'0"S
19°5
'0"S
19°1
0'0
"S
167°45'0"W
167°45'0"W
20°0
'0"S
20°0
'0"S
B
28
Grey reef
7.1
BRUV species
White tipRed snapperBlack jack
Grey reef
7.1
BRUV species
White tipRed snapperBlack jack

FIGURE 23.
Elasmobranchs
(sharks and rays)
observed on
benthic BRUVs .
A . Grey reef shark
(Carcharhinus
amblyrhynchos),
B . Whitetip reef
shark (Triaenodon
obesus), and
C . Marbled stingray
(Himantura
oxyrhyncha) .
A
B
C
FIGURE 24.
Other reef fish
predators recorded
included A . Red
snapper (Lutjanus
bohar) and
B . Giant trevally
(Caranx ignobilis) .
A B
29
EXPLORING THE MARINE ECOSYSTEMS OF NIUE ISLAND AND BEVERIDGE REEF | NATIONAL GEOGRAPHIC PRISTINE SEAS | MARCH 2017

The presence of several other predators was recorded but not included in the analysis including
several giant trevally (Caranx ignobilis), humphead (Maori) wrasse (Cheilinus undulatus) and
large schools of Heller’s barracuda (Sphyraena helleri) . Notably, three species of endangered
marine turtles were also recorded: loggerhead sea turtle (Caretta caretta), green sea turtle
(Chelonia mydas) and hawksbill sea turtle (Eretmochelys imbricata) .
FIGURE 25.
Three species of
marine turtles
were recorded at
Beveridge Reef .
A . Loggerhead
(Caretta caretta),
B . Green (Chelonia
mydas), and
C . Hawksbill
(Eretmochelys
imbricata) .
A B
C
30

PELAGIC ASSEMBLAGES
Mid-water BRUVS were deployed at 10 sites each around Niue and Beveridge Reef with a total of
100 individual camera drops (there were five stereo camera pairs on each longline) . We
recorded 112 individual pelagic fishes and marine mammals, representing 16 species from
nine families with some indicative and rare species shown in (Figure 26) .
Overall, total abundance per sample was nearly six times higher at Beveridge Reef compared with
Niue and species richness was two times higher at Beveridge Reef . However, these differences
were driven by a single sampling site to the west of Beveridge Reef when 50 individuals from
nine species were observed . If this one sample is excluded, then abundance and species
richness between the two islands is nearly identical (abundance: 1 .7 vs . 1 .1, richness: 1 .0 vs . 0 .9,
Beveridge Reef vs . Niue, respectively) . More sampling is needed to distinguish whether this
area is a relative hotspot or an artifact of the patchy distribution of pelagic wildlife .
FIGURE 26.
Species observed
on mid-water
BRUVS .
A . Great barracuda
(Sphyraena
barracuda),
B . Wahoo
(Acanthocybium
solandri),
C . Striped marlin
(Kajikia audax),
D . Grey reef shark
(Carcharhinus
amblyrhynchos)
and rainbow
runners (Elagatis
bipinnulata) .
A
C
B
D
31
EXPLORING THE MARINE ECOSYSTEMS OF NIUE ISLAND AND BEVERIDGE REEF | NATIONAL GEOGRAPHIC PRISTINE SEAS | MARCH 2017
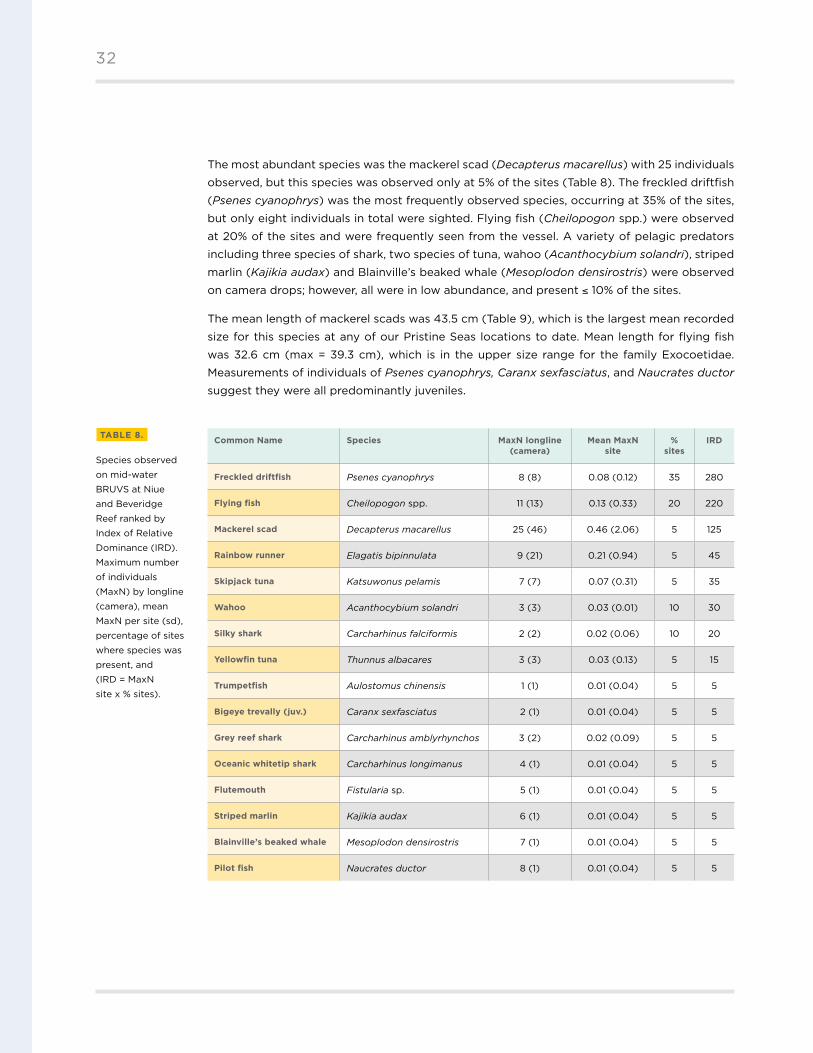
The most abundant species was the mackerel scad (Decapterus macarellus) with 25 individuals
observed, but this species was observed only at 5% of the sites (Table 8) . The freckled driftfish
(Psenes cyanophrys) was the most frequently observed species, occurring at 35% of the sites,
but only eight individuals in total were sighted . Flying fish (Cheilopogon spp .) were observed
at 20% of the sites and were frequently seen from the vessel . A variety of pelagic predators
including three species of shark, two species of tuna, wahoo (Acanthocybium solandri), striped
marlin (Kajikia audax) and Blainville’s beaked whale (Mesoplodon densirostris) were observed
on camera drops; however, all were in low abundance, and present ≤ 10% of the sites .
The mean length of mackerel scads was 43 .5 cm (Table 9), which is the largest mean recorded
size for this species at any of our Pristine Seas locations to date . Mean length for flying fish
was 32 .6 cm (max = 39 .3 cm), which is in the upper size range for the family Exocoetidae .
Measurements of individuals of Psenes cyanophrys, Caranx sexfasciatus, and Naucrates ductor
suggest they were all predominantly juveniles .
Common Name Species MaxN longline (camera)
Mean MaxN site
% sites
IRD
Freckled driftfish Psenes cyanophrys 8 (8) 0 .08 (0 .12) 35 280
Flying fish Cheilopogon spp . 11 (13) 0 .13 (0 .33) 20 220
Mackerel scad Decapterus macarellus 25 (46) 0 .46 (2 .06) 5 125
Rainbow runner Elagatis bipinnulata 9 (21) 0 .21 (0 .94) 5 45
Skipjack tuna Katsuwonus pelamis 7 (7) 0 .07 (0 .31) 5 35
Wahoo Acanthocybium solandri 3 (3) 0 .03 (0 .01) 10 30
Silky shark Carcharhinus falciformis 2 (2) 0 .02 (0 .06) 10 20
Yellowfin tuna Thunnus albacares 3 (3) 0 .03 (0 .13) 5 15
Trumpetfish Aulostomus chinensis 1 (1) 0 .01 (0 .04) 5 5
Bigeye trevally (juv.) Caranx sexfasciatus 2 (1) 0 .01 (0 .04) 5 5
Grey reef shark Carcharhinus amblyrhynchos 3 (2) 0 .02 (0 .09) 5 5
Oceanic whitetip shark Carcharhinus longimanus 4 (1) 0 .01 (0 .04) 5 5
Flutemouth Fistularia sp . 5 (1) 0 .01 (0 .04) 5 5
Striped marlin Kajikia audax 6 (1) 0 .01 (0 .04) 5 5
Blainville’s beaked whale Mesoplodon densirostris 7 (1) 0 .01 (0 .04) 5 5
Pilot fish Naucrates ductor 8 (1) 0 .01 (0 .04) 5 5
TABLE 8.
Species observed
on mid-water
BRUVS at Niue
and Beveridge
Reef ranked by
Index of Relative
Dominance (IRD) .
Maximum number
of individuals
(MaxN) by longline
(camera), mean
MaxN per site (sd),
percentage of sites
where species was
present, and
(IRD = MaxN
site x % sites) .
32

Common Name Species N Mean length - cm (sd)
Wahoo Acanthocybium solandri 2 101 .3 (2 .1)
Bigeye trevally (juv.) Caranx sexfasciatus 1 5 .8
Grey reef shark Carcharhinus amblyrhynchos 2 145 .5 (14 .5)
Silky shark Carcharhinus falciformis 1 165 .1
Flying fish Cheilopogon spp. 11 32 .6 (5 .4)
Mackerel scad Decapterus macarellus 26 43 .5 (6 .5)
Rainbow runner Elagatis bipinnulata 17 63 .9 (15 .8)
Striped marlin Kajikia audax 1 331 .8
Skipjack tuna Katsuwonus pelamis 5 59 .8 (10 .2)
Pilot fish Naucrates ductor 1 9 .5
Freckled driftfish Psenes cyanophrys 4 7 .0 (5 .1)
Yellowfin tuna Thunnus albacares 1 98 .6
Due to the low number of fishes observed, the entire video, beyond the standardized
two-hour sampling period, was scanned for additional species . This effort yielded five
additional individuals, four of which belonged to species previously recorded . The extended
sampling yielded a single shortfin mako shark (Isurus oxyrhynchus) south of Beveridge Reef
(318 .6 cm TL, Figure 27) . Additionally, the wahoo measured within the two-hour survey periods
were relatively small (= 101 .3 cm), compared to the two individuals documented outside the
survey period, which were much larger (185 .6 and 199 .0 cm) .
TABLE 9.
Measurements of
species observed
in mid-water
BRUVS surveys .
Total number
of individuals
measured (N),
mean length for
each species (cm),
and standard
deviation (sd)
of length .
33
EXPLORING THE MARINE ECOSYSTEMS OF NIUE ISLAND AND BEVERIDGE REEF | NATIONAL GEOGRAPHIC PRISTINE SEAS | MARCH 2017

Additional observations were made during time on the water while deploying and retrieving
mid-water BRUVS . A pod of Blainville’s beaked whales, consisting of at least four individuals,
was observed and opportunistically filmed to the west of Beveridge Reef on October 1, 2016
(Figure 27), and one individual was observed on a deployment to the east of the atoll four days
later . Humpback whales were commonly observed close to the reef, with mother and calf pairs
and singing males . Flying fish, of at least three taxa, were seen from the surface on all trips
outside the reef both at Niue and Beveridge Reef and were observed in abundances greater
than have been observed during previous Pristine Seas expeditions (Figure 27) . Few seabirds
were noted overall compared with other locations sampled as part of the Pristine Seas program .
FIGURE 27.
A . Shortfin mako
shark (Isurus
oxyrhynchos),
B . Blainville’s
beaked whale
(Mesoplodon
densirostris),
C . Flying fish
(Cheilopogon
spp) . All species
were observed at
Beveridge Reef .
A
B
C
34

Deep sea
We conducted 11 dropcamera deployments at Niue and Beveridge Reef from September 27–
October 8, 2016 . Deployments ranged from 276–2,447 m in depth (mean = 1,115 ± sd 796 m)
(Table 10) . The deep (1,094–2,447 m) seafloor was comprised largely of sand and cobble
habitat, while the most common substrata-type overall was sand . Three deployments at
mid-depths (276, 274, and 407 m) were classified as diagonal rock ridge .
Thirty-two species from 21 families were observed and six classes from five phyla were
represented in the video footage (Table 11, Figure 28) . The grey cutthroat eel (Synaphobranchus
affinis, Family Synaphobranchidae) was the most frequently counted of the fishes
(45% frequency of occurrence), followed by the cusk eel (Lamprogrammus brunswigi,
Family Ophidiidae, 36% frequency of occurrence), and their sightings ranged from 2,447 to
1,188 m depth . The deepwater red snapper (Etelis carbunculus, Family Lutjanidae, 27% frequency
of occurrence) and the rusty jobfish (Aphareus rutilans, Family Lutjanidae, 18% frequency
of occurrence) were observed in mid-depth surveys (276–506 m) .
Drop Location Date Lat. Long. Depth (m)
Habitat > 50%
Habitat > 30%
N1 S Niue 9/27/2016 -19 .1186 -169 .973 1,825 S C
N2 NE Niue 9/28/2016 -18 .9949 -169 .744 2,447 S C
N3 NW Niue 9/29/2016 -18 .9896 -169 .980 1,761 S F
N4 NW Niue 9/30/2016 -18 .9279 -169 .926 2,053 S S
N5 W Beveridge Reef 10/1/2016 -19 .9919 -167 .792 1,094 S S
N6 S Beveridge Reef 10/2/2016 -20 .0543 -167 .783 1,188 S C
N7 W Beveridge Reef 10/3/2016 -20 .0114 -167 .796 506 S R
N8 NW Beveridge Reef 10/4/2016 -19 .9819 -167 .778 276 R S
N9 NE Beveridge Reef 10/5/2016 -19 .9929 -167 .729 434 S S
N10 Alofi Ridge, Niue 10/7/2016 -19 .0736 -169 .961 274 R S
N11 Alofi Seamount, Niue 10/8/2016 -19 .0838 -169 .999 407 R R
TABLE 10.
Drop camera
deployments
and predominant
habitats: mud
(M), sand (S),
pebble (P), cobble
(C), boulder (B),
continuous flat
rock (F), diagonal
rock ridge (R),
and vertical
rock-pinnacle
top (T) .
35
EXPLORING THE MARINE ECOSYSTEMS OF NIUE ISLAND AND BEVERIDGE REEF | NATIONAL GEOGRAPHIC PRISTINE SEAS | MARCH 2017

Of the sharks, the grey reef shark (Carcharhinus amblyrhynchos) and the Galapagos shark
(Carcharhinus galapagensis) were each observed on one deployment, at 276 and 506 m
depth, respectively . The purple chimaera (Hydrolagus purpurescens, Family Chimaeridae)
was observed at 1,761 m and the lanternshark (Etmopterus sp ., Family Etmopteridae) was
observed at 1,188 m . The first observation of a smalltooth sand tiger (Odontaspis ferox, Family
Odontaspididae) in Niue was noted at 506 m depth .
Only one Echinoderm was observed: a sea star (Family Astropectinidae) at 506 m depth .
Arthropods were abundant . Gamba shrimp (Family Aristeidae) were the most numerous
and frequently encountered invertebrates, as they were sighted on 91% of the deployments .
Amphipod shrimps were also frequently encountered (sighted on 64% of deployments) .
Sponges (Family Porifera) were underrepresented, with only one species observed (glass
sponge, Family Euplectellidae) at 1,761 m depth . Cnidarians were represented by three families:
a sea anemone (Family Liponematidae) at 506 m depth, two Gorgonids (Leptogorgia sp . Family
Liponematidae), and a black coral (Family Antipathidae) at 274 m depth .
FIGURE 28.
Fishes observed
on dropcam
deployments .
A . Epinephelus
morrhua (276 m),
B . Odontaspis
ferox (506 m),
C . Paracaesio
kusakarii (274 m),
D . Synaphobranchus
affinis (2447 m) .
A B
DC
36

Order Family Species Common Name MaxN Freq. occ. (%)
Lyssacinosa Euplectellidae Glass sponge 0 .09 9 .1
Actiniaria Liponematidae Liponema sp . Sea anemone 0 .09 9 .1
Alcyonacea Gorgoniidae Leptogorgia Gorgonid 0 .64 9 .1
Antipatharia Antipathidae Black coral 0 .09 9 .1
Amphipoda Amphipod shrimp 11 .64 63 .6
Decapod shrimp 0 .09 9 .1
Aristeidae Gamba shrimp 2 .27 90 .9
Pandalidae Pandalid shrimp 0 .09 9 .1
Decapoda Hermit crab 0 .09 9 .1
Paxillosida Astropectinidae Sea star 0 .09 9 .1
Anguilliformes Muraenidae Gymnothorax berndti Y-patterned moray 0 .09 9 .1
Eel 0 .18 18 .2
Synaphobranchidae Synaphobranchus affinis
Grey cutthroat eel 0 .73 45 .4
Gadiformes Macrouridae Gadamus sp . Grenadier 0 .36 18 .2
Moridae Antimora rostrata Blue antimora 0 .18 9 .1
Guttigadus sp . Morid cod 0 .09 9 .1
Ophidiiformes Ophidiidae Lamprogrammus brunswigi
Cusk eel 0 .36 36 .4
Lepophidium negropinna
Specklefin cusk eel 0 .09 9 .1
Perciformes Carangidae Caranx lugubris Black jack 0 .18 9 .1
Seriola rivoliana Almaco jack 0 .18 9 .1
Lutjanidae Aphareus rutilans Rusty jobfish 0 .18 18 .2
Etelis carbunculus Deepwater red snapper 0 .27 27 .3
Snapper 0 .09 9 .1
Paracaesio kusakarii Saddle-back snapper 1 .64 9 .1
Pristipomoides zonatus
Oblique-banded snapper
0 .09 9 .1
Serranidae Epinephelus morrhua Comet grouper 0 .09 9 .1
Trichiuridae Benthodesmus sp . Frostfish 0 .09 9 .1
Carcharhiniformes Carcharhinidae Carcharhinus amblyrhynchos
Grey reef shark 0 .09 9 .1
Carcharhinidae Carcharhinus galapagensis
Galapagos shark 0 .09 9 .1
Chimaeriformes Chimaeridae Hydrolagus purpurescens
Purple chimaera 0 .09 9 .1
Lamniformes Odontaspididae Odontaspis ferox Smalltooth sand tiger 0 .09 9 .1
Squaliformes Etmopteridae Etmopterus sp . Velvet belly dogfish 0 .09 9 .1
TABLE 11.
Phylogenetic
listing of taxa
observed on
dropcam videos
with maximum
number of
individuals
(MaxN) by site
and frequency
of occurrence
(Freq . occ . %) .
37
EXPLORING THE MARINE ECOSYSTEMS OF NIUE ISLAND AND BEVERIDGE REEF | NATIONAL GEOGRAPHIC PRISTINE SEAS | MARCH 2017

Fishing effort in and around Niue’s EEZ
We examined the magnitude and spatial distribution of fishing effort inside and around
Niue's EEZ from 2013 to 2016 using data from Global Fishing Watch (GFW) . GFW uses
machine-learning algorithms to classify vessels based of their movement patterns . This
classification is used when official data are not available; for Niue’s analysis we used a
minimum classification accuracy of 80%, which minimizes the possibility that we include
cargo or shipping vessels . SPC data for 2015 shows that fishing effort days as reported by GFW
are about 36% of those reported to SPC CES database . Although GFW data for Niue’s EEZ are
limited, they do provide important insights into the spatial and temporal dynamics of fisheries,
especially when other data are nonexistent or not available .
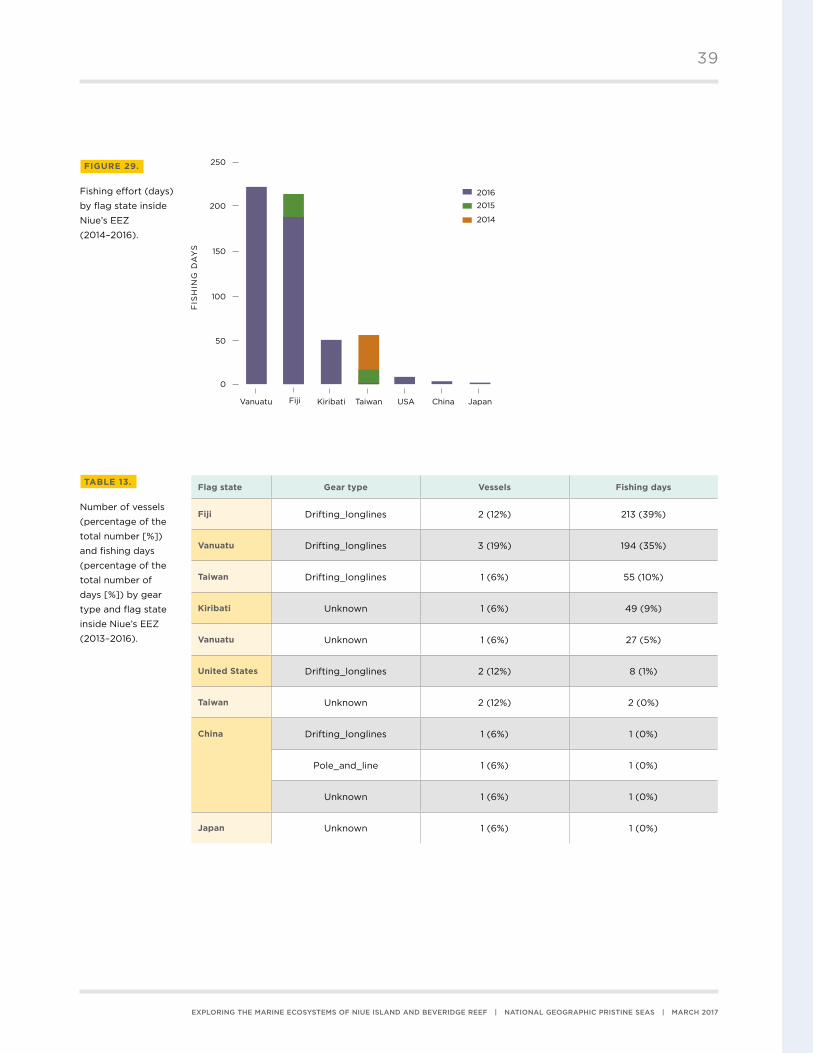
Over this four-year period, 16 unique fishing vessels from seven flagged states (Kiribati, Fiji,
Vanuatu, United States, Japan, Taiwan, and China) were observed fishing inside Niue's EEZ from
GFW . Total fishing effort has increased inside Niue's EEZ from zero vessels and zero fishing days
in 2013 to 12 vessels and 467 fishing days in 2016 (Table 12) . This apparent drastic increase is
likely a result of increasing coverage in GFW data and more widespread use of the automated
identification system (AIS) by fishing vessels . A notable exception to this overall increase is the
sharp decrease in Taiwanese fishing effort from 40 fishing days in 2014 to only one fishing day in
2016 (Figure 29) . Total fishing effort was predominantly by long-liners from Fiji (39%), Vanuatu
(35%), and Taiwan (10%), and vessels from Kiribati of unknown gear type (9%, Table 13) . Maps of
vessel tracks and fishing effort reveal that fishing activity is more intense to the northwest, and
to a lesser extent, the southwest portions of the EEZ (Figure 30, 31) . These data are conservative
and underestimate the number of fishing vessels operating in Niue’s EEZ because many fishing
vessels either do not carry AIS or turn it off when fishing illegally . From our work in other areas,
we have concluded that AIS tracking accounts for only 30–50% of the fishing effort .
Year Fishing vessels Days in EEZ Fishing days in EEZ Hours in EEZ Fishing hours in EEZ
2013 0 23 0 381 0
2014 1 82 40 1,494 593
2015 6 123 45 2,149 544
2016 12 619 467 13,238 6,895
TABLE 12.
Fishing vessels
and fishing effort
inside Niue’s EEZ
(2013–2016) .
38
Flag state Gear type Vessels Fishing days
Fiji Drifting_longlines 2 (12%) 213 (39%)
Vanuatu Drifting_longlines 3 (19%) 194 (35%)
Taiwan Drifting_longlines 1 (6%) 55 (10%)
Kiribati Unknown 1 (6%) 49 (9%)
Vanuatu Unknown 1 (6%) 27 (5%)
United States Drifting_longlines 2 (12%) 8 (1%)
Taiwan Unknown 2 (12%) 2 (0%)
China Drifting_longlines 1 (6%) 1 (0%)
Pole_and_line 1 (6%) 1 (0%)
Unknown 1 (6%) 1 (0%)
Japan Unknown 1 (6%) 1 (0%)
TABLE 13.
Number of vessels
(percentage of the
total number [%])
and fishing days
(percentage of the
total number of
days [%]) by gear
type and flag state
inside Niue’s EEZ
(2013–2016) .
FIGURE 29.
Fishing effort (days)
by flag state inside
Niue’s EEZ
(2014–2016) .
39
EXPLORING THE MARINE ECOSYSTEMS OF NIUE ISLAND AND BEVERIDGE REEF | NATIONAL GEOGRAPHIC PRISTINE SEAS | MARCH 2017
Kiribati Taiwan USA China JapanFijiVanuatu
0
100
150
200
250
50
FIS
HIN
G D
AY
S2016
2015
2014

FIGURE 31.
Spatial distribution of
fishing effort in and
around Niue’s EEZ
(2013–2016) .
Grid size = 0 .25º .
FIGURE 30.
Tracks of fishing
vessels inside and
around Niue’s EEZ
(2013–2016) .
40
China
Fiji
Japan
Kiribati
Taiwan
United States
Vanuatu
LONGITUDE
-168 -166-170-172
LA
TIT
UD
E
-22
-20
-18
-16China
Fiji
Japan
Kiribati
Taiwan
United States
Vanuatu
LONGITUDE
-168 -166-170-172
LA
TIT
UD
E
-22
-20
-18
-16
FISHING HOURS
300 500400200100

FIGURE 32.
Change in projected
maximum catch
potential of Niue and
surrounding nations’
EEZs in 2050 relative
to 2000 levels under
Representative
Concentration
Pathways 8 .5 scenario
(Lam et al . 2016) .
Understanding how climate change is likely to alter the fisheries revenues of maritime countries
is a crucial next step towards the development of effective socioeconomic policy and food
sustainability strategies to mitigate and adapt to climate change (Lam et al . 2016) . Maximum
fisheries catch potential (MCP) is projected to decrease globally by nearly 8% by 2050 relative
to 2000 under the business-as-usual scenario (Representative Concentration Pathways [RCP]
8 .5) . While the decline in MCP in Niue’s EEZ is not as low as that for other nations in the region,
there is still projected to be a 5–15% decline in maximum catch potential in Niue’s waters under
conservative climate change projections (Lam et al . 2016, Figure 32) .
The ocean’s least productive waters (oligotrophic) are expanding due to climate change
(Polovina et al . 2008) . Niue is located in the center of the oligotrophic South Pacific gyre
(Figure 33) . This area is expanding at 245,766 km2/year or 1 .4% of the total per annum
(Polovina et al . 2008) . The expansion of the low chlorophyll waters is consistent with global
warming scenarios based on increased vertical stratification in the midlatitudes, but the rates
of expansion already greatly exceed recent model predictions . This means that Niue’s already
low productivity waters will likely decrease even further in the future .
41
EXPLORING THE MARINE ECOSYSTEMS OF NIUE ISLAND AND BEVERIDGE REEF | NATIONAL GEOGRAPHIC PRISTINE SEAS | MARCH 2017
FIGURE 33.
Primary productivity
in austral summer
from NASA SeaWiFS .
Approximate position
of Niue’s EEZ
represented by
red circle .
210° E 220° E200° E190° E180° E
30° S
20° S
10° S >30
15
5
-5
-15
-30
<-50
% C
HA
NG
E IN
MC
P
210° E 220° E200° E190° E180° E
30° S
20° S
10° S >30
15
5
-5
-15
-30
<-50
% C
HA
NG
E IN
MC
P
210° E 220° E200° E190° E180° E
30° S
20° S
10° S >30
15
5
-5
-15
-30
<-50
% C
HA
NG
E IN
MC
P

Microplastics
Given the increasing levels of plastic pollution of the oceans, it is important to better understand
the impact of microplastics in the ocean food web . We partnered with National Geographic
Emerging Explorer Gregg Treinish from Adventurers and Scientists for Conservation (ASC),
to sample microplastics during our expedition . We collected samples of seawater in one-liter
bottles at 20 locations during the expedition .
Microplastics averaged only 0 .37 pieces per liter and were present in 35% of our samples, which
is lower than we have seen in most of the other locations we have sampled . Abundance and max
number were slightly higher at Beveridge Reef compared with Niue but the differences were
small (Table 14) . None of the samples taken in the lagoon at Beveridge Reef (n = 3) had any
microplastics present . Blue and black filaments were the most abundant microplastics observed .
Location Samples Samples w/o plastics Pieces/L (sd) Max Pieces/L
Beveridge Reef 8 62 .50% 0 .46 (0 .78) 2 .22
Niue 12 66 .67% 0 .30 (0 .49) 1 .45
Total 20 65.00% 0.37 (0.61) 2.22
Type of microplastic N
Blue filament < 1.5 mm 4
Black filament < 1.5 mm 3
Red filament 1.6–3.1 mm 1
Transparent filament < 1.5 mm 1
Black other shape < 1.5 mm 1
TABLE 14.
Summary of
microplastics
found in water
samples at Niue .
42

Micropaleontology
Microfossils are excellent indicators of general environmental conditions such as temperature,
salinity and organic enrichment . While some species are cosmopolitan and found worldwide,
others are unique to certain geographic locations . We sampled at 20 locations for microfossils
during the expedition .
Analysis of the 20 samples is pending, but two samples from Beveridge Reef were selected to
represent the lagoon and forereef habitats and picked for foraminifera (> 125 um) . The samples
were dyed with rose bengal and treated with ethanol when collected, and 10 ml of a sample was
wet sieved with > 125 um (63–125 um fraction was archived) for foraminifer analysis . Both samples
are mostly biogenic and contained benthic foraminifera almost exclusively (Figure 34, Table 15) .
FIGURE 34.
Foraminifera sorted
from the forereef at
Beveridge Reef .
TABLE 15.
Micropaleontology
samples sorted from
Beveridge Reef .
Picked sample A16 - forereef A17 - lagoon
Stained/living foraminifers None None
Number of foraminifers per 10 ml ~300 ~240
Number of species ~30 ~14
Size ≥ 500µ: 56%, < 500µ: 44%
≥ 500µ: 77%, < 500µ: 23%
Breakage 40% 60%
Erosion 50% 80%
Foraminifer dominant Textulariina Textulariina
Suborder (Agglutinated): 55% (Agglutinated): 33 .3%
Miliolina: 20%
Rotaliina: 25%
43
EXPLORING THE MARINE ECOSYSTEMS OF NIUE ISLAND AND BEVERIDGE REEF | NATIONAL GEOGRAPHIC PRISTINE SEAS | MARCH 2017

DIS
CU
SS
ION
Our expedition was a collaborative effort between the government
of Niue, National Geographic Pristine Seas, Oceans 5, and the Pacific
Community . This integrated assessment highlights both the global
importance of Beveridge Reef as a shark hotspot and the low standing
stock of nearshore fishes around Niue . By creating well-managed
resource use zones and a world-class marine reserve, Niue’s global
profile as a pristine ecotourism destination would increase, as would
its contribution to global marine conservation . In addition, effectively
managing the nearshore resources would provide sustainable food
security for the people of Niue into the future .
Benthic communities
The windward (east) sides of both islands had low structural complexity and limited biotic
cover . Compared with Beveridge Reef, Niue had higher cover of coral and erect algae, with less
bare substrate . The topographic relief of the uplifted island of Niue provides a more sheltered
leeward shore compared with Beveridge Reef, which is emergent only at low tide . This shelter
likely provides a more favorable environment for the growth of coral and erect algae . Beveridge
Reef has been impacted by a number of cyclones in recent years, which would make the recovery
of coral and the growth of erect algae more difficult . The low cover of turf algae at both islands
likely reflects high grazing intensities by herbivorous fishes, as well as low productivity .
Cyclone Heta, a category 5 tropical cyclone, struck Niue in 2004, generating waves in excess of
30 m and significantly impacting on marine, as well as terrestrial environments . The cyclone’s
center passed within 15 km of the Niuean capital, Alofi, and produced a sea surge of over
50 m, which overtopped the sea cliffs and pushed inland more than 100 m, devastating all in its
path . Damage from Cyclone Heta was estimated at more than NZ$37 million . Many of the coral
colonies on the leeward side of Niue, particularly those of the genus Acropora, were very similar
in size structure, likely reflecting the decade of growth following Cyclone Heta (Figure 35) .
DISCUSSION
45
EXPLORING THE MARINE ECOSYSTEMS OF NIUE ISLAND AND BEVERIDGE REEF | NATIONAL GEOGRAPHIC PRISTINE SEAS | MARCH 2017

Nearly 50% of the coral reefs across the Pacific are classified as threatened (Burke et al . 2011,
Bruno and Selig 2007) . The mean coral values reported at Niue (19%) and Beveridge Reef (15%)
are slightly lower than the regional average, around 20%, for the Central Pacific (Bruno and
Selig 2007) . This might reflect the multiple cyclone impacts over the last few decades, coupled
with low productivity and recruitment limitation due to the islands' isolation . Protecting the
remaining living corals should be a conservation priority .
Except for sea urchins and giant clams, densities of invertebrates were relatively low in Beveridge
Reef and Niue compared with other locations around the Pacific suggesting that isolation of
the two locations may play important roles in the presence and abundance of these species .
Results from manta tows on the forereef at both reef systems indicate that strong wind and
swell exposure likely play an important role in the distribution and replenishment of species and
may strongly affect the settlement of individuals .
Observed densities of giant clams were relatively high at Beveridge Reef, close to the regional
reference density considered for healthy stocks of 750 individuals ha-1 . Densities observed on
the leeward side of Beveridge Reef and inside the lagoon tend to suggest a healthy population
with low fishing pressure, whereas Niue had low densities even on the leeward part of the
reef, which receives less fishing pressure than the leeward coast . Cyclone Heta is likely to
have strongly affected the population in both locations . The relatively small size of individuals
observed in Beveridge Reef lagoon (shallow depth) may be a consequence of the cyclone,
which may have wiped out the older and larger individuals . Moreover, the lack of mature
individuals after the cyclone combined with the isolation of the locations may have affected
subsequent recruitment to the area .
FIGURE 35.
Many coral species,
like this table
coral (Acropora
cytherea), showed
similar size
structure, likely
resulting from
regrowth following
Cyclone Heta
in 2004 .
46

Shallow water fishes
Fish biomass was more than two times greater at Beveridge Reef than at Niue, and the biomass
of piscivores was 7 .5 times greater . Several large blacksaddled coral grouper (Plectropomus
laevis) were observed at Beveridge Reef (Figure 37) . Planktivores were in notably low abundance
at all locations . Fish biomass was not significantly different between the Alofi no-take MPA and
other locations along the leeward coast of Niue, regardless of depth .
The fish biomass at Beveridge Reef, based on visual surveys, was dominated by grey reef sharks .
In addition, our BRUV results indicate a large abundance of grey reef sharks at Beveridge Reef
when compared with other global locations where BRUVs have been deployed to quantify
sharks . Sharks and other predatory fish abundance at Niue was low, very likely due to continuous
overfishing and fishing for sharks .
Sharks are globally threatened and extirpation of these species from fished coral-reef systems is
an imminent likelihood in the absence of substantial changes to coral reef management (Robins
et al . 2006, Ferritti et al . 2010) . High exploitation rates coupled with low resilience to fishing
pressure have resulted in shark population declines worldwide (Dulvy et al . 2014) . The landings
of sharks and rays, reported to the United Nations Food and Agriculture Organization (FAO),
increased steadily to a peak in 2003 (> 900,000 tons) and have declined by 20% since (Dulvy
et al . 2014) . True total catch, however, is likely to be three to four times greater than reported
(Clarke et al . 2006, Worm et al . 2013) . Over one-third of sharks and rays in the southwest Pacific
region are threatened with extinction (Jupiter et al . 2014), and immediate and substantial
reductions in shark fishing will be required to reverse their ongoing collapse .
FIGURE 36.
Grey reef sharks are
globally threatened .
47
EXPLORING THE MARINE ECOSYSTEMS OF NIUE ISLAND AND BEVERIDGE REEF | NATIONAL GEOGRAPHIC PRISTINE SEAS | MARCH 2017

The fish assemblage at Niue and Beveridge Reef has affinities to the central Pacific . It is
depauperate relative to nearby Tonga, where 1162 species have been recorded (Randall et al .
2003) . This difference is most likely due to the limited amount of habitat available around Niue
for colonization . Ecsenius niue is a small blenny endemic to Niue (Figure 38) . This species is
locally abundant and while it has a very limited range, it has no known threats and is considered
of Least Concern by the IUCN Red List of Threatened Species .
FIGURE 37.
We observed
several large
blacksaddled
coral grouper
(Plectropomus
laevis) at
Beveridge Reef .
FIGURE 38.
Ecsenius niue is
a small blenny
endemic to
Niue but locally
abundant in shallow
subtidal habitats
with living coral .
48

Pelagic ecosystem
Relative to other locations sampled within the Pristine Seas program, there were few scad
(Decapterus spp .), which are a common pelagic prey species . This raises the question as to
what the primary prey are for large pelagic predators such as the wahoo, tuna, and marlin we
observed . Since flying fish were observed in large numbers, it may be that they replace scad as
the primary prey in Niue’s EEZ .
Few sharks were recorded on the pelagic cameras, which is striking given the remoteness of
Beveridge Reef and the high number of reef sharks that we observed there . Relative to other
sites sampled during the Pristine Seas program, the pelagic fish assemblage at Niue and
Beveridge Reef is depauperate . The low richness and abundance may reflect the low natural
productivity of the region and/or the result of overfishing . The primary productivity of Niue’s
EEZ is 159 mg C m-2 day-1, with a total shelf area (284 km2) < 0 .1% of its EEZ (Zylich 2012) .
This level of primary productivity is lower than that reported for nearby Tonga (217 mg C m-2
day-1) and the Cook Islands (198 mg C m-2 day-1), and much lower than New Zealand to the south
(493 mg C m-2 day-1) . Total fisheries extraction from Niue is low (1,400 t in 2010, Zylich 2012) .
However, given the low productivity of these waters and the small shelf area, it may be that
even low levels of exploitation can deplete this remote and isolated area . However, we also
note that our surveys are a snapshot in time and higher levels of sampling throughout the
year could yield different results .
Deepwater ecosystems
Our deep (276–2,447 m) video camera footage provided an important contribution to our
understanding of the marine fauna of Niue . Despite Niue’s isolation, we observed a relatively
diverse assemblage of species compared with other populated areas in the Pacific (Dalzell et
al . 1993) . At least 23 taxa of deepwater fishes from 14 families were observed . We observed a
smalltooth sand tiger shark (Odontaspis ferox) at 506 m depth, representing the first record
of this species at Niue . Important resource fishes were observed at mid-depths, including the
comet grouper (Epinephelus morrhua), and several species of jacks (Carangidae) and snappers
(Lutjanidae) . During an early assessment of marine resources at Niue (Dalzell et al . 1993),
concluded that fish stocks were abundant and under-exploited . Our video footage shows that
while important food fishes were noted, abundances were low relative to other areas we have
surveyed in the Pacific . For example, only one species of fish was observed schooling in high
density: the saddle-back snapper (Paracaesio kusakarii) at 274 m, and only on one occasion .
Other food fishes averaged less than one individual per frame .
49
EXPLORING THE MARINE ECOSYSTEMS OF NIUE ISLAND AND BEVERIDGE REEF | NATIONAL GEOGRAPHIC PRISTINE SEAS | MARCH 2017

Rare and unique species
Blainville’s beaked whales (Mesoplodon densirostris) were observed at Beveridge Reef, which is
the first record of this species from Niue’s EEZ . There is limited information on global abundance
and none on trends in abundance for this species . It is not believed to be uncommon but it is
potentially vulnerable to low-level threats and a 30% global reduction over three generations
cannot be ruled out . For these reseasons, it is listed as Data Deficient by IUCN . Previous studies
of movement patterns on this species suggest strong site fidelity (Schorr et al . 2009), so these
individuals may represent a resident population . Despite our sampling period being late in the
season, humpback whales were commonly observed close to the reef at Beveridge Reef . We
observed mothers with calves and males engaged in singing behavior .
The flat-tail sea snake or katuali (Laticauda schistorhynchus) has a very restricted range and is
known only from Niue, where it has an extent of occurrence estimated to be less than 300 km² .
This species is listed as Vulnerable by the IUCN and needs to reproduce on land . Its current
threats include habitat degradation from coastal development and extreme weather events
such as cyclones . Future threats include sea level rise due to climate change .
As noted earlier, we made the first observation of a smalltooth sand tiger (Odontaspis ferox,
Family Odontaspididae) in Niue . Although O. ferox is not specifically targeted by commercial
fishing activities, its likely very low fecundity make it susceptible to local extirpation, even at
seemingly small capture rates (Fergusson et al . 2008) . This species is considered Vulnerable
globally by the IUCN .
50

Management implications
Our results indicate that due to the low productivity and isolation of the region, Niue’s marine
ecosystems are highly vulnerable to anthropogenic and natural forcing factors, including fishing
activity, storm events, and prospective climate change .
HUMAN-CAUSED
The sensitivity of the region to human activity is especially apparent when comparing Niue and
Beveridge Reef . Fish biomass is more than twice as high in Beveridge Reef, an area of no fishing,
as compared with Niue, which has relatively high fishing pressure . The disparity in biomass is
even greater in piscivore biomass, particularly sharks, which were abundant at Beveridge Reef
but uncommon on our surveys at Niue . Indeed, fish biomass around Niue is some of the lowest
we have witnessed in the Pacific and is consistent with previous work that showed similar results
(Labrosse et al . 1999) . This indicates that even relatively little fishing activity can significantly
impact such a vulnerable ecosystem .
Anecdotally, older fishermen shared that marine resources are in poorer condition compared
with the past . Niue’s fishing culture is strong and many on the island depend on local catch for
their food security . However, there is a huge demand for fresh Niue fish from off-island Niueans,
who represent > 90% of the country’s population . Exportation of coconut crabs from Niue
to New Zealand was banned in 2015 because export numbers had exceeded the suggested
harvest levels for the size of Niue . However, there are currently no regulations, or estimates,
of the amount of fish that are exported to New Zealand by individuals via plane . Nearshore
fisheries resources cannot sustain this level of fishing pressure .
We found no differences in fish biomass between the MPA and adjacent areas despite 20+ years
of protection . Fishing line was evident throughout the MPA and poaching inside the MPA likely
has contributed to its ineffectiveness . Our deepwater surveys recorded a number of important
food fish species; however with low abundances and the ease of overfishing, these stocks likely
cannot withstand intensive exploitation and are in need of increased protection .
NATURAL
A major contributor to resource depletions around Niue is the limited natural carrying capacity
of the coastal habitats, which are also under constant pressure from high harvest levels (Fisk
2007) . As a result of natural disturbances (cyclones, storms, bleaching) and large variations in
species replenishment (due to the isolation of Niue from other similar reef systems), the island
likely experiences wide fluctuations in resource availability and abundance, on both spatial
and temporal scales . These patterns coupled with limited habitat and future climate change
scenarios indicate that fish assemblages around Niue are depleted at some level and may not
recover under current management activities and future environmental conditions .
51
EXPLORING THE MARINE ECOSYSTEMS OF NIUE ISLAND AND BEVERIDGE REEF | NATIONAL GEOGRAPHIC PRISTINE SEAS | MARCH 2017

MANAGEMENT OPTIONS
Our results suggest Beveridge Reef still has relatively healthy shark populations compared with
most places around the world and protecting this remote atoll and its surrounding area should
be a top priority for the conservation of Niue’s natural heritage . For inshore fisheries, the 2008
Pacific Islands Regional Coastal Fisheries Management Policy (Apia Policy) recognized the
need for better management to improve sustainable fisheries yields and maintain ecosystem
function (Jupiter et al . 2014a) . Fisheries management relies on controlling fishing effort
(e .g . seasonal and area closures, gear restrictions, limited entry) and/or catch (e .g . bag and
size limits, catch quotas), and many of these measures have been practiced in various forms
for thousands of years by indigenous peoples in the Pacific, including Niue (Friedlander 2015) .
The lack of even the most basic knowledge on catch and effort among most nearshore fisheries
in the Pacific makes harvest controls impractical except for a small number of select and
valuable single species fisheries . Spatial management, in the form of MPAs; customary marine
tenure; more comprehensive marine zoning; and restrictions on destructive and overly efficient
fishing gear holds the greatest promise for reversing the decline in coral reef fisheries and the
associated ecosystem in the region .
Identifying areas that significantly contribute to fisheries sustainability via a series of
strategically selected, long-term, and highly restrictive MPAs would enhance fisheries and
preserve biodiversity (Gaines et al . 2010) . The establishment of no-take protected areas that
are effectively enforced has proven to be a valuable fisheries management tool through adult
spillover and enhanced reproductive output (Sladek Nowlis and Friedlander 2005, Edgar et al .
2014), and should be a priority to sustainably manage marine resources in Niue .
The traditional system in many Pacific Islands emphasized social and cultural controls
on fishing with a code of conduct that was strictly enforced (Johannes 1978, 1982, Ruddle
1988, Veitayaki 1997, Poepoe et al . 2007) . Integrating traditional ecological knowledge and
customary management practices into contemporary marine management has shown promise
in a number of locations through revitalization of local traditions and resource knowledge
(Berkes et al . 2000, Cinner et al . 2005, Aswani & Hamilton 2004, Friedlander et al . 2013) .
Today hundreds of Pacific Island communities engage in bottom-up management of their
coastal and marine resources, with technical support and resources provided by the Locally
Managed Marine Area network (Jupiter et al . 2014b) .
In summary, our results suggest the need to create small no-take areas around Niue and
well-managed fishing areas around those, to stop the depletion of reef fish around Niue . In
addition, our results strongly suggest the need to establish a world-class no-take marine
reserve in and around Beveridge Reef .
52

ENFORCEMENT
Any future marine spatial plan will require improved enforcement of existing regulations . Our
surveys found no differences in fish biomass between the existing Alofi MPA and adjacent areas
despite 20+ years of protection . The discovery of fishing line throughout the MPA suggests
low adherence to existing regulations . To ensure efficacy of a future marine spatial plan and
long-term food security, Niuen officials should seek to improve enforcement of existing and
future regulations .
ECOSYSTEM-BASED MANAGEMENT
To conserve marine biodiversity, maintain fisheries, and deliver a broad suite of ecosystem
services over a long-term timeframe, an ecosystem-based fisheries management (EBFM)
approach is necessary (Pikitch et al . 2004, Rosenberg & McLeod 2005) . Integrated island
management offers considerable cost-effectiveness and efficient ways to simultaneously
manage biodiversity, climate adaptation, disaster risk reduction and health services (Jupiter
et al . 2014b) . By creating well-managed resource use zones and a world-class marine reserve,
Niue’s global profile as a pristine ecotourism destination would rise, as would its contribution to
global marine conservation, and its ability to provide food security into the future .
53
EXPLORING THE MARINE ECOSYSTEMS OF NIUE ISLAND AND BEVERIDGE REEF | NATIONAL GEOGRAPHIC PRISTINE SEAS | MARCH 2017

Pristine Seas’ recommendations
BEVERIDGE REEF NO-TAKE MARINE PROTECTED AREA
Beveridge Reef is of extraordinary natural and cultural value to the people of Niue . Our results
also suggest it is an important refuge for the grey reef shark, a globally threatened species,
and potentially Blainville’s beaked whale, whose life history and population status are virtually
unknown . As such, we recommend the creation of a no-take marine reserve at Beveridge
Reef and its surrounding pelagic zone . This area would protect the entire Beveridge Reef and
surrounding waters frequently used by pelagic species with large habitat use range like sharks,
tunas, cetaceans, and sea turtles .
The proposed Beveridge Reef no-take marine protected area (Figure 39) would cover at least
six seamounts, ecosystems know for their high levels of endemism and importance as stepping
stones for highly migratory species . The proposed polygon would have a minimal impact on
current industrial fishing effort (as per Global Fishing Watch effort data) and ongoing artisanal
fishing around Niue Island .
The reserve could benefit Niue in several ways:
n Ecotourism: The proposed marine protected area would position Niue as global leader in
marine conservation by protecting 40% of its entire EEZ (> 130,000 km2) . Recent studies
suggest that greater levels of protection may bring greater tourism-related economic revenue .
In the Caribbean and Pacific Coast of Central America, half of all dives take place in marine
protected areas (Green and Donnelly 2003) . In the Galápagos, marine-based tourism supports
more than one-third of all jobs, bringing nearly US$178 million per year to the local economy .
There, the tourism value of a shark over its lifetime is US$5 .4 million, while a dead shark brings
fishermen less than US$200 . In Palau, live sharks in the water bring in $1 .9 million to Palau’s
economy through dive tourism (Vianna et al . 2012) .
n Shark refuge: Grey reef shark populations in some areas of the Indo-Pacific have experienced
marked declines in recent years due to increased human pressure (Robbins et al . 2006) . Large,
no-take marine reserves offer important refuge for this threatened species (White et al . 2017) .
n Pelagic fisheries recovery: Despite the ability of many pelagic species to move great distances,
some individuals will spend their entire lives inside the proposed sanctuary, thus increasing
the density of marine life inside the reserve, boosting genetic diversity, and increasing local
reproductive output, which in turn would benefit adjacent fisheries . Researchers in the
western Pacific previously found that half of skipjack tuna spend their entire lives within a
radius of 675–750 km and yellowfin tuna were found to have even smaller ranges (Sibert
and Hampton 2003) . It has been shown that > 91% of the sub-adult yellowfin tuna collected
from the nearshore Hawaiian Islands originated from this same nursery . In addition, sub-adults
from the offshore location within the Hawaiian Islands appear to originate from the nearshore
Hawaiian Islands, highlighting the importance of local production and retention of yellowfin
tuna to the standing stock and domestic fisheries of Hawaii (Wells et al . 2012) .
54

Therefore, Niue could achieve benefits from domestic conservation and fishery development
policies, although international cooperation could also be necessary . The long reach of global
fishing fleets has eliminated nearly all natural refugia, and as a result we urgently need to
protect large areas of the ocean to achieve sustainable ecosystems .
Figure 39 presents potential approaches to expand current protection around Beveridge Reef
and its surrounding pelagic zone in a no-take marine protected area . It is important to note
that only the 40% EEZ no-take designation (Figure 39D) would qualify as a large-scale MPA
according to IUCN and Big Oceans standards . This would well exceed Niue’s Aichi Target of
protecting 10% of coastal and marine areas and place it second only to Palau in total percent
of EEZ protected . We recommend conducting a cost-benefit analysis to determine the optimal
reserve size to achieve Niue’s long-term goals . This would include a detailed analysis of the
historical commercial value of the proposed area, as well as alternatives such as ecotourism .
The creation of a large protected area (> 100,000 km2) around Beveridge Reef would certainly
put Niue in an elite group and elevate its status as a global leader in marine conservation .
FIGURE 39.
Potential approach
to the Beveridge
Reef no-take
marine protected
area . A . 20% of
Niue’s EEZ equaling
63,600 km2,
B . 25% of Niue’s
EEZ equaling
79,250 km2,
C . 30% of Niue’s
EEZ equaling
95,100 km2,
D . 40% of Niue’s
EEZ equaling
132,000 km2 .
A B
DC
Lati
tud
e
-22
-20
-18
-22-22
-20-20
-18 -18
-22
-20
-18
Longitude-172
-172
-170
-170
-168
-168
-166
-166
-172
-172
-170
-170
-168
-168
-166
-166
55
EXPLORING THE MARINE ECOSYSTEMS OF NIUE ISLAND AND BEVERIDGE REEF | NATIONAL GEOGRAPHIC PRISTINE SEAS | MARCH 2017

ME
TH
OD
S

Benthos – Characterization of the benthos was conducted along 50 m-long transects running
parallel to the shoreline at each sampling depth strata . For algae, corals, and other sessile
invertebrates we used a line-point intercept methodology along each transect, recording the
species or taxa found every 20 cm on the measuring tape for a total of 250 points per transect .
Transects were conducted at 10 and 20 m per site . At Beveridge Reef, we conducted five stations
along the backreef area in the lagoon at ~ 1 m water depth to characterize a hard-bottom habitat
not found around Niue . At Niue, we conducted transects at 5 m inside and adjacent to the
marine protected area, in addition to the 10 and 20 m strata . For mobile invertebrates (primarily
echinoderms), we counted individuals in 15, 50 x 50 cm quadrats randomly placed along each of
the 50 m transects . Echinoderm test diameter (cm) was estimated for every individual, and total
length (cm) was estimated for individual sea cucumbers and longest arm for sea stars .
Benthic functional groups were compared between Niue and Beveridge Reef using SIMPER
(similarity percentage analysis) in the PRIMER software package (Clarke et al . 2014) with wind
exposures by island as a factor and coral species composition at each site as the dependent
variable . The species matrix examined the contribution of each species to average resemblances
between sample groups using Bray-Curtis similarities . Principal coordinates analysis using a
Bray-Curtis similarity matrix was used to examine the percent cover of benthic functional groups,
and coral species that had the most influence in separating reefs at Niue and Beveridge Reef in
ordination space . Percent cover of benthic functional groups was arcsine square root transformed
prior to statistical analyses . Permutational multivariate analysis of variance (PERMANOVA)
was used to examine differences in benthic functional groups between islands, depths (10 and
20 m strata only), and wind exposures (i .e ., windward vs . leeward) . Data were arcsin square
root-transformed and based on a Bray-Curtis dissimilarity matrix for the PERMANOVA .
Fishes – At each depth stratum within a site, divers counted and estimated lengths for all fishes
encountered within fixed-length (25 m) belt transects whose widths differed depending on
the direction of swim . All fish ≥ 20 cm total length (TL) were tallied within a 4m-wide strip
surveyed on an initial “swim-out” as the transect line was laid (transect area = 100 m2) . All
fishes < 20 cm TL were tallied within a 2m-wide strip surveyed on the return swim back along
the laid transect line (transect area = 50 m2) .
Fish assemblage characteristics (e .g ., species richness, numerical abundance, and biomass)
were compared among locations using two-way ANOVA with island and exposure as factors .
Unplanned comparisons between pairs of locations were examined using the Tukey-Kramer
HSD . Numerical abundance and biomass were ln(x+1) transformed prior to statistical analysis .
METHODS
57
EXPLORING THE MARINE ECOSYSTEMS OF NIUE ISLAND AND BEVERIDGE REEF | NATIONAL GEOGRAPHIC PRISTINE SEAS | MARCH 2017

A similar analysis was conducted between islands and depth strata and within islands among
depth strata . Species composition was compared between Niue and Beveridge Reef using
SIMPER . Fish biomass was compared between the Alofi MPA and leeward areas of Niue using a
two-way ANOVA of depth strata and management (MPA vs . open to fishing) . Comparisons
within depth strata were conducted using least-squares means . Principal coordinates analysis
using a Bray-Curtis similarity matrix was used to compare fish assemblage structure based on
species biomass between Niue and Beveridge Reef and among depth strata .
BRUVS – To survey the presence and relative abundance of sharks and other predators of the
nearshore environment, we deployed Baited Remote Underwater Video Systems (BRUVS) on
the bottom . BRUVS consist of a high-definition camera inside a housing that is mounted on a
weighted aluminum frame . A bait bag with 1 kg of crushed fish was placed 1 m from the camera
to attract sharks and rays to swim into view . A total of 50 BRUVS were deployed around Niue
Island and another 50 around Beveridge Reef . Units were placed a minimum of 500 m apart at
a depth of approximately 20 m for 60 minutes per deployment . The relative abundance of each
species was calculated as the maximum number of individuals per frame (MaxN) per hour . Of
the 100 deployments, 99 were used in this analysis . One drop was omitted because of bias (the
bait arm fell out and was out of view) .
Mid-water BRUVS – Mid-water BRUVS were deployed ~ 5 km from shore as a longline with
five rigs spaced 200 m apart for a minimum filming time of two hours . Mid-water BRUVS
are designed to quantify pelagic fish assemblages and their stereo systems enable fish body
length measurements to be taken based on three-dimensional trigonometry (Klimley and
Brown 1983) . Mid-water BRUVS consisted of a cross bar with two GoPro cameras fixed 0 .8 m
apart on an inward convergent angle of 8° . In longline formation, three units were deployed
concurrently and separated by 200 m . Rigs were baited with ca . 800 g of crushed fish . Each rig
consisted of a vertical PVC pipe with a float and flag above the water line and was attached to
two horizontal pipes, perpendicular to each other, with the bait container and the stereo video
camera system . We deployed mid-water BRUVS at 10 sites each around Niue and Beveridge
Reef with a total of 100 individual camera drops or samples, with four rigs deployed at each
location in longline formation . Each set of rigs was treated as a single independent sample and
species richness and total abundance was averaged across the four deployments for each set .
Deep-sea dropcams – National Geographic’s Remote Imaging Team has developed deep ocean
dropcams, which are high definition cameras encased in a borosilicate glass sphere that are
rated to a depth of 10,000 m . Dropcams have an onboard VHF transmitter that allows for
recovery using locating antennae with backup location achieved via communication with
the ARGOS satellite system . Dropcameras were deployed on seamounts and other unique
geological features on an opportunistic basis; we relied on local expertise and bathymetric
charts for optimal deployment locations .
58

The substrata for each dropcamera deployment were classified into standard geological
categories following (Tissot et al . 2007): mud (M), sand (S), pebble (P), cobble (C), boulder (B),
continuous flat rock (F), diagonal rock ridge (R), and vertical rock-pinnacle top (T) . Two letters
were used to represent the dominant benthic composition . The first letter represents at least
50% cover by that category, and the second, at least 30% cover . Combined, the two-letter code
represents the dominant (at least) 80% cover of substrata type at a site . Fish species swimming
through the camera system were recorded along with relative frequency of occurrence during a
three- to four-hour deployment . The substrate and taxonomic composition of each deployment
was assessed by depth range to characterize the biodiversity of deepwater biota .
Microplastic sampling – Water samples were collected at 20 sites around Niue and Beveridge
Reef . Samples were collected from a one-liter stainless steel bottle that was rinsed three
times prior to collection . At each site, we recorded the date, time, time of high tide, and GPS
(global positioning system) coordinates . Samples were sent to Adventurers and Scientists for
Conservation in Maine for processing . Once received, the water was vacuum pumped over
a gridded 0 .45-micron filter and dried for a minimum of 24 hours . Using a microscope at
40x magnification, pieces of microplastic (< 5 mm) on the filter were systematically counted
along the grid lines . Each plastic piece was categorized based on shape (round, filament/
microfiber, other) and color (blue, red, green, black, transparent/white, other) . The volume of
water was recorded and the final count for the sample was divided by the quantity of water to
obtain a density estimate for each .
Micropaleo sampling – We collected 20 samples from the top 1 cm of sediment at both reef systems
to determine the community of benthic microfossils present in different environments in these
remote locations . Two samples from Beveridge Reef were selected to represent the lagoon and
forereef habitats . Approximately 100 ml of sand was collected, preserved in 90% ethanol and
stained using rose bengal . A 10 ml aliquot of sample was wet sieved with > 125 um (63–125 um
fraction was archived) for microfossil characterization with a focus on foraminifera .
Genetic sampling – To address the potential of connectivity between Beveridge Reef and Niue
Island, genetic samples of several species including invertebrates and fish were collected during
the expedition . Sampled muscle, mantle, and gonad tissue were preserved in absolute ethanol
and sent to a geneticist in New Zealand . Pending collection of comparable genetic tissue from
Niue by the Department of Agriculture, Forestry and Fisheries, these tissues will be examined
to assess connectivity between Beveridge Reef and Niue .
59
EXPLORING THE MARINE ECOSYSTEMS OF NIUE ISLAND AND BEVERIDGE REEF | NATIONAL GEOGRAPHIC PRISTINE SEAS | MARCH 2017

Manta tow – Surveyors were towed behind a boat at low speed (3–4 km hr-1) on a manta
board . Six manta stations were surveyed at Niue and four stations were surveyed at Beveridge
Reef (Figure 40) . Each station consisted of six 300 x 2 m replicate transects in which large
macro-invertebrates were counted . This broad scale methodology allows surveyors to cover
a relatively large area quickly, and is particularly effective for rapid assessments of large,
non-cryptic benthic invertebrates (e .g ., giant clams, sea cucumbers, crown of thorns starfish) .
Reef benthos transects – Reef benthos transects were used to provide information on density
and size of invertebrate species at fine spatial scales . Three RBT stations were surveyed at
different locations on the backreef of Beveridge Reef lagoon (Figure 40) . Each station consisted
of six parallel 40 x 1 m replicate transects . Stations were surveyed by two snorkelers swimming
in parallel . All invertebrate species encountered were enumerated and measured . Due to the
lack of comparable habitat no RBT stations were surveyed at Niue .
FIGURE 40.
Locations of Manta
and RBT survey
stations in
A . Niue (© Google
Earth) and
B . Beveridge Reef
(© Earth Science
and Remote
Sensing Unit,
NASA Johnson
Space Center) .
BA
60

REFERENCES
Aswani S, Hamilton RJ . 2004 . Integrating indigenous ecological knowledge and customary sea tenure with marine and social science in the Rovianna Lagoon, Solomon Islands . Environ Conserv 31:69-83
Bell AV, Currie TE, Irwin G, Bradbury C . 2015 . Driving Factors in the Colonization of Oceania: Developing Island-Level Statistical Models to Test Competing Hypotheses . American Antiquity . 80(2):397-407 .
Berkes F, Colding J, Folke C . 2000 . Rediscovery of traditional ecological knowledge as adaptive management . Ecol Apps 10:1251-1262
Best, E . 1922 . Some aspects of Maori myth and religion (No . 1) . Dominion museum .
Bradley, D ., Papastamatiou, YP and J .E . Caselle . In press . No persistent behavioural effects of scuba diving on reef sharks . Marine Ecology Progress Series .
Bruno, JF, and Selig, ER . 2007 . Regional decline of coral rover in the Indo-Pacific: Timing, extent, and subregional comparisons . PLoS ONE 2: e711 . doi:710 . 1371/journal .pone .0000711 .
Burke, L, Reytar, K, Spalding, M and Perry, A . 2011 . Reefs at Risk Revisited . World Resources Institute, Washington, D .C .
Cinner JE, Marnane MJ, McClanahan TR, Almany GR . 2005 . Periodic closures as adaptive coral reef management in the Indo-Pacific . Ecology and Society 11(1): 31 . [online] URL: http://www .ecologyandsociety .org/vol11/iss1/art31/
Clark G . 2010 . The sea in the land: maritime connections in the chiefly landscape of Tonga . The Global Origins and Development of Seafaring . McDonald Institute for Archaeological Research, Cambridge . 2010:229-37 .
Clarke, KR, Gorley, RN, Somerfield, PJ, Warwick, RM . 2014 . Change in marine communities: an approach to statistical analysis and interpretation, 3rd edition . PRIMER-E, Plymouth, UK .
Clarke SC, McAllister MK, Milner-Gulland EJ, Kirkwood GP, Michielsens CG, Agnew DJ, Pikitch EK, Nakano H, Shivji MS . 2006 . Global estimates of shark catches using trade records from commercial markets . Ecology letters . 9(10):1115-26 .
Dalzell, P, Lindsay, SR, Patiale, H, & South Pacific Commission . 1993 . Fisheries resources survey of the island of Niue .
Dulvy NK, Fowler SL, Musick JA, Cavanagh RD, Kyne PM, Harrison LR, Carlson JK, Davidson LN, Fordham SV, Francis MP, Pollock CM . 2014 . Extinction risk and conservation of the world’s sharks and rays . Elife . 3:e00590 .
Espinoza, M, Cappo, M, Heupel, MR, Tobin, AJ, and Simpfendorfer, CA . 2014 . Quantifying shark distribution patterns and species-habitat associations: implications of marine park zoning . PloS one, 9(9), p .e106885 .
61
EXPLORING THE MARINE ECOSYSTEMS OF NIUE ISLAND AND BEVERIDGE REEF | NATIONAL GEOGRAPHIC PRISTINE SEAS | MARCH 2017

Fergusson IK, Graham KJ, Compagno LJ . 2008 . Distribution, abundance and biology of the smalltooth sandtiger shark Odontaspis ferox (Risso, 1810)(Lamniformes: Odontaspididae) . Environmental Biology of Fishes . 81(2):207-228 .
Ferretti F, Worm B, Britten GL, Heithaus MR, Lotze HK . 2010 . Patterns and ecosystem consequences of shark declines in the ocean . Ecology letters . 13(8):1055-71 .
Fisk, DA . 2007 . Niue sustainable coastal fisheries pilot project: literature review and pilot baseline survey . IWP-Pacific technical report, (38) .
Flanders Marine Institute . 2016 . Maritime Boundaries Geodatabase: Maritime Boundaries and Exclusive Economic Zones (200NM), version 9 . Available online at http://www .marineregions .org/ . http://dx .doi .org/10 .14284/242 .
Friedlander AM . 2015 . A perspective on the management of coral reef fisheries . Pages 208–214 In: The ecology of fishes on coral reefs (C Mora, ed .) . Cambridge University Press .
Friedlander AM, JM Shackeroff, JN Kittinger . 2013 . Customary Marine Resource Knowledge and Use in Contemporary Hawai‘i . Pac Sci 67:441-460 .
Gaines SD, White C, Carr MH, Palumbi SR . 2010 . Designing marine reserve networks for both conservation and fisheries management . Proceedings of the National Academy of Sciences . 107(43):18286-93 .
Johannes RE . 1978 . Traditional marine conservation methods in Oceania and their demise . Annual Rev Ecol Syst 9:349-364 .
Johannes RE . 1982 . Traditional conservation methods and protected marine areas in Oceania . Ambio 11:258–261 .
Jupiter, S ., Mangubhai, S . and Kingsford, RT . 2014a . Conservation of biodiversity in the Pacific Islands of Oceania: challenges and opportunities . Pacific Conservation Biology, 20(2), pp .206–220 .
Jupiter, SD, Cohen, PJ, Weeks, R, Tawake, A and Govan, H . 2014b . Locally-managed marine areas: multiple objectives and diverse strategies . Pacific Conservation Biology, 20(2), pp .165–179 .
Klimley, AP, and Brown, ST . 1983 . Stereophotography for the field biologist: measurement of lengths and three-dimensional positions of free-swimming sharks . Marine Biology 74:175–185 .
Labrosse, P, Yeeting, B, & Pasisi, B . 1999 . Survey of the Namoui Fisheries Reserve in Niue . Fisheries Newsletter – South Pacific Commission, 29-36 .
Lam VWY, Cheung WWL, Reygondeau G, Sumaila UR . 2016 . Projected change in global fisheries revenues under climate change . Scientific Reports . 6:32607 . doi:10 .1038/srep32607 .
Myers, R, Baum, J, Shepherd, T, Powers, S, & Peterson, C . 2007 . Cascading effects of the loss of apex predatory sharks from a coastal ocean . Science, 315 (5820), 1846-1850 DOI: 10 .1126/science .1138657 .
Pakoa K, Friedman K, Moore B, Tardy E, Bertram I . 2014 . Assessing Tropical Marine Invertebrates: a Manual for Pacific Island Resource Managers . Secretariat of the Pacific Community . ISBN: 978-982-00-0712-3 .
Pikitch EK, Santora EA, Babcock A, Bakun A, Bonfil R, Conover DO, Dayton P, Doukakis P, Fluharty D, Heneman B, Houde ED, Link J, Livingston PA, Mangel M, McAllister MK, Pope J, Sainsbury KJ . 2004 . Ecosystem-based fishery management . Science 305:346-347 .
Polovina JJ, Howell EA, Abecassis M . 2008 . Ocean’s least productive waters are expanding . Geophysical Research Letters . 35(3) .
62

Poepoe K, Bartram B, Friedlander A . 2007 . The use of traditional Hawaiian knowledge in the contemporary management of marine resources . In: Haggan N, Neis B, Baird I (eds) Fishers’ knowledge in fisheries science and management . UNESCO, Paris, p 117–141 .
Randall JE, Williams JT, Smith DG, Kulbicki M, Tham GM, Labrosse PI, Kronen ME, Clua ER, Mann BS . 2003 . Checklist of the Shore and Epipegagic Fishes of Tonga . Atoll . Res . Bull . 502 . Smithsonian Inst .
Robbins WD, Hisano M, Connolly SR, Choat JH . 2006 . Ongoing collapse of coral-reef shark populations . Current Biology . 16(23):2314-2319 .
Rosenberg AA, McLeod KL . 2005 . Implementing ecosystem-based approaches to management for the conservation of ecosystem services: Politics and socio-economics of ecosystem-based management of marine resources . Mar Ecol Prog Ser 300:271-274 .
Ruddle K . 1988 . Social principles underlying traditional inshore fishery management systems in the Pacific Basin . Mar Resour Econ 5:351-363 .
Schorr GS, Baird RW, Hanson M, Webster DL, McSweeney DJ, Andrews RD . 2009 . Movements of Satellite-Tagged Blainville’s Beaked Whales Off the Island of Hawaii . Cascadia Research Collective, Olympia, WA .
Sibert J, Hampton J . 2003 . Mobility of tropical tunas and the implications for fisheries management . Mar . Pol . 27: 87-95 .
Sladek Nowles, J . and A . M . Friedlander . 2005 . Marine reserve design and function for fisheries management . Pages 280–301 in: Marine conservation biology: the science of maintaining the sea’s biodiversity (E . A . Norse and L . B . Crowder, eds .) . Island Press .
Stoddart DR, Scoffin TP . 1983 . Phosphate rock on coral reef islands . In: Chemical sediments and geomorphology (Goudie AS and Pye K, eds .) . pp . 369–400 .
Terry JP, Nunn PD . 2003 . Interpreting features of carbonate geomorphology on Niue Island, a raised coral atoll . Z . Geomorph . NF . 131:43-57 .
Tissot, BN, Hixon, MA, & Stein, DL . 2007 . Habitat-based submersible assessment of macro-invertebrate and groundfish assemblages at Heceta Bank, Oregon, from 1988 to 1990 . Journal of Experimental Marine Biology and Ecology, 352(1), 50-64 .
Veitayaki J . 1997 . Traditional marine resource management practices used in the Pacific Islands: an agenda for change . Ocean Coast Manage 37:123-136 .
Wells RD, Rooker JR, Itano DG . Nursery origin of yellowfin tuna in the Hawaiian Islands . Marine Ecology Progress Series . 2012 Aug 8;461:187-96 .Sibert J, Hampton J . 2003 . Mobility of tropical tunas and the implications for fisheries management . Mar . Pol . 27: 87-95 .
Worm B, Davis B, Kettemer L, Ward-Paige CA, Chapman D, Heithaus MR, Kessel ST, Gruber SH . 2013 . Global catches, exploitation rates, and rebuilding options for sharks . Marine Policy . 40:194-204 .
Zachos, JC ., Pagani, M, Sloan, L, Thomas, E, and Billups, K . 2001 . Trends, rhythms, and aberrations in global Climate, 65 Ma to Present . Science . 292 (5517): 686–693 .
Zylich K, Harper S, Winkler N, Zeller D . 2012 . Reconstruction of marine gheries catches for Niue (1950-2010) . pp . 77–86 . In: Harper, S ., Zylich, K ., Boonzaier, L ., Le Manach, F ., Pauly, D ., and Zeller D . (eds .) Fisheries catch reconstructions: Islands, Part III . Fisheries Centre Research Reports 20(5) . Fisheries Centre, University of British Columbia .
63
EXPLORING THE MARINE ECOSYSTEMS OF NIUE ISLAND AND BEVERIDGE REEF | NATIONAL GEOGRAPHIC PRISTINE SEAS | MARCH 2017

Appendix I.Expedition Team.
Name Role Institution
Paul Rose Expedition Leader NGS & the Royal Geographical Society
Alan Friedlander Chief scientist – fishes NGS & University of Hawaii
Jessica Cramp Fishes, sharks, BRUVS Sharks Pacific, James Cook University, Oceans 5
Jenn Caselle Fishes, BRUVS University of California, Santa Barbara
Eric Brown Benthos US National Park Service, Molokai, Hawaii
Kike Ballesteros Benthos Centre d’Estudis Avançats de Blanes-CSIC, Spain
Pelayo Salinas de León BRUVs, Sharks NGS & Charles Darwin Foundation, Galápagos
Chris Thompson Pelagic cameras Centre for Marine Futures, University Western Australia
Dave McAloney DSO, logistics NGS
Manu San Félix Underwater video NGS
Jose Arribas Underwater video assistant NGS
Jon Betz Producer NGS
Steve Spence Assistant Producer NGS
Alan Turchik Drop Cameras NGS Remote Imaging
Brendon Pasisi Niue rep ., field collaborator Dept Agriculture, Forestry and Fisheries, Niue
Pauline Bosserelle Marine ecology SPC
Nadia Helagi Fisheries/general marine ecology
DAFF Niue/Secretariat of the Pacific Community
Taaniella Faakianga Launoa Gataua Fisheries/general marine ecology
DAFF Niue
Alana Fiafia Richmond’Rex Fisheries/general marine ecology
DAFF Niue
APPENDICES
64

Appendix II. List of scleractinian (hard) corals at Niue and Beveridge Reef.
Family Species Niue Beveridge Reef
Acroporidae Acropora anthocercis X
Acropora austera X X
Acropora bushyensis X
Acropora cf. secale X
Acropora cytherea X X
Acropora digitifera X
Acropora divaricata X X
Acropora florida X
Acropora gemmifera X X
Acropora globiceps X X
Acropora horrida X
Acropora hyacinthus X X
Acropora latistella X
Acropora listeri X
Acropora lutkeni X
Acropora microclados X
Acropora monticulosa X X
Acropora nasuta X X
Acropora polystoma X
Acropora retusa X
Acropora samoensis X X
Acropora secale X X
Acropora selago X
Acropora sp . juvenile X X
Acropora subulata X
Acropora tenuis X X
Acropora tutuilensis X
65
EXPLORING THE MARINE ECOSYSTEMS OF NIUE ISLAND AND BEVERIDGE REEF | NATIONAL GEOGRAPHIC PRISTINE SEAS | MARCH 2017

Family Species Niue Beveridge Reef
Acroporidae Acropora valida X X
Acropora verweyi X X
Astreopora myriophthalma X X
Astreopora ocellata X
Astreopora randalli X X
Isopora palifera X
Montipora caliculata X X
Montipora corbettensis X
Montipora foveolata X X
Montipora grisea X X
Montipora nodosa X X
Montipora peltiformis X X
Montipora tuberculosa X
Montipora venosa X X
Montipora verrucosa X X
Agariciidae Leptoseris mycetoroides X
Leptoseris scabra X
Pachyseris speciosa X
Pavona clavus X
Pavona duerdeni X
Pavona frondifera X
Pavona maldivensis X
Pavona varians X
Pavona varians X
Dendrophylliidae Turbinaria mesenterina X
Turbinaria peltata X
Turbinaria reniformis X
Turbinaria stellulata X X
Faviidae Cyphastrea chalcidicum X X
Cyphastrea microphthalma X
Cyphastrea serailia X X
Favia matthaii X X
Favia speciosa X
APPENDIX II. CONTINUED.
66

Family Species Niue Beveridge Reef
Faviidae Favia stelligera X X
Favites abdita X
Favites chinensis X
Favites flexuosa X
Favites halicora X
Favites pentagona X X
Favites russelli X
Goniastrea aspera X X
Goniastrea edwardsi X X
Goniastrea favulus X X
Goniastrea pectinata X
Goniastrea retiformis X
Leptastrea pruinosa X X
Leptastrea purpurea X X
Leptoria phyrgia X
Montastrea curta X X
Oulophyllia crispa X X
Platygyra daedalea X X
Fungiidae Cycloseris vaughani X
Cycloseris vaughani X
Fungia concinna X
Fungia granulosa X
Fungia paumotensis X
Fungia scutaria X X
Herpolitha limax X
Sandolitha dentata X X
Merulinidae Hydnophora exesa X
Hydnophora exesa X
Hydnophora microconos X X
Merulina ampliata X
Mussidae Acanthastrea echinata X X
Acanthastrea hillae X
Lobophyllia corymbosa X
67
EXPLORING THE MARINE ECOSYSTEMS OF NIUE ISLAND AND BEVERIDGE REEF | NATIONAL GEOGRAPHIC PRISTINE SEAS | MARCH 2017

Family Species Niue Beveridge Reef
Mussidae Lobophyllia hemprichii X X
Oculinidae Galaxea fascicularis X X
Pectiniidae Echinophyllia aspera X
Echinophyllia echinata X
Pocilloporidae Pocillopora damicornis X X
Pocillopora elegans X
Pocillopora eydouxi X X
Pocillopora meandrina X X
Pocillopora verrucosa X X
Stylophora pistillata X X
Pocillopora cf capitata X
Poritidae Goniopora somaliensis X X
Goniopora stutchburyi X X
Porites australiensis X X
Porites cf. myrmidonensis X
Porites lobata X X
Porites lutea X X
Porites monticulosa X
Porites randalli X X
Porites solida X X
Porites sp . 1 X
Porites vaughani X X
Siderastreidae Coscinaraea columna X X
Coscinaraea exesa X
Psammocora haimeana X X
Psammocora nierstraszi X X
Psammocora profundacella X
APPENDIX II. CONTINUED.
68

Appendix III. List of algae observed at Niue and Beveridge Reef.
Chlorophyta (Green algae) Niue Beveridge Reef
Avrainvillea lacerata X
Caulerpa macrophysa X
Caulerpa nummularia X X
Caulerpa serrulata X
Caulerpa taxifolia X
Caulerpa urvilliana X X
Caulerpa webbiana X X
Cladophoropsis luxurians X X
Dictyosphaeria intermedia X
Dictyosphaeria versluysii X X
Halimeda cf. distorta X
Halimeda cf. gracilis X
Halimeda cf. hederacea X
Halimeda lacunalis f. lata X
Halimeda micronesica X X
Halimeda minima X
Halimeda opuntia X X
Halimeda pygmaea X
Microdictyon sp. X X
Neomeris cf. mucosa X X
Palmogloea protuberans X
Valonia aegagropila X X
Cyanophyta (Blue-green algae) Niue Beveridge Reef
Hydrocoleum sp. X
Phormidium sp. X X
Schizothrix sp. X X
69
EXPLORING THE MARINE ECOSYSTEMS OF NIUE ISLAND AND BEVERIDGE REEF | NATIONAL GEOGRAPHIC PRISTINE SEAS | MARCH 2017
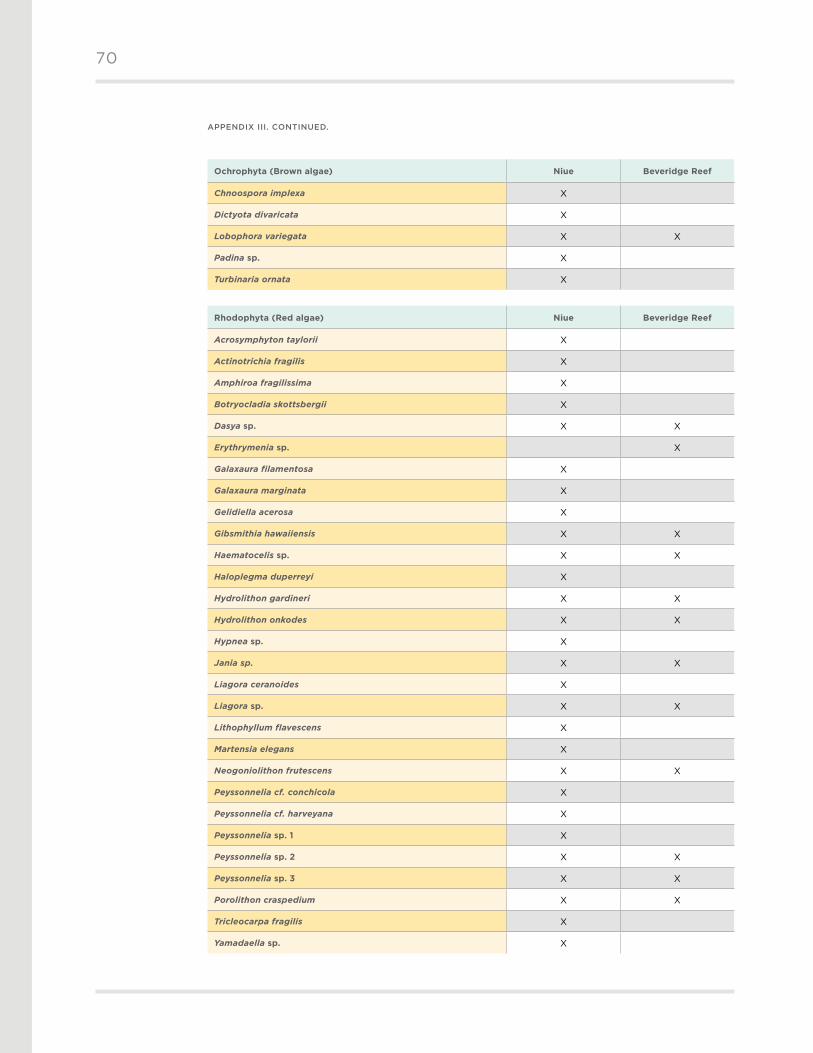
APPENDIX III. CONTINUED.
Ochrophyta (Brown algae) Niue Beveridge Reef
Chnoospora implexa X
Dictyota divaricata X
Lobophora variegata X X
Padina sp. X
Turbinaria ornata X
Rhodophyta (Red algae) Niue Beveridge Reef
Acrosymphyton taylorii X
Actinotrichia fragilis X
Amphiroa fragilissima X
Botryocladia skottsbergii X
Dasya sp. X X
Erythrymenia sp. X
Galaxaura filamentosa X
Galaxaura marginata X
Gelidiella acerosa X
Gibsmithia hawaiiensis X X
Haematocelis sp. X X
Haloplegma duperreyi X
Hydrolithon gardineri X X
Hydrolithon onkodes X X
Hypnea sp. X
Jania sp. X X
Liagora ceranoides X
Liagora sp. X X
Lithophyllum flavescens X
Martensia elegans X
Neogoniolithon frutescens X X
Peyssonnelia cf. conchicola X
Peyssonnelia cf. harveyana X
Peyssonnelia sp. 1 X
Peyssonnelia sp. 2 X X
Peyssonnelia sp. 3 X X
Porolithon craspedium X X
Tricleocarpa fragilis X
Yamadaella sp. X
70

Appendix IV.List of all invertebrate species recorded at Niue and Beveridge Reef.
Techniques (manta tow, reef benthos transects [RBT]) Mean Density = number of individuals per hectare with standard deviation .
Taxa Species Common Name Mean Density Method Location
Echino
derm
Urchins Diadema sp . Long spined sea urchin
1,013 .89 ± 972 .52 RBT Beveridge Reef lagoon
Echinometra mathaei Rock-boring urchin
1,555 .56 ± 527 .78 RBT Beveridge Reef lagoon
Echinostrephus aciculatus
Needle spined urchin
97 .22 ± 97 .22 RBT Beveridge Reef lagoon
Echinothrix calamaris Banded urchin 194 .44 ± 174 .03 RBT Beveridge Reef lagoon
Echinothrix diadema Blue-black urchin
9,250 .00 ± 2,752 .21
Echinothrix spp . 996 .04 ± 345 .78461 .97 ± 210 .83
Manta TowManta Tow
Beveridge ReefNiue
Pencil sea urchin
190 .08 ± 129 .08736 .11 ± 427 .86
Manta TowRBT
Beveridge Reef Beveridge Reef lagoon
Sea cucumber
Bohadschia argus Leopardfish 2 .08 ± 2 .08 Manta Tow Beveridge Reef
Holothuria atra Lollyfish 0 .69 ± 0 .69930 .56 ± 222 .22
4 .72 ± 3 .11
Manta TowRBT
Manta Tow
Beveridge ReefBeveridge Reef lagoon
Niue
Holothuria whitmaei Black teatfish 0 .69 ± 0 .6941 .67 ± 24 .063 .33 ± 0 .85
Manta TowRBT
Manta Tow
Beveridge ReefBeveridge Reef lagoon
Niue
Stichopus horrens Dragonfish 13 .89 ± 13 .89 RBT Beveridge Reef lagoon
Thelenota ananas Prickly redfish 2 .78 ± 2 .786 .02 ± 3 .40
Manta TowManta Tow
Beveridge ReefNiue
Sea star Linckia laevigata Blue linckia 41 .67 ± 41 .67 RBT Beveridge Reef lagoon
Mo
lluscs
Bivalves Tridacna maxima Elongate giant clam
1,375 .00 ± 674 .86
RBT Beveridge Reef lagoon
Tridacna spp . Giant clam 1,011 .97 ± 643 .4158 .09 ± 32 .57
Manta TowManta Tow
Beveridge ReefNiue
Tridacna sp . Giant clam 41 .67 ± 24 .06 RBT Beveridge Reef lagoon
Gastropods Drupa morum Purple drupe 13 .89 ± 13 .89 RBT Beveridge Reef lagoon
Astralium sp . 13 .89 ± 13 .89 RBT Beveridge Reef lagoon
Turbo argyrostomus Turban snail 180 .56 ± 160 .17 RBT Beveridge Reef lagoon
Reischia armigera Belligerent rock-shell
41 .67 ± 24 .06 RBT Beveridge Reef lagoon
71
EXPLORING THE MARINE ECOSYSTEMS OF NIUE ISLAND AND BEVERIDGE REEF | NATIONAL GEOGRAPHIC PRISTINE SEAS | MARCH 2017
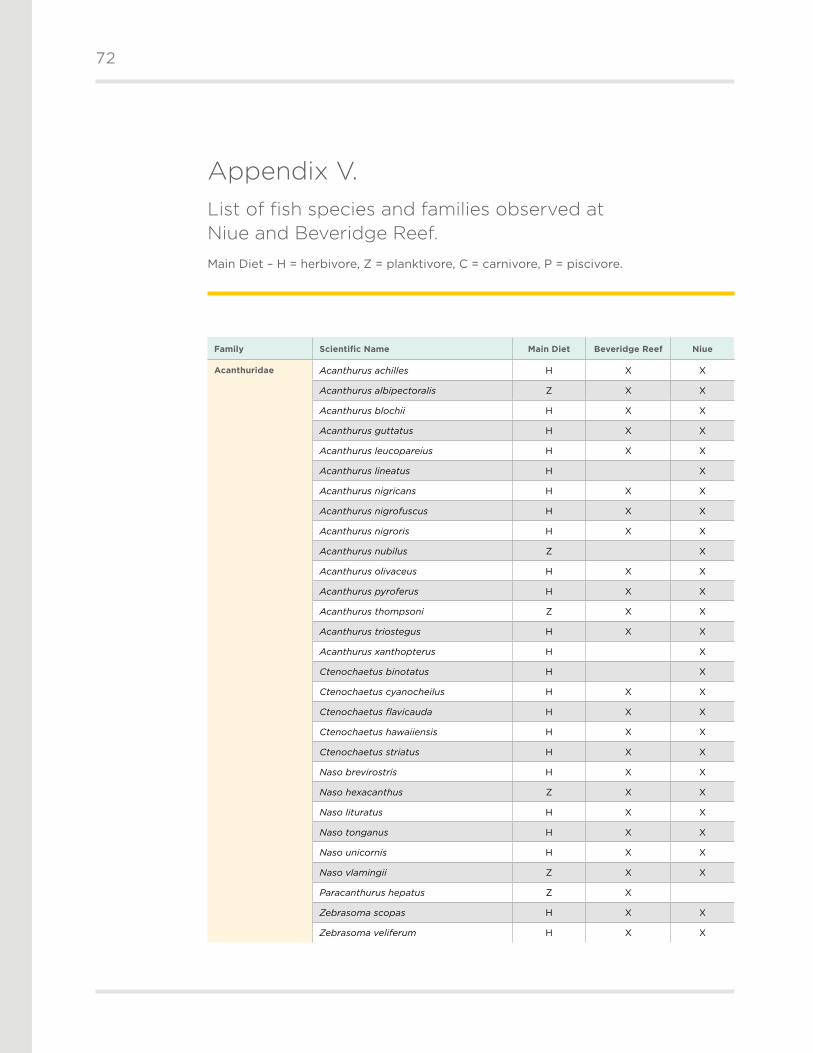
Appendix V. List of fish species and families observed at Niue and Beveridge Reef.
Main Diet – H = herbivore, Z = planktivore, C = carnivore, P = piscivore .
Family Scientific Name Main Diet Beveridge Reef Niue
Acanthuridae Acanthurus achilles H X X
Acanthurus albipectoralis Z X X
Acanthurus blochii H X X
Acanthurus guttatus H X X
Acanthurus leucopareius H X X
Acanthurus lineatus H X
Acanthurus nigricans H X X
Acanthurus nigrofuscus H X X
Acanthurus nigroris H X X
Acanthurus nubilus Z X
Acanthurus olivaceus H X X
Acanthurus pyroferus H X X
Acanthurus thompsoni Z X X
Acanthurus triostegus H X X
Acanthurus xanthopterus H X
Ctenochaetus binotatus H X
Ctenochaetus cyanocheilus H X X
Ctenochaetus flavicauda H X X
Ctenochaetus hawaiiensis H X X
Ctenochaetus striatus H X X
Naso brevirostris H X X
Naso hexacanthus Z X X
Naso lituratus H X X
Naso tonganus H X X
Naso unicornis H X X
Naso vlamingii Z X X
Paracanthurus hepatus Z X
Zebrasoma scopas H X X
Zebrasoma veliferum H X X
72

Family Scientific Name Main Diet Beveridge Reef Niue
Apogonidae Cheilodipterus macrodon P X
Ostorhinchus angustatus C X X
Ostorhinchus nigrofasciatus Z X
Balistidae Balistapus undulatus C X X
Balistoides conspicillum C X X
Balistoides viridescens C X
Melichthys niger Z X X
Melichthys vidua H X X
Pseudobalistes flavimarginatus C X
Pseudobalistes fuscus C X
Rhinecanthus aculeatus C X
Rhinecanthus lunula C X X
Rhinecanthus rectangulus C X X
Sufflamen bursa C X X
Sufflamen chrysopterum C X
Sufflamen fraenatum C X
Xanthichthys auromarginatus Z X X
Xanthichthys caeruleolineatus Z X
Xanthichthys mento Z X
Blenniidae Blenniella gibbifrons H X
Cirripectes alboapicalis H X X
Cirripectes sp . H X
Cirripectes variolosus H X X
Ecsenius niue H X
Exallias brevis H X
Plagiotremus rhinorhynchos P X X
Plagiotremus tapeinosoma P X X
Caesionidae Caesio teres Z X
Pterocaesio tile Z X
Caracanthidae Caracanthus maculatus C X
Carangidae Carangoides ferdau P X
Carangoides orthogrammus P X X
Caranx ignobilis P X
Caranx lugubris P X X
Caranx melampygus P X X
Elagatis bipinnulata P X
Scomberoides lysan P X X
Seriola dumerili P X
73
EXPLORING THE MARINE ECOSYSTEMS OF NIUE ISLAND AND BEVERIDGE REEF | NATIONAL GEOGRAPHIC PRISTINE SEAS | MARCH 2017

APPENDIX V. CONTINUED.
Family Scientific Name Main Diet Beveridge Reef Niue
Carangidae Seriola lalandi P X
Seriola rivoliana P X X
Carcharhinidae Carcharhinus amblyrhynchos P X X
Triaenodon obesus C X X
Chaetodontidae Chaetodon auriga C X X
Chaetodon bennetti C X
Chaetodon citrinellus C X X
Chaetodon ephippium C X X
Chaetodon flavirostris C X
Chaetodon lineolatus C X
Chaetodon lunula C X X
Chaetodon lunulatus C X
Chaetodon mertensii C X X
Chaetodon ornatissimus C X X
Chaetodon pelewensis C X X
Chaetodon quadrimaculatus C X X
Chaetodon reticulatus C X X
Chaetodon trifascialis C X
Chaetodon ulietensis C X X
Chaetodon unimaculatus C X X
Forcipiger flavissimus C X X
Forcipiger longirostris C X X
Hemitaurichthys polylepis Z X X
Hemitaurichthys thompsoni Z X
Heniochus chrysostomus C X X
Heniochus monoceros C X X
Heniochus singularius C X
Cirrhitidae Cirrhitichthys falco C X X
Cirrhitichthys oxycephalus C X
Cirrhitops hubbardi C X X
Cirrhitus pinnulatus P X X
Neocirrhites armatus C X X
Paracirrhites arcatus C X X
Paracirrhites forsteri P X X
Paracirrhites hemistictus P X X
Dasyatidae Himantura fai C X
Diodontidae Diodon holocanthus C X
Diodon hystrix C X X
74

Family Scientific Name Main Diet Beveridge Reef Niue
Echeneidae Echeneis naucrates C X
Fistularidae Fistularia commersonii P X X
Gobiidae Ctenogobiops tangaroai C X
Gnatholepis anjerensis C X
Nemateleotris magnifica Z X X
Ptereleotris evides Z X X
Ptereleotris heteroptera Z X
Ptereleotris zebra Z X
Valenciennea strigata C X
Grammistidae Grammistes sexlineatus P X X
Pogonoperca punctata C X
Holocentridae Myripristis berndti C X X
Myripristis kuntee Z X X
Myripristis vittata C X
Neoniphon opercularis C X X
Neoniphon sammara C X X
Sargocentron caudimaculatum C X X
Sargocentron diadema C X
Sargocentron microstoma C X
Sargocentron spiniferum C X X
Sargocentron tiere C X X
Kuhliidae Kuhlia mugil C X X
Kyphosidae Kyphosus bigibbus H X X
Kyphosus cinerascens H X
Kyphosus vaigiensis H X X
Labridae Anampses caeruleopunctatus C X X
Anampses femininus C X
Anampses twistii C X X
Bodianus axillaris C X X
Bodianus loxozonus C X X
Bodianus mesothorax C X X
Cheilinus chlorourus C X X
Cheilinus trilobatus C X X
Cheilinus undulatus C X
Cirrhilabrus rubrimarginatus Z X
Cirrhilabrus scottorum Z X X
Coris aygula C X X
Coris dorsomacula C X X
75
EXPLORING THE MARINE ECOSYSTEMS OF NIUE ISLAND AND BEVERIDGE REEF | NATIONAL GEOGRAPHIC PRISTINE SEAS | MARCH 2017

APPENDIX V. CONTINUED.
Family Scientific Name Main Diet Beveridge Reef Niue
Labridae Coris gaimard C X X
Epibulus insidiator C X
Gomphosus varius C X X
Halichoeres claudia C X X
Halichoeres hortulanus C X X
Halichoeres margaritaceus C X
Halichoeres marginatus C X
Halichoeres melanurus C X X
Halichoeres melasmapomus C X
Halichoeres trimaculatus C X
Hemigymnus fasciatus C X X
Hologymnosus annulatus P X X
Hologymnosus doliatus P X X
Iniistius aneitensis C X
Labroides bicolor C X X
Labroides dimidiatus C X X
Labroides rubrolabiatus C X X
Macropharyngodon meleagris C X X
Novaculichthys taeniourus C X X
Oxycheilinus unifasciatus C X X
Pseudocheilinus evanidus C X X
Pseudocheilinus hexataenia C X X
Pseudocheilinus octotaenia C X X
Pseudocheilinus tetrataenia C X X
Pseudocoris yamashiroi Z X
Pseudodax moluccanus C X
Pseudojuloides atavai C X X
Pseudojuloides cerasinus C X
Stethojulis bandanensis C X X
Thalassoma amblycephalum Z X X
Thalassoma hardwicke C X X
Thalassoma lutescens C X X
Thalassoma nigrofasciatum C X
Thalassoma purpureum C X X
Thalassoma quinquevittatum C X X
Thalassoma trilobatum C X
Lethrinidae Gnathodentex aureolineatus C X X
Monotaxis grandoculis C X X
76

Family Scientific Name Main Diet Beveridge Reef Niue
Lutjanidae Aphareus furca P X X
Aprion virescens P X X
Lutjanus bohar C X X
Lutjanus kasmira P X X
Lutjanus monostigma P X
Macolor macularis C X
Macolor niger C X X
Malacanthidae Hoplolatilus starcki Z X
Malacanthus brevirostris C X
Malacanthus latovittatus C X X
Aluterus scriptus H X X
Amanses scopas C X
Cantherhines dumerilii C X X
Cantherhines pardalis C X X
Oxymonacanthus longirostris C X
Pervagor melanocephalus H X
Mugiloididae Parapercis clathrata C X X
Parapercis hexophtalma C X X
Mullidae Mulloidichthys flavolineatus C X
Mulloidichthys vanicolensis C X
Parupeneus barberinus C X
Parupeneus crassilabris C X X
Parupeneus cyclostomus P X X
Parupeneus multifasciatus C X X
Parupeneus pleurostigma C X
Muraenidae Gymnothorax eurostus C X
Gymnothorax javanicus P X
Gymnothorax melatremus C X
Gymnothorax meleagris P X
Rhinomuraena quaesita P X
Myliobatididae Aetobatus narinari C X
Ostraciidae Ostracion meleagris C X X
Pempheridae Pempheris oualensis Z X
Pomacanthidae Centropyge bispinosa H X X
Centropyge fisheri H X
Centropyge flavissima H X X
Centropyge heraldi H X X
Centropyge loricula H X X
77
EXPLORING THE MARINE ECOSYSTEMS OF NIUE ISLAND AND BEVERIDGE REEF | NATIONAL GEOGRAPHIC PRISTINE SEAS | MARCH 2017

Family Scientific Name Main Diet Beveridge Reef Niue
Pomacanthidae Pomacanthus imperator C X X
Abudefduf sordidus H X
Amphiprion chrysopterus Z X X
Amphiprion perideraion Z X
Chromis acares Z X X
Chromis agilis Z X X
Chromis bami Z X X
Chromis iomelas Z X X
Chromis margaritifer Z X X
Chromis vanderbilti Z X X
Chromis xanthura Z X X
Chrysiptera taupou Z X X
Dascyllus aruanus Z X
Dascyllus auripinnis Z X X
Dascyllus reticulatus Z X X
Dascyllus trimaculatus Z X X
Lepidozygus tapeinosoma Z X
Plectroglyphidodon dickii H X X
Plectroglyphidodon imparipennis C X X
Plectroglyphidodon johnstonianus C X X
Plectroglyphidodon lacrymatus H X X
Plectroglyphidodon phoenixensis H X X
Pomacentrus spilotoceps H X X
Pomacentrus vaiuli H X X
Pomachromis fuscidorsalis Z X X
Stegastes albifasciatus H X
Stegastes fasciolatus H X X
Stegastes nigricans H X X
Scaridae Calotomus carolinus H X X
Calotomus spinidens H X
Chlorurus frontalis H X X
Chlorurus microrhinos H X X
Chlorurus sordidus H X X
Scarus altipinnis H X X
Scarus chameleon H X X
Scarus festivus H X
Scarus forsteni H X X
APPENDIX V. CONTINUED.
78

Family Scientific Name Main Diet Beveridge Reef Niue
Scaridae Scarus frenatus H X X
Scarus longipinnis H X X
Scarus niger H X
Scarus oviceps H X
Scarus psittacus H X
Scarus rubroviolaceus H X X
Scarus schlegeli H X
Scombridae Gymnosarda unicolor P X X
Scorpaenidae Pterois antennata C X
Scorpaenopsis diabolus P X
Scorpaenopsis papuensis P X
Serranidae Cephalopholis argus P X X
Cephalopholis sonnerati P X
Cephalopholis spiloparaea P X
Cephalopholis urodeta P X X
Epinephelus fasciatus C X X
Epinephelus hexagonatus P X X
Epinephelus macrospilos C X
Epinephelus melanostigma P X
Epinephelus spilotoceps P X
Gracila albomarginata P X
Plectropomus laevis P X X
Pseudanthias cooperi Z X X
Pseudanthias olivaceus Z X X
Pseudanthias pascalus Z X X
Variola louti P X X
Siganidae Siganus argenteus H X
Sphyraenidae Sphyraena barracuda P X X
Sphyraena helleri P X
Sphyraena qenie P X
Synodontidae Saurida gracilis P X
Synodus rubromarmoratus P X
Tetraodontidae Arothron meleagris C X X
Canthigaster amboinensis C X X
Canthigaster janthinoptera C X X
Canthigaster solandri C X X
Canthigaster valentini C X X
Zanclidae Zanclus cornutus C X X
79
EXPLORING THE MARINE ECOSYSTEMS OF NIUE ISLAND AND BEVERIDGE REEF | NATIONAL GEOGRAPHIC PRISTINE SEAS | MARCH 2017


ACKNOWLEDGEMENTS
We would like to thank the Niuen government and Niuen people for allowing us to explore their extraordinary home. We would also like to thank Tofia Niue, Brendon Pasisi, Coral Pasisi, and Josie Tamaté for their support throughout the process. Special thanks to Alana Fiafia Richmond-Rex, Launoa Gatau, and Nadia Helagi for their extraordinary work on the expedition. Thanks to the Pacific Community and Oceans 5 for partnering on this expedition.
Adventurers and Scientists for Conservation conducted the analysis of the water samples for microplastics and Dr. Beverly Goodman from University of Haifa analyzed the sediment samples and provided images of microfossils.
FAKATUFONO NIUE
PRISTINESEAS.ORG