
Exploring the geography of the registered addresses of car models through a bespoke car...
26
Exploring the geography of the registered addresses of car models through a bespoke car classification Guy Lansley Department of Geography, University College London @GuyLansley [email protected]
-
Upload
geodemographics -
Category
Data & Analytics
-
view
76 -
download
1
Transcript of Exploring the geography of the registered addresses of car models through a bespoke car...

Exploring the geography of the registered
addresses of car models through a bespoke car
classification
Guy Lansley
Department of Geography, University College London
@GuyLansley

Outline
• Aims and Objectives
• 2011 UK Car Classification
• Trends and findings
• Exploring car models and society

3
Context
• There is a call to make more government held population
data open source
• There is also a need to acquire more data during
intercensal periods
• Success in Department for Work and Pensions, Land
Registry (England and Wales),…
• However, we still lack good data on affluence or income at
a small area level
• In 2013 there were 29.2 million registered cars in Great
Britain and 75% of UK households had access to at least
one car or van (2011)

4
Cars and society
• The choice of a particular car
model purchase is driven by…
• Budget (& disposable
income)
• Purpose
• For work
• For family
5
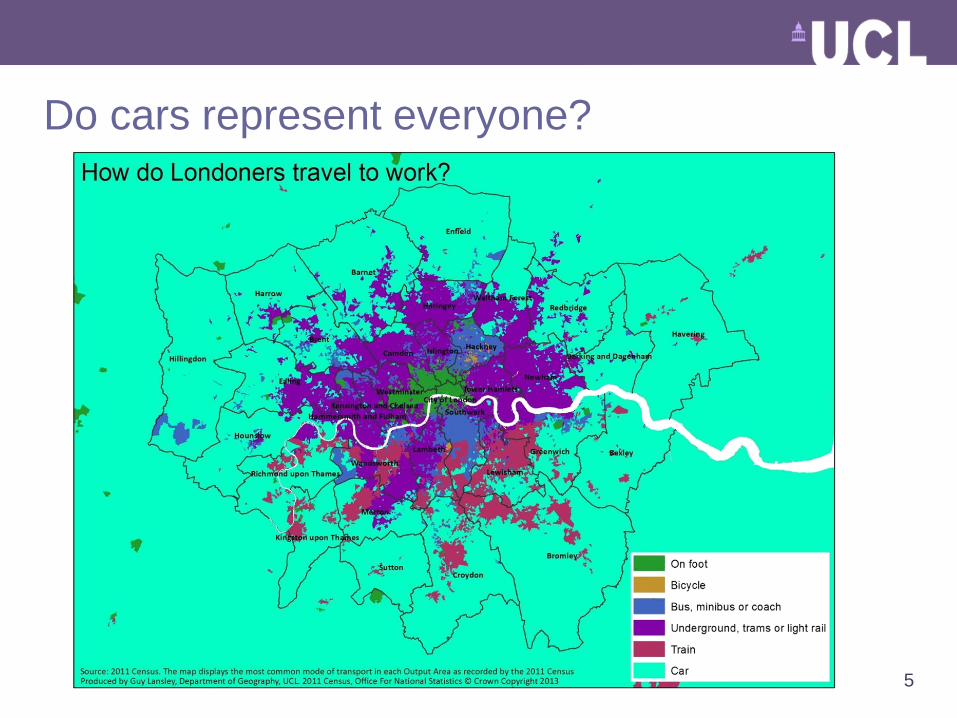
Do cars represent everyone?

6
2011 Census Data
% No car/van ownership (2011)
• Car (and van ownership)
• Number of cars/vans per
household
• 0, 1, 2, 3, 4+
• Method of travel to work
• Distance to workplace
• Household characteristics
• Socio-economic characteristics

7
DVLA DATA
• The DVLA hold data on every individual registered car by its
registered address
• Attributes include…
• the model
• engine size
• date of MOT
• age of the vehicle
• Updated quarterly
• Available to purchase
- No detailed data about the owners are available

8
Cars in the UK• Spreadsheet of all car models registered in GB in March 2011
• 1981 different generic models
9
Creating a Car Classification (1)
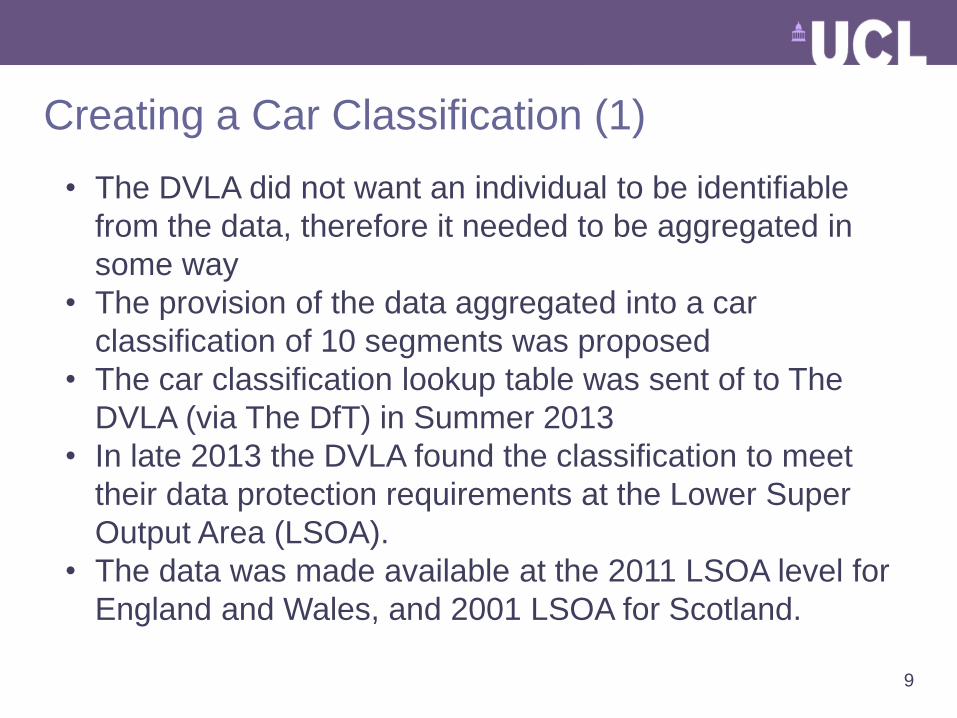
• The DVLA did not want an individual to be identifiable
from the data, therefore it needed to be aggregated in
some way
• The provision of the data aggregated into a car
classification of 10 segments was proposed
• The car classification lookup table was sent of to The
DVLA (via The DfT) in Summer 2013
• In late 2013 the DVLA found the classification to meet
their data protection requirements at the Lower Super
Output Area (LSOA).
• The data was made available at the 2011 LSOA level for
England and Wales, and 2001 LSOA for Scotland.
10
Creating a Car Classification (2)
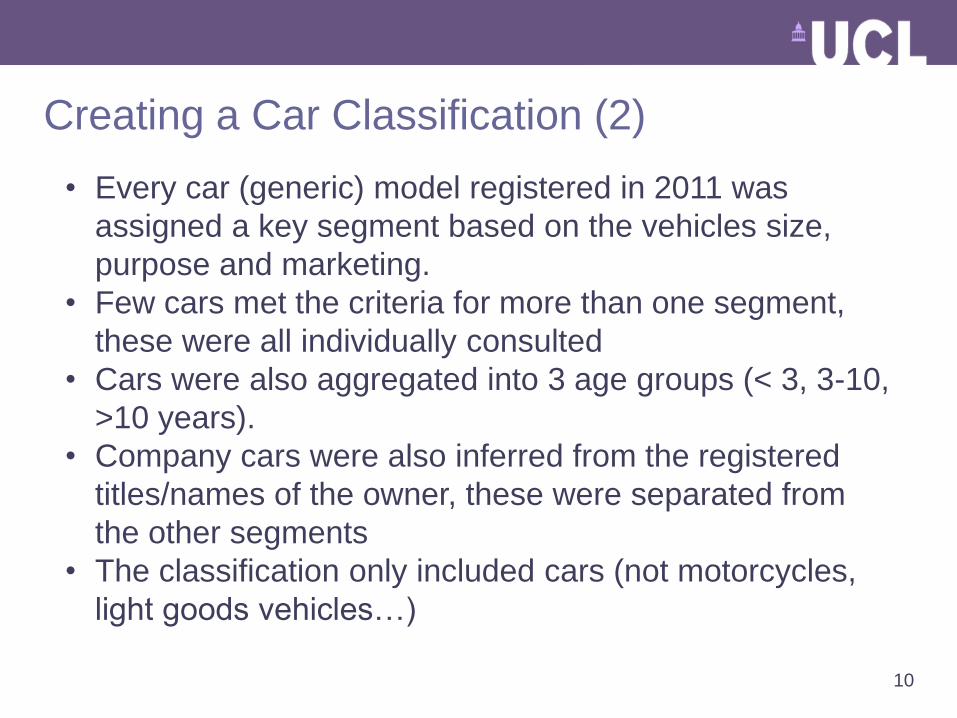
• Every car (generic) model registered in 2011 was
assigned a key segment based on the vehicles size,
purpose and marketing.
• Few cars met the criteria for more than one segment,
these were all individually consulted
• Cars were also aggregated into 3 age groups (< 3, 3-10,
>10 years).
• Company cars were also inferred from the registered
titles/names of the owner, these were separated from
the other segments
• The classification only included cars (not motorcycles,
light goods vehicles…)

11
SegmentNumber
of CarsPercent
City Car 1,740,242 6.85%
Supermini 7,212,110 28.40%
Small Family Car 6,730,750 26.50%
Large Family Car 2,954,579 11.63%
MPV 1,343,038 5.29%
Compact Executive 1,923,107 7.57%
Executive 758,042 2.99%
Sports 797,728 3.14%
SUV 1,732,136 6.82%
Luxury 203,003 0.80%
2011 GB Car
Classification
• 10 car segments
• Each segment is disaggregated
into 3 age groups

12
Age of the vehicle
3,934,281 14,865,927 6,793,805

13
Geodemographics (London)

14
Age of the vehicle
< 3
3 - 10
> 10

15
Company cars
0
500,000
1,000,000
1,500,000
2,000,000
2,500,000
Age 0-3 Age 3-10 Age >10

City Car Supermini Small Family Car Large Family Car
MPV Compact Executive Executive Sports
SUV Luxury

17
Pearson’s Correlation
Supermini 0.11Small Family Car -0.287 0.264Large Family Car -0.434 0.133 0.308MPV -0.276 -0.13 0.097 0.208Compact Executive
-0.1 -0.618 -0.359 -0.353 -0.049
Executive -0.041 -0.676 -0.475 -0.396 -0.044 0.657SUV 0.05 -0.514 -0.573 -0.374 -0.221 0.175 0.367Sports 0.301 -0.52 -0.551 -0.567 -0.307 0.455 0.561 0.456Luxury 0.032 -0.526 -0.478 -0.358 -0.125 0.494 0.59 0.355 0.549
CC Sm SFC LFC MPV CEx Ex SUV S
London
• The car segments share distinctive spatial associations
between each other

18
The Standardised distribution of cars (London)

19
1 2 3 4 5 6 7 8
City Car 0.234 0.342 0.286 0.05 0.025 -0.117 -0.193 -0.498
Supermini -0.538 -0.392 0.195 -0.362 0.532 0.554 0.489 0.036
Small Family Car -0.417 -0.394 -0.036 -0.431 0.29 0.395 0.391 0.331
Large Family Car -0.597 -0.616 -0.21 -0.264 0.389 0.538 0.573 0.501
MPV -0.246 -0.244 -0.076 -0.087 0.04 0.161 0.143 0.354
Compact Executive 0.548 0.4 -0.084 0.139 -0.597 -0.615 -0.553 .009
Executive 0.641 0.485 -0.107 0.282 -0.617 -0.644 -0.584 -0.132
Sports 0.724 0.629 0.037 0.28 -0.467 -0.613 -0.585 -0.455
SUV 0.437 0.444 -0.014 0.68 -0.264 -0.404 -0.397 -0.403
Luxury 0.449 0.32 -0.086 0.243 -0.43 -0.457 -0.403 -0.105
1. Higher managerial, administrative and professional occupations 5. Lower supervisory and technical occupations
2. Lower managerial, administrative and professional occupations 6. Semi-routine occupations
3. Intermediate occupations 7. Routine occupations
4. Small employers and own account workers 8. Never worked and long-term unemployed
Socio-Economic Classification (2011 Census)
• The car has been compared to 2011 Census data for England and Wales
• Distinctive relationships between car model segments and socio-
economics

House Price Data
Unstandardised Standardised
• House prices were considered as
an additional proxy for asset wealth
• All house sales are recorded by the
Land Registry, the data includes the
post code of the property, the date
of sale, the sale price and the
accommodation (I.e. flat, terraced,
semi-detached, detached).
• House sale data downloaded from
the Land Registry (England &
Wales) for 2011.
• The sale data were restandardised
by the structure of the household.
• This data were then aggregated
into LSOAs, creating an average for
each area.

21
1. Higher managerial, administrative and professional occupations
1.1 Large employers and higher managerial and administrative occupations
1.2 Higher professional occupations
City Car 0.234 0.26 0.211Supermini -0.538 -0.502 -0.515Small Family Car -0.417 -0.487 -0.369Large Family Car -0.597 -0.55 -0.573MPV -0.246 -0.268 -0.223Compact Executive 0.548 0.407 0.555Executive 0.641 0.555 0.626Sports 0.724 0.712 0.681SUV 0.437 0.565 0.371Luxury 0.449 0.452 0.42
Car SegmentAverage
House Sale Value
Standardised House
Price IndexCity Car 0.425 0.416Supermini -0.64 -0.677Small Family Car -0.58 -0.567Large Family Car -0.597 -0.589MPV -0.361 -0.361Compact Executive 0.395 0.412Executive 0.619 0.605Sports 0.686 0.717SUV 0.74 0.717Luxury 0.603 0.66
Age SegmentUnder 3 years 0.607 0.561Between 3 & 10 years
0.021 -0.033
Above 10 years -0.502 -0.452
Cars and inferred social standing

22
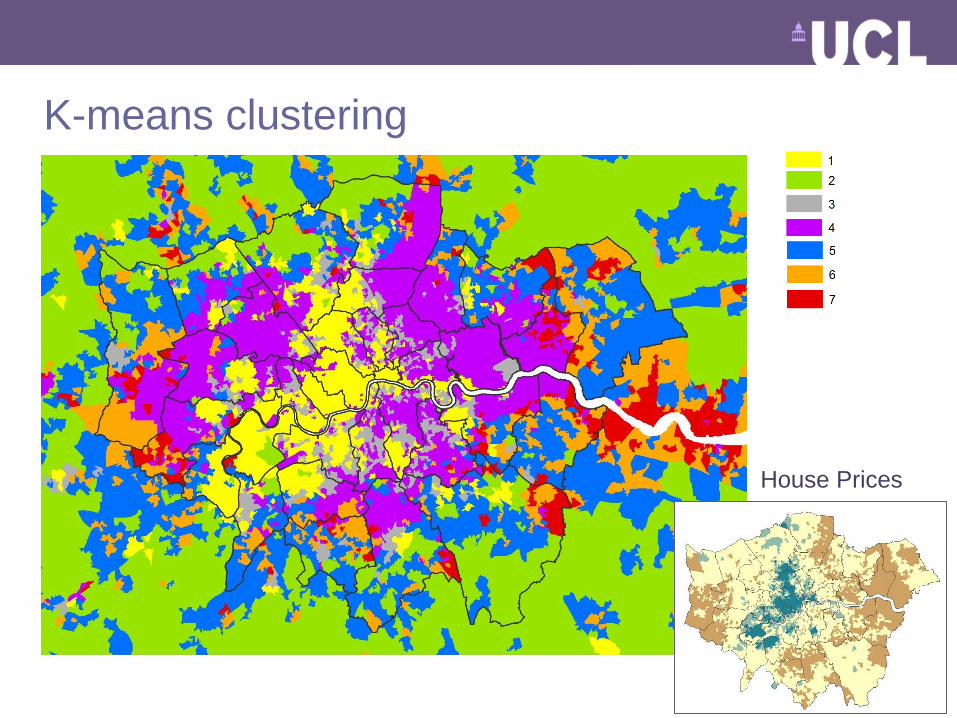
K-means Clustering
• A clustering algorithm was used to group LSOAs into 7 distinctive groups
based on the DVLA car data and relevant 2011 Census variables
• K-means clustering was used – Top-down clustering method with pre-
defined number of clusters, all cases are assigned to their ‘nearest’ cluster
Variables:
• Car Segments
• Car Age Group
• Number of Cars per Household
• Method of Travel to Work
• Distance Travelled to Work
• Population Density
• NS-SEC (National Statistics Socio-Economic Classification)
• Age Structure
Number of Groups: 7
Cases: LSOA (England and Wales only), 34753 in total

23
1 2 3 4 5 6 7City CarSuperminiSmall Family CarLarge Family CarMPVCompact ExecutiveExecutiveSportsSUVLuxury
Age of the Vehicle< 33 - 10> 10Number of cars per
household01234
Travel to work by carAverage distance
Pop’ Density
NS-SEC
1 and 2
356 and 7
8
Age StructureAge 0-7
Age 8-15Age 20-29
Age 30-44Age 45-64Age 65+
1 3.09
2 12.79
3 5.40
4 8.45
5 24.79
6 27.90
7 17.58
1 2 3 4 5 6 7
K-means clustering
Low
High
% Size of each group

24
K-means clustering
Bristol
• The distribution of the k-means
classification groups clearly reflect the
geodemographic composition across
England and Wales
25
K-means clustering
House Prices

26
AcknowledgementsGratitude goes to Jeremy Grove from the Department of Transport and his colleague Mike Dark for instigating
the data request to the DVLA, and the Data Sharing team at DVLA for assessing and approving the request.
Conclusions
• Car models and age can provide fruitful information
about society at the small area level
• The composition of car models is a more useful
indicator of socio-economics than car ownership /
access to cars variables.
• The car classification also indicates life stage of
households at an aggregate level
• The classification would require further consultation –
exceptions still exist
• Future research?