
Exploring the Community Structure of Complex Networks · Exploring the Community Structure of...
34
Transcript of Exploring the Community Structure of Complex Networks · Exploring the Community Structure of...


1
Exploring the Community Structure of Complex Networks
Carlo Drago
University of Rome “Niccolò Cusano”
This version 28 March 2015
Abstract
Regarding complex networks, one of the most relevant problems is to understand and to explore
community structure. In particular it is important to define the network organization and the
functions associated to the different network partitions. In this context, the idea is to consider some
new approaches based on interval data in order to represent the different relevant network
components as communities. The method is also useful to represent the network community
structure, especially the network hierarchical structure. The application of the methodologies is
based on the Italian interlocking directorship network.
Keywords: Complex Networks, Community Detection, Communities, Interval Data, Interlocking
Directorates
JEL Classification: C4, C60, L14
2
Introduction
Complex networks are ubiquitous in every field of science. The study of complex networks is very
important today because the comprehension of modern systems can be considerably enhanced by
considering the different connections between individuals or objects. In this context the
communities are groups of nodes in the networks, maximally connected to each other and weakly
connected between the different communities. The communities represent a very important network
feature (Fortunato 2010, Newman 2006) in fact the community structure allows one to understand
the concrete functioning of real world systems. In this sense many phenomena can be clarified by
taking into account the structural information related to the community. The community structure is
typically associated to the activities performed by a single subgroup of nodes (Porter OnnelaMucha
2009). Thus the main question here is: in what way is it possible to measure the different network
characteristics and statistically exploit the different relationships between the communities as a
whole? In this respect the different communities can as a whole behave differently from their parts.
The aim of this work is to measure community characteristics and analyse the relationships between
different communities. So the analysis is based not only on the nodes of the communities, but also
on the communities as different entities as a whole. In particular a methodological way to do this is
to consider a different approach from that using classical data. In particular, we will consider
interval data, which allows the taking into account of the different node characteristics
characterizing the communities as a whole. The classical data are by their very nature inefficient in
measuring communities as they call for data aggregation and thus there is a loss of information. In
the first section we will consider the statistical problem in detail, in the second one we will explore
an alternative way to represent networks, in the third we consider the way to represent the network
communities, then we provide a simulation study and the application relating to the Italian
interlocking directorship network. Finally we present the conclusions in the last section.
3
The Statistical Problem
Complex networks are typically characterized by deviations from the random graph (the most
simple structure studied between the graphs), by unobvious topological characteristics (Newman
2003),community structure or modularity (Newman 2006) and finally hierarchical structure
(Barabasi et al. 2003). These structures are ubiquitous and this fact represent an important reason
that has recently motivated the scientific community to study the mechanisms which can have a
relevant impact on the complex network and in particular on their topology (Albert Barabasi 2002).
In this respect it is important to take in to account the modularity of the complex networks
(Newman 2006). In fact complex networks are characterized also by multiple communities. It is
very relevant in network analysis to identify these communities so allowing one to understand
relevant functions inside the networks (Fortunato 2010). In order to characterize the role of the
different communities it is possible to consider the topological features and the characteristics of the
attributes for the nodes which are part of the communities. A fundamental aim in network analysis
is to understand and characterize the community structure. Here following Nishikawa and Motter
2011 it is important, in the context of analysis of the network, to introduce the concept of structural
group of nodes. Here the structural group of nodes is obtained by considering a specific community
detection method. Then an analysis is carried out to analyze the topological features of the groups
obtained in the network. This analysis is particularly relevant because the different group of nodes
belong to the different communities which are part of the network and are related to some different
function of the network. So representing the characteristics of the communities means being able to
understand the role or the function of the communities inside a network. However a specific
problem exists: representing the different communities with a specific value related to the different
community characteristics can lead to relevant information loss. In this case a representation which
preserves this information is required. In this context the different communities are represented by
intervals or symbolic data in which we consider both the lower and the upper bound for the values
considered in the same community.
4
In this framework the topological features and the attributes of nodes in the same community are
represented as intervals, that is, interval data can be considered a way to measure quantitatively the
network structures. In this way a possible solution is to consider intervals of values to represent the
different communities and thus be able to represent the network. The network representation can be
very useful in order to detect some latent information of the network relating to the behaviour of the
communities as a whole. For this reason it is particularly important to visualize the community
structure.
Network Representations
There has been an increasing interest in analytical techniques which consider complex data, and in
particular on data characterized by specific internal variations. Particularly relevant contributions in
the field have been those by Billard and Diday (2003) and Diday and Noirhomme-Fraiture
(2008).Interval data (see Billard 2008), in particular, can be very useful in order to measure the
different structural characteristics of the communities as a whole. In fact, communities are typically
characterized by heterogeneous node characteristics and this heterogeneity can be usefully
represented by interval data. These data types have their mathematical properties and appropriate
statistical methods (Gioia Lauro 2005 Brito Duarte 2012Lauro Palumbo 2000 among others). In
network analysis this approach was also considered by Giordano and Brito (2012) who measured
and compared entire network using histogram data. In our work we will consider the network
communities with the aim to characterize the community structure as a whole and analyse the
different roles of the single nodes in the community. Interval data has been chosen as the approach
because it allows the detection of the characteristics of the communities considered.
Now we will consider both the network and the different ways to represent the network and the
community structure. We start with an undirected graph𝐺 = (𝑉, 𝐸). Where V is a set of nodes or
vertices of the graph and E are the edges or the links. Each network can be characterized by
considering their measurements on nodes and edges (Costa et al. 2007).
Each node can be differently characterized by considering for example their centrality features. In
particular each node v can be characterized by their Freeman degree (Wasserman 1994):
𝐶𝑗(𝑣) = deg(𝑣) (1)
5
The Freeman degree measures the level of local centrality of a node in a network (Dequiedt Zenou
2014) In particular it has a different mean from that of the betweenness which is the degree of
global centrality of a node. In this sense the betweenness 𝐶𝑏 for each node v can be defined as:
𝐶𝑏(𝑣) = ∑𝜎𝑠𝑡(𝑣)
𝜎𝑠𝑡𝑠≠𝑣≠𝑡∈𝑉
(2)
Where s and t are two generic nodes (Brandes 2001). Another relevant index related to the same
network is the network density. The network density measures the ratio of the nodes on the total
possible. In order to consider the density of the network (D) we can have :
𝐷 =𝑇
𝑁(𝑁 − 1)
(3)
Where T are the different edges and N are the total of the nodes in the network (Wasserman Faust
1994)
In doing this we can characterize the entire network. An important characteristic of the networks is
the modularity which measures the degree of the possibility of dividing the network into different
modules. The modularity can be used to identify the different communities of the networks
(Newman 2006, Reichardt Bornholdt 2006). In this sense the communities are relevant
characteristics of the networks and allow us to understand the organization of the network as a
whole (Porter Onnela Mucha 2009). At the same time there is not an unique specific definition of
community. We can consider the definition in Fortunato (2010). In particular we can define the
intra-community density and the inter-community density. By considering the nodes we can
observe that the inter-community density is higher than the intra-community density.
By maximizing an index, allowing us to detect the modularity of the network, we are able to
identify the different communities. The different communities are part of the community structure
(see Newman Girvan 2004). Various ways to detect communities are proposed in literature
(Fortunato 2010, Fortunato Lancichinetti 2009, Lancichenetti Fortunato 2012, Leskovec et al. 2010,
Drago and Balzanella 2014)
The aim is to represent the community structure in an adequate manner in order to discover the
latent information it is possible to observe. In particular it is very important to understand from the
6
data the role of the different communities on the whole network. In order to perform this task we
can consider interval data based on the single communities. In this way the communities are
represented by also considering interval data on the member features of the communities.
Community Structure Representation
Each network can be considered by their communities; a different community can be characterized
also by the topological features related to the different node members of the community.
In particular we can consider the different members of the communities and the different
characteristics or features of the communities. Interval data can be used to represent the different
communities. In fact when using the classical data we are not able to represent adequately the
variations of the features. In this respect by using a mean we are losing information. In order to
consider the communities as a whole we can consider a related interval data for each individual
community.
In that way the data matrix related to each single community can be represented by the lower and
upper bounds of the communities. So at the same time we can use the clustering method when
considering the data. The different clusters can be regarded as archetypes of the communities inside
the community structure. Thus we are able to obtain the intervals by the community detection. Then
we can consider the obtained intervals in the visualization process.
So we have:
𝐼[𝑌]𝑐 = [𝑌𝑘𝑐,𝑌𝑘
𝑐] (4)
Where k is the community considered, c is the feature considered (for example the Freeman degree,
or the betweenness). We can consider the single interval as the way to measure a single
characteristic for the entire community.
In particular where 𝑌𝑘𝑐 is the lower bound for the considered characteristic and and 𝑌𝑘
𝑐 can be
considered the upper bound of the interval. In this way intervals can provide important information
about the network structure (for example the summary statistics of the intervals which can be
obtained) and we are able to obtain a data table to visualize the interval data.
7
The interval data for each community represents the upper bound and the lower bound
characterizing each community inside the network. The different intervals can show not easily
detectable structures.
In order to represent the network communities, we first of all detect the different communities by
using the fast greedy method (Clauset et al. 2004). The reason for this is due to the fact that the
method is particularly useful for large networks. Then we represent each community by using an
interval data. At this point we are able to visualize the data by using an interval scatterplot (Bock
Diday 2000) in order to discover the community network structure. For an interpretation of the
results we consider a simulation study of the approach considered.
Simulation Study
We consider a simulation study in order to analyze the community structure of different network by
considering the approach we are proposing here. In particular we will consider different networks
and we want to observe the different results. In the design of the networks we take into
consideration three network models
1) The Barabasi Albert Model (Barabasi Albert 1999)
2) The Random ErdosRenyi Model (ErdosRenyi 1959)
3) The Forest Fire Network Model (Leskovec et al. 2005)
The different simulation algorithms come from the R package igraph (CsardiNepusz 2006); we
have chosen three distinct algorithms to generate the network to obtain different structures to
analyse. The experimental design of the simulation is organized as follows: we generate the random
networks; then we detect the different communities and we compute the different topological
features of the nodes. Finally we compute the different intervals of the considered communities.
The output of each single run of the simulation is compared. We can observe from the different runs
that the method identifies the different communities of the network.
At this point for each run we are able to observe the scatterplot of the interval data related to the
different communities. The variables considered on the scatterplot are variables related to the
structural characteristics of the nodes, such as the betweenness, the degree or the closeness. Each
community is represented by a different value characterized by the lower and the upper bound of

8
the intervals. In this way we are able to discover the characteristics of the communities considered.
The results are useful because when we consider the results only by characterizing the different
communities by using a mean of the values of the different nodes we are not able to observe the
variations on the data. However in our case the method clearly shows the capability to discover the
differences which can occur in the different communities. At the same time by considering different
attributes we are better able to see the different functions of the communities and the differently
related roles. We will now consider the results related to the three cases, that is, those we have
simulated.
The results show clearly that the approach captures the structure of the network in terms of
communities. In particular we can see that the approach considers not just the single nodes but
groups of nodes (the communities) so there could be a relevant usefulness in considering the group
of nodes because it allows us to understand the stylized structure of the network. In fact by
observing the network as a whole we are able to understand the relevant relationships between the
different communities and also the general structure of the network. In fig.1 we can observe the
network structure, by observing a general network visualization. The case 1 in fig. 1 shows a
network structure based on different communities. In particular we are able to identify six different
communities. The six different communities show that a relevant structure can be detected. By
considering the graph we can observe that there are differences in the centrality levels of the
different communities (fig.1 and table 1.). In fact two communities seem to show higher levels of
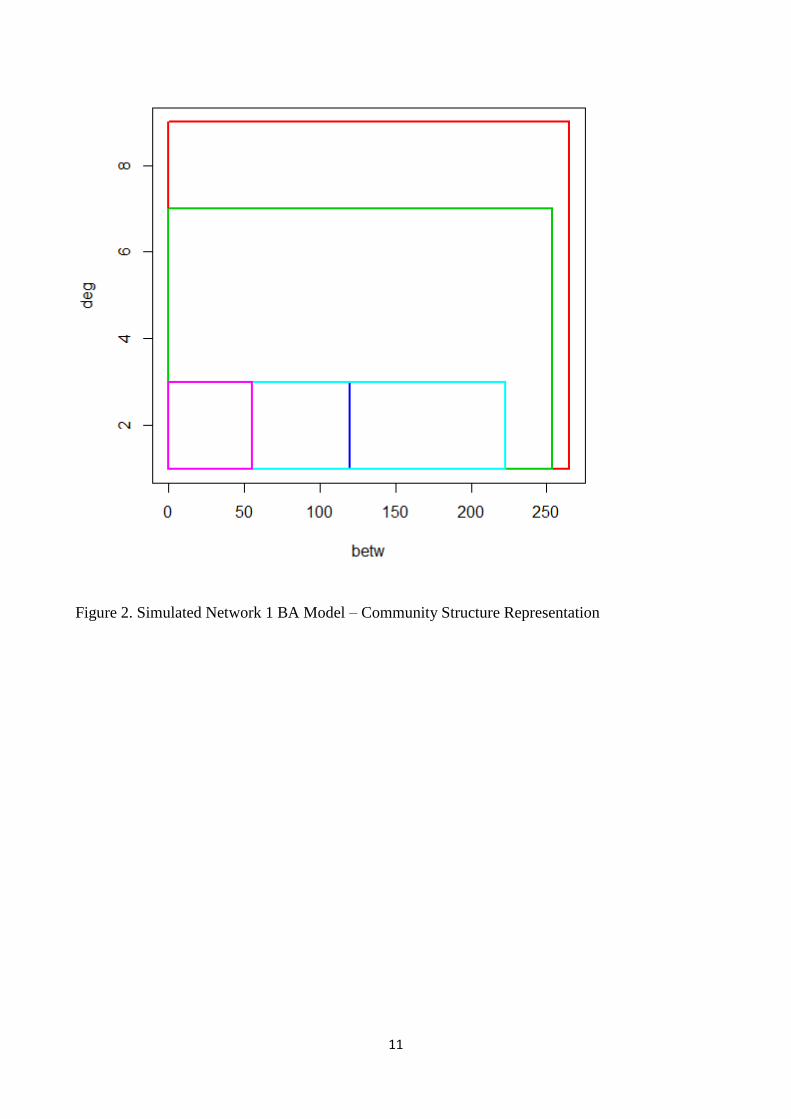
global and local centrality than other communities. At the same time observing the entire interval
scatterplot (fig.2) we can observe that there are two communities which show higher levels of
betweenness and Freeman degree. The other communities do not seem particularly relevant so the
most important communities are those with higher levels of betweenness and Freeman degree. The
result is clearer in fig.2 so it could be an interesting representation using the interval data for each
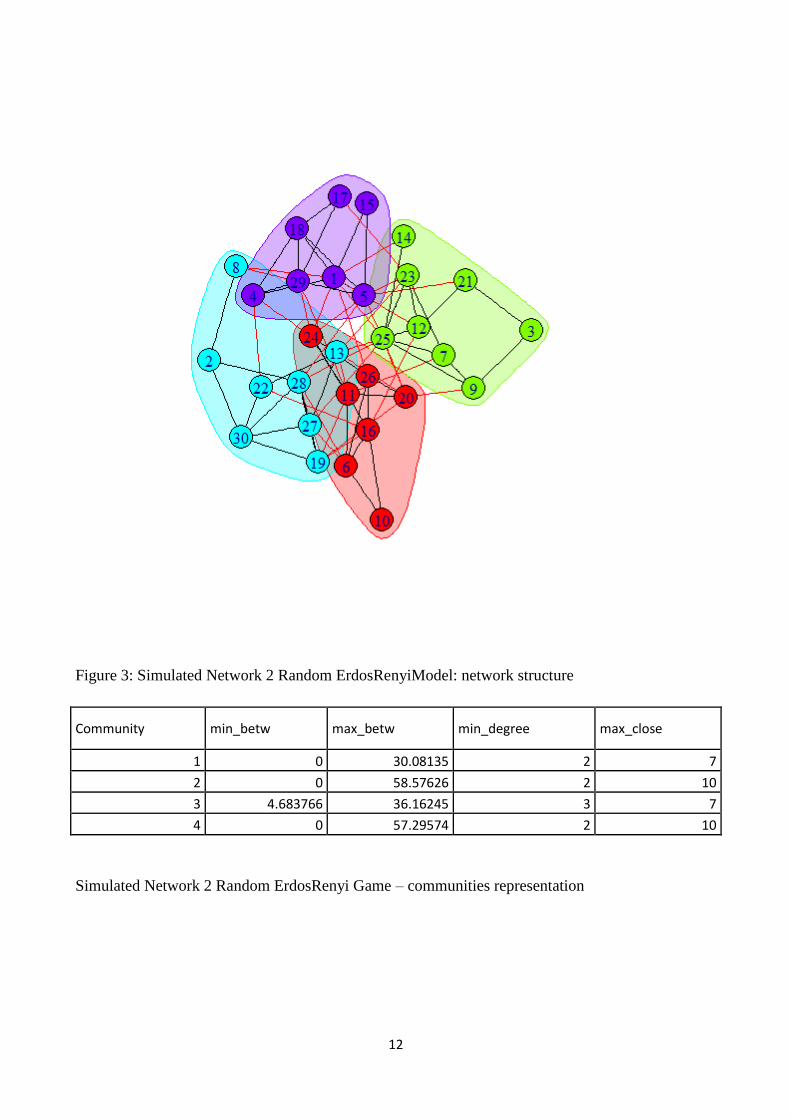
community as it shows in a stylized way the structure of the network. If we consider network 2,
from figure 3 we are presented with a very different situation: the network structure is denser and
there are more connections inside the different communities at the same time (fig.3 and table 2.). So
the result is also a higher equilibrium between the levels of maxima betweenness and maxima
degree. At the same time there is no particularly straightforward way to detect this equilibrium
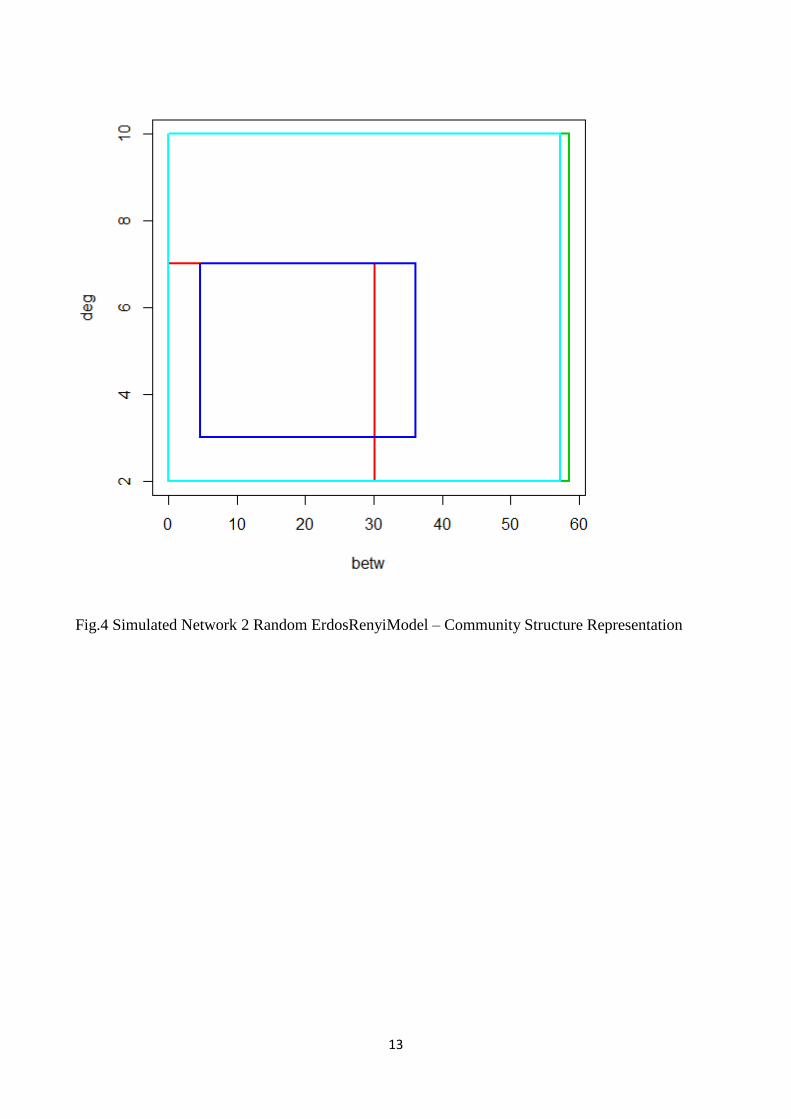
directly from the graph. In this sense we can observe that these results seems to be well represented
on the interval scatter plot diagram. In fact it is possible to observe that the different structure can
be quickly detected (fig.4). In particular we detect two communities with higher levels of
betweenness and Freeman degree. Finally we can consider the third case. In this case the network
structure seems to be very centralized (fig.5 and table 3) and so the final result shows clearly the
9
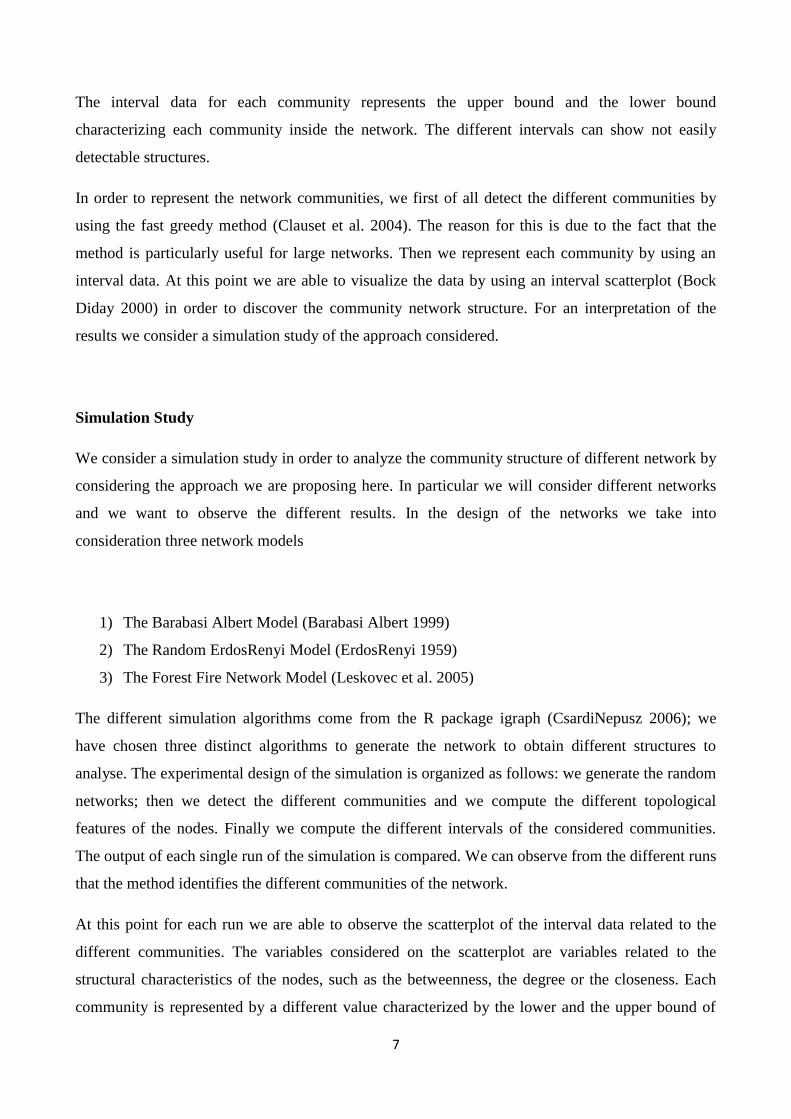
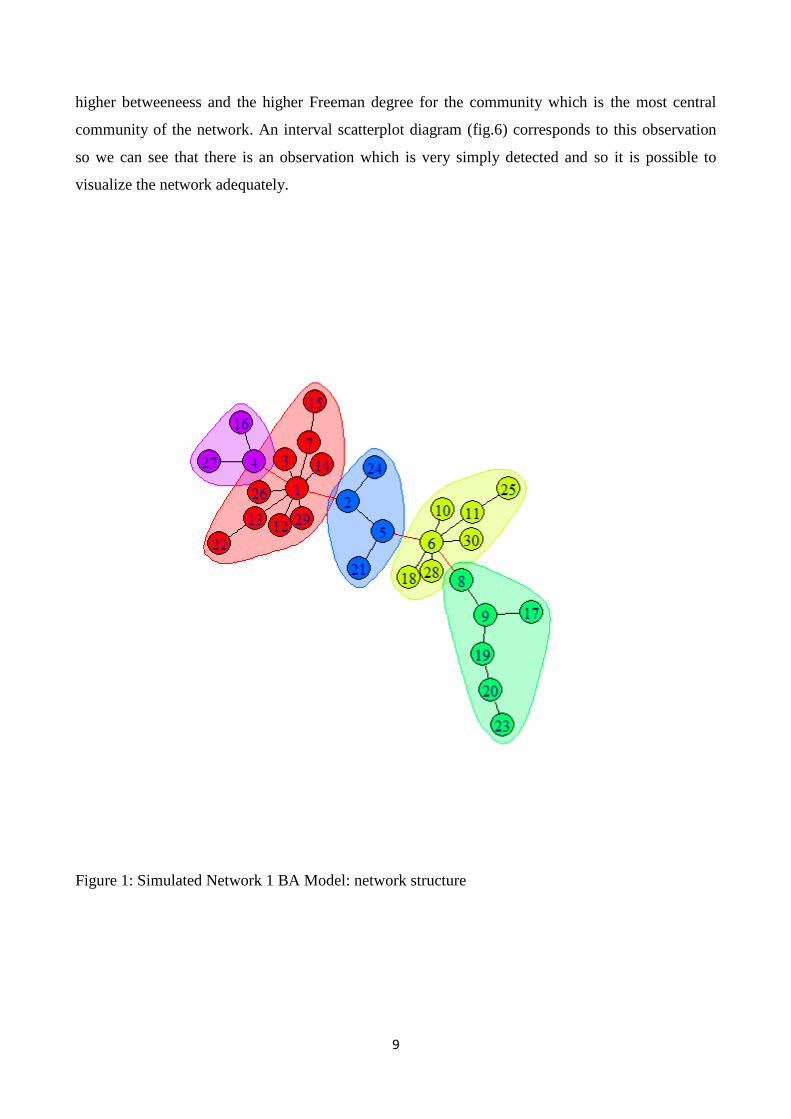
higher betweeneess and the higher Freeman degree for the community which is the most central
community of the network. An interval scatterplot diagram (fig.6) corresponds to this observation
so we can see that there is an observation which is very simply detected and so it is possible to
visualize the network adequately.
Figure 1: Simulated Network 1 BA Model: network structure
10
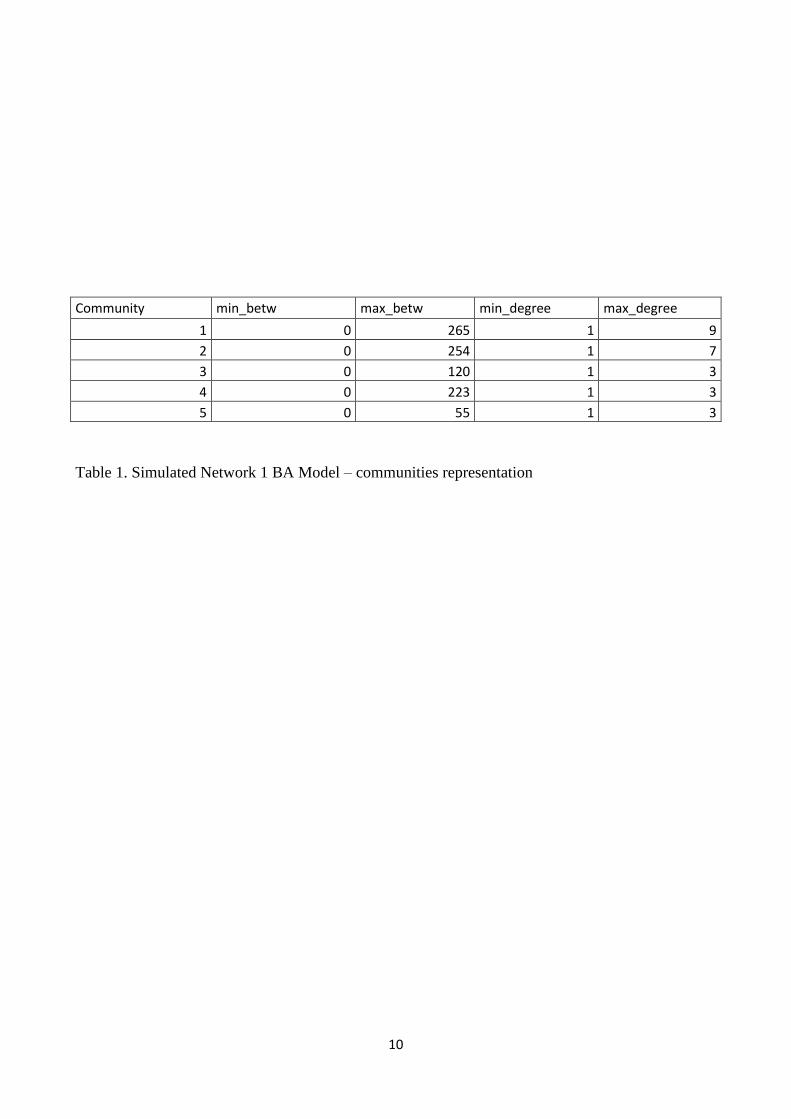
Community min_betw max_betw min_degree max_degree
1 0 265 1 9
2 0 254 1 7
3 0 120 1 3
4 0 223 1 3
5 0 55 1 3
Table 1. Simulated Network 1 BA Model – communities representation
11
Figure 2. Simulated Network 1 BA Model – Community Structure Representation
12
Figure 3: Simulated Network 2 Random ErdosRenyiModel: network structure
Community min_betw max_betw min_degree max_close
1 0 30.08135 2 7
2 0 58.57626 2 10
3 4.683766 36.16245 3 7
4 0 57.29574 2 10
Simulated Network 2 Random ErdosRenyi Game – communities representation
13
Fig.4 Simulated Network 2 Random ErdosRenyiModel – Community Structure Representation

14
Figure 5: Simulated Network 3 ForestModel: network structure
Community min.bet1 max.bet2 min.deg1 max.deg2
1 0 63.16667 1 7
2 0 118.5 1 8
3 0 100.3333 2 5
4 0 219.5 1 14
Table 3. Simulated Network 3 ForestModel – Community Structure Representation

15
Fig. 6 Simulated Network 3Forest Model – Community Structure Representation
Application on real data
16
We will now consider a dataset related to interlocking directorships in Italy (year 2012). The
network community structure allows us to determine the number of relevant communities in a
network and the different nodes which are part of the different communities. Thereby we can
obtain the different communities and then we can represent them as communities. At this point we
decide to represent them as interval scatter plot. The different community structure is represented
on the interval scatter plot diagram, especially where we expect to find a particular data structure
for the network. It is important to consider the shape of the different observations on the scatter
plot. If there is higher centralization we can expect a particular network structure.
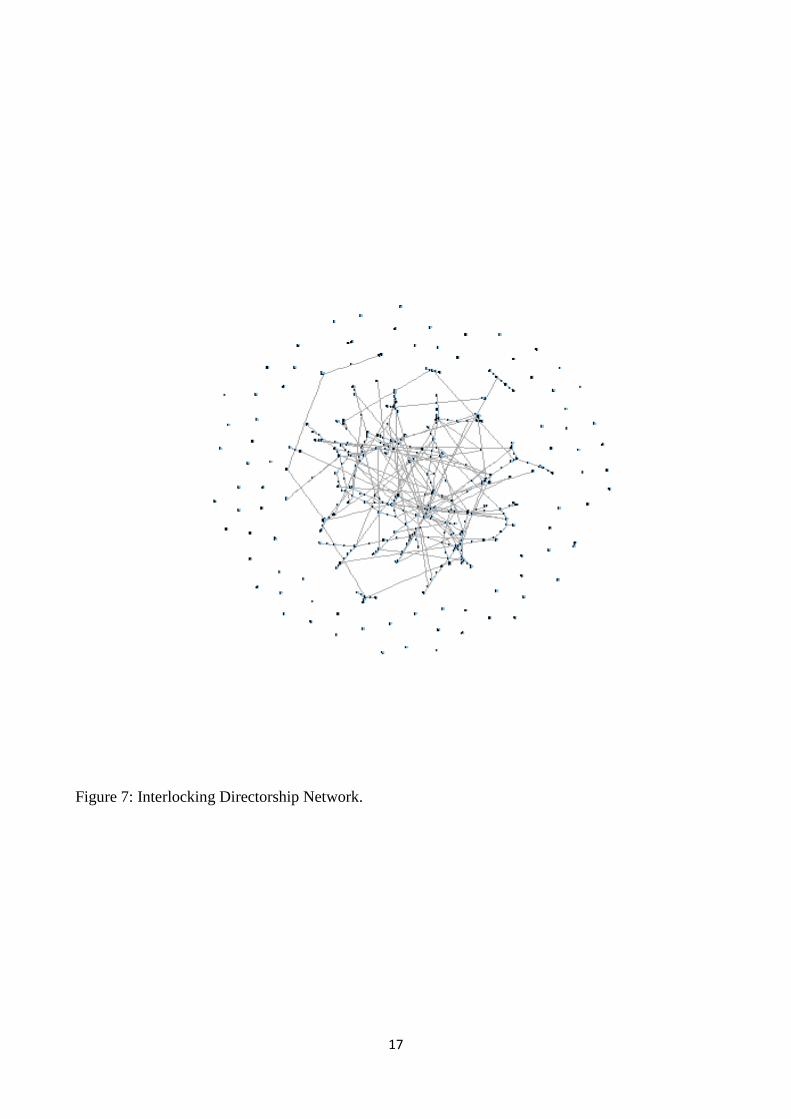
In terms of the Freeman degree and the betweenness we can have a higher value for some statistical
units. If there is a higher difference on the different observations it means that the network as a
community structure becomes more centralized. So by considering the different structure of the
intervals we are able to identify the centralization level of the community structure. On observing
the network (fig.7) we can observe the general network structure which tends to be characterized by
a central structure. This structure seems to be coherent with previous results in literature (Piccardi et
al 2010, BellenzierGrassi 2014 Drago et al. 2014 and 2015). In particular by considering the levels
of betweenness and Freeman degree the results seem to be coherent with previous results for each
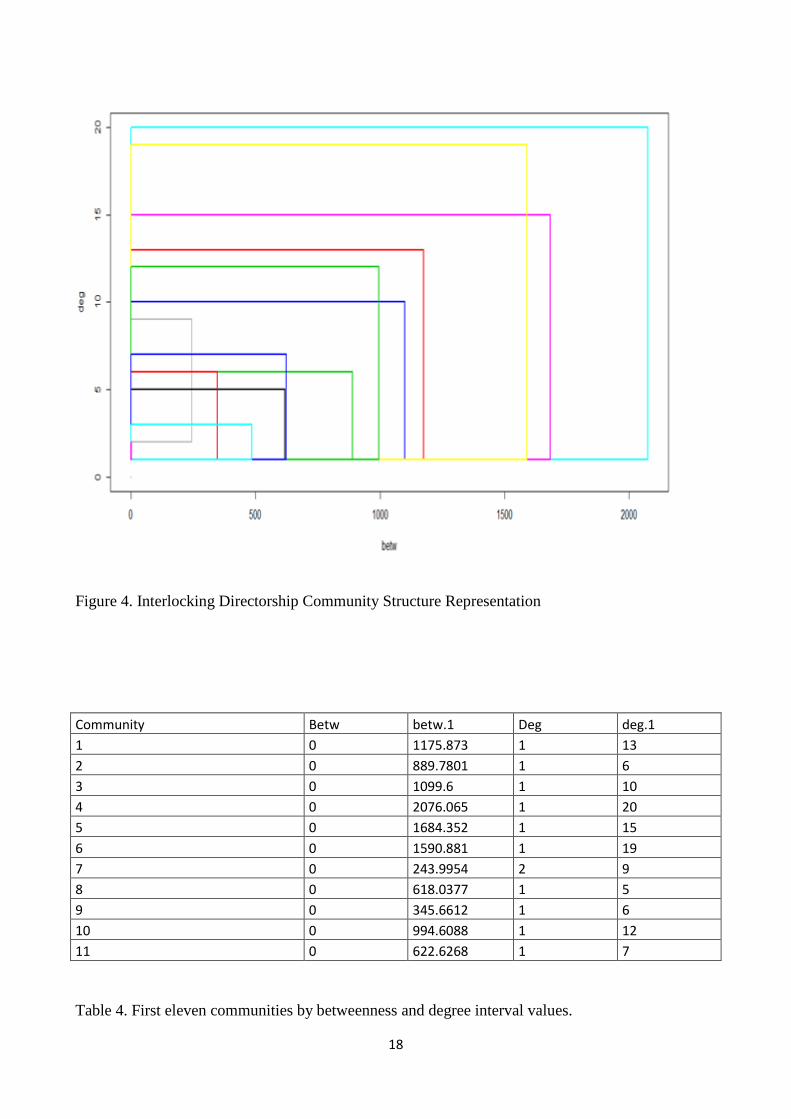
node. In order to consider community detection we also use the fast greedy algorithm which
performs well with large networks. In this case we observe that there are at least 17 communities
(table 4). These communities share different characteristics on betweenness and Freeman degree. In
particular we can observe that there are three communities which are the most relevant. The first
one (community 4) is characterized by the highest values of betweenness and Freeman degree.
The community 5 shows a higher level than community 6 of betwenness but lower levels on the
Freeman degree. That means community 5 tends to be more globally than locally centred. At the
same time community 6 tends to be characterized by a more local than global centrality. Both the
communities have lower values of Freeman degree and betweenness than community 4.
The community with a higher level of betweenness and Freeman degree represents the most
centralized companies in Italian capitalism, this has also been observed in other studies. The
companies which are members of the different communities appear in the Appendix. The most
relevant result is that the structure of the Italian interlocking directorship network seems to be
clearer by observing the interval scatterplot diagram (also by considering the initial figure 7). In
particular we are able to detect three relevant communities ( 4, 5 and 6) whilst at the same time we
are able to detect the highest community (table 4). The communities 5 and 6 show higher levels
than other communities, which in general reveals an equilibrium on the levels of the centrality
measures.
17
Figure 7: Interlocking Directorship Network.
18
Figure 4. Interlocking Directorship Community Structure Representation
Community Betw betw.1 Deg deg.1
1 0 1175.873 1 13
2 0 889.7801 1 6
3 0 1099.6 1 10
4 0 2076.065 1 20
5 0 1684.352 1 15
6 0 1590.881 1 19
7 0 243.9954 2 9
8 0 618.0377 1 5
9 0 345.6612 1 6
10 0 994.6088 1 12
11 0 622.6268 1 7
Table 4. First eleven communities by betweenness and degree interval values.

19
Conclusions
In this work we have proposed a new approach for analyzing complex networks. In particular this
approach is based on the need to analyze the network by decomposing the network into different
communities. The different communities are characterized by considering interval data in order to
allow the variation existing between the different nodes. In this way we are able to detect the
structure of the network. The results obtained are encouraging. In fact the network seems to be well
represented by the intervals. At the same time the use of a mean seems to reduce the information
extracted from the networks and from the different communities. The final conclusion of the
application is the same for the simulated data and from the application on the real data and it is that
this method allows us to identify the correct structure of the network. For example by considering
the network of Italian interlocking directorships we able to identify the structure of the communities
and in particular the different roles of the different communities, which it is possible to observe on
the interval scatter plot diagram.

20
References
Albert, R., & Barabasi, A. L. (2002). Statistical mechanics of complex networks. Reviews of
modern physics, 74(1), 47.
Barabasi, A.-L. and Albert R. (1999). Emergence of scaling in random networks Science, 286 509--
512.
Barabasi, A. L., Dezso, Z., Ravasz, E., Yook, S. H., &Oltvai, Z. (2003). Scale--Free and
Hierarchical Structures in Complex Networks. In Modelling of Complex Systems: Seventh Granada
Lectures (Vol. 661, No. 1, pp. 1-16). AIP Publishing.
Bellenzier, L., & Grassi, R. (2014). Interlocking directorates in Italy: persistent links in network
dynamics. Journal of Economic Interaction and Coordination,9(2), 183-202.
Billard, L. (2008). Some analyses of interval data. CIT. Journal of Computing and Information
Technology, 16(4), 225-233.
Billard, L., & Diday, E. (2003) From the statistics of data to the statistics of knowledge: symbolic
data analysis. Journal of the American Statistical Association, 98(462), 470-487.
Bock, H. H., & Diday, E. (Eds.). (2000). Analysis of symbolic data: exploratory methods for
extracting statistical information from complex data. Springer Science & Business Media.
Brandes, U. (2001). A faster algorithm for betweenness centrality. Journal of mathematical
sociology, 25(2), 163-177.
Brito, P., & Duarte Silva, A. P. (2012). Modelling interval data with Normal and Skew-Normal
distributions. Journal of Applied Statistics, 39(1), 3-20.
Clauset, A., Newman, M. E., & Moore, C. (2004). Finding community structure in very large
networks. Physical review E, 70(6), 066111.
Csardi G, Nepusz T: The igraph software package for complex network research, InterJournal,
Complex Systems 1695. 2006. http://igraph.org
Costa, L. D. F., Rodrigues, F. A., Travieso, G., & Villas Boas, P. R. (2007). Characterization of
complex networks: A survey of measurements. Advances in Physics, 56(1), 167-242.

21
Dequiedt, V., & Zenou, Y. (2014). Local and Consistent Centrality Measures in Networks. Working
Paper
Diday, E., &Noirhomme-Fraiture, M. (Eds.). (2008). Symbolic data analysis and the SODAS
software (pp. 1-457). J. Wiley & Sons.
Drago C., Balzanella A. (2015) "Non-metric MDS Consensus Community Detection” Advances in
Statistical Models for Data Analysis, Edited by Morlini Isabella, Minerva Tommaso, Vichi
Maurizio, 08/2015; Springer
Drago, C. and Millo, F. and Ricciuti, R. and Santella, P. (2014) ” Corporate Governance Reforms,
Interlocking Directorship and Company Performance in Italy”. International Review of Law and
Economics, Volume 41, March 2015, Pages 38–49.
Drago, C. and Ricciuti, R. and Santella, P. (2015) “An Attempt to Disperse the Italian Interlocking
Directorship Network: Analyzing the Effects of the 2011 Reform”. Working Paper. Available at
SSRN:http://ssrn.com/abstract=2580700
Erdos, P. and Renyi, A., On random graphs, PublicationesMathematicae 6, 290--297 (1959).
Fortunato, S. (2010) Community detection in graphs. Physics Reports, 486(3), 75-174.
Gioia, F., &Lauro, C. N. (2005) Basic statistical methods for interval data.
Statisticaapplicata, 17(1).
Giordano, G., & Brito, M. P. (2012) Network Data as Complex Data Objects: An Approach Using
Symbolic Data Analysis. Analysis and Modelling of Complex Data in Behavioural and Social
Sciences, 38.
Lancichinetti, A., & Fortunato, S. (2009). Community detection algorithms: a comparative
analysis. Physical review E, 80(5), 056117.
Lancichinetti, A., & Fortunato, S. (2012). Consensusclustering in complex networks. Scientific
reports, 2.
Lauro, C. N., & Palumbo, F. (2000). Principal component analysis of interval data: a symbolic data
analysis approach. Computational statistics, 15(1), 73-87.
Leskovec J., Kleinberg J. and Faloutsos C. (2005) “Graphs over time: densification laws, shrinking
diameters and possible explanations” KDD '05: Proceeding of the eleventh ACM SIGKDD
international conference on Knowledge discovery in data mining, 177--187, 2005.
22
Leskovec, J., Lang, K. J., & Mahoney, M. (2010, April). Empirical comparison of algorithms for
network community detection. In Proceedings of the 19th international conference on World wide
web (pp. 631-640). ACM.
Newman, M. E. (2003). The structure and function of complex networks. SIAM review, 45(2), 167-
256.
Newman, M. E., & Girvan, M. (2004). Finding and evaluating community structure in
networks. Physical review E, 69(2), 026113.
Newman, M. E. (2006). Modularity and community structure in networks.Proceedings of the
National Academy of Sciences, 103(23), 8577-8582.
Nishikawa, T., &Motter, A. E. (2011). Discovering network structure beyond communities.
Scientific Reports, 1, 151.
OldemarRodriguez R. with contributions from Olger Calderon and Roberto Zuniga (2014). RSDA:
RSDA - R to Symbolic Data Analysis. R package version 1.2. http://CRAN.R-
project.org/package=RSDA
Piccardi, C., Calatroni, L., & Bertoni, F. (2010). Communities in Italian corporate
networks. Physica A: Statistical Mechanics and its Applications,389(22), 5247-5258.
Porter, M. A., Onnela, J. P., &Mucha, P. J. (2009). Communities in networks. Notices of the
AMS, 56(9), 1082-1097.
Reichardt, J., & Bornholdt, S. (2006). Statistical mechanics of community detection. Physical
Review E, 74(1), 016110.
Wasserman, S., & Faust, K. (1994). Social network analysis: Methods and applications (Vol. 8).
Cambridge University Press.

23
Appendix
Company Community
AMPLIFON SPA 1
ASSICURAZIONI GENERALI SPA 1
BANCA GENERALI SPA 1
BANCA INTERMOBILIARE DI INVESTIMENTI E GESTIONI SPA 1
BANCO DI DESIO E DELLA BRIANZA SPA 1
BENI STABILI SOCIETA' PER AZIONI SOCIETA' DI INVESTIMENTO
IMMOBILIARE QUOTATA 1
CARRARO SPA 1
DEA CAPITAL SPA 1
DIASORIN SPA 1
FULLSIX SPA 1
IL SOLE 24 ORE SPA 1
IMPREGILO SPA 1
LOTTOMATICA GROUP SPA 1
LUXOTTICA GROUP SPA 1
PARMALAT SPA 1
PIERREL SPA 1
RATTI SPA 1
SAFILO GROUP SPA 1

24
SAIPEM SPA 1
SARAS SPA RAFFINERIE SARDE 1
SNAI SPA 1
BANCA POPOLARE DELL'EMILIA ROMAGNA, SOCIETA'
COOPERATIVA 2
BANCO DI SARDEGNA SPA 2
BEGHELLI SPA 2
BIANCAMANO SPA 2
ESPRINET SPA 2
FONDIARIA - SAI SPA 2
IGI IMMOBILIARE GRANDE DISTRIBUZIONE SIIQ SPA 2
MARR SPA 2
MILANO ASSICURAZIONI SPA 2
PREMAFIN FINANZIARIA SPA HOLDING DI PARTECIPAZIONI 2
RISANAMENTO SPA 2
TISCALI SPA 2
UNIPOL GRUPPO FINANZIARIO SPA 2
ZUCCHI SPA - VINCENZO ZUCCHI 2
BANCA POPOLARE DI SONDRIO, SOCIETA' COOPERATIVA PER
AZIONI 3
BANCO POPOLARE SOCIETA' COOPERATIVA 3
BREMBO SPA - FRENI BREMBO 3
BUZZI UNICEM SPA 3

25
CREDITO BERGAMASCO SPA 3
CREDITO VALTELLINESE SOCIETA' COOPERATIVA 3
EXOR SPA 3
FALCK RENEWABLES SPA 3
FIAT INDUSTRIAL SPA 3
FIAT SPA 3
I.M.A INDUSTRIA MACCHINE AUTOMATICHE SPA 3
INDESIT COMPANY SPA 3
JUVENTUS FOOTBALL CLUB SPA 3
MARCOLIN SPA 3
POLTRONA FRAU SPA 3
SOL SPA 3
TESMEC SPA 3
TOD'S SPA 3
A2A SPA 4
ADF SPA 4
ARNOLDO MONDADORI EDITORE SPA 4
ATLANTIA SPA 4
AUTOGRILL SPA 4
BANCA POPOLARE DI MILANO SCRL 4
CAMFIN SPA 4
CLASS EDITORI SPA 4

26
COBRA AUTOMOTIVE TECHNOLOGIES SPA 4
COMPAGNIA IMMOBILIARE AZIONARIA - CIA SPA 4
DADA SPA 4
EL.EN. SPA 4
ENGINEERING - INGEGNERIA INFORMATICA - SPA 4
ERGYCAPITAL SPA 4
FIERA MILANO SPA 4
GEMINA SPA - GENERALE MOBILIARE INTERESSENZE AZIONARIE 4
INTEK GROUP SPA 4
INTESA SANPAOLO SPA 4
MAIRE TECNIMONT SPA 4
MEDIASET SPA 4
MEDIOBANCA SPA 4
MEDIOLANUM SPA 4
MOLECULAR MEDICINE SPA 4
PIRELLI & C. SPA 4
PRELIOS SPA 4
SALVATORE FERRAGAMO SPA 4
SNAM SPA 4
TELECOM ITALIA SPA 4
VITTORIA ASSICURAZIONI SPA 4
ASTALDI SPA 5

27
BANCA PROFILO SPA 5
CEMBRE SPA 5
CIR SPA - COMPAGNIE INDUSTRIALI RIUNITE 5
COFIDE - GRUPPO DE BENEDETTI SPA 5
GEOX SPA 5
GRUPPO EDITORIALE L'ESPRESSO SPA 5
IMMSI SPA 5
M&C SPA 5
MEDIACONTECH SPA 5
PIAGGIO & C. SPA 5
PREMUDA SPA 5
SOGEFI SPA 5
TREVI - FINANZIARIA INDUSTRIALE SPA 5
BE THINK, SOLVE, EXECUTE SPA 6
BOLZONI SPA 6
CREDITO EMILIANO SPA 6
DATALOGIC SPA 6
DAVIDE CAMPARI - MILANO SPA 6
DELCLIMA SPA 6
DE LONGHI SPA 6
ENEL SPA 6
GAS PLUS SPA 6

28
INTERPUMP GROUP SPA 6
IREN SPA 6
ITALCEMENTI SPA FABBRICHE RIUNITE CEMENTO 6
ITALMOBILIARE SPA 6
MITTEL SPA 6
NOEMALIFE SPA 6
PRIMA INDUSTRIE SPA 6
PRYSMIAN SPA 6
RCS MEDIAGROUP SPA 6
SOCIETA' CATTOLICA DI ASSICURAZIONE SOCIETA' COOPERATIVA 6
SORIN SPA 6
TAMBURI INVESTMENT PARTNERS SPA 6
UNIONE DI BANCHE ITALIANE SCPA 6
ZIGNAGO VETRO SPA 6
ALERION CLEAN POWER SPA 7
ASTM SPA 7
EDISON SPA 7
INDUSTRIA E INNOVAZIONE SPA 7
RENO DE MEDICI SPA 7
SABAF SPA 7
SIAS - SOCIETA' INIZIATIVE AUTOSTRADALI E SERVIZI SPA 7
STEFANEL SPA 7

29
TERNA 7
APS SPA 8
ACOTEL GROUP SPA 8
BEST UNION COMPANY SPA 8
HERA SPA (HOLDING ENERGIA RISORSE AMBIENTE) 8
LANDI RENZO SPA 8
MONRIF SPA 8
PIQUADRO SPA 8
POLIGRAFIVI EDITORIALE SPA 8
BANCA MONTE DEI PASCHI DI SIENA SPA 9
DAMIANI SPA 9
EEMS ITALIA SPA 9
ENI SPA 9
SAES GETTERS SPA 9
SCREEN SERVICE BROADCASTING TECHNOLOGIES SPA 9
TAS TECNOLOGIA AVANZATA DEI SISTEMI SPA 9
TELECOM ITALIA MEDIA SPA 9
TXT E-SOLUTIONS SPA 9
ACEA SPA 10
BANCA FINNAT EURAMERICA SPA 10
CALTAGIRONE EDITORE SPA 10
CALTAGIRONE SPA 10

30
CEMENTIR HOLDING SPA 10
CICCOLELLA SPA 10
UNICREDIT SPA 10
VALSOIA SPA 10
VIANINI INDUSTRIA SPA 10
VIANINI LAVORI SPA 10
ANSALDO STS SPA 11
ENERVIT SPA 11
EUROTECH SPA 11
FINMECCANICA SPA 11
POLIGRAFICA S. FAUSTINO SPA 11
REPLY SPA 11
İ ş
İ ş
Ś