EXPLORING THE ASSOCIATION BETWEEN CORPORAL PUNISHMENT...
102
1 EXPLORING THE ASSOCIATION BETWEEN CORPORAL PUNISHMENT AND TODDLERS’ DEVELOPMENTAL TRAJECTORIES OF PHYSICAL AGGRESSION By KRISTIN A. BELL A THESIS PRESENTED TO THE GRADUATE SCHOOL OF THE UNIVERSITY OF FLORIDA IN PARTIAL FULFILLMENT OF THE REQUIREMENTS FOR THE DEGREE OF MASTER OF ARTS UNIVERSITY OF FLORIDA 2010
Transcript of EXPLORING THE ASSOCIATION BETWEEN CORPORAL PUNISHMENT...
1
EXPLORING THE ASSOCIATION BETWEEN CORPORAL PUNISHMENT AND TODDLERS’ DEVELOPMENTAL TRAJECTORIES OF PHYSICAL AGGRESSION
By
KRISTIN A. BELL
A THESIS PRESENTED TO THE GRADUATE SCHOOL OF THE UNIVERSITY OF FLORIDA IN PARTIAL FULFILLMENT
OF THE REQUIREMENTS FOR THE DEGREE OF MASTER OF ARTS
UNIVERSITY OF FLORIDA
2010
2
© 2010 Kristin A. Bell
3
To my parents, for the unconditional love and encouragement with which they have always provided me, and to my husband, who is my best friend

4
ACKNOWLEDGMENTS
I would first like to recognize my chair, Dr. Chris L. Gibson, for his guidance in
writing this thesis. Dr. Gibson provided the inspiration for this project and the data that
is analyzed. The project would not have been possible without his insight and
knowledge. I would like to also extend my appreciation to my co-chair, Dr. Ronald L.
Akers, and the additional members of my committee, Dr. Marvin Krohn and Dr. Lonn
Lanza-Kaduce for their contributions to this final product and all of their assistance
along the way. My entire committee has been extremely accommodating and, for that,
I am very thankful. I am also grateful for all of the advice, support, and understanding
Dr. Lanza-Kaduce has afforded me for as long as I have known him.
This thesis would be incomplete without acknowledging the people who have
always believed in me and who have also given me people to believe in: My family. I
will never be able to adequately express my gratitude to my parents, David Michael Bell
and Elizabeth Ann Bell, for all they have given me. They were my first teachers. My
parents have taught me that the most important lessons in life cannot be learned even
at the greatest of universities.
I am forever indebted to my wonderful husband, Travis Alan Gerke, for always
loving me, for always understanding me, and for encouraging me endlessly. He is not
only my husband, but through this endeavor has acted as a programmer, an editor, and
a statistical consultant. His support is invaluable to me. I would not have been able to
complete this project without his patience and devotion. I am the luckiest.
Last, but not least, I must acknowledge my silent companion throughout this past
year. I would not have made it through the longest, hardest days without my most loyal
friend, Beans.
5
TABLE OF CONTENTS page
ACKNOWLEDGMENTS .................................................................................................. 4
LIST OF TABLES ............................................................................................................ 7
LIST OF FIGURES .......................................................................................................... 8
LIST OF ABBREVIATIONS ............................................................................................. 9
ABSTRACT ................................................................................................................... 10
CHAPTER
1 INTRODUCTION .................................................................................................... 12
2 LITERATURE REVIEW .......................................................................................... 16
An Overview of Corporal Punishment ..................................................................... 16 Corporal Punishment and Externalizing Behavior Problems ................................... 22 Theoretical Explanations of the Relationship between Corporal Punishment and
Aggression ........................................................................................................... 28 Developmental Studies of Aggression .................................................................... 31 Significance of Current Research ........................................................................... 36 Research Questions and Hypotheses..................................................................... 38
3 METHODS .............................................................................................................. 40
Data ........................................................................................................................ 40 Measures ................................................................................................................ 41
Dependent Variable .......................................................................................... 41 Independent Variable(s) ................................................................................... 43 Risk Factors ..................................................................................................... 45
4 ANALYTIC STRATEGY AND ANALYSIS PLAN ..................................................... 53
An Overview of Group-Based Modeling of Development ........................................ 53 Analysis .................................................................................................................. 55
Model Estimation Procedures ........................................................................... 56 Creation of Group Profiles ................................................................................ 58
5 RESULTS ............................................................................................................... 59
Bivariate Analysis ................................................................................................... 59 Identification and Description of Trajectory Groups ................................................ 60 Creating Group Profiles .......................................................................................... 63
6
6 DISCUSSION AND CONCLUSIONS ...................................................................... 72
Summary of Findings .............................................................................................. 72 Limitations ............................................................................................................... 76 Future Research ..................................................................................................... 79
APPENDIX
A LIST OF SCALE ITEMS .......................................................................................... 84
B BIVARIATE RELATIONSHIPS ............................................................................... 85
LIST OF REFERENCES ............................................................................................... 95
BIOGRAPHICAL SKETCH .......................................................................................... 102
7
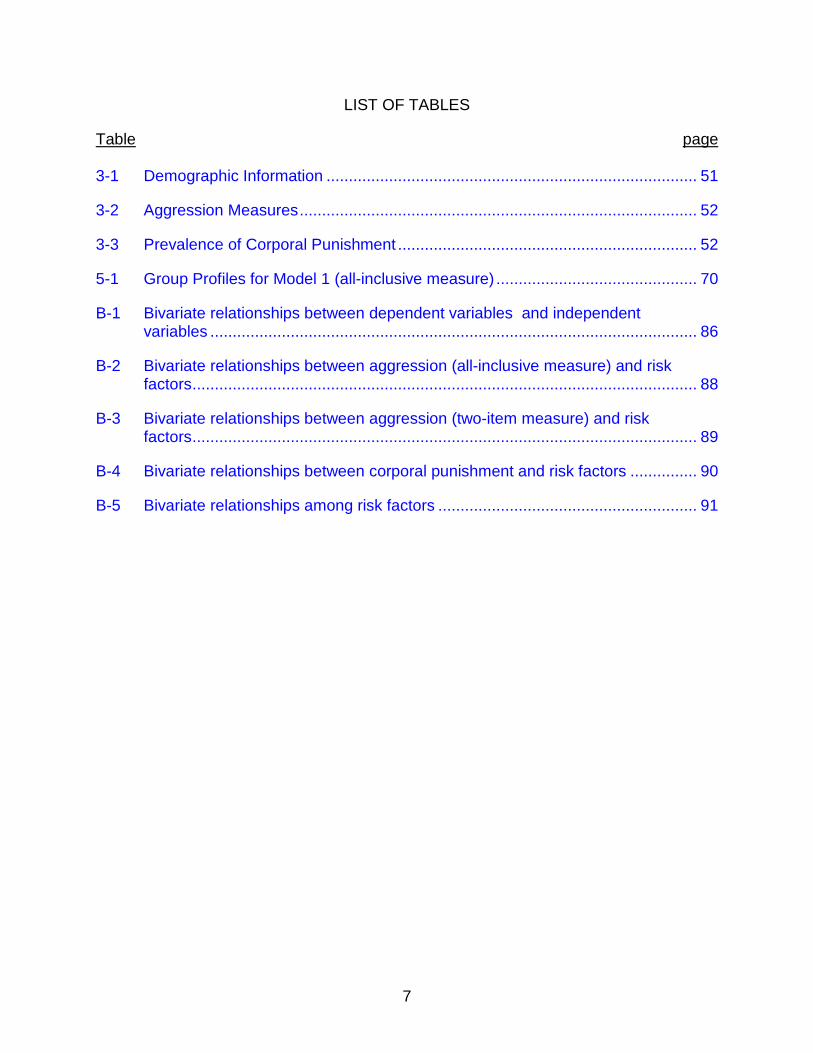
LIST OF TABLES
Table page 3-1 Demographic Information ................................................................................... 51
3-2 Aggression Measures ......................................................................................... 52
3-3 Prevalence of Corporal Punishment ................................................................... 52
5-1 Group Profiles for Model 1 (all-inclusive measure) ............................................. 70
B-1 Bivariate relationships between dependent variables and independent variables ............................................................................................................. 86
B-2 Bivariate relationships between aggression (all-inclusive measure) and risk factors ................................................................................................................. 88
B-3 Bivariate relationships between aggression (two-item measure) and risk factors ................................................................................................................. 89
B-4 Bivariate relationships between corporal punishment and risk factors ............... 90
B-5 Bivariate relationships among risk factors .......................................................... 91
8
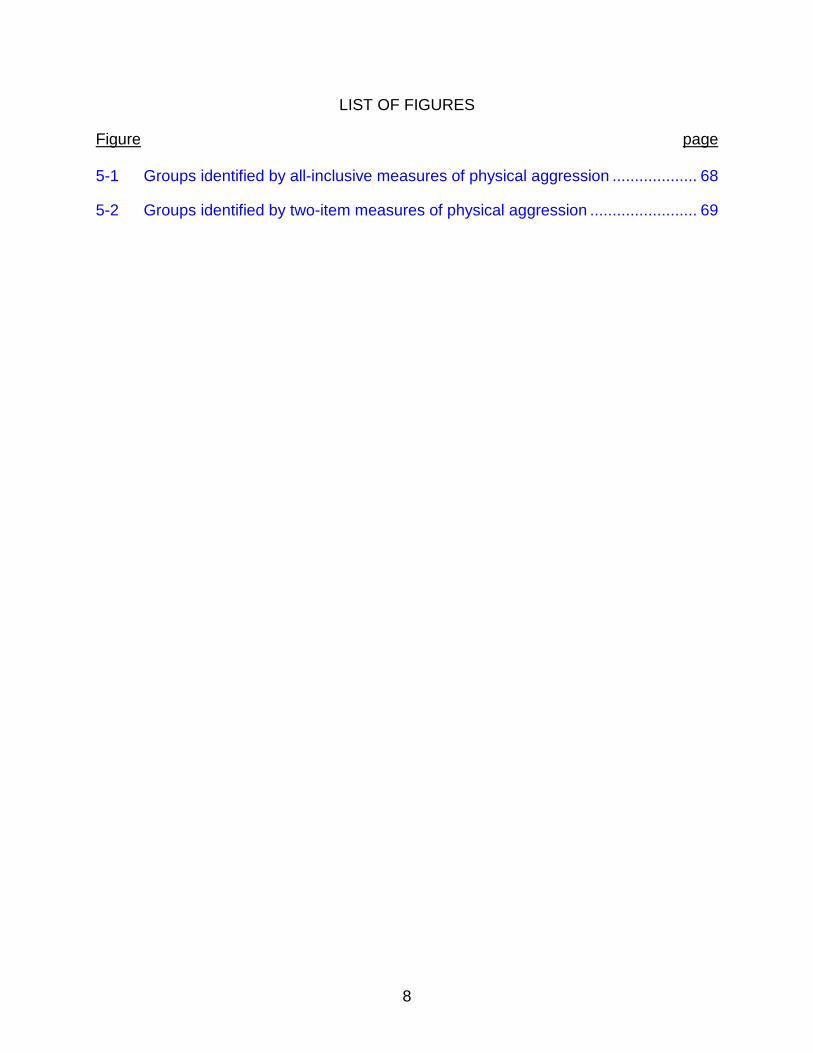
LIST OF FIGURES
Figure page 5-1 Groups identified by all-inclusive measures of physical aggression ................... 68
5-2 Groups identified by two-item measures of physical aggression ........................ 69
9
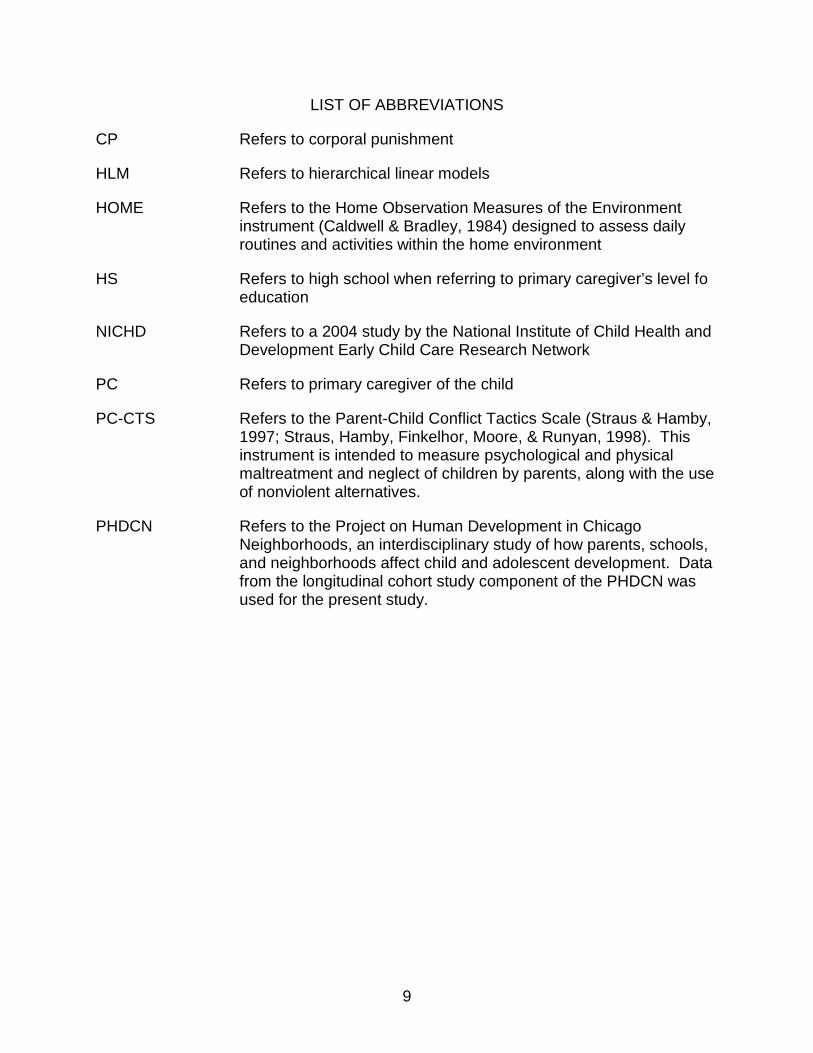
LIST OF ABBREVIATIONS
CP Refers to corporal punishment
HLM Refers to hierarchical linear models
HOME Refers to the Home Observation Measures of the Environment instrument (Caldwell & Bradley, 1984) designed to assess daily routines and activities within the home environment
HS Refers to high school when referring to primary caregiver’s level fo education
NICHD Refers to a 2004 study by the National Institute of Child Health and Development Early Child Care Research Network
PC Refers to primary caregiver of the child
PC-CTS Refers to the Parent-Child Conflict Tactics Scale (Straus & Hamby, 1997; Straus, Hamby, Finkelhor, Moore, & Runyan, 1998). This instrument is intended to measure psychological and physical maltreatment and neglect of children by parents, along with the use of nonviolent alternatives.
PHDCN Refers to the Project on Human Development in Chicago Neighborhoods, an interdisciplinary study of how parents, schools, and neighborhoods affect child and adolescent development. Data from the longitudinal cohort study component of the PHDCN was used for the present study.
10
Abstract of Thesis Presented to the Graduate School of the University of Florida in Partial Fulfillment of the
Requirements for the Degree of Master of Arts
EXPLORING THE ASSOCIATION BETWEEN CORPORAL PUNISHMENT AND TODDLERS’ DEVELOPMENTAL TRAJECTORIES OF PHYSICAL AGGRESSION
By
Kristin A. Bell
May 2010
Chair: Chris L. Gibson Cochair: Ronald L. Akers Major: Criminology, Law, and Society
Both early childhood physical aggression and the parental use of corporal
punishment have been linked to numerous negative outcomes, including internalizing
and externalizing behavior problems. While these two constructs have been linked to
similar outcomes, there is also a well-established link between corporal punishment and
aggressive behavior. It has been hypothesized that experiencing more frequent or
more severe forms of corporal punishment leads to more negative outcomes. Social
learning theorists argue that corporal punishment models aggressive behavior for
children. The link between corporal punishment and aggression has been made,
however, using primarily cross-sectional and/or retrospective techniques.
Developmental researchers have examined physical aggression longitudinally,
usually identifying three or four trajectories of aggressive behavior, with one group
exhibiting persistently aggressive behavior over time. They assert that aggressive
behavior begins earlier than modeling would have an impact. Despite the potential link
between them, the bodies of research examining the development of aggressive
behavior and the use of corporal punishment have been largely distinct.
11
This thesis examines the association between corporal punishment and
trajectories of aggressive behavior. Data from the Project on Human Development in
Chicago Neighborhoods is used to construct group-based trajectories. Two different
measures of physical aggression both identify four trajectory groups: a low-stable group,
a low-rising group or a modest group, a high-starting desisting group, and a high-rising
group. The trajectories identified are consistent with existing developmental research.
Multinomial logistic regression was attempted with several control variables, but due to
a very small number of cases in the high-rising aggression groups, the models were
oversaturated. Group profiles were created as an alternative method of examining the
potential association of corporal punishment with trajectory group membership.
Children in the high-rising aggression group were more likely to be male, black or
Hispanic, and to experience less warmth and more hostility from their primary
caregivers. These characteristics of the high aggression group are consistent with
previous research. The results of the present research indicate that the average
frequency of corporal punishment was higher in the high aggression group.
Significance tests performed for differences between the high-rising group and other
groups on these measures were statistically significant. Regarding type of corporal
punishment, those children who were in the high aggression group experienced more
slapping or spanking and pushing, grabbing, or shoving by their primary caregivers than
children in other groups. These results were also statistically significant. Although a
functional relationship could not be established here, the results of the present study
support additional research examining both frequency and type of corporal punishment
as predictors of membership into a persistently high group of physical aggression.
12
CHAPTER 1 INTRODUCTION
Early childhood physical aggression and parental corporal punishment have both
been identified by psychologists, sociologists, and criminologists as risk factors for
many negative developmental outcomes, including violence and aggression in
adolescence and adulthood, physical and mental health problems, and criminal activity
(Cote, Vaillancourt, LeBlanc, Nagin, & Tremblay, 2006; Gershoff, 2002; Hicks-Pass,
2009; Larzelere, 1996; Nagin& Tremblay, 1999; Nagin& Tremblay, 2001; Tremblay et
al., 2004). Broadly defined, the term aggression implies harm done with malevolent
intent (Hay, 2005). Physical aggression, which refers to physical acts that are directed
at another person and that can potentially be harmful, is distinguished from other types
of aggression, such as instrumental aggression (toward objects) and indirect or
relational aggression such as rumor spreading (Cote et al., 2006). Corporal punishment
has been defined as “the use of physical force with the intention of causing a child to
experience pain, but not injury, for the purposes of correction or control of the child’s
behavior” (Straus, 1994). The relationship between parental use of corporal
punishment and physical aggression in young children has been a topic of longstanding
debate among parents, teachers, researchers, and policy makers.
While researchers have examined both the developmental origins of aggression
in children (Nagin & Tremblay, 1999; 2001; Tremblay et al., 2004; Tremblay & Nagin,
2005) and negative outcomes associated with the use of corporal punishment (see
Gershoff, 2002), assessing how the use of corporal punishment on toddlers influences
their developmental trajectories of physical aggression is a relatively unexplored area of
empirical inquiry (Grogan-Kaylor, 2005). Developmental researchers assert that
13
aggressive behavior in humans begins as early as infancy and that children learn to
control their aggressive behavior as they develop (Tremblay and Nagin, 2005). Corporal
punishment researchers argue that aggressive behavior is modeled by parents and
imitated by their children (Straus, 1994). Numerous observational studies have
identified a relationship between the use of corporal punishment by primary caregivers
and children’s aggressive behavior (e.g. Gershoff, 2002; Larzelere, 1986). The effects
of corporal punishment have also been examined using longitudinal data, and these
studies show that corporal punishment can predict variation in aggressive behaviors
between children at later stages of development (e.g. Mulvaney & Mebert, 2007) as
well as changes in aggression within individuals over time (Grogan-Kaylor, 2005).
Despite the potential for physical aggression and other negative childhood
outcomes, the use of corporal punishment in the United States remains quite prevalent,
with 94% of parents reporting corporally punishing their child by 3 or 4 years of age
(Straus and Stewart, 1999). More recent studies find that the use of corporal
punishment is extremely common among parents of toddlers, with 29% of parents of 10-
18 month olds and 64% of parents of 19-35 month olds reporting spanking their children
(Regalado, Sareen, Inkelas, Wissow, & Halfon, 2004; Wissow, 2001). Despite the fact
that toddlers are more likely to experience corporal punishment than any other age
group (Gershoff, 2002), research on its use during toddlerhood has been limited (Berlin
et al., 2009). At this age, children are becoming more mobile and autonomous, leading
to an increase in discipline, and the possibility of forming patterns of noncompliance and
aggression (Moffitt, 1993; Sroufe, Egeland, Carlson, & Collins, 2005).
14
While corporal punishment is a common form of parental discipline, it is clear that
all children who experience corporal punishment do not grow up to be violent or
aggressive adults. As mentioned, developmental researchers (Tremblay and Nagin,
2005) have emphasized that aggression begins at such young ages that it occurs
before modeling would have an impact. In studying trajectories of aggressive behavior
in children, Tremblay and Nagin (2005) have hypothesized that children learn to control
their aggressive behaviors over time, rather than learning to exhibit these behaviors by
modeling others. The argument made by Tremblay and Nagin (2005) is that if models of
physical aggression have an impact, it is probably by reducing the speed at which
children learn not to physically aggress. They cite a number of potential causes for the
individual differences in frequencies of physical aggression, including environmental
differences and parental care (Tremblay and Nagin, 2005). Tremblay and Nagin have
identified three to four trajectory groups, with one group exhibiting persistently high
levels of aggressive behavior. The trajectories indicate that despite an increase in
children’s exposure to aggressive behaviors as they grow older, the likelihood that they
will exhibit aggressive behavior generally decreases.
Using prospective longitudinal data on toddlers from the Project on Human
Development in Chicago Neighborhood (PHDCN), the first objective of this thesis is to
use semi-parametric group-based trajectory models to essentially replicate the work of
Tremblay, Nagin, and colleagues by identifying distinct trajectories of aggressive
behavior in toddlers over a seven-year period (see Nagin, 2005). The second objective
is to understand how the use of corporal punishment is associated with group
membership in these aggression trajectories. To date, no study has examined the
15
association between corporal punishment and group-based trajectories of toddlers’
physical aggression into mid-childhood. Given the research on corporal punishment
and developmental trajectories of aggression, I hypothesize that those children who
experience more frequent and certain types of corporal punishment (as opposed to
customary spanking) are not learning to control their aggressive behavior and are
among those individuals in the group that exhibits the most persistent physical
aggression. I address the following question: Are the frequency and type of corporal
punishment experienced during toddlerhood associated with membership in certain
trajectory groups? Specifically, are the frequency and type of corporal punishment
associated with membership into what Nagin and Tremblay have identified as a “high
chronic” group for aggressive behavior?
16
CHAPTER 2 LITERATURE REVIEW
An Overview of Corporal Punishment
Despite the breadth of research on the parental use of corporal punishment, a
consensus on its effects has yet to be reached (see Gershoff, 2002). Researchers from
a variety of fields have investigated the potential effects of corporal punishment on a
wide range of both short-term and long-term outcomes for those who experience it.
These outcomes include compliance of the child, aggressive and antisocial behaviors,
quality of the parent-child relationship, cognitive and emotional outcomes, and
becoming a victim or perpetrator of physical abuse (e.g. Berlin et al., 2009; Gershoff,
2002; Paolucci & Violato, 2004; Simons, Johnson, & Conger, 1994; Smith and Brooks-
Gunn, 1997; Straus, 1994; Straus, Sugarman, & Giles-Sims, 1997). While this project
focuses on one outcome in particular, physical aggression, it is important to provide an
overview of corporal punishment and its potential consequences.
As described above, Straus (1994) has defined corporal punishment as “the use
of physical force with the intention of causing a child to experience pain, but not injury,
for the purposes of correction or control of the child’s behavior”. Many researchers view
corporal punishment as one point on a continuum of physical acts against children (e.g.
Gelles & Straus, 1988). Several state laws similarly include qualifiers such as
“excessive”, “cruel”, and “unreasonable” to distinguish everyday spanking from
definitions of child maltreatment (Gershoff, 2002). A common criticism of the
measurement of corporal punishment in social science research is that non-abusive
corporal punishment is often confounded with behaviors that may be considered child
abuse, thereby preventing accurate conclusions regarding non-abusive physical
17
punishment (Larzelere, 2000; Baumrind, 1996). Due to its wide acceptance, and for the
purpose of comparisons across studies, Straus’s (1994) definition will be used in the
present study. His operationalization includes three corporal punishment items:
slapping or spanking the child with an open palm, pushing, grabbing, or shoving the
child, and throwing something at the child. Another measurement issue discussed in
the corporal punishment literature is reliance on retrospective reports by either the child
or parent. As direct observation is impossible in most cases, corporal punishment
studies have typically relied on these forms of self-report (Gershoff, 2002). Some
studies have utilized nightly phone calls (Holden, Coleman, & Schmidt, 1995) or
detailed daily discipline dairies (Larzelere & Merenda, 1994) to increase validity, but
these techniques have not been common. Measurement for the current study will be
defined in more detail in later sections.
Gershoff (2002) cites that corporal punishment is viewed as most appropriate for
children of preschool age and least appropriate for infants and children 5 years of age
or older. Researchers of corporal punishment have hypothesized that its effects may
differ depending on the age of the child (Gershoff, 2002; Larzelere, 1996; Paolucci &
Violato, 2004). Straus (1994) has argued that the effect of corporal punishment on
violent behavior is greatest when used with adolescents. His hypothesis is that the
adolescent and teenage years involve the development of autonomy and a transition to
adulthood; corporal punishment may stand in the way of identity formation,
independence, and moral development (Straus, 1994). Contrary to this hypothesis,
others have asserted that corporal punishment may have the greatest impact during
toddlerhood (Berlin et al., 2009), as this is the period at which it is most likely to be
18
used. Toddlerhood is characterized by an increase in mobility and autonomy seeking,
which will naturally lead to an increase in discipline. As cited above, the use of corporal
punishment at this age may result in patterns of noncompliance and the development of
externalizing behavior problems (Berlin et al., 2009). It may also be particularly
important to study corporal punishment in young children due to the possibility for
cumulative effects over time.
Research on the associations between corporal punishment and children’s
behavioral outcomes has been summarized in several meta-analytic studies (Gershoff,
2002; Larzelere 1996; Larzelere and Kuhn, 2005; Paolucci and Violato, 2004). As
mentioned, the evidence regarding the effects of corporal punishment is somewhat
conflicting. While both negative and positive outcomes have been found for children
who experience corporal punishment, the research has been replete with
methodological flaws. Larzelere (1996) addresses these flaws in his early meta-
analysis. He examined 35 published articles that included at least one measure of non-
abusive or customary physical punishment. The author defined an outcome as
beneficial if physical discipline significantly predicted a desirable outcome in the child
(such as immediate compliance). Similarly, an outcome was defined as detrimental if
physical punishment significantly predicted a negative outcome (such as low self-
esteem or an increase in delinquency) for the child. Of the 35 articles, 9 found primarily
beneficial child outcomes, 12 found predominantly detrimental outcomes, and 14 found
neutral outcomes.
Larzelere (1996) found that several factors, including the age of the child and
measurement of physical punishment, differentiated studies with beneficial as opposed
19
to detrimental outcomes. The meta-analysis indicated that studies including
adolescents and teenagers were more likely to report detrimental outcomes. He also
found that certain measurement characteristics were more likely to be associated with
beneficial outcomes, including discriminating between abusive and non-abusive
physical punishment, controlling for pre-existing differences on child outcome variables,
and taking family characteristics and parental variables into account. Prospective
studies were also more likely to be associated with neutral or beneficial outcomes
compared to retrospective studies (Larzelere, 1996). Larzelere (1996) also found
evidence that less frequent and less severe forms of corporal punishment are more
likely to be associated with beneficial or neutral outcomes compared to negative
outcomes. He concluded his meta-analysis by stating that how parents use a given
disciplinary technique is probably more important than which disciplinary technique they
use (Larzelere, 1996). This hypothesis is supported in a later meta-analysis comparing
the use of physical punishment and alternative disciplinary tactics (Larzelere & Kuhn,
2005). Larzelere and Kuhn (2005) found that only overly severe or a predominant use
of physical punishment compared unfavorably with other disciplinary techniques,
indicating that it is important to examine the frequency and severity of corporal
punishment used.
Gershoff’s (2002) meta-analysis included 88 studies spanning 62 years (1938-
2000). To be included in the meta-analysis, the operationalization of corporal
punishment was required to meet Straus’s definition. Gershoff examined the effect of
corporal punishment on several outcomes, including short-term and long-term, direct
and indirect, and individual-level and relationship-level constructs. Among the
20
behaviors and experiences that are included are children’s immediate compliance,
moral internalization, aggression, delinquent, criminal, and antisocial behavior, mental
health, and risk of injury as a victim of physical abuse. Associations between corporal
punishment and long-term outcomes were also examined for aggression, delinquent,
criminal, and antisocial behavior, mental health, and adult abuse of one’s own children
or spouse. Twenty-seven studies included in the analysis measured constructs in
adulthood. Gershoff also included quality of the parent-child relationship. The age of
the target children in the samples of the studies ranged from 1 to 16 years; however,
only 25 of the 88 studies included children aged 5 years of age or younger and only 12
of the studies included children aged three years of age or younger. It is clear that the
majority of these corporal punishment studies have focused on an age-group of
adolescents or teenagers, rather than toddlers and younger children.
The results of Gershoff’s meta-analyses for each of these constructs indicate that
corporal punishment is significantly associated with all outcomes discussed; however,
all but one of the associations are undesirable. According to Gershoff (2002),
immediate compliance is the only desirable behavior with which corporal punishment is
associated. Specifically relevant to the current research, which will examine longitudinal
data and trajectories of behavior over time, is Gershoff’s finding that parental corporal
punishment is associated with both increased aggression in children and increased
aggression as an adult. Additionally, Gershoff (2002) found that the mean age of the
sample partially moderated the effect of corporal punishment on aggression, with the
effect size for the middle school age group (10-12 years) being larger than that of the
preschool (1-5 years), grade school (6-9 years), or high school (13-16 years) age-
21
groups. Again, it is important to note that less than one-third of the studies included in
Gershoff’s (2002) analysis examined children five years of age or younger.
Contrary to the evidence provided by Gershoff’s (2002) study, the meta-analysis
of Paolucci and Violato (2004) does not present results indicating negative outcomes for
children who experience corporal punishment. This meta-analysis included 39 studies
of children 12 years of age or younger and 18 studies of adolescents. Paolucci and
Violato (2004) included a total of 70 studies published between 1961 and 2000 and
examined affective, cognitive, and behavioral outcomes. Affective outcomes included
psychological damage, low self-esteem, fear, low empathy and reaction levels,
narcissism, distress, depression, and anxiety. Cognitive outcomes consisted of
academic impairment or performance, suicidal ideations, attitudes toward violence and
punishment, and pro- or anti-spanking attitudes. The behavioral outcomes examined in
Paolucci and Violato’s (2004) meta-analysis included fighting, disobedience, resistance
or compliance, aggression, alcohol abuse, child abuse, spousal assault, antisocial
behaviors, communication, apprehension, marital conflict, conduct disorder symptoms,
oppositional defiant symptoms, externalizing behaviors, hyperactivity, peer conflict, and
social skillfulness.
The effect sizes for affective and behavioral problems in this meta-analysis were
very small, leading the authors to conclude that people who have experienced corporal
punishment are at a slight risk for these types of outcomes. The effect size for cognitive
problems was zero (Paolucci & Violatto, 2004). Due to a lack of data available in most
of the studies included, the authors were unable to examine the potential of any
moderator variables, including age at which corporal punishment was experienced and
22
the frequency with which it was used. They acknowledge, however, that for some levels
of such moderators (at certain ages or high frequencies), the small effect size observed
in their meta-analysis may be large (either positive or negative).
As noted by Larzelere (1996), the results of research on the effects of corporal
punishment have been influenced by several methodological factors. The measures of
corporal punishment used (and whether they are confounded with abusive behaviors)
and the inclusion of moderating variables, such as child’s age, have been shown to
impact the results. Along with Gershoff (2002), Paolucci and Violatto call for the
inclusion of potential moderating variables as essential in data collection and research
on corporal punishment. As do Larzelere (1996) and Larzelere and Kuhn (2005),
Paolucci and Violatto (2004) highlight the importance of the frequency and severity of
physical punishment. Although the present study does not directly examine age of the
child as a potential moderator for the effects of corporal punishment, it will focus on an
age group (toddlers) that has rarely been included in the corporal punishment literature
and look at effects over time. It will also examine the effect of the frequency and type of
corporal punishment on developmental paths of aggression.
Corporal Punishment and Externalizing Behavior Problems
While a growing body of research on corporal punishment examines its
unintended negative outcomes, the strongest link may be between corporal punishment
and externalizing behaviors (Mulvaney and Mebert, 2007). Although internalizing
behaviors, such as depression, self-esteem, and cognitive impairment, have also been
associated with parental use of corporal punishment, externalizing behaviors, especially
aggression, are of particular concern to researchers. Receiving harsh physical
23
punishment as a child has been associated with childhood aggression, aggression later
in life, and violence toward one’s own spouse and children as an adult (Berlin et al.,
2009; Cohen, Brook, Cohen, Velez, & Garcia, 1990; Straus, 1994; Gelles, 1974; Stacks,
Oshio, Gerard, & Roe, 2009). Numerous studies have linked parental use of corporal
punishment to aggressive behavior in children (Berlin et al., 2009; Eron, Huesman, &
Zelli, 1991; Larzelere, 1986; Sears, Maccoby, & Levin, 1957; Stacks, Oshio, Gerard, &
Roe, 2009; Strassberg, Z., Dodge, K.A., Pettit, G.S., & Bates, J.E., 1994; Straus, 1994;
Straus, Sugarman, & Giles-Sims, 1997). If spanking and other legal forms of corporal
punishment can be causally linked to aggressive behavior, tremendous policy
implications would arise.
To better understand the link and potential causal effects of corporal punishment
on children’s externalizing behaviors, a review of the extant literature and its limitations
is necessary. Although this review will include studies specific to physical aggression,
externalizing behaviors will be generally discussed, due to a lack of distinction between
these two concepts in prior research.
Early studies of corporal punishment on aggressive behavior of children (e.g.
Larzelere, 1986) employed cross-sectional, correlational methods in their analyses.
The lack of longitudinal studies on the effects of corporal punishment is evident in
Gershoff’s (2002) meta-analysis; again, only 12 of the 88 studies included in her
analysis were longitudinal in nature. As is the case with most areas of research
employing cross-sectional and correlational methods, these techniques have been
largely criticized, as additional variables may be responsible for the observed
relationship between corporal punishment and aggressive behavior.
24
Straus et al. (1997) attempted to deal with criticisms of the correlational studies
by controlling for prior levels of the outcome of interest, thereby allowing more direct
causal conclusions to be drawn regarding the relationship between corporal punishment
and antisocial behavior in children. Even when controlling for previous levels of
antisocial behavior, the researchers found that the more spanking experienced at the
start of the study, the higher the level of antisocial behavior two years later. The
authors conclude that the change in antisocial behavior is unlikely to be due to a
predisposition towards antisocial behavior or to confounding with demographic
characteristics, as these variables were statistically controlled (Straus et al., 1997).
An approach similar to, but more rigorous than, that of Straus et al. (1997) has
been to conduct prospective longitudinal studies using multiple waves of data to
examine a change in the behavior of interest (Berlin et al., 2009; Simons, Johnson, &
Conger, 1994; Mulvaney & Mebert, 2007). For instance, Mulvaney and Mebert (2007)
used data from a multisite, longitudinal study to examine the impact of corporal
punishment on children’s internalizing and externalizing behavior problems. In an
attempt to address previous criticisms of the corporal punishment research, Mulvaney
and Mebert (2007) tried to strengthen their study by using a measure of the presumed
causal variable (corporal punishment) assessed prior to the outcome variables of
interest. They also used a prior assessment of the respective outcome variable,
internalizing or externalizing behavior problems, as a statistical control.
The researchers used two sets of hierarchical multiple-regression models. The
first set of models assessed the impact of CP in infancy and toddlerhood by examining
the associations between the 15-month CP variable and the 36-month internalizing and
25
externalizing behavior scores. Secondly, the associations between internalizing and
externalizing behavior problems in the first grade and a composite CP variable
(constructed from the 36-and 54-month assessments) were examined. Results indicate
that corporal punishment was associated with both increased internalizing and
externalizing behavior problems from 36 months of age to first grade. Although the
examination of multiple waves of data allows researchers to control for the temporal
ordering of events and to examine the relative change and stability in a behavior of
interest, it does not allow for the examination of a developmental path.
Berlin et al. (2009) also examine the outcomes of corporal punishment on young
children. This study is important to the corporal punishment literature, as it focuses on
toddlers and is the first to use cross-lagged path models. These models attempt to
disentangle directionality by simultaneously estimating effects of parental discipline on
child behaviors and vice versa (Gershoff & Bitensky, 2007). It has been suggested that
parental disciplinary techniques may be elicited by child behaviors and, conversely, that
parental disciplinary techniques drive child outcomes (Gershoff, 2002).
The sample for the Berlin et al. (2009) study was obtained from the Early Head
Start National Research and Evaluation Project and contained white, African-American,
and Mexican-American toddlers. The mothers were interviewed when the children were
approximately 1, 2, and 3 years of age, allowing the researchers to include 3 waves of
data. Corporal punishment was measured by asking the mothers if they or anyone else
in the household had spanked the child in the past week, and if so, how often. The
outcome variable of aggressive behavior was measured using the Child Behavioral
Checklist (Achenbach & Rescorla, 2000). Berlin et al. (2009) found that child fussiness
26
at age 1 predicted spanking at all three ages. The analyses of cross-lagged path
models indicated that spanking at age 1 predicted aggressive behavior at age 2, but
aggressive behavior did not predict later spanking. While the researchers were able to
examine the existence of reciprocal effects with this technique, they were not able to
capture intra-individual or intra-group change.
The use of hierarchical linear models (HLM) is one method that can be used to
examine the effect that a set of independent variables has on within-individual change in
an outcome variable over time. This technique has recently been employed by Grogan-
Kaylor (2005) to examine the functional form of the relationship between corporal
punishment and antisocial behavior, and it may be the only study to date that has
examined the effect of corporal punishment on intra-individual changes in an
externalizing behavior. He used data from five waves of the National Longitudinal
Survey of Youth (from 1988 to 1998). The antisocial behavior subscale of the behavior
problems index (BPI) was used as the measure of antisocial behavior. The measure of
corporal punishment was derived from a question on the home observation measures of
the environment (HOME) instrument asking the mother how many times she has
spanked the child in the past week. This study sought to determine whether there were
differences in the initial level of antisocial behavior and also to answer the question of
whether corporal punishment had a relationship with the rate of growth of children’s
antisocial behavior.
The hierarchical linear models employed by Grogan-Kaylor (2005) allowed for an
analysis of the effects that a set of independent variables has on the growth trajectories
of the dependent variable of interest (antisocial behavior). Results indicated a clear
27
effect of the use of corporal punishment on the initial level of antisocial behavior.
Children who experienced higher levels of corporal punishment exhibited higher levels
of antisocial behavior than children who did not receive corporal punishment; however,
the effect of the use of corporal punishment on antisocial behavior was not significantly
different for children who entered the study with higher or lower levels of the behavior
initially. To test whether corporal punishment had an impact on the rate of growth of
children’s antisocial behavior, the researcher created an interaction term between
corporal punishment and age, which was significant and implied a greater effect of
corporal punishment on antisocial behavior for older children. Overall, Grogan-Kaylor
(2005) concludes that these results indicate that parental use of corporal punishment is
associated with increases in children’s antisocial behavior.
While this study is possibly the first to examine corporal punishment’s effects on
externalizing behaviors from a developmental perspective, it is not without its limitations.
One of the major limitations of the use of HLM for the examination of behaviors such as
antisocial behavior or aggression is that this technique assumes that individuals follow a
process that increases or decreases over time in the general population. It is designed,
therefore, to sort out factors accounting for variation about a population mean (Nagin,
2005). It is impractical, however, to assume a continuous distribution function for
certain behaviors that are not the “norm” in the population. A more detailed discussion
of the limitations of such techniques is discussed within Chapter 4 of this thesis. An
additional limitation of Grogan-Kaylor’s study is the measure of corporal punishment, as
it asks about a short period of time and does not capture frequency or severity.
28
Theoretical Explanations of the Relationship between Corporal Punishment and Aggression
The potential link between the experience of corporal punishment and aggressive
behavior in children is guided by criminological theory. A brief overview of possible
theoretical explanations is given in this section, although the present study is not a test
of any particular one. All three of these theories could perhaps provide a mechanism as
to why we would expect to observe an association between corporal punishment and
aggressive behavior.
One well-established theoretical explanation for the link between violence in the
family (including corporal punishment) and aggressive behavior is that of social learning
(Akers, 1985; Gelles, 1982; Straus, R., Gelles, R., & Steinmetz, S., 1980; Straus, 1994).
Specifically, it has been hypothesized that children imitate the aggressive behavior
modeled by their parents’ disciplinary strategy. Extending other aspects of Akers’ social
learning theory (see Akers et al., 1979; Akers, 1985) it can be argued that the
experience of corporal punishment also occurs within the intimate group of the family
(differential association), leads to definitions favorable to aggressive behavior, and
leads to vicarious reinforcement (Akers, 1985).
Although they do not specifically discuss the effect of corporal punishment on
aggressive behavior, Tremblay and Nagin (2005) state that they argue against a social
learning theory of aggression. They assert that a social learning hypothesis argues that
a human who has never witnessed physical aggression in his life could not use physical
aggression (even under such circumstances as experiencing extreme anger) because
he would not have learned to physically aggress. Tremblay and Nagin (2005) indicate
that children do not need to have seen models of physical aggression in order to start

29
engaging in the behavior themselves. Developmental studies have shown that most
humans have used physical aggression before 36 months of age, that the use of
physical aggression is most common between 18 and 42 months of age, and that if
humans are learning to physically aggress through imitation, it is happening within the
first two years of life (Tremblay et al., 1999; Tremblay and Nagin, 2005). Tremblay and
Nagin (2005) argue that instead of learning to physically aggress, modeling most likely
affects the speed at which children learn not to exhibit physical aggression.
The above argument of Tremblay and Nagin further coincides with two concepts.
First, the authors acknowledge that children are more likely learning not to exhibit
aggressive behavior, rather than learning to engage in aggression. Akers’ (Akers et al.,
1979) social learning theory states that the same learning process produces both
conforming and deviant behavior. Since controlling aggressive behavior, or not
engaging in it, is viewed as conforming behavior, that is non-aggressive action and
Tremblay and Nagin’s (2005) argument would indeed be compatible with a social
learning theory of aggression.
Second, Tremblay and Nagin (2005) discuss learning to “control” aggressive
behavior, which is also compatible with Gottfredson and Hirschi’s (1990) general theory
of crime, or self-control theory. The basic premise of this theory is that the lower one’s
self-control, the greater his or her involvement in criminal behavior and acts analogous
to crime. Gottfredson and Hirschi (1990) argue that self-control is developed at a young
age, identifying the major cause of low self-control as ineffective child-rearing. In order
for self-control to form, parents must be concerned for their child’s welfare, monitor their
child’s behavior, recognize deviant behavior when it occurs, and correct such behavior.
30
Gottfredson and Hirschi (1990) assert that the results of these parenting conditions
include a child more capable of delaying gratification, more willing to accept restraints
on his activity, and less likely to use force or violence to obtain what he wants. On the
other hand, hostile and ineffective parenting will result in low self-control. The authors
also argue that self-control remains relatively stable over the life-course. These
contentions of self-control theory would appear to coincide with the trajectories of
aggressive behavior that have been found by developmental researchers; as previously
mentioned, the majority of children decline in their level of aggression between
childhood and adolescence, with the exception of a “persistently aggressive” group.
According to Gottfredson and Hirschi’s theory, this group showing persistently
aggressive behavior would most likely contain individuals exposed most frequently to
erratic parental disciplining practices, including corporal punishment.
Agnew’s general strain theory is another alternate explanation for the relationship
between the experience of corporal punishment and aggressive behavior. The main
assertion of general strain theory is that the experience of strain, including negative
treatment by others, leads to an increase in negative emotions such as anger and
frustration, which lead to crime (Agnew 2001; 2006). Agnew (2006) states that not all
strains result in crime and antisocial behaviors, providing the example of consistent and
fair parental discipline. According to Agnew (2006), while children or juveniles may not
like such discipline, research has shown that it reduces the likelihood of crime.
Alternatively, Agnew also identifies parental supervision that is erratic, excessive, or
harsh and child abuse and neglect as strains likely to cause crime. A clear connection
can be made between corporal punishment and aggression if the experience of being
31
corporally punished is viewed as negative or unfair treatment. The resulting anger and
frustration may be exhibited through aggressive behaviors.
Developmental Studies of Aggression
A crucial component of the present study involves group-based trajectory
modeling of aggressive behavior. Some of the most influential research on the
development of childhood behavioral problems has assessed how they may follow
different developmental pathways of physical aggression (Nagin & Tremblay, 1999;
2001; Tremblay et al., 2004). Tremblay and Nagin (2005) criticize the criminological
literature for largely neglecting individuals before the start of adolescence because they
cannot yet be considered delinquent. They cite that research on the age-crime curve
has indicated that violent offenses appear in pre-adolescence, increase sharply during
adolescence, and then decrease slowly (Blumstein et al., 1986). However, research
has shown that problematic levels of aggressive behavior in adolescence and adulthood
can be identified in the preschool years (Keenan & Wakschlag, 2000).
Nagin and Tremblay have explored the origins of antisocial behavior by
examining both trajectories of aggression in very young children (before school-age)
and from early childhood through adolescence. Most parents report that their child has
used some type of physical force to get what they want by 17 months of age (Tremblay
& Nagin, 2005). Two different patterns of physical aggression trajectories have been
identified, depending on the developmental period studied. Research has shown that
levels of physical aggression increase during the preschool years (Tremblay et al.,
2004), followed by a decline from preschool to adolescence (Nagin & Tremblay, 1999;
NICHD Early Child Care Research Network, 2004). In most cases, several waves of
data collection (four to seven) have been used to model these developmental
32
trajectories. Most studies of group-based modeling of physical aggression have
resulted in three or four distinct trajectory groups.
Tremblay et al. (2004) sought to identify the trajectories of physical aggression
during early childhood and antecedents of high levels of physical aggression early in
life. A sample of 504 children was followed from 5 to 42 months of age, with data
collection at 5, 17, 30, and 42 months. Physical aggression was measured using a
three-item scale. Mothers indicated how often (never, sometimes, or often) the child
“hits, kicks, or bites”, “fights”, and “bullies” others. Using a semi-parametric group-
based mixture model, three distinct groups of physical aggression trajectories were
identified which best fit the data. The first cluster identified children who exhibited little
or no physical aggression and comprised approximately 28% of the sample. A second
group followed a rising trajectory of modest aggression and contained approximately
58% of the sample. The third and smallest group displayed a rising trajectory of high
physical aggression and contained only about 14% of the sample. Additionally,
predictors for membership in the high physical aggression group were identified both
before or at birth and at 5 months of age. The best predictors before or at birth were
having young siblings, mothers with high levels of antisocial behavior before the end of
high school, mothers who started having children early, families with low income, and
mothers who smoked during pregnancy.
Interestingly, the best predictors at 5 months of age were mother’s coercive
parenting and family dysfunction. It is important to note that the measure of coercive
parenting included items relevant to the current study, including spanking the infant;
however, corporal punishment was not specifically assessed. The authors
33
acknowledge that the two 5 month predictors are also both classic predictors of
antisocial behavior in older children and adolescents. They discuss the strong impact of
these variables as possible causal factors in aggressive behavior; not only are they
occurring as early as the first year of life, but they are also likely to remain part of the
child’s environment throughout childhood and adolescence (Tremblay et al., 2004).
Cote et al. (2006) extend this research by examining the development of physical
aggression from toddlerhood to pre-adolescence, also identifying risk factors
distinguishing between typical and atypical patterns of this behavior. Ten cohorts of
approximately 1000 children each were drawn from a nationally (Canadian)
representative sample. The seven key age groups included in the sample were 0-11
months, 1 year, 2-3 years, 4-5 years, 6-7 years, 8-9 years, and 10-11 years. The
measure of physical aggression for this study was similar to Tremblay et al (2004). This
analysis also identified three trajectory groups, including a “low-desisting trajectory”
(31.3% of the sample), which exhibited infrequent use of physical aggression in
toddlerhood and practically no physical aggression by pre-adolescence; a “moderate-
desisting trajectory” (52.2% of the sample), which was characterized by occasional use
of physical aggression in toddlerhood, but low levels of physical aggression in pre-
adolescence; and a “high-stable trajectory” (16.6% of the sample), which reflected high
physical aggression over time. Unlike previous studies examining similar age ranges
(Kingston & Prior, 1995; Munson et al., 2001), Cote et al. (2006) did not identify a
trajectory group with rising rates of aggression. The authors attribute this divergence to
methodological differences; Cote et al. (2006) did not include a range of externalizing
34
behaviors in their operationalization of aggressive behavior, but focused solely on
physical aggression.
The authors conclude that a typical developmental trajectory of aggression is one
characterized by occasional, and then declining, levels of physical aggression. As did
Tremblay et al. (2004), they examine predictors of group membership for the “high-
stable” or atypical group. Results indicate that this group has the highest prevalence of
family risk characteristics, including low income, early motherhood, low maternal
education, and a separated family. This group also possessed the highest scores on
measures of hostile parenting and family functioning. Hostile parenting was measured
using items reflecting how often the parent becomes annoyed with the child’s behavior,
gets angry and punishes the child, and feels ineffective at managing the child’s
behavior. A scale of items examining the quality of communication, problem resolution,
control of disruptive behavior, and giving and receiving affection was used as a
measure of family functioning.
These two studies are not the only ones to identify coercive and hostile parenting
styles as predictors of membership in a “high-stable” aggression group. A study funded
by the National Institute of Child Health and Human Development (NICHD) Early Child
Care Research Network (2004) similarly found that along with poverty, low maternal
education, and single-parenting, less sensitive and involved parenting were also
associated with more stable trajectories of physical aggression.
In a study examining three problem behaviors in an older, all male sample, Nagin
and Tremblay (1999) identified four developmental trajectories. The researchers
examined physical aggression, opposition, and hyperactivity separately, as they argue
35
that previous research has confounded measures of these other behaviors with physical
aggression. One of the goals of this study was to examine delinquent outcomes, and
the authors argued that confounding the problem behaviors would provide poor
predictions regarding the effects of the behaviors on delinquency. The sample included
1037 boys, who were rated by their teachers on the problem behaviors at age 6 and
annually from age 10 to 15. Participants additionally self-reported their delinquency at
15, 16, and 17 years of age. The trajectories identified for the three externalizing
behaviors were very similar, although boys who followed a particular trajectory for one
behavior did not necessarily follow the same trajectory for the other two types of
behavior. There was a group of “lows” who rarely displayed the problem behavior to
any notable degree (about 15-25% of the sample); a group of “moderate-level desisters”
who initially displayed moderate levels of the problem behavior, but desisted by age 10-
12 (about 50% of the sample); a group of “high-level near desisters” who started off
scoring relatively high on the problem behavior, but by age 15 scored far lower (about
20-30% of the sample); and a group of “chronics” who began by scoring high on the
problem behavior and continued to score high over time.
As mentioned, the second stage of this project examined delinquent outcomes,
including physical violence, serious delinquency (including some, but not all violent
items), and theft, for the different trajectories. The strategy examined whether physical
aggression added significant explanatory power to the model already including
opposition and hyperactivity, and whether those two behaviors continued to provide
independent explanatory power after controlling for aggression. Results indicated that
physical aggression seemed to be a distinct predictor of self-reported physical violence
36
and serious delinquency, but not theft. In a follow-up to their 1999 study, Nagin and
Tremblay (2001) used the same sample of boys to identify early predictors of physical
aggression trajectories. The only characteristics that distinguished between
membership in the “persistently high” over the “high-declining” group were mothers’ low
education level and teenage onset of childbearing. As discussed above, more recent
studies have included not only characteristics of the parents, but also variables related
to parenting styles (Cote et al., 2006; Tremblay et al., 2004).
While parenting styles and family functioning have been included in some
research on developmental trajectories of physical aggression, the use of physical
discipline or corporal punishment has not been specifically assessed. At least some of
the parenting measures used in previous studies have included spanking items as one
item in a scale (Tremblay et al., 2004), however, there have not been any studies
directly examining the impact of parental corporal punishment on trajectory group
membership for physical aggression. Additionally, an overall lack of longitudinal
studies relating corporal punishment to physical aggression (see Gershoff, 2002)
indicates that this area of research is needed. Although exploratory in nature, this
thesis attempts to add to the literature and fill a gap in the current research.
Significance of Current Research
The major goal of this study is to examine the association between corporal
punishment and aggressive behavior in a sample of toddlers, while addressing some
methodological shortcomings of prior research. First, a significant amount of research
on the outcomes of corporal punishment has focused on samples of adolescents,
ranging from about 10 to 14 years of age. Corporal punishment, however, is viewed as
37
most appropriate for children of preschool age (Gershoff, 2002), making it imperative to
examine this age group. Although there has been some research on corporal
punishment’s effects on toddlers’ behavior, the literature in this area has focused
primarily on the prevalence and predictors of corporal punishment (Regalado et al.,
2004; Socolar & Stein, 1995; Wissow, 2001). The present study will examine the
association between corporal punishment and aggressive behavior for a sample of
toddlers, ranging from approximately two to four years at the beginning of the
assessment period.
Secondly, it has been widely recognized that certain factors relating to the use of
corporal punishment may impact its effects (Gershoff, 2002; Larzelere,1996; Larzelere
& Kuhn, 2005; Paolucci & Violatto, 2004). The first factor is the frequency with which
corporal punishment is used. Research has indicated the use of corporal punishment
as a frequent or primary disciplinary tactic may be associated with more detrimental
outcomes (Larzelere, 1996; Paolucci & Violatto, 2004). To address this issue, the
present study will examine the frequency of corporal punishment experienced across
trajectory groups. Similarly, certain types of corporal punishment, such as hitting with
an object, have been identified as more severe than customary spanking and have
been associated with more negative outcomes (Larzelere & Kuhn, 2005; Straus, 1994).
Three types of corporal punishment that have been identified in past research as
varying in severity (Straus, 1994) will be examined across trajectory groups in the
current study. The type of corporal punishment, rather than the severity, will be referred
to here, as a consensus on determining which types of corporal punishment are the
most severe has yet to be reached (Gershoff, 2002).
38
Finally, previous studies in the corporal punishment literature have either used
cross-sectional data or analyzed change in aggression from one wave of data collection
to the next. Prospective longitudinal studies, especially those inclusive of toddlers, have
been rare (Berlin et al., 2009; Mulvaney & Mebert, 2007). Although wave-to-wave data
analysis allows for temporal ordering and measurement of change in the outcome of
interest, it is still based on individual points in time and differences between individuals.
The only study to date that has examined corporal punishment’s effect on intra-
individual change (Grogan-Kaylor, 2005) possesses the limitation of using hierarchical
linear models, which assume a continuous distribution function in the population.
Considering the findings of distinct categories of aggressive behavior, a more
appropriate examination of the impact of corporal punishment on the developmental
paths of children would involve a group-based approach, which instead assumes a
discrete or categorical distribution. This thesis will therefore use semi-parametric group-
based trajectory models to identify trajectories of physical aggression in toddlers and
examine the association between corporal punishment and group membership.
Research Questions and Hypotheses
1. Research question. How many trajectories of physical aggression will be identified and how can these trajectories be described?
Hypothesis. It is hypothesized that developmental trajectories of aggression similar to those established by Tremblay and Nagin (Nagin and Tremblay 1999; 2001; Tremblay et al., 2004) will be identified (either three or four trajectory groups as described above).
2. Research question. Is the frequency of corporal punishment associated with membership in a “chronic high” aggression group?
Hypothesis. It is hypothesized that experiencing higher frequencies of corporal punishment will be associated with membership in a “chronic high” aggression group.
39
3. Research question. Is the type of corporal punishment experienced associated with membership in a “chronic high” aggression group?
Hypothesis. It is hypothesized that experiencing certain types of corporal punishment (other than customary spanking) will be associated with membership in a “chronic high” aggression group.
40
CHAPTER 3 METHODS
Data
Data used for the current study were obtained from the Project on Human
Development in Chicago Neighborhoods (PHDCN), an interdisciplinary study of how
families, schools, and neighborhoods affect the development of children and
adolescents (Earls & Visher, 1997). The two main components of the PHDCN included
an extensive study of Chicago neighborhoods and community conditions and a
longitudinal cohort study, which collected three waves of data from children,
adolescents, young adults, and their primary caregivers between 1994 and 2001.
A three-stage sampling technique was utilized to arrive at the cohorts included in
the PHDCN (Earls & Visher, 1997). First, a stratified probability sample of 80
neighborhoods was collected from the 343 total neighborhood clusters within the city of
Chicago. The neighborhoods were stratified based on racial/ethnic composition and
socio-economic status. Following this step, block groups were randomly selected from
each neighborhood and, within each block group, a complete list of dwelling units was
assembled. The last stage of sampling included in-person screening, in which pregnant
women, children, and young adults within six months of the seven age cohorts (birth (0),
3, 6, 9, 12, 15, and 18 years of age) were identified and asked to participate in the
study. This sampling procedure resulted in over 6,000 randomly selected participants
(Earls & Visher, 1997). The longitudinal cohort study administered multiple
measurements and instruments to tap various aspects of human development. Due to
the present study’s focus on toddlers, only the three-year-old cohort will be examined
here; however, data from all three waves of data collection will be included.
41
As with any longitudinal study, the PHDCN lost participants over time due to
attrition. For the three-year-old cohort, the attrition rate was approximately 17.24% from
wave 1 (n=1003) to wave 2 (n=830) and 8.9% from wave 2 (n=830) to wave 3 (n=756).
Only cases that were present in all three waves of data collection (n=697) were included
in the analysis sample. Finally, an additional 16 cases were dropped due to invalid
responses (such as “I don’t know” or “Interviewer missed”) on the dependent variable
(aggression). The resulting analysis sample included 681 cases.
Demographic characteristics of the analysis sample are very similar to those of
the total sample for the three-year-old cohort. A comparison between these two groups
can be seen in Table 3-1. The analysis sample was almost evenly composed of male
(49.49%) and female (50.51%) children. The sample was predominantly Hispanic
(49.14%) and had a mean age of 3.15 years at the first wave of data collection. The
youngest participant was 1.84 years of age and the oldest participant was 4.91 years of
age at wave 1. Primary caregivers of the children were mostly female (95.30%) with a
mean age of 30.87 years at wave one. The average income of primary caregivers was
between $10,000 and $19,999 per year. Approximately 39.80% had less than a high
school diploma, 14.10% had no education beyond a high school diploma, and the
majority, 46.11%, had some education beyond a high school diploma.
Measures
Dependent Variable
Physical aggression. Physical aggression is measured using items taken from
Achenbach’s (1991;1992) Child Behavioral Checklist (CBCL). Due to the fact that
reduced versions of the CBCL (Earls, Brooks-Gunn, Raudenbush, & Sampson, 1994)
42
were administered as part of the longitudinal cohort study at all three waves of data
collection, not all of the measures widely used by Nagin and Tremblay (Cote et al.,
2006; Nagin and Tremblay, 1999; 2001; Tremblay et al., 2004) were available.
Additionally, the items included in the reduced CBCL varied from one wave of data
collection to the next.
The primary caregiver was asked how often the child participates in the
aggressive behaviors and responses were indicated on a 3-point ordinal scale: “not
true” (0), “sometimes true” (1), or “very true” (2). In their construction of aggression
scales, Nagin and Tremblay have typically summed the responses for the three items
they have included. The aggression items in the present analysis were standardized to
have a mean of 0 and a variance of 1 before the sum scale was created. Higher scores
indicate more frequent engagement in physically aggressive behavior. Means and
standard deviations of aggression scores by wave can be viewed in Table 3-2.
Two separate aggression scales were constructed for each of the three waves.
One scale was created by summing all items administered as part of the CBCL that
were relevant to physical aggression and that have been used in previous studies
(Broidy et al., 2003; NICHD Early Child Care Research Network, 2004). This scale
included behaviors such as destroying things belonging to oneself or others, threatening
others, getting into many fights, and cruelty to animals and other people. The second
scale was simply a sum of the only two physical aggression items that were consistently
available across all three waves. These items were destroying things belonging to
others and getting into many fights. Correlations between the two different scales were
run for each wave and were 0.79, 0.88, and 0.84 (for waves 1, 2, and 3, respectively).
43
The first scale (including all of the items at each wave) has adequate reliability at all
three waves, with Cronbach’s alphas of 0.72, 0.72, and 0.66 for the three waves. The
correlations between the two aggression items at each wave were 0.38, 0.33, and 0.37
respectively. A full list of items available at each wave is available in Appendix A.
Missing data on the any of the aggression items was addressed using the ICE
command in STATA to impute the missing values1.
Independent Variable(s)
Corporal punishment. Developed by Straus (1994), the corporal punishment
scale for the current study consists of three items from the Parent-Child Conflict-Tactics
Scale (Earls, Brooks-Gunn, Raudenbush, & Sampson, 1994; Straus et al., 1996), all of
which ask how often a primary caregiver has engaged in the following disciplinary
tactics in the past year: slapped or spanked the child with an open palm; pushed,
grabbed, or shoved the child; and thrown something at the child. The original response
categories were: never (0), once (1), twice (2), 3-5 times (3), 6-10 times (4), 11-20 times
(5), and more than 20 times (6). For each subject, responses to items were summed
and then an average item response was calculated. Higher scores indicate more
1 While the “impute” command in STATA continues to be operable, as of STATA 11, it is no longer an official part of STATA (www.stat.com/help). This is the main reason why the ICE command was used. Additionally, the ICE command is user-written and imputes the value of a single variable using an appropriate regression model based on a set of predictor variables. In the present study, the regression model was an ordinal logit based on the ordinal nature of the aggression score. The predictors used for imputing a given aggression item included all risk factors discussed in the Measures section below, all other items in the aggression scale for the respective wave, and for waves 2 and 3, all aggression items from previous waves of data collection. ICE was used for a single imputation in the present study. Low income of the primary caregiver and Hispanic ethnicity were associated with missing data on the aggression variables. The amount of missingness varied by aggression item. In the worst case, 182 values were missing for a given item. This case of missingness occurred on the “cruelty to animals” item at the third wave of data collection. The only other item with a substantial amount of missing values (147 missing) was the “gets into many fights” item at wave 1. Most commonly, there were zero to two missing values for any given aggression item.
44
frequent use of corporal punishment. On average, primary caregivers reported using
corporal punishment to discipline their child once in the past year. Table 3-3 presents
the prevalence of corporal punishment by type for both the total and analysis samples.
Straus (1994) did not take the mean across these items, but rather classified a
child as experiencing corporal punishment if any of the three tactics had been used in
the past year. As previously mentioned, not all children who experience corporal
punishment have negative outcomes. The rationale behind taking the mean of these
responses is to include information about the frequency of these parental disciplinary
tactics. It may be the frequency of corporal punishment that has an impact on children’s
outcomes, rather than whether or not the child has been corporally punished at all.
Although the corporal punishment scale shows only moderate reliability (α = 0.54), it is
used in the present study for continuity with past research and due to the availability of
the measures. On average, primary caregivers of the analysis sample reported
corporally punishing their child once in the past year (x=1.25, SD=1.11, min=0,
max=6.00).
As hypothesized, type of corporal punishment may also have an impact on
aggressive behavior. To examine this question, each of the three corporal punishment
items are analyzed separately. Again, higher scores on each item indicate more
frequent use of that type of corporal punishment. Primary caregivers most often
reported never spanking their child in the past year (n=158), with a median rate of
spanking 3-5 times in the past year. The median and modal response for primary
caregivers pushing, grabbing, or shoving the child was a frequency of zero times in the
45
past year. The same is true for throwing something at the child; both the median and
mode are zero2.
Risk Factors
All additional independent variables included in the analysis have been linked
with parental use of corporal punishment, physically aggressive behavior in children, or
both. Although most research on developmental trajectories of aggression has included
variables relating directly to the mother (and, in some cases, the father), the PHCDN
collected data on primary caregivers. This information was used in place of parental
variables, as it is more likely that characteristics of the primary caregiver will be
associated with child outcomes (if the primary caregiver is not a parent). In the majority
of cases, however, the biological mother is the primary caregiver (92.22%). Missing
data for these risk factors was very rare, as most of the information was collected as
part of the demographic profile during the first wave. It was dealt with by mean or mode
replacement.
Gender of child. Although developmental trajectories of physical aggression for
girls have illustrated patterns similar to boys, research has shown that scores of females
on aggression tend to be lower overall (Broidy et al., 2003), even as early as 17 months
of age (Baillargeon et al., 2007). Regarding physical punishment, it has been
consistently shown that boys are also more likely to be corporally punished than girls
(Day et al., 1998; Straus et al., 1997; Straus & Stewart, 1999). The PHDCN collected
demographic information at wave 1, including the child’s gender. Gender was coded as
2 Overall, the corporal punishment items did not contain a large number of missing values (n=7). Missing values for these variables were replaced with the modal response
46
female (0) or male (1). The sample was split almost evenly between female (50.51%)
and male (49.49%) children.
Age of child. As discussed in previous sections, a child’s age has an impact on
the likelihood that they will be corporally punished (Day et al., 1998; Regalado et al.,
2004; Socolar & Stein, 1995; Wissow, 2001) and has also been linked to physical
aggression (Cote et al., 2006; Nagin & Tremblay, 1999; 2001; Tremblay et al., 2004).
The age of the child was measured as a continuous variable at wave 1. Although only
the 3-year-old cohort is being used for the present study, some variation in age
inevitably remains, with age at wave 1 ranging from 1.837 to 4.383 years. The mean
age of the analysis sample at wave 1 was 3.15 years.
Race/ethnicity. Research has shown that corporal punishment is more common
among certain ethnic groups (i.e. African Americans) than others (Berlin et al., 2009;
Regalado et al., 2004; Wisslow, 2001). Data on the race/ethnicity of the child was also
collected as part of the demographic profile at wave 1 and several indicator variables
were created to include race/ethnicity in the model. The indicator variables were white
(1 if yes, 0 if otherwise), black (1 if yes, 0 if otherwise), Hispanic (1 if yes, 0 if otherwise),
and other race (1 if yes, 0 is otherwise). The other category included participants who
described themselves as Asian, Pacific Islander, Native American, or other. The
majority of the sample was Hispanic (49.19%), followed by black (33.19%), white
(14.68%), and other (2.93%).
Income. Income is included as a measure of socio-economic status, which has
been linked to the use of parental corporal punishment (Smith & Brooks-Gunn, 1997;
Straus & Stewart, 1999; Wissow, 2001) and aggressive behavior in children (Cote et al.,
47
2006; Tremblay et al.; 2004). Annual income of the primary caregiver was also collected
at wave 1 and was classified into ordinal categories: less than $5,000 (1), $5,000-9,999
(2), $10,000-19,999 (3), $20,000-29,999 (4), $30,000-39,999 (5), $40,000-49,999 (6),
>$50,000 (7). The median income for the sample was $10,000 to $19,999 per year.
Age of primary caregiver: Corporal punishment research has shown that
younger parents are more likely to use corporal punishment on their children than older
parents (Day et al., 1998; Berlin et al., 2009; Smith & Brooks-Gunn, 1997; Straus, 1994;
Straus & Stewart, 1999). Age of the primary caregiver was obtained as part of the
demographic characteristics at wave 1. The mean age of primary caregivers at the first
wave of data collection was 30.87 years (SD=7.29, min=17.79, max=65.60).
Relationship of primary caregiver. While the majority of primary caregivers in
the dataset are biological mothers (92.22%), the relationship of the primary caregiver to
the child is also included. Primary caregivers included biological parents, step-parents,
foster parents, adoptive parents, biological grandparents, siblings, aunts, and uncles.
Indicator variables were created for biological mother (1 if yes, 0 if otherwise), biological
father (1 if yes, 0 if otherwise), and other primary caregiver (1 if yes, 0 if otherwise).
Gender of primary caregiver. Research has shown that mothers are much
more likely to corporally punish their children than fathers (Day et al., 1998; Straus,
1994; Straus & Stewart, 1999). For this reason, the gender of the primary caregiver will
also be included as a risk factor. Gender was coded as female (0) or male (1). As the
majority of primary caregivers were biological mothers, the majority of primary
caregivers were also female (95.30%).
48
Relationship status of primary caregiver. Single-parenting is a risk factor for
both the use of corporal punishment (Loeber et al., 2000; Regalado et al., 2004) and
childhood physical aggression (NICHD, 2004). The marital status of the primary
caregiver was measured as part of the demographic profile at wave 1. Indicator
variables were created for whether the primary caregiver was married (1 if yes, 0 if
otherwise), partnered (1 if yes, 0 if otherwise), or single (1 if yes, 0 if otherwise). The
majority of primary caregivers in the sample were married (56.39%).
Education level of the primary caregiver. Low parental education has been
linked to both use of corporal punishment (Day et al., 1998; Smith & Brooks-Gunn,
1997) and aggressive behavior in children (Cote et al., 2006; NICHD, 2004).
Information regarding the education level of the primary caregiver was collected as part
of the demographic profile at wave 1. Indicator variables were created for the maximum
level of education being less than a high school diploma (1 if yes, 0 if otherwise), a high
school diploma (1 if yes, 0 if otherwise), and some education beyond high school (1 if
yes, 0 if otherwise). Most primary caregivers had some education beyond a high school
diploma (46.11%), followed by less than a high school diploma (39.80%), and earning a
high school diploma (14.10%).
Parental (PC) hostility. Research has shown an association between
aggressive behaviors in children and parental hostility (Cote et al., 2006; NICHD, 2004;
Tremblay et al., 2004). A scale of parental hostility was created for the present study by
summing 6 dichotomous items that have been identified as a “lack of parental hostility”
subscale (Fuligni, Han, & Brooks-Gunn, 2004; Han, Leventhal, & Linver, 2004; Linver,
Brooks-Gunn, Cabrera, 2004) of the home observation for measurement of the

49
environment (HOME) instrument (Selner-O’Hagan & Earls, 1994). Examples of these
items include whether the primary caregiver shouted at the child during the visit,
scolded or criticized the child during the visit, or expressed annoyance with the child.
Higher scores on this measure would therefore indicate a lack of parental hostility and
lower scores would be equivalent to more parental hostility. A list of the items included
in this scale is available in Appendix A. Again, it is important to note that the data
included is that of the primary caregiver, which may not be a parent. The average score
for lack of primary caregiver hostility was 4.86.
Parental (PC) warmth. Parental warmth has also been associated with corporal
punishment and aggressive behavior (Berlin et al.; 2009, Stacks et al., 2009). As with
other measures, the data included in this measure is that of the primary caregiver. A
scale was constructed by summing 9 dichotomous items that have been identified as
measuring parental warmth (Fuligni, Han, & Brooks-Gunn, 2004; Han, Leventhal,
&Linver, 2004; Linver, Brooks-Gunn, Cabrera, 2004) from the HOME instrument
(Selner-O’Hagan & Earls, 1994). Higher scores on this scale indicate more warmth
from the primary caregiver. Examples of warmth items include speaking to child,
praising the child, and showing physical affection toward the child during the visit. A full
list of items included in the measure of warmth can be viewed in Appendix A. The
average score for warmth of the PC toward the child was 7.24.
Presence of siblings: As previously mentioned, one of the best predictors of
membership into the high physical aggression group in previous research was having
siblings. This is not surprising because in order to be physically aggressive, one must
have a target (Tremblay et al., 2004). Measures from an instrument regarding
50
household composition were used to construct an indicator variable for the presence of
siblings (1) or the absence of siblings (0). The majority of the sample had at least one
sibling present (86.34%).
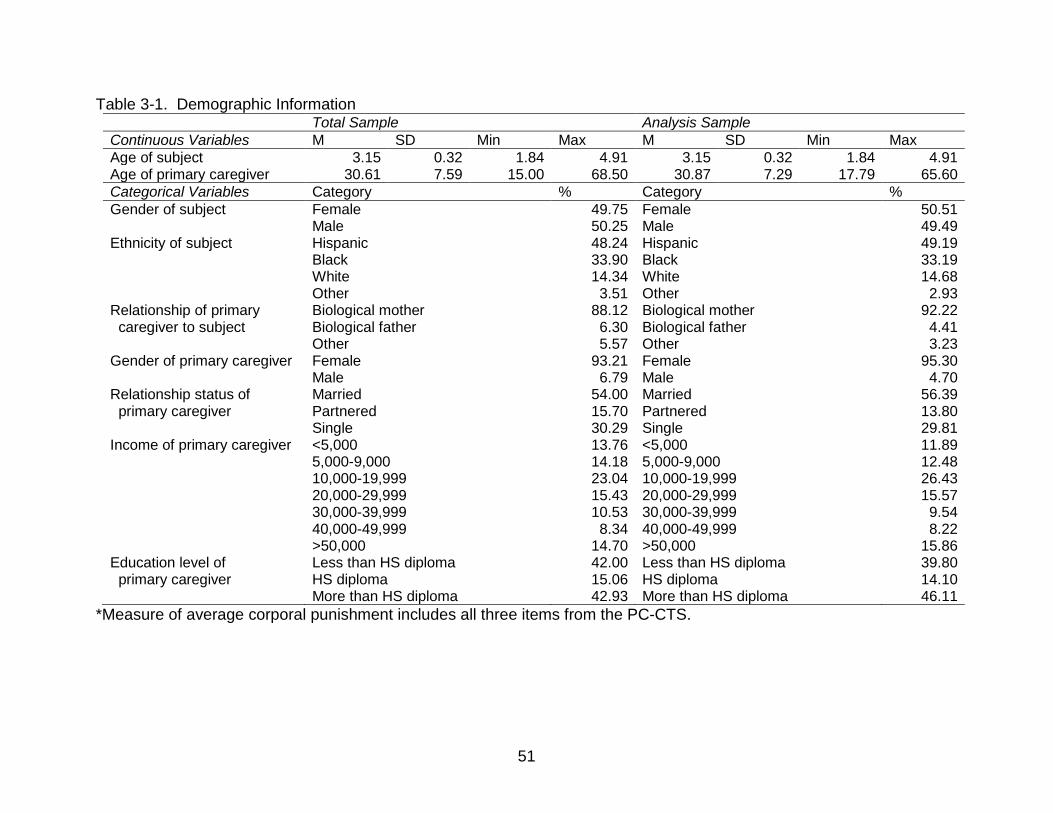
51
Table 3-1. Demographic Information Total Sample Analysis Sample Continuous Variables M SD Min Max M SD Min Max Age of subject 3.15 0.32 1.84 4.91 3.15 0.32 1.84 4.91 Age of primary caregiver 30.61 7.59 15.00 68.50 30.87 7.29 17.79 65.60 Categorical Variables Category % Category % Gender of subject Female
Male 49.75 50.25
Female Male
50.51 49.49
Ethnicity of subject Hispanic Black White Other
48.24 33.90 14.34 3.51
Hispanic Black White Other
49.19 33.19 14.68 2.93
Relationship of primary caregiver to subject
Biological mother Biological father Other
88.12 6.30 5.57
Biological mother Biological father Other
92.22 4.41 3.23
Gender of primary caregiver Female Male
93.21 6.79
Female Male
95.30 4.70
Relationship status of primary caregiver
Married Partnered Single
54.00 15.70 30.29
Married Partnered Single
56.39 13.80 29.81
Income of primary caregiver <5,000 5,000-9,000 10,000-19,999 20,000-29,999 30,000-39,999 40,000-49,999 >50,000
13.76 14.18 23.04 15.43 10.53 8.34
14.70
<5,000 5,000-9,000 10,000-19,999 20,000-29,999 30,000-39,999 40,000-49,999 >50,000
11.89 12.48 26.43 15.57 9.54 8.22
15.86 Education level of primary caregiver
Less than HS diploma HS diploma More than HS diploma
42.00 15.06 42.93
Less than HS diploma HS diploma More than HS diploma
39.80 14.10 46.11
*Measure of average corporal punishment includes all three items from the PC-CTS.
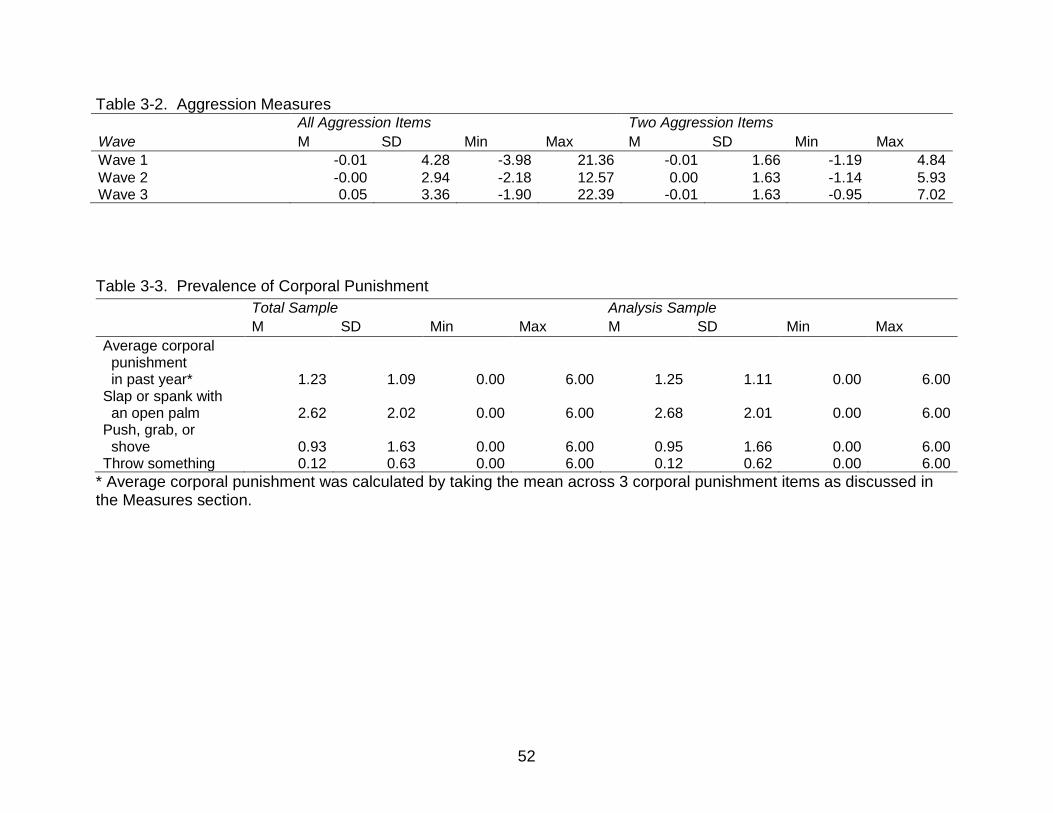
52
Table 3-2. Aggression Measures All Aggression Items Two Aggression Items Wave M SD Min Max M SD Min Max Wave 1 -0.01 4.28 -3.98 21.36 -0.01 1.66 -1.19 4.84 Wave 2 -0.00 2.94 -2.18 12.57 0.00 1.63 -1.14 5.93 Wave 3 0.05 3.36 -1.90 22.39 -0.01 1.63 -0.95 7.02
Table 3-3. Prevalence of Corporal Punishment
* Average corporal punishment was calculated by taking the mean across 3 corporal punishment items as discussed in the Measures section.
Total Sample Analysis Sample M SD Min Max M SD Min Max
Average corporal punishment in past year*
1.23
1.09
0.00
6.00
1.25
1.11
0.00
6.00 Slap or spank with an open palm
2.62
2.02
0.00
6.00
2.68
2.01
0.00
6.00
Push, grab, or shove
0.93
1.63
0.00
6.00
0.95
1.66
0.00
6.00
Throw something 0.12 0.63 0.00 6.00 0.12 0.62 0.00 6.00
53
CHAPTER 4 ANALYTIC STRATEGY AND ANALYSIS PLAN
An Overview of Group-Based Modeling of Development
The present study employs group-based developmental trajectory modeling to
assess aggression trajectories of toddlers for an average age of development from
approximately 3 to 8 years of age (Nagin, 2005). A developmental trajectory describes
change in an individual over a period of time. The trajectory group was developed as a
method for summarizing data that describes the behavior and characteristics of a set of
individuals following approximately the same developmental course. It is evident from
the existing research on trajectories of aggressive behavior that several categories of
aggressive behavior can be identified, such as groups that increase or decrease in
aggression and groups that are persistently low or high in aggression.
Although there are alternative methods which describe an individual’s developmental
path over time, such as hierarchical modeling (Bryk and Raudenbush, 1987; 1992,
Goldstein, 1995) and latent curve analysis or standard growth-curve modeling (McArdle
and Epstein, 1987), group-based developmental trajectory modeling is particularly well-
suited for the research questions in the present study. It has been suggested (Piquero,
2008) that group-based trajectory modeling techniques are appropriate for studying
violent and deviant behavior over the life-course because there may be different groups
of offenders, their offending trajectories may exhibit different shapes at different ages,
and they may be differentially affected by distinct factors.
While not all of the assumptions underlying the alternative methods of hierarchical
modeling and standard growth curve modeling are common, one similarity is crucial.
Both methods model the population distribution of trajectories based on continuous
54
distribution functions. In other words, an average trajectory of a behavior is identified
and the goal is to identify factors that account for individual variability about that
trajectory. Group-based methods of trajectory modeling, in contrast, identify clusters of
individuals with similar developmental paths, thereby allowing differences that may
explain, or at least predict, individual-level heterogeneity in terms of group differences
(Nagin, 2005). Essentially, group-based procedures assume the underlying distribution
is discrete or categorical, rather than continuous, and each category can be viewed as a
source of support, or grouping, for the distribution of individual heterogeneity (Piquero,
2008). The model estimates a separate point of support for as many distinct groups as
can be identified in the data (Piquero, 2008).
The appropriateness of each of these techniques may be best explained by an
example. Raudenbush (2001) provides an ideal illustration. A typical application of
growth-curve modeling is one in which members of the population follow a common
developmental pattern, such as the process of language acquisition in children.
Standard growth-curve modeling is well-suited for this type of analysis because it is
reasonable to assume that most individuals experience a common process of growth:
The vocabularies of all young children from normal populations increase with age. In
this case, it makes sense to examine language acquisition in terms of variation about
the population mean. On the other hand, it is not reasonable to assume that all
individuals in a population follow a common developmental path for certain phenomena,
such as depression (Raudenbush, 2001). Therefore, it makes no sense to characterize
population differences in terms of variation about a mean trajectory of depression in the
population. It is more reasonable to use a group-based approach, which may identify
55
qualitatively distinct trajectories (such as those who are never high in depression, those
who are always high in depression, and those who are increasing in depression) to
analyze individual heterogeneity in terms of group differences (Nagin, 2005;
Raudenbush, 2001).
Certainly, aggressive behavior may be considered the exception, rather than the
norm, within the general population. While physical aggression may be considered
normative in toddlers, it generally declines by school-age (NICHD, 2004) and research
has consistently shown that children follow qualitatively different trajectories of
aggressive behavior. Groups of children exhibiting persistently high levels and
persistently low levels of aggression have been consistently identified in previous
research (Cote et al., 2006; NICHD, 2004; Nagin & Tremblay, 1999; 2001; Tremblay et
al., 2004). As physical aggression generally declines by school-age, it is this
persistently high group in which most research is interested. Depending on the length
of follow-up, several other groups, either increasing or decreasing in aggression have
also been identified (Cote et al., 2006; NICHD, 2004; Tremblay et al., 2004). Due to the
existing empirical support for qualitatively different trajectories of aggressive behavior in
children (Cote et al., 2006; NICHD, 2004; Nagin & Tremblay, 1999; 2001; Tremblay et
al., 2004), group-based modeling approaches will be used in the present study.
Analysis
The PROC TRAJ procedure in the SAS statistical package is used to estimate
the trajectory groups. The analysis for the present study occurs in three main steps.
First, the semi-parametric mixture model technique is applied to repeated measures of
aggressive behavior to identify different developmental trajectories of physical
aggression. To address the first research question for the present study, the best-fitting
56
trajectories are found using appropriate model selection criteria as outlined by Nagin
(2005). Next, the features of the aggression trajectories (i.e. stable, increasing,
declining) were identified and will be described in Chapter 5. Finally, profiles of the
groups are created, which examine the association between group membership and
type and frequency of corporal punishment experienced (research questions two and
three).
Model Estimation Procedures
The group-based trajectory model is an application of the statistical technique
called finite mixture modeling, which is an extension of the conventional maximum
likelihood model (Nagin, 2005). The identification of clusters of individuals with similar
trajectories is the product of maximum likelihood estimation. While the specific form of
the likelihood function to be maximized depends on the type of data being analyzed, the
general form of the likelihood function is given by
𝑃𝑃(𝑌𝑌𝑖𝑖) = ∑ 𝜋𝜋𝑗𝑗𝑃𝑃𝑗𝑗 (𝑌𝑌𝑖𝑖),𝐽𝐽𝑗𝑗 (4-1)
where 𝑌𝑌𝑖𝑖 = {𝑦𝑦𝑖𝑖1,𝑦𝑦𝑖𝑖2, … ,𝑦𝑦𝑖𝑖𝑖𝑖} denotes a longitudinal sequence of measurements on
individual 𝑖𝑖 over 𝑖𝑖 periods (the aggressive behavior of an individual),𝑃𝑃(𝑌𝑌𝑖𝑖) is the
unconditional probability of observing individual 𝑖𝑖’s longitudinal sequence of behavioral
measurements, 𝑌𝑌𝑖𝑖 equals the sum across the 𝐽𝐽 groups of the probability of 𝑌𝑌𝑖𝑖 given 𝑖𝑖’s
membership in group 𝑗𝑗 weighted by the probability of membership in group 𝑗𝑗, 𝑃𝑃𝑗𝑗 (𝑌𝑌𝑖𝑖)
denotes the probability of 𝑌𝑌𝑖𝑖 given membership into group 𝑗𝑗, and 𝜋𝜋𝑗𝑗 denotes the
probability of a randomly chosen population member belonging to group 𝑗𝑗.
The present study estimates trajectory models in which 𝑦𝑦𝑖𝑖𝑖𝑖 is a censored
variable: ratings of physical aggression from a psychometric scale in which there are
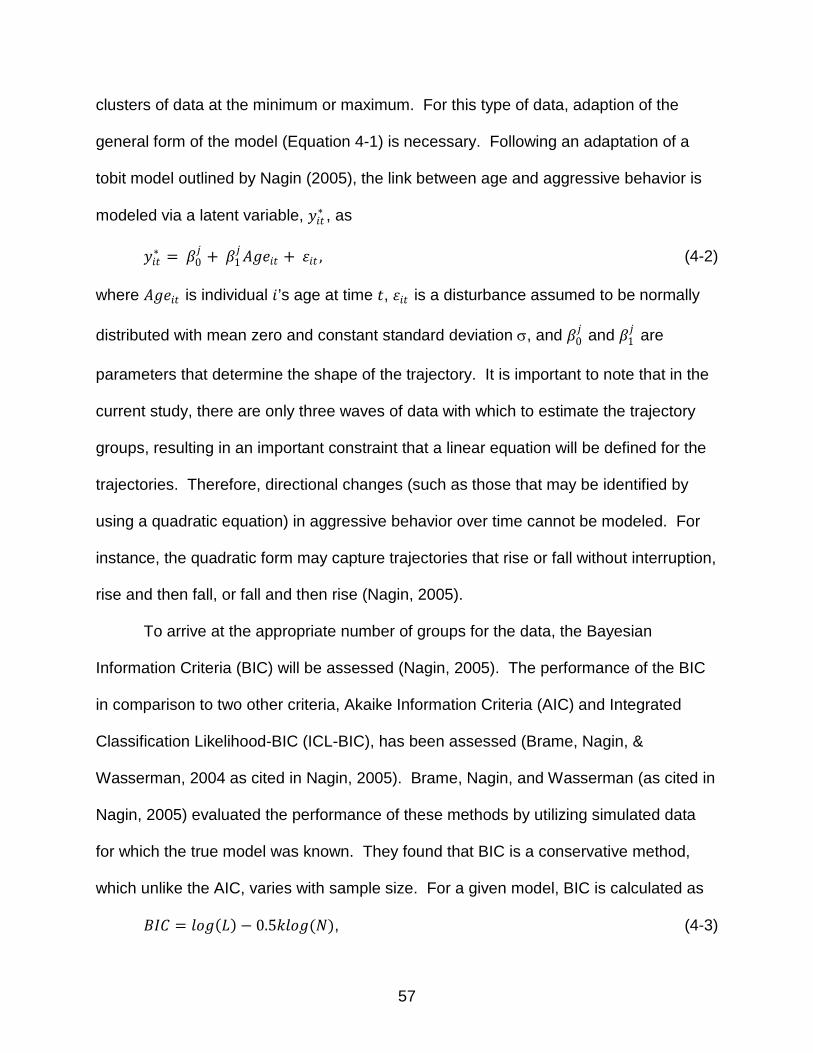
57
clusters of data at the minimum or maximum. For this type of data, adaption of the
general form of the model (Equation 4-1) is necessary. Following an adaptation of a
tobit model outlined by Nagin (2005), the link between age and aggressive behavior is
modeled via a latent variable, 𝑦𝑦𝑖𝑖𝑖𝑖∗ , as
𝑦𝑦𝑖𝑖𝑖𝑖∗ = 𝛽𝛽0𝑗𝑗 + 𝛽𝛽1
𝑗𝑗 𝐴𝐴𝐴𝐴𝐴𝐴𝑖𝑖𝑖𝑖 + 𝜀𝜀𝑖𝑖𝑖𝑖 , (4-2)
where 𝐴𝐴𝐴𝐴𝐴𝐴𝑖𝑖𝑖𝑖 is individual 𝑖𝑖’s age at time 𝑖𝑖, 𝜀𝜀𝑖𝑖𝑖𝑖 is a disturbance assumed to be normally
distributed with mean zero and constant standard deviation σ, and 𝛽𝛽0𝑗𝑗 and 𝛽𝛽1
𝑗𝑗 are
parameters that determine the shape of the trajectory. It is important to note that in the
current study, there are only three waves of data with which to estimate the trajectory
groups, resulting in an important constraint that a linear equation will be defined for the
trajectories. Therefore, directional changes (such as those that may be identified by
using a quadratic equation) in aggressive behavior over time cannot be modeled. For
instance, the quadratic form may capture trajectories that rise or fall without interruption,
rise and then fall, or fall and then rise (Nagin, 2005).
To arrive at the appropriate number of groups for the data, the Bayesian
Information Criteria (BIC) will be assessed (Nagin, 2005). The performance of the BIC
in comparison to two other criteria, Akaike Information Criteria (AIC) and Integrated
Classification Likelihood-BIC (ICL-BIC), has been assessed (Brame, Nagin, &
Wasserman, 2004 as cited in Nagin, 2005). Brame, Nagin, and Wasserman (as cited in
Nagin, 2005) evaluated the performance of these methods by utilizing simulated data
for which the true model was known. They found that BIC is a conservative method,
which unlike the AIC, varies with sample size. For a given model, BIC is calculated as
𝐵𝐵𝐼𝐼𝐼𝐼 = 𝑙𝑙𝑙𝑙𝐴𝐴(𝐿𝐿) − 0.5𝑘𝑘𝑙𝑙𝑙𝑙𝐴𝐴(𝑁𝑁), (4-3)
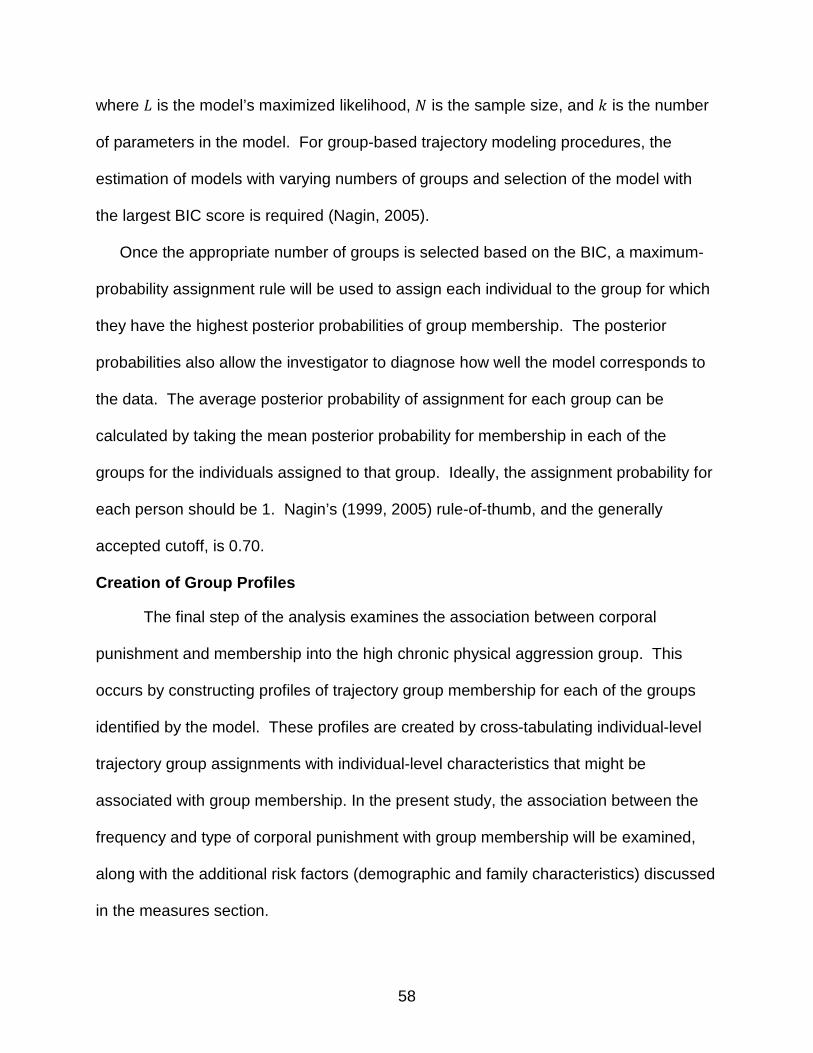
58
where 𝐿𝐿 is the model’s maximized likelihood, 𝑁𝑁 is the sample size, and 𝑘𝑘 is the number
of parameters in the model. For group-based trajectory modeling procedures, the
estimation of models with varying numbers of groups and selection of the model with
the largest BIC score is required (Nagin, 2005).
Once the appropriate number of groups is selected based on the BIC, a maximum-
probability assignment rule will be used to assign each individual to the group for which
they have the highest posterior probabilities of group membership. The posterior
probabilities also allow the investigator to diagnose how well the model corresponds to
the data. The average posterior probability of assignment for each group can be
calculated by taking the mean posterior probability for membership in each of the
groups for the individuals assigned to that group. Ideally, the assignment probability for
each person should be 1. Nagin’s (1999, 2005) rule-of-thumb, and the generally
accepted cutoff, is 0.70.
Creation of Group Profiles
The final step of the analysis examines the association between corporal
punishment and membership into the high chronic physical aggression group. This
occurs by constructing profiles of trajectory group membership for each of the groups
identified by the model. These profiles are created by cross-tabulating individual-level
trajectory group assignments with individual-level characteristics that might be
associated with group membership. In the present study, the association between the
frequency and type of corporal punishment with group membership will be examined,
along with the additional risk factors (demographic and family characteristics) discussed
in the measures section.
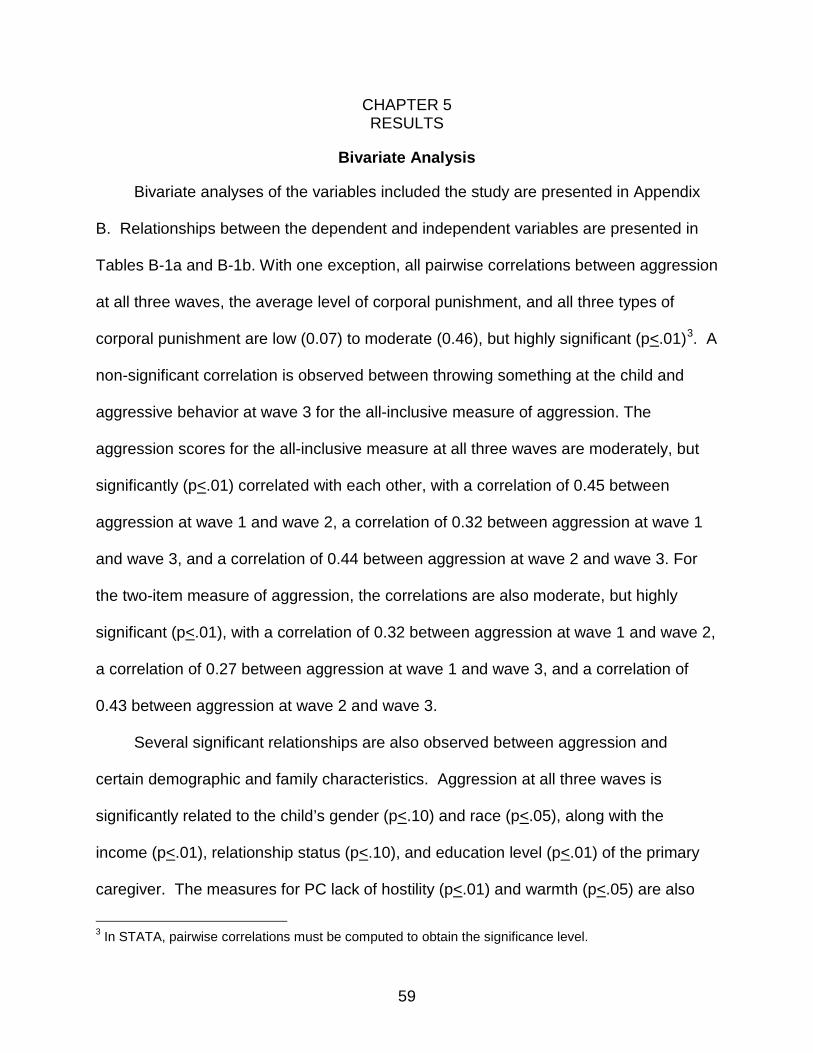
59
CHAPTER 5 RESULTS
Bivariate Analysis
Bivariate analyses of the variables included the study are presented in Appendix
B. Relationships between the dependent and independent variables are presented in
Tables B-1a and B-1b. With one exception, all pairwise correlations between aggression
at all three waves, the average level of corporal punishment, and all three types of
corporal punishment are low (0.07) to moderate (0.46), but highly significant (p<.01)3. A
non-significant correlation is observed between throwing something at the child and
aggressive behavior at wave 3 for the all-inclusive measure of aggression. The
aggression scores for the all-inclusive measure at all three waves are moderately, but
significantly (p<.01) correlated with each other, with a correlation of 0.45 between
aggression at wave 1 and wave 2, a correlation of 0.32 between aggression at wave 1
and wave 3, and a correlation of 0.44 between aggression at wave 2 and wave 3. For
the two-item measure of aggression, the correlations are also moderate, but highly
significant (p<.01), with a correlation of 0.32 between aggression at wave 1 and wave 2,
a correlation of 0.27 between aggression at wave 1 and wave 3, and a correlation of
0.43 between aggression at wave 2 and wave 3.
Several significant relationships are also observed between aggression and
certain demographic and family characteristics. Aggression at all three waves is
significantly related to the child’s gender (p<.10) and race (p<.05), along with the
income (p<.01), relationship status (p<.10), and education level (p<.01) of the primary
caregiver. The measures for PC lack of hostility (p<.01) and warmth (p<.05) are also
3 In STATA, pairwise correlations must be computed to obtain the significance level.
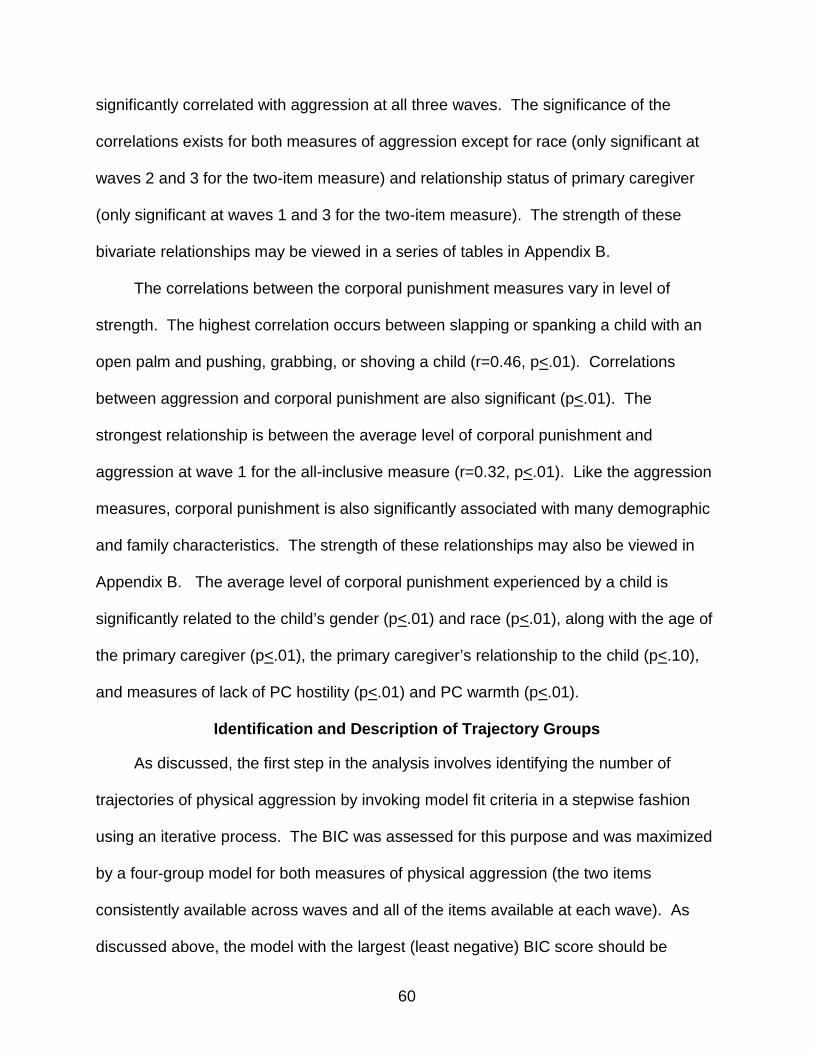
60
significantly correlated with aggression at all three waves. The significance of the
correlations exists for both measures of aggression except for race (only significant at
waves 2 and 3 for the two-item measure) and relationship status of primary caregiver
(only significant at waves 1 and 3 for the two-item measure). The strength of these
bivariate relationships may be viewed in a series of tables in Appendix B.
The correlations between the corporal punishment measures vary in level of
strength. The highest correlation occurs between slapping or spanking a child with an
open palm and pushing, grabbing, or shoving a child (r=0.46, p<.01). Correlations
between aggression and corporal punishment are also significant (p<.01). The
strongest relationship is between the average level of corporal punishment and
aggression at wave 1 for the all-inclusive measure (r=0.32, p<.01). Like the aggression
measures, corporal punishment is also significantly associated with many demographic
and family characteristics. The strength of these relationships may also be viewed in
Appendix B. The average level of corporal punishment experienced by a child is
significantly related to the child’s gender (p<.01) and race (p<.01), along with the age of
the primary caregiver (p<.01), the primary caregiver’s relationship to the child (p<.10),
and measures of lack of PC hostility (p<.01) and PC warmth (p<.01).
Identification and Description of Trajectory Groups
As discussed, the first step in the analysis involves identifying the number of
trajectories of physical aggression by invoking model fit criteria in a stepwise fashion
using an iterative process. The BIC was assessed for this purpose and was maximized
by a four-group model for both measures of physical aggression (the two items
consistently available across waves and all of the items available at each wave). As
discussed above, the model with the largest (least negative) BIC score should be
61
selected. The BICs for the two, three, and four group models for the all-inclusive
measure of aggression were -5276.06, -5196.82, and -5173.76, respectively. For the
two-item measure of aggression, the BICs were -3740.68, -3661.20, and -3628.68 for
the two, three, and four group models, respectively. Again, the four-group model
maximized the BIC in both cases. The models are largely consistent with prior research
(Cote et al., 2006; Nagin & Tremblay, 1999; 2001; NICHD, 2004; Tremblay et al., 2004).
Four groups were identified, with one group exhibiting persistent (increasing)
aggression over time, which supports the first hypothesis of this thesis.
A graph of the four-group model identified by the all-inclusive measure is
presented in Figure 5-1. The four groups identified can be described as low-stable
aggressors, modest aggressors, high-starting desisters, and high-rising aggressors.
The group of low-stable aggressors is characterized by low levels of physical
aggression (less than 1 SD below the mean) in toddlerhood and levels of physical
aggression which remain low (very close to the mean) throughout early childhood. This
group contained approximately 78.7% (n=519) of the sample. The group of modest
aggressors contained approximately 9.7% (n=55) of the sample and is characterized by
moderate levels of physical aggression (approximately 1 SD above the mean) in
toddlerhood, which continued throughout early childhood. The high-starting desisters
group is characterized by high levels of aggression (approximately 2 SD above the
mean) in toddlerhood, which declined steeply until about 5.5 or 6 years of age (to
approximately 1 SD above the mean) and continued to decline throughout early
childhood (reaching the mean level of aggression). This group contained approximately
10.5% (n=100) of the sample. The high-rising group is characterized by high levels of
62
physical aggression (approximately 2 SD above the mean at wave 1) in toddlerhood
and a steep increase in aggression around 5.5 or 6 years of age. The levels of physical
aggression exhibited by this group by age 8 (up to approximately 5 SD above the mean)
are substantially higher than the levels of physical aggression exhibited by any other
group at any point in time. This group contained approximately 1.0% (n=7) of the
sample.
A graph of the four-group model identified by the two-item measure is presented in
Figure 5-2. The trajectory paths identified by this model are slightly different than the
ones discussed above. The four groups identified by this model can be referred to as
low-increasing aggressors, low-stable aggressors, high-starting desisters, and high-
rising aggressors. The low-increasing group contained approximately 9.9% (n=73) of
the sample and is characterized by low levels of physical aggression (approximately the
mean level) in toddlerhood, followed by a steady increase to high levels of physical
aggression (approximately 2 SD above the mean) by 8 years of age. This group
exhibits a different path than the group of modest aggressors in the first model, whose
path remains relatively stable over time. The next group, referred to as the low-stable
group, contained approximately 76.0% (n=509) of the sample. This group is
characterized by low levels of physical aggression in toddlerhood and low levels of
physical aggression throughout childhood (consistently less than 1 SD below the mean).
The high-starting desisters group exhibited high levels of physical aggression
(approximately 2 SD above the mean) in toddlerhood, which declined steadily
throughout childhood (to almost the mean level of physical aggression). It contained
approximately 11.9% (n=80) of the sample. The high-rising aggression group in this
63
model, similarly to the high-rising group identified in the first model, began with high
levels of physical aggression (approximately 2 SD above the mean) in toddlerhood,
which increased steadily throughout childhood (to approximately 3 SD above the mean).
The high-rising group contained approximately 2.2% (n=19) of the sample.
As previously mentioned, the groups identified by these models can be validated
by an examination of the average posterior probability of group membership for each
group. Ideally, the assignment probability for each individual equals 1 and the average
posterior probability also equals 1 (Nagin, 2005). For the first model (all-inclusive
measure), the average posterior probabilities were 0.85, 0.97, 0.89, and 0.99 for groups
one, two, three, and four, respectively. This means that for group one, the average
probability of assignment to that group for all individuals was 0.85. For the second
model (two-item measure), the average posterior probabilities of group membership
were 0.85, 0.97, 0.89, and 0.91 for groups one, two, three, and four, respectively. All of
these average posterior probabilities are well-above Nagin’s (1999, 2005) cutoff of 0.70.
Creating Group Profiles
One goal of this thesis is to examine corporal punishment as a risk factor for high
levels of physical aggression. This thesis specifically examines the differences in
frequency and type of corporal punishment experienced by toddlers on various
trajectories of aggression, focusing on the high-rising aggression trajectory group
relative to other groups. Following the identification of the trajectory groups, it was
determined that multinomial logit regression was not an appropriate technique to
examine the research questions at hand. An attempt to perform the regression resulted
in oversaturation of the model due to the very low proportion of the sample in the high
aggression group for either measure (1.0% or n=7 for the all-inclusive measure and
64
2.2% or n=19 for the two-item measure). There was not enough variability among the
sample in the high group on key control variables. For example, the high group for the
all-inclusive measure was composed of only black (n=4) and Hispanic (n=3) children
and did not contain any white children or children who were identified as “other”. While
removing variables would allow for model estimation, it would result in the removal of
important controls and would, therefore, reduce the validity of the results.
As an alternative to performing multinomial logit regression, profiles of group
membership were created using group assignments. Although creating group profiles
does not establish a functional relationship between the probability of group
membership and a set of predictors, it is a starting point for understanding how group
membership may be linked to these variables (Nagin, 2005). Classification into the
trajectory groups is determined based on posterior probabilities, allowing for the
creation of group profiles by cross-tabulating individual-level trajectory group
assignments and the individual-level variables that might be associated with group
membership. In the present study, these variables include the frequency and types of
corporal punishment experienced by a child and the risk factors which were to be
included in the regression model (as controls). Significance tests were performed to
determine risk factors for membership in the high-rising groups as opposed to any of the
other trajectory groups. ANOVA tests were performed for associations between
continuous and dichotomous variables. Fisher’s exact test was performed for
associations between dichotomous variables due to the low frequencies in the high-
rising aggression groups. The results of these group profiles are presented in Tables 5-
1 and 5-2 for the two different models of physical aggression trajectories.
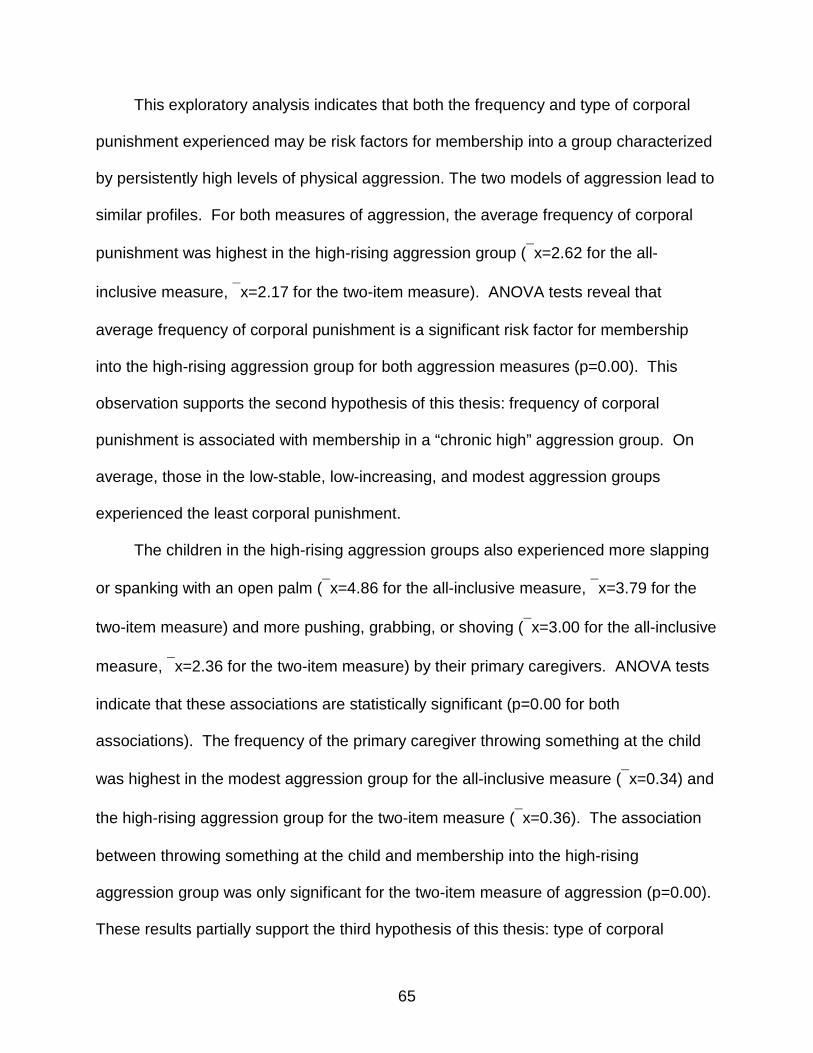
65
This exploratory analysis indicates that both the frequency and type of corporal
punishment experienced may be risk factors for membership into a group characterized
by persistently high levels of physical aggression. The two models of aggression lead to
similar profiles. For both measures of aggression, the average frequency of corporal
punishment was highest in the high-rising aggression group (x=2.62 for the all-
inclusive measure, x=2.17 for the two-item measure). ANOVA tests reveal that
average frequency of corporal punishment is a significant risk factor for membership
into the high-rising aggression group for both aggression measures (p=0.00). This
observation supports the second hypothesis of this thesis: frequency of corporal
punishment is associated with membership in a “chronic high” aggression group. On
average, those in the low-stable, low-increasing, and modest aggression groups
experienced the least corporal punishment.
The children in the high-rising aggression groups also experienced more slapping
or spanking with an open palm (x=4.86 for the all-inclusive measure, x=3.79 for the
two-item measure) and more pushing, grabbing, or shoving (x=3.00 for the all-inclusive
measure, x=2.36 for the two-item measure) by their primary caregivers. ANOVA tests
indicate that these associations are statistically significant (p=0.00 for both
associations). The frequency of the primary caregiver throwing something at the child
was highest in the modest aggression group for the all-inclusive measure (x=0.34) and
the high-rising aggression group for the two-item measure (x=0.36). The association
between throwing something at the child and membership into the high-rising
aggression group was only significant for the two-item measure of aggression (p=0.00).
These results partially support the third hypothesis of this thesis: type of corporal
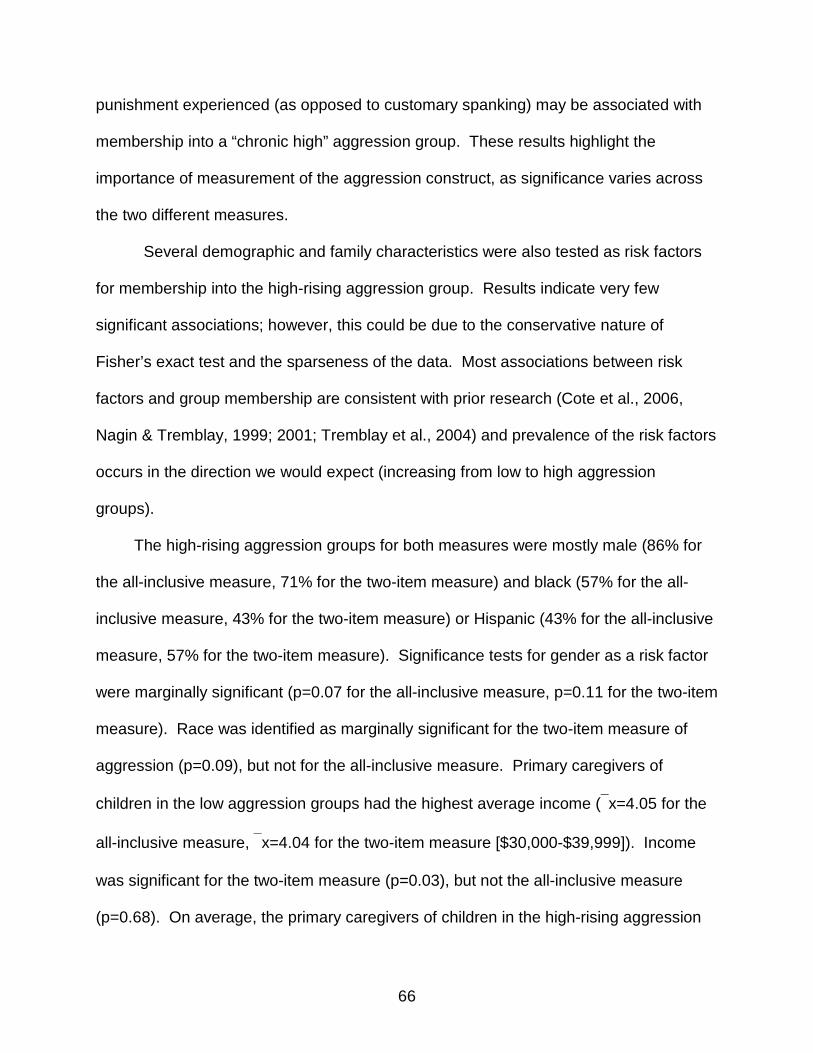
66
punishment experienced (as opposed to customary spanking) may be associated with
membership into a “chronic high” aggression group. These results highlight the
importance of measurement of the aggression construct, as significance varies across
the two different measures.
Several demographic and family characteristics were also tested as risk factors
for membership into the high-rising aggression group. Results indicate very few
significant associations; however, this could be due to the conservative nature of
Fisher’s exact test and the sparseness of the data. Most associations between risk
factors and group membership are consistent with prior research (Cote et al., 2006,
Nagin & Tremblay, 1999; 2001; Tremblay et al., 2004) and prevalence of the risk factors
occurs in the direction we would expect (increasing from low to high aggression
groups).
The high-rising aggression groups for both measures were mostly male (86% for
the all-inclusive measure, 71% for the two-item measure) and black (57% for the all-
inclusive measure, 43% for the two-item measure) or Hispanic (43% for the all-inclusive
measure, 57% for the two-item measure). Significance tests for gender as a risk factor
were marginally significant (p=0.07 for the all-inclusive measure, p=0.11 for the two-item
measure). Race was identified as marginally significant for the two-item measure of
aggression (p=0.09), but not for the all-inclusive measure. Primary caregivers of
children in the low aggression groups had the highest average income (x=4.05 for the
all-inclusive measure, x=4.04 for the two-item measure [$30,000-$39,999]). Income
was significant for the two-item measure (p=0.03), but not the all-inclusive measure
(p=0.68). On average, the primary caregivers of children in the high-rising aggression
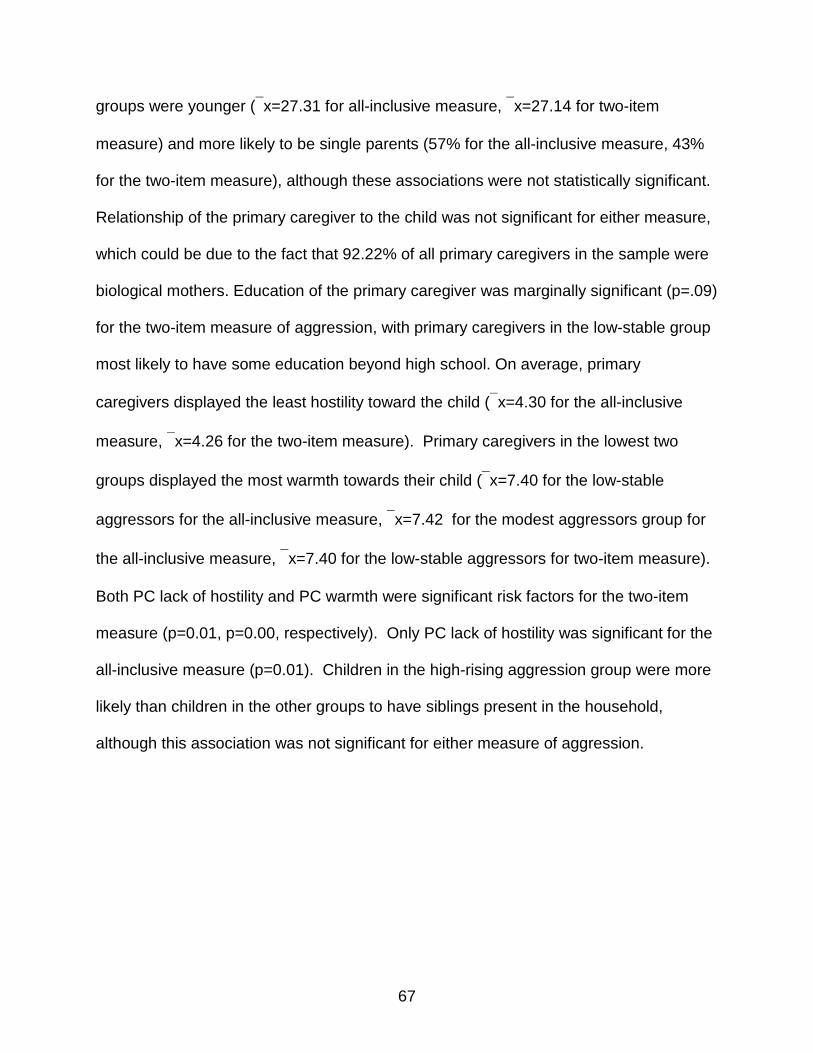
67
groups were younger (x=27.31 for all-inclusive measure, x=27.14 for two-item
measure) and more likely to be single parents (57% for the all-inclusive measure, 43%
for the two-item measure), although these associations were not statistically significant.
Relationship of the primary caregiver to the child was not significant for either measure,
which could be due to the fact that 92.22% of all primary caregivers in the sample were
biological mothers. Education of the primary caregiver was marginally significant (p=.09)
for the two-item measure of aggression, with primary caregivers in the low-stable group
most likely to have some education beyond high school. On average, primary
caregivers displayed the least hostility toward the child (x=4.30 for the all-inclusive
measure, x=4.26 for the two-item measure). Primary caregivers in the lowest two
groups displayed the most warmth towards their child (x=7.40 for the low-stable
aggressors for the all-inclusive measure, x=7.42 for the modest aggressors group for
the all-inclusive measure, x=7.40 for the low-stable aggressors for two-item measure).
Both PC lack of hostility and PC warmth were significant risk factors for the two-item
measure (p=0.01, p=0.00, respectively). Only PC lack of hostility was significant for the
all-inclusive measure (p=0.01). Children in the high-rising aggression group were more
likely than children in the other groups to have siblings present in the household,
although this association was not significant for either measure of aggression.
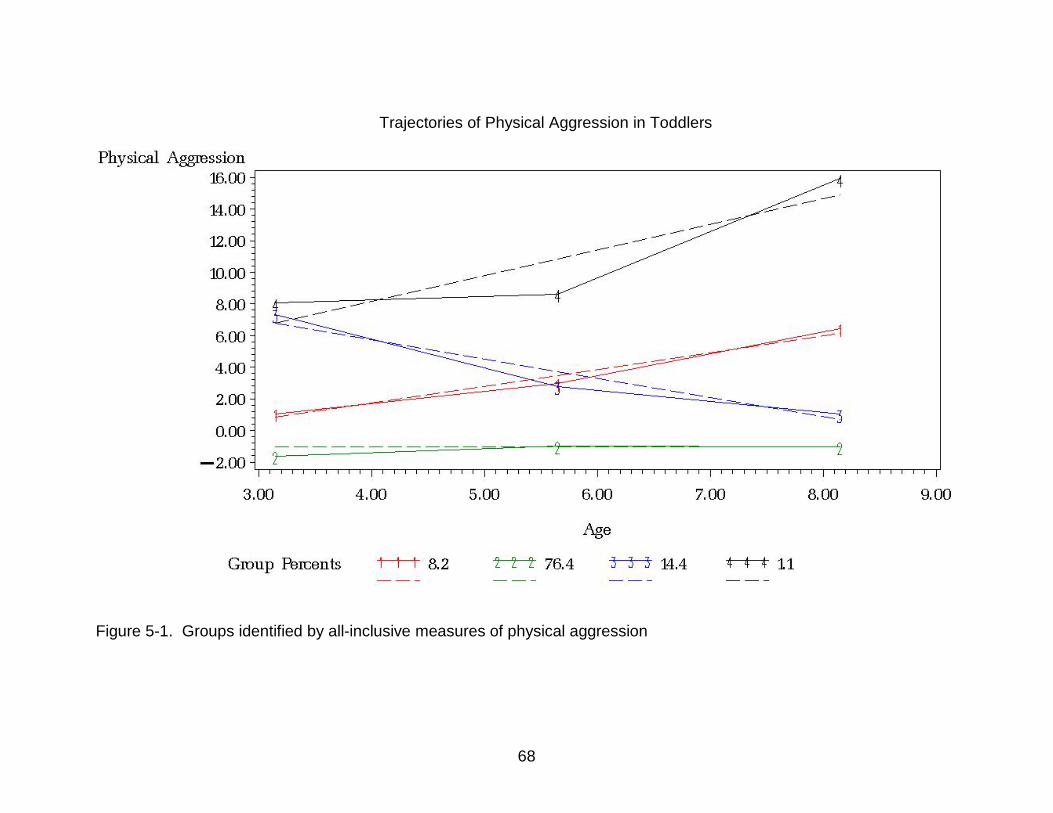
68
Trajectories of Physical Aggression in Toddlers
Figure 5-1. Groups identified by all-inclusive measures of physical aggression
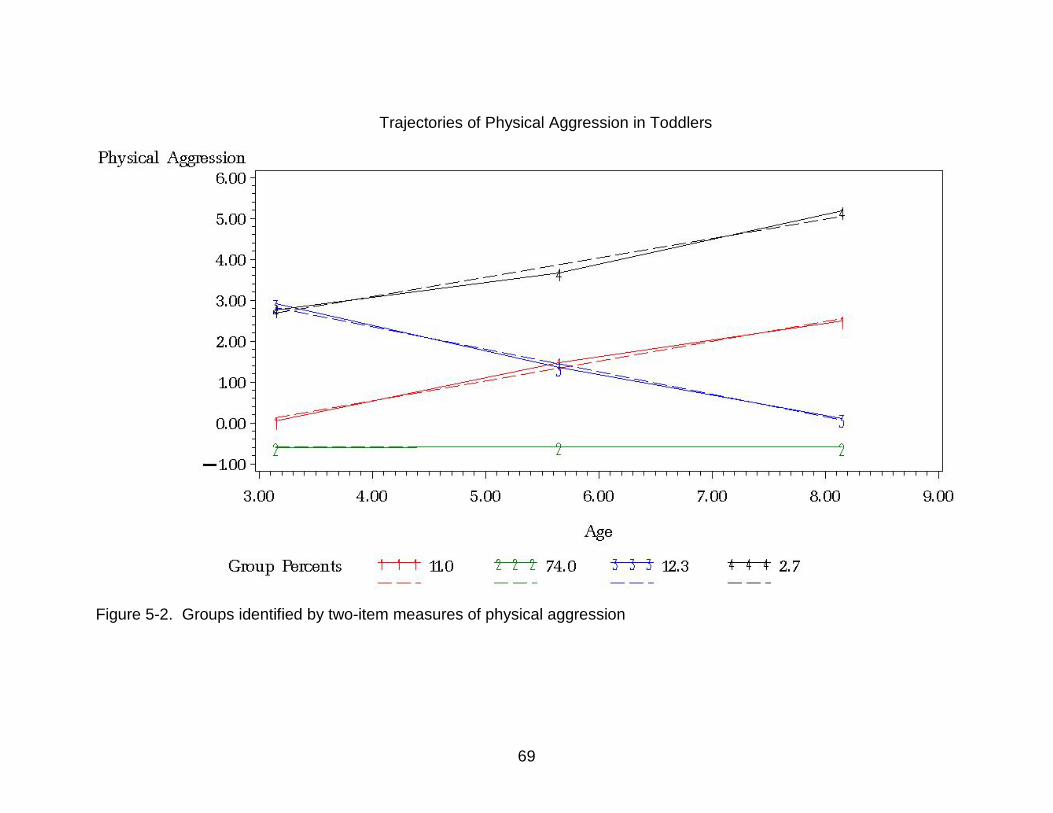
69
Trajectories of Physical Aggression in Toddlers
Figure 5-2. Groups identified by two-item measures of physical aggression

70
Table 5-1. Group Profiles for Model 1 (all-inclusive measure)
Group 1 Low-stable aggressors
Group 2 Modest aggressors
Group 3 High-starting desisters
Group 4 High-rising aggressors
P-value on significance tests (High-rising vs. other groups)
Avg. frequency of corporal punishment
1.40
1.08
2.01
2.62
0.00
Slap or spank 2.49 3.15 3.54 4.86 0.00 Push, grab, or shove 0.77 1.53 1.61 3.00 0.00 Throw something 0.08 0.34 0.28 0.00 0.61 Male (%) 0.48 0.55 0.51 0.86 0.07 Age 3.06 3.15 3.18 2.92 0.06 White (%) 0.09 0.17 0.05 0.00 0.60 Black (%) 0.35 0.31 0.41 0.57 0.22 Hispanic (%) 0.53 0.48 0.52 0.43 1.00 Other (%) 0.04 0.04 0.02 0.00 1.00 Income 4.05 3.16 3.06 3.57 0.68 Age PC 32.34 31.19 28.65 27.31 0.19 PC mother (%) 0.94 0.91 0.92 1.00 1.00 PC father (%) 0.00 0.05 0.02 0.00 1.00 PC other (%) 0.05 0.03 0.06 0.00 1.00 PC married (%) 0.58 0.60 0.35 0.28 0.25 PC partner (%) 0.04 0.13 0.26 0.14 1.00 PC single (%) 0.38 0.26 0.39 0.57 0.21 PC education: Less than HS (%) 0.35 0.62 0.54 0.29 0.71 PC education: HS diploma (%) 0.14 0.10 0.19 0.14 1.00 PC education: More than HS (%) 0.50 0.27 0.26 0.57 0.71 Lack of PC hostility 3.91 4.30 3.73 3.00 0.01 PC warmth 7.40 7.42 6.32 6.43 0.27 Presence of siblings (%) 0.94 0.86 0.82 1.00 0.60 Note: Due to low cell counts, Fisher’s Exact Test was conducted between two dichotomous variables. ANOVAs were conducted between continuous and dichotomous variables. Dichotomous variables are those with % denoted. Where % is not denoted, the mean of the continuous variable is given.
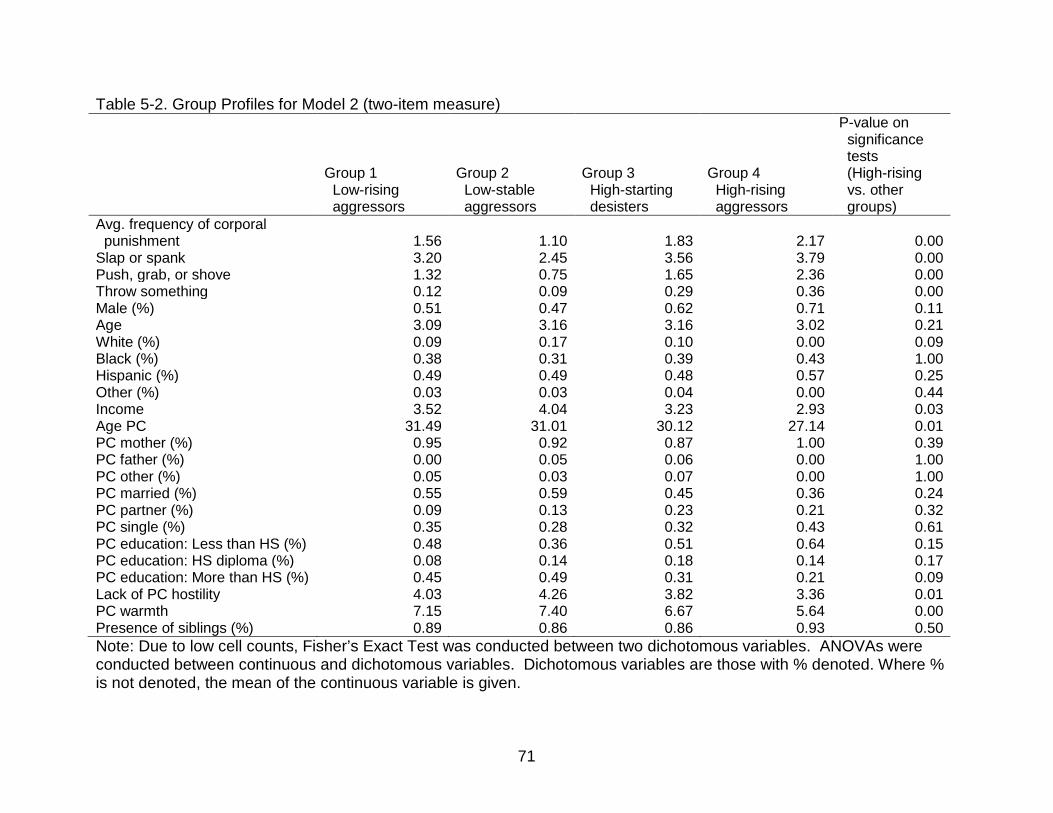
71
Table 5-2. Group Profiles for Model 2 (two-item measure)
Group 1 Low-rising aggressors
Group 2 Low-stable aggressors
Group 3 High-starting desisters
Group 4 High-rising aggressors
P-value on significance tests (High-rising vs. other groups)
Avg. frequency of corporal punishment
1.56
1.10
1.83
2.17
0.00
Slap or spank 3.20 2.45 3.56 3.79 0.00 Push, grab, or shove 1.32 0.75 1.65 2.36 0.00 Throw something 0.12 0.09 0.29 0.36 0.00 Male (%) 0.51 0.47 0.62 0.71 0.11 Age 3.09 3.16 3.16 3.02 0.21 White (%) 0.09 0.17 0.10 0.00 0.09 Black (%) 0.38 0.31 0.39 0.43 1.00 Hispanic (%) 0.49 0.49 0.48 0.57 0.25 Other (%) 0.03 0.03 0.04 0.00 0.44 Income 3.52 4.04 3.23 2.93 0.03 Age PC 31.49 31.01 30.12 27.14 0.01 PC mother (%) 0.95 0.92 0.87 1.00 0.39 PC father (%) 0.00 0.05 0.06 0.00 1.00 PC other (%) 0.05 0.03 0.07 0.00 1.00 PC married (%) 0.55 0.59 0.45 0.36 0.24 PC partner (%) 0.09 0.13 0.23 0.21 0.32 PC single (%) 0.35 0.28 0.32 0.43 0.61 PC education: Less than HS (%) 0.48 0.36 0.51 0.64 0.15 PC education: HS diploma (%) 0.08 0.14 0.18 0.14 0.17 PC education: More than HS (%) 0.45 0.49 0.31 0.21 0.09 Lack of PC hostility 4.03 4.26 3.82 3.36 0.01 PC warmth 7.15 7.40 6.67 5.64 0.00 Presence of siblings (%) 0.89 0.86 0.86 0.93 0.50 Note: Due to low cell counts, Fisher’s Exact Test was conducted between two dichotomous variables. ANOVAs were conducted between continuous and dichotomous variables. Dichotomous variables are those with % denoted. Where % is not denoted, the mean of the continuous variable is given.
72
CHAPTER 6 DISCUSSION AND CONCLUSIONS
Summary of Findings
Past research on the use of corporal punishment has shown a relationship
between physical punishment and aggressive behavior (Berlin et al., 2009; Eron,
Huesman, & Zelli, 1991; Larzelere, 1986; Sears, Maccoby, & Levin, 1957; Stacks,
Oshio, Gerard, & Roe, 2009; Strassberg et al., 1994; Straus, 1994; Straus, Sugarman,
& Giles-Sims, 1997). In the developmental literature, certain parenting styles, such as
hostile and coercive parenting, have been identified as risk factors for persistent
aggressive behavior over time (Cote et al., 2006; NICHD, 2004; Tremblay et al., 2004).
The goals of this thesis were to identify trajectories of aggressive behavior in a sample
of toddlers and examine the frequency and type of corporal punishment experienced as
risk factors for membership into a high aggression group.
The results of the present study are largely consistent with those of previous
research on trajectory groups of physical aggression (Cote et al., 2006; Nagin &
Tremblay, 1999; 2001; NICHD, 2004; Tremblay et al., 2004). Previous research on
group-based trajectories of physical aggression has resulted in similar trajectory paths
based on the developmental period studied. Nagin and Tremblay (1999; 2001)
identified four trajectories for a sample studied from 6 to 15 years of age: a low group
(25% of the sample), a moderate-desisting group (46% of the sample), a high-desisting
group (25%) of the sample, and a chronic high group (5%). Tremblay et al. (2004)
found a low-stable group (28% of the sample), a modest-rising group (58% of the
sample), and a high-rising group (14% of the sample) for a sample of 5-42 month olds.
Cote et al. (2006) examine trajectories of aggression from toddlerhood to pre-

73
adolescence and found a low-desisting (31.1%), moderate-desisting (52.2%), and high-
stable (16.6%) group. The general trend in aggressive behavior appears to be a peak
during toddlerhood, followed by decreasing levels of aggression throughout childhood
and adolescence (Cote et al., 2006; Nagin & Tremblay, 1999; 2001; Tremblay et al.,
2004).
The first hypothesis of this thesis is partially supported. This study identified four
aggression groups using two different measures of physical aggression, however, the
distribution of the sample into these groups is quite different than what has been
discovered in past research. Both models in the present study included a low-stable
group, comprising the largest proportion of the sample, and a high-rising group,
comprising a very small fraction of the sample (Tremblay et al., 2004). The paths of
these trajectories are similar to those found in previous research. For instance, the
high-rising group here exhibits a pattern of behavior similar to the high-rising group
found by Tremblay et al. (2004). Like Nagin and Tremblay (1999; 2001), the high
chronic group contained a very small percentage of the sample.
In the present study, however, the low-stable group included a much larger
proportion of the sample than in previous studies. The distribution of the sample within
each of the trajectory groups found here has implications for the assertions of
developmental researchers like Tremblay and Nagin. They argue that aggression
begins at a very young age (infancy) and peaks in toddlerhood, followed by a steep
decline for most of the population. While toddlerhood was the peak age for physical
aggression for about 10-12% of the sample here, results of the present study indicate
that over 75% of the sample is never high in physical aggression. These findings stand
74
in contrast to Tremblay and Nagin’s idea that most people are physically aggressive at a
young age. The differences observed between the present study and research by
Tremblay and Nagin could be due to several factors. There could simply be differences
between the Montreal samples used in previous studies and the Chicago sample used
here. Considering the very large proportion of children in the low-stable group, primary
caregivers in the present study may have responded to questions regarding their child’s
physical aggression with some type of social desirability bias. Measurement of physical
aggression may also contribute to these differences. Tremblay and Nagin consistently
use three items of physical aggression across their studies. The measures of
aggression used here differ from those typically used to model these trajectories.
The two models identified here also contained a modest and high-starting
desisting group and a low-rising and high-starting desisting group. These trends in
aggressive behavior also appear to be similar to those found in previous research (Cote
et al., 2004; Tremblay et al., 2004), as Nagin and Tremblay (1999; 2001) found a high-
desisting group and Tremblay et al. (2004) found a modest-rising group. The modest
group which remained stable over time and the group which started low, but increased
over time are not entirely consistent with the previous studies discussed here, but it is
important to note that the number of groups identified and the paths the trajectories take
may vary depending on many factors and will be discussed in more detail in the
Limitations and Future Research sections below.
Although a functional relationship could not be established due to very small
sample sizes in the high aggression groups, the results of this study indicate that further
examination of corporal punishment as a predictor into a group of chronically high
75
physical aggression is warranted. Children in the high-rising aggression group
experienced more corporal punishment on average than children in any of the other
trajectory groups, supporting the second hypothesis of this thesis (association between
frequency of corporal punishment and membership in a chronic high group of
aggression). Additionally, type of corporal punishment may play a role in group
membership. Children in the high physical aggression group were more likely to be
slapped or spanked and more likely to experience pushing, grabbing, or shoving by their
primary caregiver. Due to its relatively infrequent occurrence and lack of sample size in
these high groups, it could not be determined whether throwing something at the child is
associated with group membership. These findings partially support the third
hypothesis of the study (association between type of corporal punishment and
membership in a chronic high group of aggression).
These results add to the present literature on both corporal punishment and
trajectories of aggressive behavior in children. Most corporal punishment research
linking physical punishment to aggression has been cross-sectional in nature (Gershoff,
2002) and, to date, corporal punishment has not been linked to group-based models of
trajectories. Additionally, research on developmental trajectories of physical aggression
in children has found a link between harsh parenting and persistently aggressive
behavior (Cote et al., 2006; NICHD, 2004, Tremblay et al., 2004). The results of this
study identify a link between specific parenting practices (frequency and type of corporal
punishment) and membership into a chronic high group of aggressive behavior.
Demographic and family characteristics of children in the high aggression group
are also consistent with prior literature (Cote et al., 2006; Nagin & Tremblay, 1999;
76
2001; NICHD, 2004; Tremblay et al., 2004). On average, children in the high
aggression group were more likely to be male, black or Hispanic, and to have siblings
present in their household. The primary caregivers of these children were more likely to
be younger than the primary caregivers of children in the other groups. Primary
caregivers of children in the high aggression groups were also more likely to display
less warmth and more hostility in their caregiving.
Limitations
Although the present study adds to the literature on corporal punishment and
aggressive behaviors, it is not without its limitations. This study was largely exploratory
in nature and had several data limitations. The measures of physical aggression that
were employed, while consistent with some research (NICHD, 2004), differ from those
often used in group-based modeling of physical aggression trajectories in children (Cote
et al., 2006; Tremblay et al., 2004). Due to the fact that reduced versions of the CBCL
were administered throughout the PHDCN, there was not continuity in the aggression
items that were available across the waves of data. While it is typically inappropriate to
use the same measurement scale for a given trait over different stages of life (Nagin,
2005), the developmental period studied in this thesis is a relatively short one. Use of
the same measures across waves, however, would have allowed for more direct
conclusions to be drawn regarding the paths of the trajectories. By using the differing
measures that were available across waves, we are presented with the potential
limitation of determining whether change in a trajectory truly represents change in
aggressive behavior or whether it is simply a reflection of the changing measures.
As with any longitudinal dataset, cases were also lost in the PHDCN due to
attrition over time. While the trajectory modeling techniques used in the present study
77
can accommodate missing data (Nagin, 2005), due to the exploratory nature of the
study and issues with other missingness across the dependent variable, these cases
were simply dropped. The lack of cases may have contributed to the small number of
individuals in the high aggression group, which prevented the use of multinomial logit
regression to establish a relationship between corporal punishment and group
membership.
It should also be acknowledged that the additional missingness on aggression
items (beyond attrition) was not random, but was associated with race (Hispanic
individuals were more likely to have missing data) and income (lower income individuals
were more likely to have missing data). Given the patterns of missingness, imputation
was employed in an attempt to replace the missing values using as much information as
possible. All control variables and additional aggression items were included in the
regression models used for imputing missing values. Using a single imputation has
been shown to be more robust than listwise deletion and mean replacement in these
types of cases (Allison, 2009).
An additional data limitation is the fact that only three waves of data were
available. While this was a sufficient number to perform the technique used in this
study, it only allowed for linear models of the trajectories. Previous research on
trajectories of physical aggression has typically used between four and seven waves of
data. In the four groups identified by Nagin and Tremblay (1999; 2001), several
increases and decreases in aggressive behaviors occur within the general trends that
are recognized. For example, in Nagin and Tremblay’s (1999; 2001) sample, the chronic
high group exhibits peaks in aggressive behavior at both 10 and 14 years of age, with
78
the lowest levels of aggression occurring in between, at age 12. Despite the fact that
only three waves were available in the present study, the amount of time between
waves allowed the available data to span a total of 7 years. In previous studies using
less than four waves, the data collection period was much shorter (Tremblay et al.,
2004).
Finally, it should be noted that the sample for the present study should not be
generalized to other groups. The sample used here was composed of a specific age-
group (3 to 8 years of age), from one city in the United States (Chicago), during a
specific period of time (1994-2001). While there has been an extensive amount of
research on different age groups from various locations (Cote et al., 2006; Nagin &
Tremblay 1999; 2001, NICHD, 2004, Tremblay et al., 2004), this study is the first to
examine the association between corporal punishment and trajectory group
membership. Replication is necessary to confirm the results and extend them beyond a
single sample.
Trajectory groups are very useful tools for summarizing complex longitudinal
datasets (Nagin, 2005), however, the technique of group-based modeling of trajectories
has not been without its criticisms. One limitation of this method is possible model
misspecification in the event that the observed individual differences are actually drawn
from a continuous distribution, rather than a discrete distribution (Piquero, 2008;
Sampson, Laub, & Eggleston, 2004). A related criticism of the technique is the
grouping of heterogeneous individuals into relatively homogenous groups and the
concern that this raises in relation to interpretation of results. Specifically, concerns
have included the misconceptions that individuals actually belong to a group and that
79
individuals within a group will actually follow the trajectory specified (Sampson, Laub, &
Eggleston, 2004). The models identified using these techniques, including the models
found in the present study, are not meant to identify the true number of groups present
in a population, but to identify the simplest model that displays the distinctive features of
the population distribution of trajectories (Nagin, 2005). For example, it is possible that
a member of the high-rising group does not actually increase in aggression, but follows
a stable path of high aggression. It must be remembered that this technique is meant to
describe a more complex underlying reality (Nagin, 2005).
Additionally, Eggleston, Laub, and Sampson (2004) have recently questioned the
use of group-based modeling techniques under several conditions, including length of
follow-up time. They argue that a shorter follow-up period may impact the number of
groups identified, the shapes of the trajectories, and assignment to groups. In relation
to aggressive behavior, Nagin (2005) found that opposed to the four-group model
identified in the Montreal study (Nagin & Tremblay, 1999), a three-group model would
have been preferred based on the BIC had the length of follow-up been 6 to 13 years of
age, rather than 6 to 15 years of age. Eggleston, Laub, and Sampson (2004) performed
an analysis based on the classic data of Sheldon and Eleanor Glueck (1968). They
found that when follow-up time was nearly doubled, the peak age of criminality and the
group membership assignments were affected. It should be noted that the relatively
short follow-up period of the present study is susceptible to similar limitations.
Future Research
Given both the findings of the current study and the limitations presented above,
there are several implications for future research on this topic. Previous studies have
included sample sizes ranging from about 500 (Tremblay et al., 2004) to over 10,000
80
participants (approximately 1000 participants for several different age cohorts) (Cote et
al., 2006). While the sample size of the present study falls within the low end of this
range (n=681), it was limited by the small numbers of cases in the high aggression
group. A larger sample size with more cases in the chronic high group would
accommodate multinomial logistic regression, which is traditionally used to extend the
analysis beyond examination of the bivariate associations between risk factors and
group membership. This type of regression analysis examines certain risk factors as
predictors of membership in a high aggression group by controlling for correlations
between predictors and specifying the relationship between (the probability that a
randomly chosen population member belongs to group j) and each of the risk factors
(Nagin, 2005).
As discussed in the literature review and throughout this thesis, the multinomial
logistic regression analysis commonly follows the creation of group profiles and would
be an important follow-up to the present study. To obtain a sample that can
accommodate this type of regression analysis, it may be helpful to oversample those
with known risk factors for a chronic high trajectory of aggression in an attempt to
increase the number of cases in this group. Nevertheless, the profiles of group
membership established in the present study are useful descriptions. The associations
discovered here indicate that frequency and type of corporal punishment should be
examined further as predictors of membership in the chronic high aggression group.
In addition to using a larger sample, examining a longer follow-up period would be
helpful on several levels. First, it would assist in understanding the longer-term effects
of corporal punishment on physically aggressive behavior. It has also been noted that
81
while the number of groups identified typically plateaus at a sample size of 200
(D’Unger et al., 1998), longer follow-up periods may impact the number of groups
identified, the peak age of offending, and the individual-level group membership of
several trajectory groups (Eggleston, Laub, & Sampson, 2004). The group in which we
are most interested, the high-rising group, or the group which is still exhibiting the
behavior of interest at the close of the follow-up period, is likely to be the one most
affected by an extension of this timeframe (Nagin, 2005). The inclusion of more waves
of data would also be advantageous. The trajectory modeling techniques used in this
thesis allow the different trajectory groups to take on different shapes (Nagin, 2005).
The inclusion of more points for follow-up would allow trajectory shapes based on
quadratic or even cubic terms. As the follow-up period for these types of studies has
not been extended past the teenage years, it is difficult to predict the behavioral
patterns that we might observe in such a study. However, paths of violent offending
may be similar to those observed for criminal careers, in which offending appears to
decline as early adulthood approaches for all groups (Piquero, 2008).
Heterotypic continuity of physical aggression items should also be taken into
consideration. Nagin, Tremblay, and colleagues (Cote et al., 2006, Nagin & Tremblay,
1999; 2001; Tremblay et al., 2004) have consistently used items regarding fighting with
others, hitting, biting, or kicking others, bullying or intimidating others, and reacting with
anger and fighting to measure physical aggression. The selection and inclusion of items
measuring different manifestations of physical aggression over time would be of upmost
importance, especially if the follow-up period were extended. For example, bullying or
82
intimidating others may not be an appropriate measure of physical aggression if the
follow-up period were extended into adulthood.
The present study replicated and extended similar work by Tremblay, Nagin, and
colleagues, but was largely exploratory in nature. Given some of the criticisms of the
group-based approach, it is also important to examine the appropriateness of this
technique for the research question at hand. Muthén (as cited in Piquero, 2008) has
suggested that the standard HLM random effects model should be also be fitted, and
ruled out, before group-based modeling techniques should be employed. If the HLM
model fits better than the group-based model, there are not meaningful groups to be
found. Muthén (as cited in Piquero, 2008) has also argued that it should also be shown
that a more flexible model, such as Muthén’s growth mixture model, does not fit better
than the group-based model. Essentially, it is the responsibility of the researcher to
show that the group-based model fits the data better than another technique.
In addition to methodological implications for future research, the results of the
present study have implications for the extension of group-based modeling techniques
to other outcomes of corporal punishment. The link between corporal punishment and
externalizing behaviors has been one of the most prominent in the literature (Mulvaney
& Mebert, 2007), however, research also suggests a potential link between the
experience of corporal punishment and internalizing behavior problems. One area for
future research involves identifying distinct trajectories of internalizing behaviors, such
as depression, and examining corporal punishment as a predictor into problematic
groups. The potential impact of corporal punishment on the cognitive development of
83
young children has also been brought to light (Straus and Paschall, 1998) and also has
the potential to be examined using these techniques.
Besides modeling a single behavior of interest, Nagin (2005) has also outlined
methods for dual trajectory analysis. It has been well-documented that the use of
corporal punishment usually declines as children progress through adolescence
(Gershoff, 2002; Straus & Stewart, 1999). While researchers have hypothesized that
the use of physical punishment with younger children may have more negative
outcomes due to the frequency of its use and the potential for cumulative effects (Berlin
et al., 2009), it has also been hypothesized that the effect of corporal punishment on
violent behavior may be greatest in older children (Straus, 1994). The simultaneous
examination of trajectories of corporal punishment and trajectories of aggressive
behavior would allow for the examination of the connections between the evolution of
these two trajectories over time. Dual trajectory analysis may also be used to analyze
the links between two outcomes that evolve over different time periods. Nagin and
Tremblay (1999) have examined how group membership may impact a variety of
delinquent outcomes. In the manner just discussed, dual trajectory analysis could also
be used to examine trajectories of corporal punishment during childhood and criminal
activity (such as violent offending) later in life.
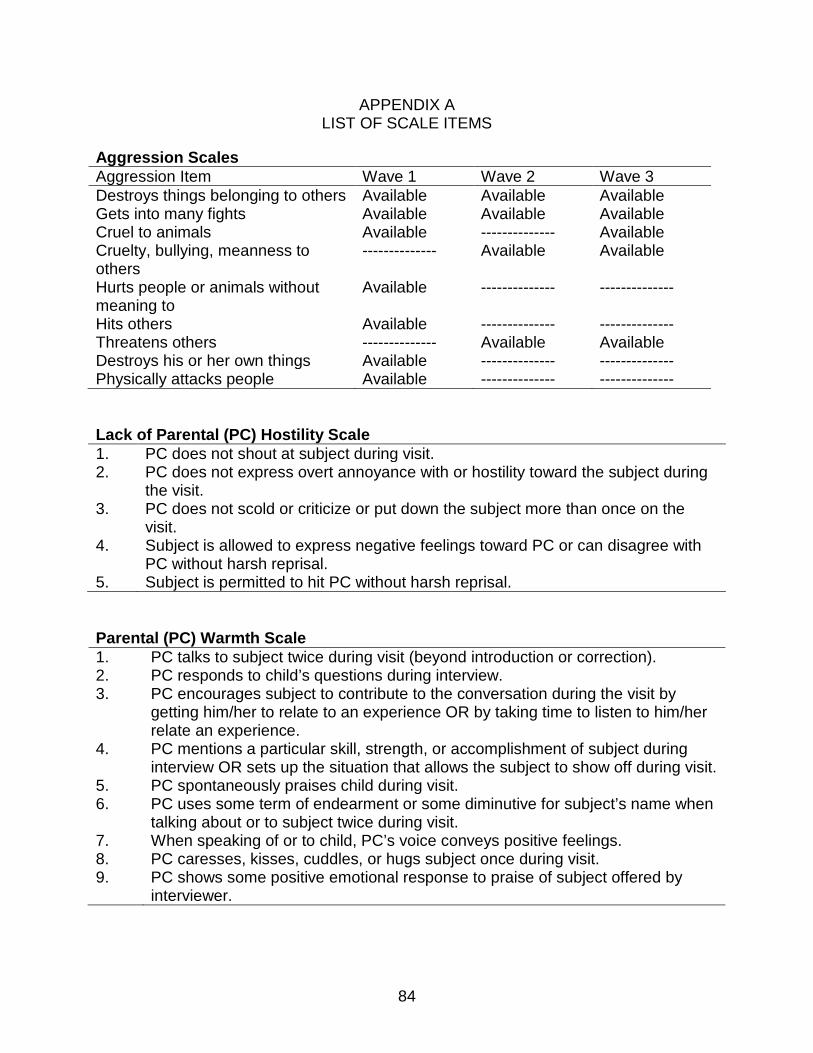
84
APPENDIX A LIST OF SCALE ITEMS
Aggression Scales Aggression Item Wave 1 Wave 2 Wave 3 Destroys things belonging to others Available Available Available Gets into many fights Available Available Available Cruel to animals Available -------------- Available Cruelty, bullying, meanness to others
-------------- Available Available
Hurts people or animals without meaning to
Available -------------- --------------
Hits others Available -------------- -------------- Threatens others -------------- Available Available Destroys his or her own things Available -------------- -------------- Physically attacks people Available -------------- --------------
Lack of Parental (PC) Hostility Scale 1. PC does not shout at subject during visit. 2. PC does not express overt annoyance with or hostility toward the subject during
the visit. 3. PC does not scold or criticize or put down the subject more than once on the
visit. 4. Subject is allowed to express negative feelings toward PC or can disagree with
PC without harsh reprisal. 5. Subject is permitted to hit PC without harsh reprisal. Parental (PC) Warmth Scale 1. PC talks to subject twice during visit (beyond introduction or correction). 2. PC responds to child’s questions during interview. 3. PC encourages subject to contribute to the conversation during the visit by
getting him/her to relate to an experience OR by taking time to listen to him/her relate an experience.
4. PC mentions a particular skill, strength, or accomplishment of subject during interview OR sets up the situation that allows the subject to show off during visit.
5. PC spontaneously praises child during visit. 6. PC uses some term of endearment or some diminutive for subject’s name when
talking about or to subject twice during visit. 7. When speaking of or to child, PC’s voice conveys positive feelings. 8. PC caresses, kisses, cuddles, or hugs subject once during visit. 9. PC shows some positive emotional response to praise of subject offered by
interviewer.
85
APPENDIX B
BIVARIATE RELATIONSHIPS
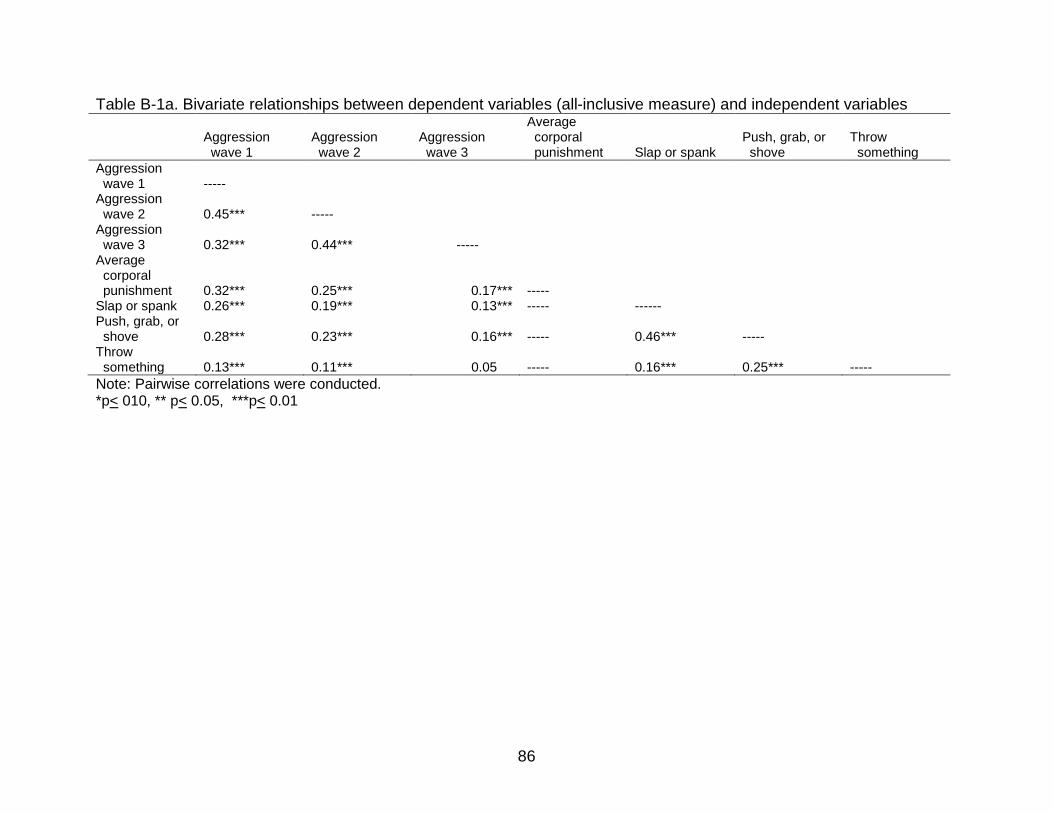
86
Table B-1a. Bivariate relationships between dependent variables (all-inclusive measure) and independent variables
Aggression wave 1
Aggression wave 2
Aggression wave 3
Average corporal punishment
Slap or spank
Push, grab, or shove
Throw something
Aggression wave 1
-----
Aggression wave 2
0.45***
-----
Aggression wave 3
0.32***
0.44***
-----
Average corporal punishment
0.32***
0.25***
0.17***
-----
Slap or spank 0.26*** 0.19*** 0.13*** ----- ------ Push, grab, or shove
0.28***
0.23***
0.16***
-----
0.46***
-----
Throw something
0.13***
0.11***
0.05
-----
0.16***
0.25***
-----
Note: Pairwise correlations were conducted. *p< 010, ** p< 0.05, ***p< 0.01
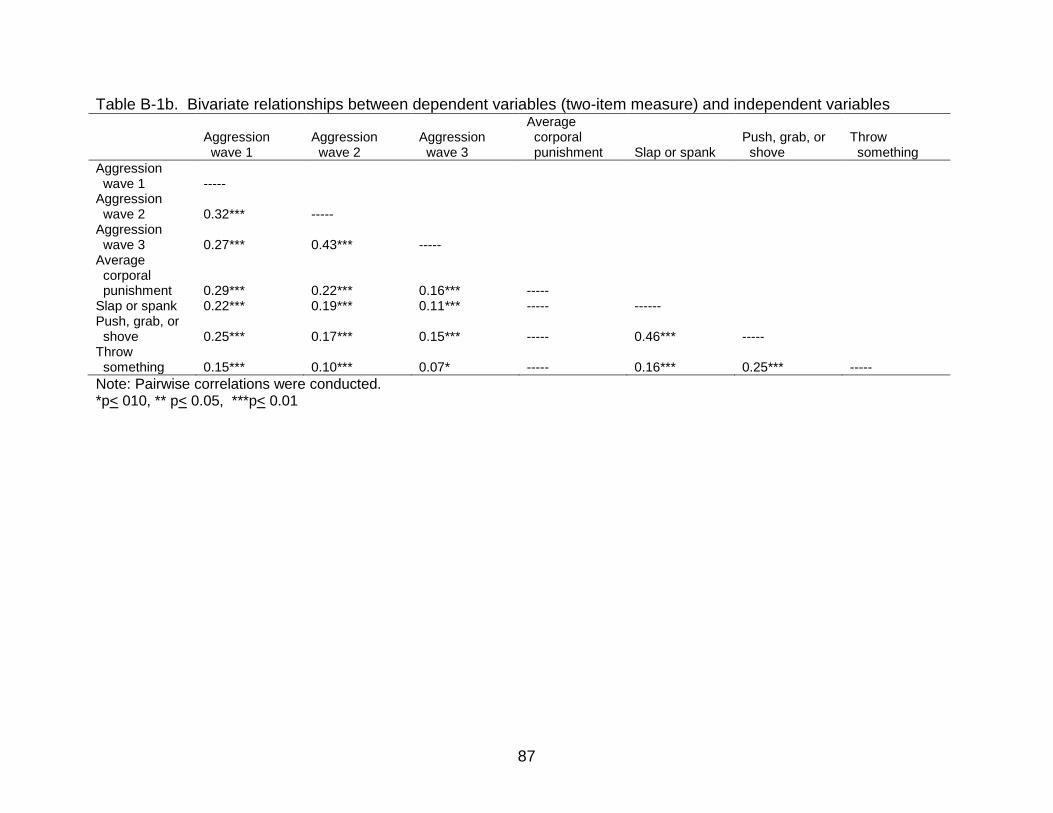
87
Table B-1b. Bivariate relationships between dependent variables (two-item measure) and independent variables
Aggression wave 1
Aggression wave 2
Aggression wave 3
Average corporal punishment
Slap or spank
Push, grab, or shove
Throw something
Aggression wave 1
-----
Aggression wave 2
0.32***
-----
Aggression wave 3
0.27***
0.43***
-----
Average corporal punishment
0.29***
0.22***
0.16***
-----
Slap or spank 0.22*** 0.19*** 0.11*** ----- ------ Push, grab, or shove
0.25***
0.17***
0.15***
-----
0.46***
-----
Throw something
0.15***
0.10***
0.07*
-----
0.16***
0.25***
-----
Note: Pairwise correlations were conducted. *p< 010, ** p< 0.05, ***p< 0.01
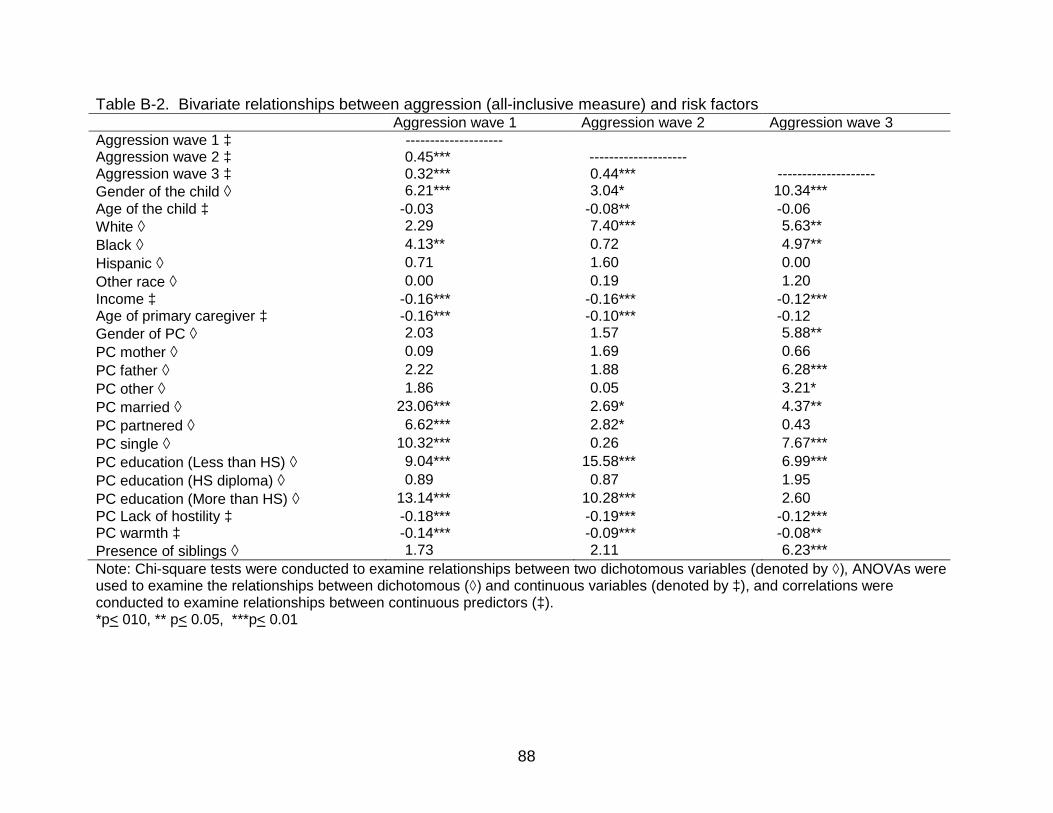
88
Table B-2. Bivariate relationships between aggression (all-inclusive measure) and risk factors Aggression wave 1 Aggression wave 2 Aggression wave 3 Aggression wave 1 ‡ -------------------- Aggression wave 2 ‡ 0.45*** -------------------- Aggression wave 3 ‡ 0.32*** 0.44*** -------------------- Gender of the child ◊ 6.21*** 3.04* 10.34*** Age of the child ‡ -0.03 -0.08** -0.06 White ◊ 2.29 7.40*** 5.63** Black ◊ 4.13** 0.72 4.97** Hispanic ◊ 0.71 1.60 0.00 Other race ◊ 0.00 0.19 1.20 Income ‡ -0.16*** -0.16*** -0.12*** Age of primary caregiver ‡ -0.16*** -0.10*** -0.12 Gender of PC ◊ 2.03 1.57 5.88** PC mother ◊ 0.09 1.69 0.66 PC father ◊ 2.22 1.88 6.28*** PC other ◊ 1.86 0.05 3.21* PC married ◊ 23.06*** 2.69* 4.37** PC partnered ◊ 6.62*** 2.82* 0.43 PC single ◊ 10.32*** 0.26 7.67*** PC education (Less than HS) ◊ 9.04*** 15.58*** 6.99*** PC education (HS diploma) ◊ 0.89 0.87 1.95 PC education (More than HS) ◊ 13.14*** 10.28*** 2.60 PC Lack of hostility ‡ -0.18*** -0.19*** -0.12*** PC warmth ‡ -0.14*** -0.09*** -0.08** Presence of siblings ◊ 1.73 2.11 6.23*** Note: Chi-square tests were conducted to examine relationships between two dichotomous variables (denoted by ◊), ANOVAs were used to examine the relationships between dichotomous (◊) and continuous variables (denoted by ‡), and correlations were conducted to examine relationships between continuous predictors (‡). *p< 010, ** p< 0.05, ***p< 0.01
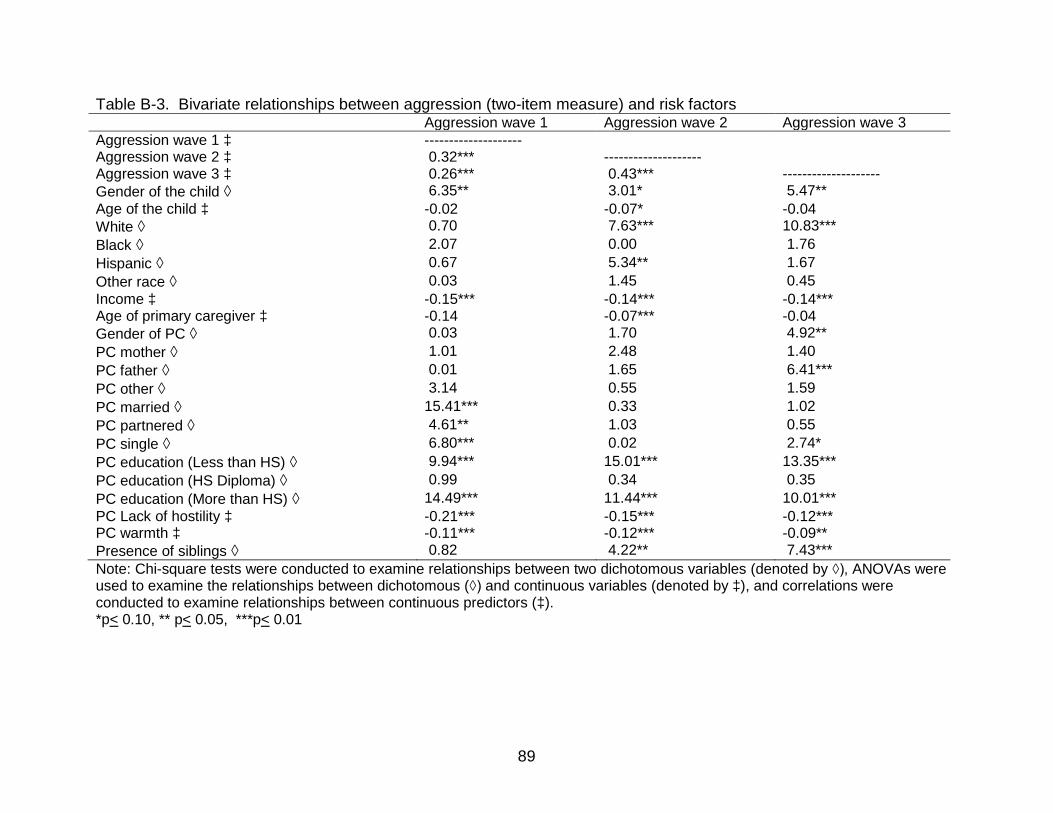
89
Table B-3. Bivariate relationships between aggression (two-item measure) and risk factors Aggression wave 1 Aggression wave 2 Aggression wave 3 Aggression wave 1 ‡ -------------------- Aggression wave 2 ‡ 0.32*** -------------------- Aggression wave 3 ‡ 0.26*** 0.43*** -------------------- Gender of the child ◊ 6.35** 3.01* 5.47** Age of the child ‡ -0.02 -0.07* -0.04 White ◊ 0.70 7.63*** 10.83*** Black ◊ 2.07 0.00 1.76 Hispanic ◊ 0.67 5.34** 1.67 Other race ◊ 0.03 1.45 0.45 Income ‡ -0.15*** -0.14*** -0.14*** Age of primary caregiver ‡ -0.14 -0.07*** -0.04 Gender of PC ◊ 0.03 1.70 4.92** PC mother ◊ 1.01 2.48 1.40 PC father ◊ 0.01 1.65 6.41*** PC other ◊ 3.14 0.55 1.59 PC married ◊ 15.41*** 0.33 1.02 PC partnered ◊ 4.61** 1.03 0.55 PC single ◊ 6.80*** 0.02 2.74* PC education (Less than HS) ◊ 9.94*** 15.01*** 13.35*** PC education (HS Diploma) ◊ 0.99 0.34 0.35 PC education (More than HS) ◊ 14.49*** 11.44*** 10.01*** PC Lack of hostility ‡ -0.21*** -0.15*** -0.12*** PC warmth ‡ -0.11*** -0.12*** -0.09** Presence of siblings ◊ 0.82 4.22** 7.43*** Note: Chi-square tests were conducted to examine relationships between two dichotomous variables (denoted by ◊), ANOVAs were used to examine the relationships between dichotomous (◊) and continuous variables (denoted by ‡), and correlations were conducted to examine relationships between continuous predictors (‡). *p< 0.10, ** p< 0.05, ***p< 0.01
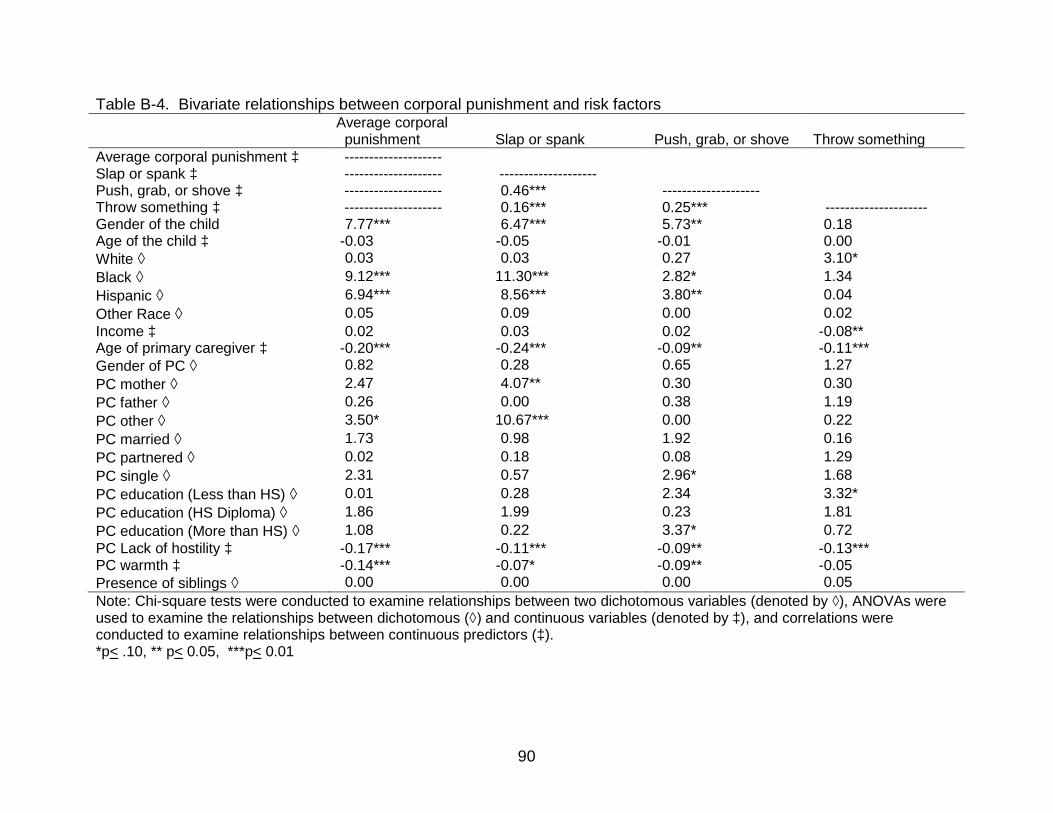
90
Table B-4. Bivariate relationships between corporal punishment and risk factors Average corporal
punishment Slap or spank
Push, grab, or shove
Throw something
Average corporal punishment ‡ -------------------- Slap or spank ‡ -------------------- -------------------- Push, grab, or shove ‡ -------------------- 0.46*** -------------------- Throw something ‡ -------------------- 0.16*** 0.25*** --------------------- Gender of the child 7.77*** 6.47*** 5.73** 0.18 Age of the child ‡ -0.03 -0.05 -0.01 0.00 White ◊ 0.03 0.03 0.27 3.10* Black ◊ 9.12*** 11.30*** 2.82* 1.34 Hispanic ◊ 6.94*** 8.56*** 3.80** 0.04 Other Race ◊ 0.05 0.09 0.00 0.02 Income ‡ 0.02 0.03 0.02 -0.08** Age of primary caregiver ‡ -0.20*** -0.24*** -0.09** -0.11*** Gender of PC ◊ 0.82 0.28 0.65 1.27 PC mother ◊ 2.47 4.07** 0.30 0.30 PC father ◊ 0.26 0.00 0.38 1.19 PC other ◊ 3.50* 10.67*** 0.00 0.22 PC married ◊ 1.73 0.98 1.92 0.16 PC partnered ◊ 0.02 0.18 0.08 1.29 PC single ◊ 2.31 0.57 2.96* 1.68 PC education (Less than HS) ◊ 0.01 0.28 2.34 3.32* PC education (HS Diploma) ◊ 1.86 1.99 0.23 1.81 PC education (More than HS) ◊ 1.08 0.22 3.37* 0.72 PC Lack of hostility ‡ -0.17*** -0.11*** -0.09** -0.13*** PC warmth ‡ -0.14*** -0.07* -0.09** -0.05 Presence of siblings ◊ 0.00 0.00 0.00 0.05 Note: Chi-square tests were conducted to examine relationships between two dichotomous variables (denoted by ◊), ANOVAs were used to examine the relationships between dichotomous (◊) and continuous variables (denoted by ‡), and correlations were conducted to examine relationships between continuous predictors (‡). *p< .10, ** p< 0.05, ***p< 0.01
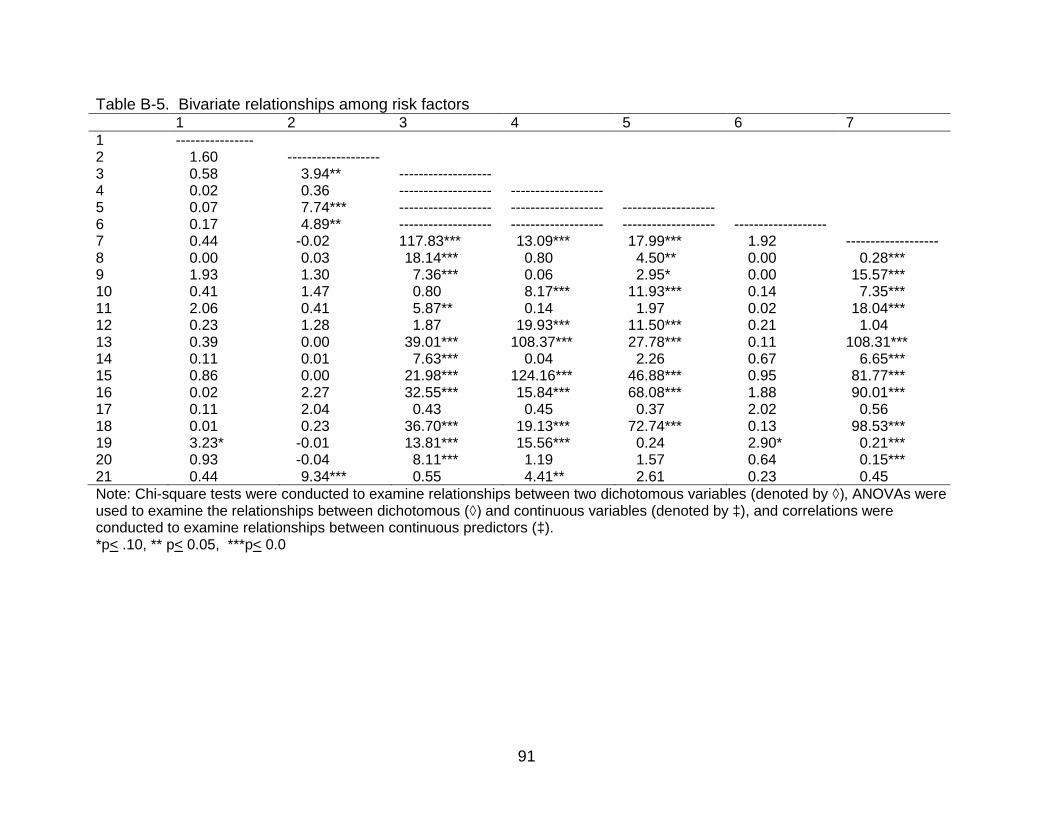
91
Table B-5. Bivariate relationships among risk factors 1 2 3 4 5 6 7 1 ---------------- 2 1.60 ------------------- 3 0.58 3.94** ------------------- 4 0.02 0.36 ------------------- ------------------- 5 0.07 7.74*** ------------------- ------------------- ------------------- 6 0.17 4.89** ------------------- ------------------- ------------------- ------------------- 7 0.44 -0.02 117.83*** 13.09*** 17.99*** 1.92 ------------------- 8 0.00 0.03 18.14*** 0.80 4.50** 0.00 0.28*** 9 1.93 1.30 7.36*** 0.06 2.95* 0.00 15.57*** 10 0.41 1.47 0.80 8.17*** 11.93*** 0.14 7.35*** 11 2.06 0.41 5.87** 0.14 1.97 0.02 18.04*** 12 0.23 1.28 1.87 19.93*** 11.50*** 0.21 1.04 13 0.39 0.00 39.01*** 108.37*** 27.78*** 0.11 108.31*** 14 0.11 0.01 7.63*** 0.04 2.26 0.67 6.65*** 15 0.86 0.00 21.98*** 124.16*** 46.88*** 0.95 81.77*** 16 0.02 2.27 32.55*** 15.84*** 68.08*** 1.88 90.01*** 17 0.11 2.04 0.43 0.45 0.37 2.02 0.56 18 0.01 0.23 36.70*** 19.13*** 72.74*** 0.13 98.53*** 19 3.23* -0.01 13.81*** 15.56*** 0.24 2.90* 0.21*** 20 0.93 -0.04 8.11*** 1.19 1.57 0.64 0.15*** 21 0.44 9.34*** 0.55 4.41** 2.61 0.23 0.45 Note: Chi-square tests were conducted to examine relationships between two dichotomous variables (denoted by ◊), ANOVAs were used to examine the relationships between dichotomous (◊) and continuous variables (denoted by ‡), and correlations were conducted to examine relationships between continuous predictors (‡). *p< .10, ** p< 0.05, ***p< 0.0
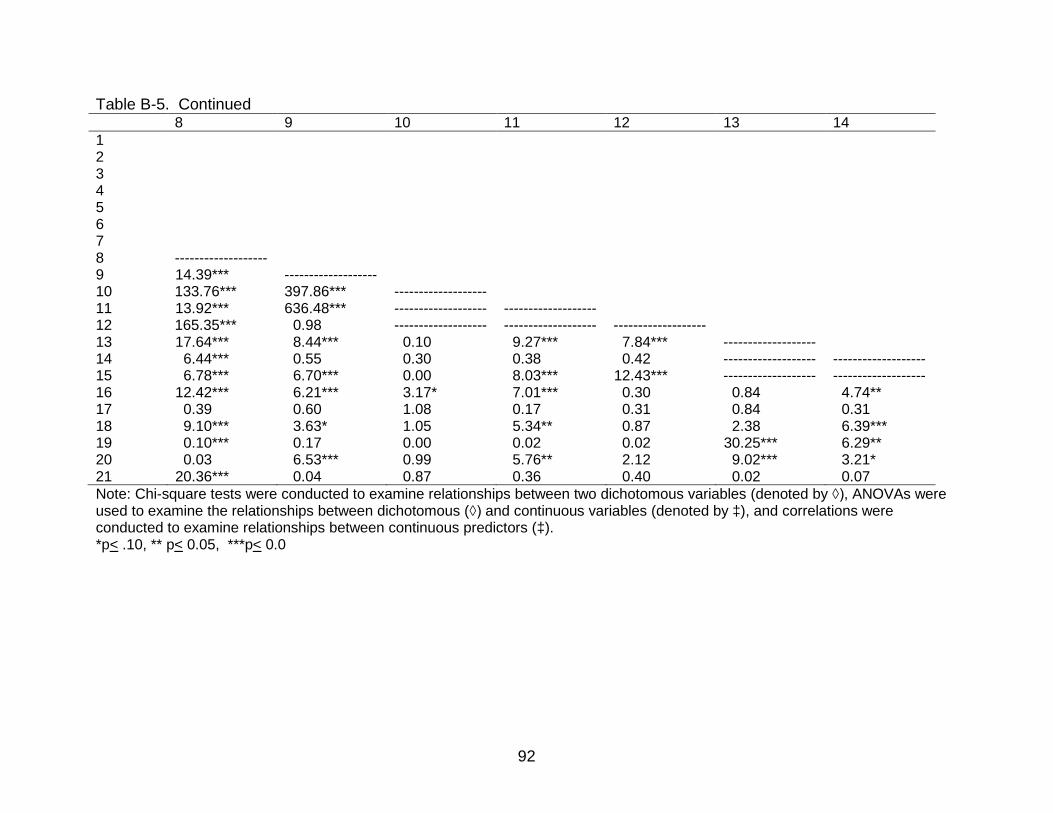
92
Table B-5. Continued 8 9 10 11 12 13 14 1 2 3 4 5 6 7 8 ------------------- 9 14.39*** ------------------- 10 133.76*** 397.86*** ------------------- 11 13.92*** 636.48*** ------------------- ------------------- 12 165.35*** 0.98 ------------------- ------------------- ------------------- 13 17.64*** 8.44*** 0.10 9.27*** 7.84*** ------------------- 14 6.44*** 0.55 0.30 0.38 0.42 ------------------- ------------------- 15 6.78*** 6.70*** 0.00 8.03*** 12.43*** ------------------- ------------------- 16 12.42*** 6.21*** 3.17* 7.01*** 0.30 0.84 4.74** 17 0.39 0.60 1.08 0.17 0.31 0.84 0.31 18 9.10*** 3.63* 1.05 5.34** 0.87 2.38 6.39*** 19 0.10*** 0.17 0.00 0.02 0.02 30.25*** 6.29** 20 0.03 6.53*** 0.99 5.76** 2.12 9.02*** 3.21* 21 20.36*** 0.04 0.87 0.36 0.40 0.02 0.07 Note: Chi-square tests were conducted to examine relationships between two dichotomous variables (denoted by ◊), ANOVAs were used to examine the relationships between dichotomous (◊) and continuous variables (denoted by ‡), and correlations were conducted to examine relationships between continuous predictors (‡). *p< .10, ** p< 0.05, ***p< 0.0
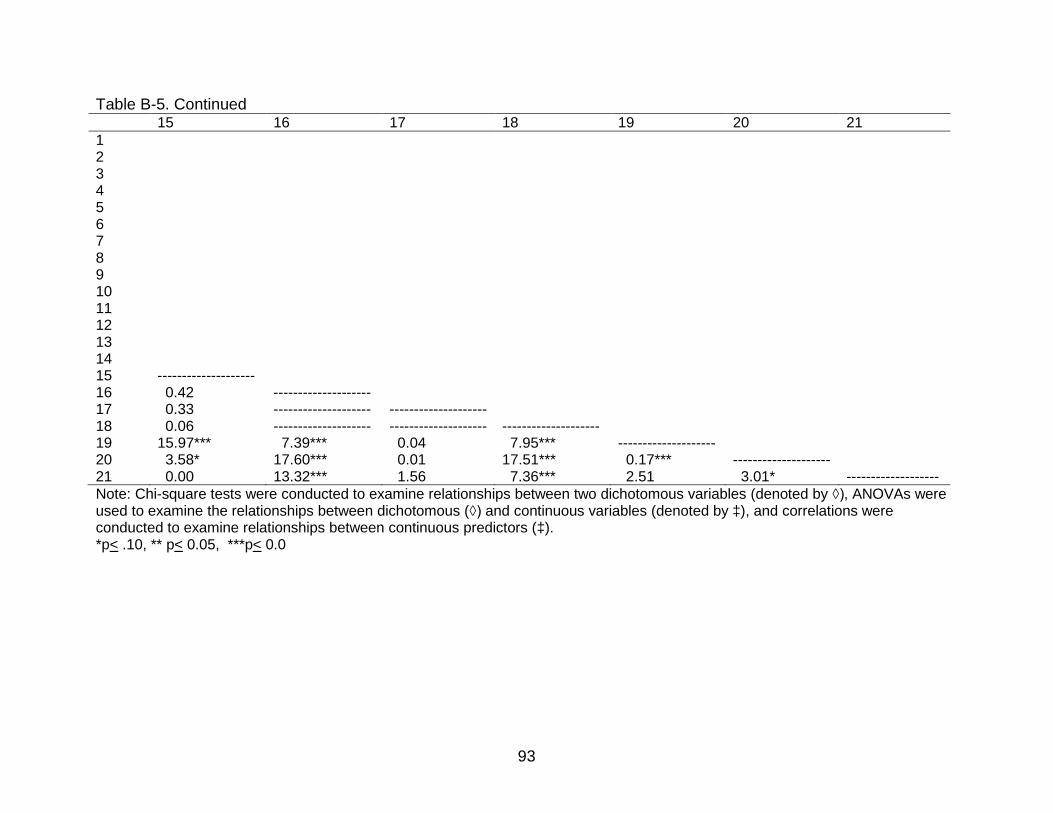
93
Table B-5. Continued 15 16 17 18 19 20 21 1 2 3 4 5 6 7 8 9 10 11 12 13 14 15 -------------------- 16 0.42 -------------------- 17 0.33 -------------------- -------------------- 18 0.06 -------------------- -------------------- -------------------- 19 15.97*** 7.39*** 0.04 7.95*** -------------------- 20 3.58* 17.60*** 0.01 17.51*** 0.17*** -------------------- 21 0.00 13.32*** 1.56 7.36*** 2.51 3.01* ------------------- Note: Chi-square tests were conducted to examine relationships between two dichotomous variables (denoted by ◊), ANOVAs were used to examine the relationships between dichotomous (◊) and continuous variables (denoted by ‡), and correlations were conducted to examine relationships between continuous predictors (‡). *p< .10, ** p< 0.05, ***p< 0.0
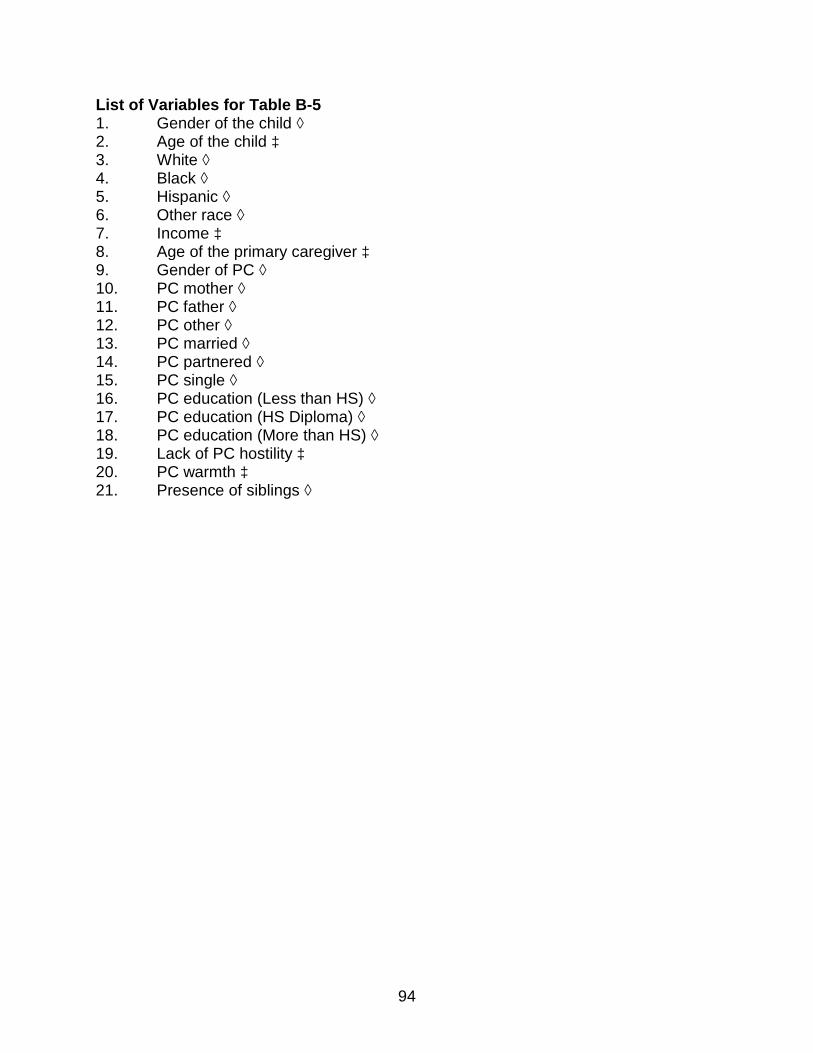
94
List of Variables for Table B-5 1. Gender of the child ◊ 2. Age of the child ‡ 3. White ◊ 4. Black ◊ 5. Hispanic ◊ 6. Other race ◊ 7. Income ‡ 8. Age of the primary caregiver ‡ 9. Gender of PC ◊ 10. PC mother ◊ 11. PC father ◊ 12. PC other ◊ 13. PC married ◊ 14. PC partnered ◊ 15. PC single ◊ 16. PC education (Less than HS) ◊ 17. PC education (HS Diploma) ◊ 18. PC education (More than HS) ◊ 19. Lack of PC hostility ‡ 20. PC warmth ‡ 21. Presence of siblings ◊
95
LIST OF REFERENCES
Achenbach, T. (1991). Manual for the Child Behavior Checklist/4-18 and 1991 Profile. Burlington, VT. University of Vermont Department of Psychiatry. Achenbach, T. (1992). Manual for the Child Behavior Checklist/2-3 and 1992 Profile. Burlington, VT. University of Vermont Department of Psychiatry. Achenbach, T.M. & Rescorla, L.A. (2000). Manual for ASEBA preschool forms & profiles. Burlington, University of Vermont, Research Center for Children,Youth, & Families. Agnew, R. (2001). Building on the foundation of general strain theory: Specifying the types of strain most likely to lead to crime and delinquency. Journal of Research in Crime and Delinquency, 38, 319-361. Agnew, R. (2006). Pressured into Crime: An Overview of General Strain Theory. Los Angeles: Roxbury Publishing. Akers, R.L. (1985). Deviant Behavior: A Social Learning Approach (3rd ed.). Belmont, CA: Wadsworth Publishing Company. Akers, R.L., Krohn, M.D., Lanza-Kaduce, L., & Radosevich, M.J. (1979). Social learning and deviant behavior: A specific test of a general theory. American Sociological Review, 44, 635-655. Allison, Paul D. (2009). Missing Data. In R.E. Millsap & A. Maydeu-Olivares (Eds.), The SAGE Handbook of Quantitative Methods in Psychology, (72-89). Thousand Oaks, CA: Sage. Baumrind, D. (1996). A blanket injunction against disciplinary use of spanking is not warranted by the data. Pediatrics, 98, 828-831. Berlin, L.J., Malone, P.S., Ayoub, C., Ispa, J.M., Fine, M.A., Brooks-Gunn, J. Brady- Smith, C., & Bai, Y. (2009). Correlates and consequences of spanking and verbal punishment for low-income white, African American, and Mexican American toddlers. Child Development, 80(5), 1403-1420. Blumstein, A., Cohen, J., Roth, J., & Visher, C. (1986). Criminal careers and “career criminals” (Vols. 1 & 2). Washington, DC: National Academy Press. Broidy, L.M., Nagin, D.S., Tremblay, R.E., Bates, J.E., Brame, B., Dodge, K.A., … Vitaro, F. (2003). Developmental trajectories of childhood disruptive behaviors and adolescent delinquency: A Six-site, cross-national study. Developmental Psychology, 39(2), 222-245.
96
Bryk, A.S. & Raudenbush, S.W. (1987). Application of hierarchical linear models to assessing change. Psychological Bulletin, 101, 147-158. Bryk, A.S. & Raudenbush, S.W. (1992). Hierarchical Linear Models for Social and Behavioral Research: Application and Data Analysis Methods. Newbury Park, CA: Sage Publications, Inc. Caldwell, B. & Bradley, R. (1984). Home Observation for Measurement of the Environment (HOME) - Revised Edition. University of Arkansas, Little Rock. Cohen, P., Brook, J.S., Cohen, J., Velez, N., & Garcia, M. (1990). Common and uncommon pathways to adolescent psychopathology and problem behavior. In L.N. Robins & M. Rutter (Eds.), Straight and Devious Pathways from Childhood to Adulthood (242-258). New York: Cambridge University Press. Cote, S.M., Vaillancourt, T., LeBlanc, J.C., Nagin, D.S., & Tremblay, R.E. (2006). The development of physical aggression from toddlerhood to pre-adolescence: A nation wide longitudinal study of Canadian children. Journal of Abnormal Child Psychology, 34(1), 71-85. Day, R.D., Peterson, G.W., & McCracken, C. (1998). Predicting spanking of younger and older children by mothers and fathers. Journal of Marriage and Family, 60, 79-94. D’Unger, A.V., Land, K.C., McCall, P.L., & Nagin, D.S. (1998). How many latent classes of delinquent/criminal careers? Results from mixed poisson regression analyses of the London, Philadelphia, and Racine cohort studies. American Journal of Sociology, 103, 1593-1630. Earls, F.J., Brooks-Gunn, J., Raudenbush, S.W., & Sampson, R.J. (1994). PHDCN version of the CBCL, unpublished manual. Earls, F.J., Brooks-Gunn, J., Raudenbush, S.W., & Sampson, R.J. (1994). PHDCN version of the CTSS, unpublished manual. Earls, F.J. & Visher, C.A. (1997). Project on Human Development in Chicago Neighborhoods: A Research update. NIJ Research in brief. Washington, D.C.: U.S. Department of Justice, Office of Justice Programs, National Institute of Justice, NCJ 163603 (9). Eggleston, E.P., Laub, J.H., & Sampson, R.J. (2004). Methodological sensitivities to latent class analysis of long-term criminal trajectories. Journal of Quantitative Criminology, 20, 1-26.
97
Eron, D. Huesman, L.R.,& Zelli, A. (1991). The role of parental variables in the learning of aggression. In D.J. Pepler & K.H. Rubin (Eds.), The Development and Treatment of Childhood Aggression (169-188). Hillsdale, N.J.: Erlbaum. Fuligni, A.S., Han, W., Brooks-Gunn, J. (2004). The Infant-toddler HOME in the 2nd
and 3rd years of life. Parenting: Science and Practice, 4(2-3),139-159. Gelles, R.J. (1974). The Violent Home: A Study of Physical Aggression Between Husbands and Wives. Beverly Hills: Sage Publications, Inc. Gelles, R.J. (1982) Domestic criminal violence. In M.E. Wolfgang & N.A. Weiner (Eds.), Criminal Violence (201-235). Thousand Oaks, CA: Sage Publications, Inc. Gelles, R.J. & Straus, M.A. (1988). Intimate Violence. New York: Simon & Schuster. Gershoff, E.T. (2002). Corporal punishment by parents and associated child behaviors and experiences: A meta-analytic review. Psychological Bulletin, 128(4), 539-579. Gershoff, E.T. &Bitensky, S.H. (2007). The Case against corporal punishment of children: Converging evidence from social science research and international human rights law and implications for U.S. public policy. Psychology, Public Policy, and Law, 13(4), 231-272. Glueck, S. & Glueck, E. (1968). Delinquents and Nondelinquents in Perspective. Cambridge: Harvard University Press. Goldstein, W.H. (1995). Multilevel Statistical Models (2nd ed.). London: Edward Arnold. Gottfredson, M. R.&Hirchi, T. (1990). A General Theory of Crime. Stanford, CA: Stanford University Press. Grogan-Kaylor, A. (2005).Corporal punishment and the growth trajectory of children’s antisocial behavior. Child Maltreatment, 10(3), 283-292. Han, W., Leventhal, T., &Linver, M.R. (2004). The Home observation for measurement of the environment (HOME) in middle childhood: A study of three large-scale data sets. Parenting: Science and Practice, 4(2-3), 189-210. Hay, D.F. (2005). The Beginnings of aggression in infancy. In R.E. Tremblay, W.W. Hartup, & J. Archer (Eds.), Developmental Origins of Aggression (107-132). New York: Guilford Press.
98
Hicks-Pass, S. (2009). Corporal punishment in America today: Spare the rod, spoil the child? A Systematic review of the literature. Best Practices in Mental Health, 5(2), 71-88. Holden, G.W., Coleman, S.M., & Schmidt, K.L. (1995). Why 3-year-old children get spanked: Parent and child determinants as reported by college-educated mothers. Merrill-Palmer Quarterly, 41, 431-452. Keenan, K. & Wakschlag, L.S. (2000). More than the terrible twos: The nature and severity of behavior problems in clinic-referred preschool children. Journal of Abnormal Child Psychology, 28, 33-46. Kingston, L. & Prior, M. (1995). The Development of patterns of stable, transient, and school-age onset aggressive behavior in young children. Journal of the American Academy of Child and Adolescent Psychiatry, 34, 348-358. Larzelere, R.E. (1986). Moderate spanking: Model or deterrent of children’s aggression in the family? Journal of Family Violence, 1(1), 27-36. Larzelere, R.E. & Merenda, J.A. (1994). The effectiveness of parental discipline for toddler misbehavior at different levels of child distress. Family Relations, 43, 480-488. Larzelere, R.E. (1996). A Review of the outcomes of parental use of nonabusive or customary physical punishment. Pediatrics, 98(4), 824-828. Larzelere, R.E. (2000). Child outcomes of non-abusive and customary corporal punishment by parents: An updated literature review. Unpublished manuscript; University of Nebraska Medical Center, Omaha, and Father Flanagan’s Boys’ Home, Boys Town, NE. Larzelere, R.E. & Kuhn, B.R. (2005). Comparing child outcomes of physical punishment and alternative disciplinary tactics: A Meta-analysis. Clinical Child and Family Psychology Review, 8(1), 1-37. Linver, M.R., Brooks-Gunn, J., & Cabrera (2004). The Home observation for measurement of the environment (HOME) inventory: The Derivation of conceptually designed subscales. Loeber, R., Drinkwater, M., Yin, Y., Anderson, S.J., Schmidt, L.C., & Crawford, A. (2000). Stability of family interaction from ages 6 to 18. Journal of Abnormal Child Psychology, 28, 353-369. McArdle, J.J. & Epstein, D. (1987). Latent growth curves with within developmental structural equation models. Child Development, 58, 110-113.
99
Moffit, T. (1993). Adolescence-limited and life-course-persistent antisocial behavior: A developmental taxonomy. Psychological Review, 100, 674-701. Mulvaney, M.K. & Mebert, C.J. (2007). Parental corporal punishment predicts behavior problems in early childhood. Journal of Family Psychology, 21(3), 389-397. Munson, J.A., McMahon, R.J., & Spieker, S.J. (2001). Structure and variability in the developmental trajectory of children’s externalizing problems: Impact of infant attachment, maternal depressive symptomatology, and child sex. Development and Psychopathology, 13, 277-296. Nagin, D.S. (1999). Analyzing developmental trajectories: A semi-parametric, group- based approach. Psychological Methods, 4, 139-177. Nagin, D.S. (2005). Group-Based Modeling of Development. Cambridge: Harvard University Press. Nagin, D.S. & Tremblay, R.E. (1999). Trajectories of boys’ physical aggression, opposition, and hyperactivity on the path to physically violent and nonviolent juvenile delinquency. Child Development, 70(5), 1181-1196. Nagin, D.S. & Tremblay, R.E. (2001). Parental and early childhood predictors of persistent physical aggression in boys from kindergarten to high school. Archives of General Psychiatry, 58, 389-394. Nagin, D.S. & Tremblay, R.E. (2005). Developmental trajectory groups: Fact or useful statistical fiction? Criminology, 43(4), 873-904. NICHD Early Child Care Research Network (2004).Trajectories of physical aggression from toddlerhood to middle childhood. Monographs of the Society for Research in Child Development.Serial No.278, Vol.69, 4. Paolucci, E.O. & Violato, C. (2004). A Meta-analysis of the published research on the affective, cognitive, and behavioral effects of corporal punishment. The Journal of Psychology, 138(3), 197-221. Piquero, A. R. (2008). Taking stock of developmental trajectories of criminal activity over the life course. In A.M. Liberman (Ed.), The Long View of Crime: A Synthesis of Longitudinal Research (23-78). New York: Springer. Raudenbush, S.W. (2001). Comparing personal trajectories and drawing causal inferences from longitudinal data. Annual Review of Psychology, 52, 501-525. Regalado, M., Sareen, H., Inkelas, M., Wissow, L.S.,& Halfon, N. (2004). Parents’ discipline of young children: Results from the National Survey of Early Childhood. Pediatrics, 113, 1952-1958.
100
Sampson, R.J., Laub, J.H., & Eggleston, E.P. (2004). On the robustness and validity of groups. Journal of Quantitative Criminology, 20, 37-42. Sears, R.R., Maccoby, E.C.,& Levin, H. (1957). Patterns of Child Rearing. New York: Harper & Row Publications, Inc. Selner-O'Hagan, M & Earls, F. (1994). PHDCN version of the HOME Inventory. unpublished manual. Simons, R.L. Johnson, C., & Conger, R.D. (1994). Harsh corporal punishment versus quality of parental involvement as an explanation of child maladjustment. Journal of Marriage and Family, 56(3), 591-607. Smith, J.R.,& Brooks-Gunn, J. (1997). Correlates and consequences of harsh discipline for young children. Archives of Pediatric and Adolescent Medicine, 151, 777-786. Sroufe, L.A., Egeland, B. Carlson, E.A., & Collins, W.A. (2005). The development of the person: The Minnesota Study of Risk and Adaptation from Birth to Adulthood. New York: Guilford Press. Stacks, A.M. Oshio, T., Gerard, J., & Roe, J. (2009). The moderating effect of parental warmth on the association between spanking and child aggression: A longitudinal approach. Infant and Child Development, 18, 178-194. Strassberg, Z., Dodge, K.A., Pettit, G.S., & Bates, J.E. (1994). Spanking in the home and children’s subsequent aggression toward kindergarten peers. Development and Psychopathology, 6, 445-461. Straus, M.A., Gelles, R., & Steinmetz, S.K. (1980). Behind Closed Doors: Violence in the American Family. New York: Doubleday. Straus, M.A. & Hamby, S.L. (1997). Measuring physical and psychological maltreatment of children with the Conflict Tactics Scales. In G.K. Kantor & J.Jsinski (Eds.), Out of the Darkness: Contemporary Research Perspectives on Family Violence. Thousand Oaks, CA: Sage. Straus, M.A., Hamby, S.L., Finkelhor, D., Moore, D., & Runyan, D. (1998). Identification of child maltreatment with the parent child Conflict Tactics Scales: Development and psychometric data for a national sample of American parents. Child Abuse and Neglect, 22, 249-270. Straus, M.A. (1994). Beating the Devil Out of Them: Corporal Punishment in American Families. New York: Lexington Books.
101
Straus M.A. & Paschall, M.J. (1998, August). Corporal punishment by mothers and child’s cognitive development: A longitudinal study. Research on a nationally representative sample of 960 children presented at the 14th World Congress of Sociology, Montreal, Canada. Straus, M.A., Sugarman, D.B., & Giles-Sims, J. (1997). Spanking by parents and subsequent antisocial behavior of children. Archives of Pediatric and Adolescent Medicine, 151, 761-767. Tremblay, R.E., Nagin, D.S., Seguin, J.R., Zoccolollo, M., Zelazo, P.D., Boivin, M., Perusse, D., &Japel, C. (2004). Physical aggression during early childhood: Trajectories and predictors. Pediatrics, 114(1), 43-50. Tremblay, R.E. & Nagin, D.S. (2005). The developmental origins of physical aggression in humans. In R.E. Tremblay, W.W. Hartup, & J. Archer (Eds.), Developmental Origins of Aggression (83-106). New York: Guilford Press. Wisslow, L.S. (2001). Ethnicity, income, and parenting contexts of physical punishment in a national sample of families with young children. Child Maltreatment, 6, 118-129.
102
BIOGRAPHICAL SKETCH
Kristin A. Bell attended college at the University of Florida from 2004 to 2008.
She graduated Summa Cum Laude in May 2008, receiving her Bachelor of Arts degree
in criminology and Bachelor of Science degree in psychology. Her undergraduate
research investigated help-seeking behaviors of victims of dating violence. Currently,
she is a graduate student in the Department of Sociology and Criminology and Law in
the Division of Criminology, Law, and Society at the University of Florida. Her research
interests include criminological theory, quantitative methods, and aggression and violent
behavior, specifically between intimate groups. Future plans include pursuing her PhD
at a university in the northeast.