
Techniques for transformation – exploring the practicalities of “beta codex“ change management
Exploring structural transformation:a labour-based analysis of the evolution of French agricultural holdings
2000-2010
Bignebat, Céline1; Bosc, Pierre-Marie2; Perrier-Cornet, Philippe3
1. INRA, UMR SADAPT & DIAL
2. CIRAD, UMR MOISA
3. INRA, UMR MOISA
* Correspondence: [email protected]
Paper prepared for presentation at the 160th EAAE Seminar ‘Rural Jobs and the CAP‘, Warsaw, Poland, December 1-2, 2016
Copyright 2016 by Authors. All rights reserved. Readers may make verbatim copies of this document for non-commercial purposes by any means, provided that this copyright notice appears on all such copies.
1
Exploring structural transformation:
a labour-based analysis of the evolution of French agricultural holdings
2000-2010
Céline Bignebat (INRA, UMR SADAPT & DIAL)1*
Pierre-Marie Bosc (CIRAD, UMR MOISA)2,
Philippe Perrier-Cornet (INRA, UMR MOISA)3
Abstract
The question of farm size has long been a concern in the agricultural economics
literature. The observation of a long-lasting persistence of so-called small farms drew the
attention of numerous researchers. The size of farms is often approximated by the farm area in
hectares or the added value and gross margin. We propose to investigate the opportunity to
use labour (family labour and hired, permanent and seasonal, wage labour) as an entry point
for a typology of agricultural holdings, with an application on French data from the Census
collected in 2000 and 2010. We show that two dynamics are at stake: an evolution towards
off-farm labour for the smallest farms relying on family labour; a convergence towards a
model based on hired wage labour for the largest family farms.
JEL: D22, D13, J43, Q12
Keywords: Agricultural labour, farm size, France
1 [email protected], 16, rue Claude Bernard, 75231 Paris Cedex 05 Paris, France (Corresponding
author)* 2 [email protected], 73, rue Jean-François Breton, 34398 Montpellier Cedex 5, France 3 [email protected], 2, place Viala, 34060 Montpellier Cedex 1, France
2
Introduction4
The question of farm size has long been a concern in the agricultural economics literature
(Eastwood and al. 2010 for a review). The observed persistence of small farms raised, in
particular, the question of the relationship between farm size and productivity (e.g. Barrett et
al., 2010). In such studies, the size of farms is often approximated by the farm area in hectares
(e.g, Butault and Delame, 2005). The added value and the gross margin are used as a measure
of farm size as well. The latter definition of farm size is adopted by the European Union (EU)
in the framework of the Farm Accountancy Data Network (FADN) where the economic
dimension is constructed for each farm in terms of European Size Unit (ESU)5.
However, those standards of measurement exhibit drawbacks: first, the farm area is
measured whatever the type of crop cultivated; second the economic dimension produced in
the EU framework describes a potential gross margin computed on the basis of standard
transformation coefficients applied to the area cultivated according to regions and cropping
systems. We propose to investigate the opportunity to use labour (namely, family labour and
hired wage labour, permanent and seasonal) as a measure of farm size and investigate the
evolution of French farms between 2000 and 2010.6
The first section presents a short review of the respective role and weight of family
labour and hired wage labour as presented in the agricultural economics literature. On this
basis, we propose, in the second section, a typology of French agricultural holdings based on
4 This research is funded by and discussed in the framework of the World Agricultural Watch (FAO, 2012)
http://www.worldagricultureswatch.org/ 5 http://ec.europa.eu/agriculture/rica/methodology1_en.cfm under the title “The economic size of farms” for a
definition of the European Size Unit (ESU), last accessed October 2015 6 A more precise static analysis (Census 2000) is available in a previous version of the paper (Bignebat et al.,
2015)

3
their use of labour at the farm level: we distinguish thereby family labour, seasonal hired
wage labour and permanent hired wage labour. In the third section, we apply the methodology
on the French agricultural Censuses 2000 and 2010. The fourth section characterizes the
holdings belonging to the groups defined in the typology by using econometric tools and draw
conclusions on the evolution of the agricultural holdings across years. We conclude on the
methodological and empirical contribution of the paper.
1. General question: farm size and family farming
1.1. Agricultural labour in the agricultural economics literature
A significant part of the agricultural economics literature deals with the historical debate
on farm size: the question of a productivity inverse relationship aims at exploring why small
farms could be found to be more productive than larger ones. This debate is more or less
implicitly linked to the nature of the labour employed for farming. Usually, small farms are
defined by the natural assets (hectares, thereafter ha), by the herd size or by the economic size
and implicitly authors have examined these units as family farms. There are only few doubts
that small farms and family farms categories partially overlap, but not necessarily; but this
distinction has been seldom addressed. Nevertheless, we can assume that small farms can be
understood as family farms where most of the labour is provided by the family whereas larger
farms rely more on hired labour. Eastwood and al. (2010) recognize that: “Although the term
family farm is widespread in the literature, we have not been able to find a precise
definition”. Many authors paid a specific attention to the market imperfections approach,
searching to explain the “inverse relationship” and developed formalized models to represent
the unit of production. Even if size is often taken as a key factor to handle the diversity of
4
farming units, a considerable literature developed approaches and models that consider labour
as a key differentiating factor. We will limit our review to the most relevant for our purpose.
Eswaran and Kotwal (1986) model - assuming perfect markets for land and labour and
heterogeneous assets distribution among households – leads to classify four categories based
on assets or capital endowments, ranging from the labourer-cultivators to large capitalists.
The main distinction among the four categories is based on the capacity to be employed (fully
or not) on one’s land, and if land and productive assets increase to employ hired workers.
Then becoming employer of an increasing number of external workers, leads to specializing
progressively in labour supervision. The authors focus on two specific skills that appear to be
crucial in agriculture: the ability to supervise labour and the managerial ability for decision
making in a risk prone environment regarding biological processes and unpredictable natural
events, on one side, and market uncertainty, on the other side. Regarding hired labour and
tenancy contracts, they underline the need to consider the quantity of labour hired and the
supervision effort to reduce shirking.
Allen and Lueck (1998) combine the now classical conception of the firm developed by
Coase (1937) with technical insight deriving from the specificity of the biological processes in
farming. Their definition of the farm is therefore close to a firm in Coase’s perspective: “A
“pure” family farm is the simplest case, where a single farmer owns the output and controls
all the farm assets, including all labour assets” (Allen and Lueck, 1998, p. 347). This
definition is directly opposed to “factory-style corporate agriculture” defined as a production
unit “where many people own the farm and labour is provided by large groups of specialized
fixed wage labour” (ibid, p. 355). In between, they identify an intermediate form “in which
two or three owners share output and capital and each owner provides labour” (ibid., p. 347).
They call it “partnerships”. In this definition of family farms, they consider the household
(husband and wife) as a single agent and ignore intra-family shirking as well as the distinction
5
between farm ownership and renting. The specific performance of family farms compared to
“factory-style corporate agriculture” lies in the capacity of family labour to closely monitor
and / or react to random events (combination of climate shocks and biological reactions of
plants and /or animals) and to adapt to an intra-annual uneven distribution of labour needs
along with the plant or animal biological cycles around the year.
Roumasset (1995) remains in the tracks of Coase (1937) and others when he defines the
firm: “as an organization of economic agents bound together by a common governance
structure for the profitable production and sale of goods and/or services” (page 165). But
when it comes to specify for agriculture, he focuses on the “constitutional” and governance
structure that directly impact on production decisions and implementation and especially the
control of shirking. Especially in agriculture “agricultural firms can be distinguished
according to the governance structure controlling the shirking of labour and the abuse of
land and capital assets” (ibid., p. 165). This leads the author to present a typology of the
different types of firm based on the degree of labour specialization ranging from the “Owner-
Operator” (e.g., family farmer without distinction between decision-making and
implementation) up to the “Hired-Manager” (e.g., enterprise with a profound division of
labour from the unskilled worker up to the top manager, with a strategic decision making in
the hands of the shareholders’ representatives).
1.2. Family labour and hired labour to define family farming
There is a wide literature on peasant and family farming which questions disciplinary
approaches, family being a social institution and agriculture being treated as an economic
activity. Complexity increases when considering the dual nature of the production that can
simultaneously feed the family or be sold on markets. Economy of farming only partially fits
with the basics of standard economics because the production function is not exclusively
6
driven by market signals, the search for profit maximization is not the core objective of
farmers and the decision making cannot stay away from social issues. The household is at the
same time a production and a consumption unit, and the savings feed at the same time the
assets consolidation and the family patrimony.
On peasant farming, the abundant literature combines a wide number of variables to
define a peasant. Some refer to the balance between self-provision and market orientation
(Marx, 1850; Thorner, 1962; de Janvry and Deere, 1979), others to the inclusion in a local
peasant community (Mendras, 1976), others to the limited size of peasant’s farms compared
to more commercially oriented agriculture (Otsuka, 1998) and many recognize as Wolf (1966)
the “domination of peasantry by outsiders” (Shanin, 1987, p. 4) But all scholars who defined
peasant farming share one common feature which is the reliance on family labour. This
reliance is neither exclusive nor limited to agriculture (pluriactivity is part of peasant farming
– Chayanov, 1923). So peasant farming is based on family labour.
On family farming, we follow the vision developed by scholars like Chayanov (1923),
Lamarche (1990), Hill (1993), Djurfeldt (1993) and recently by Brookfield (2007). “Family
management, coupled with substantial work input, seems adequately to define family farms
not only in Europe, but elsewhere. This mode of management and production is found in all
continents” (Brookfield, 2008). Once defined as such, it is almost impossible with the
available data to precisely define which holding is run by a family. The legal status is specific
to each context and is often related to fiscal or organizational choices within the family. Size
is also not robust since large scale farms can be run by families. Bélières and al. (2014)
propose to consider both the organic linkage between the family patrimony and the economic
assets of the farm (as a productive unit) and the exclusion of permanent hired labour (Figure
1). As far as we know, the first criteria is not accessible in the available data bases or surveys,

7
but limiting family farms to those relying exclusively on family labour is possible with
censuses or surveys in which labour use is properly captured. Then, on the opposite, it is
possible to strictly define the corporate type of farming as entities relying solely on hired
labour and with no organic linkages between the workers and the asset owners.
Figure 1. Description of farms
Farming types Entrepreneurial farming …………………………………………………… Family farming
Types of farms
Corporations Family business farms
Family farms
Labour Exclusively hired labour Family and hired labour
Family labour, no permanent hired labour
Assets' ownership
Ownership is independent from labour
Family ownership Family ownership
Based on Bélières et al. (2014) and FAO (2012)
The French case is particularly relevant for this study as 75% of the total amount of
labour engaged in agriculture consist of family labour in 2000 (Agricultural Census, 2000).
However, this share is rapidly declining: family labour represented 84% of total labour in
1988 and represents 70% in 2010 (Agricultural Census 1988, 2010). Boosted by the dynamics
of farm structures, the demographic evolution of families towards smaller households, the
diversification of family members towards off-farm wage labour and the exoneration of taxes
for agricultural short-term contracts, agricultural wage labour gains in weight (Darpeix et al.,
2014).
8
2. A labour-based categorization of agricultural holdings: rationale
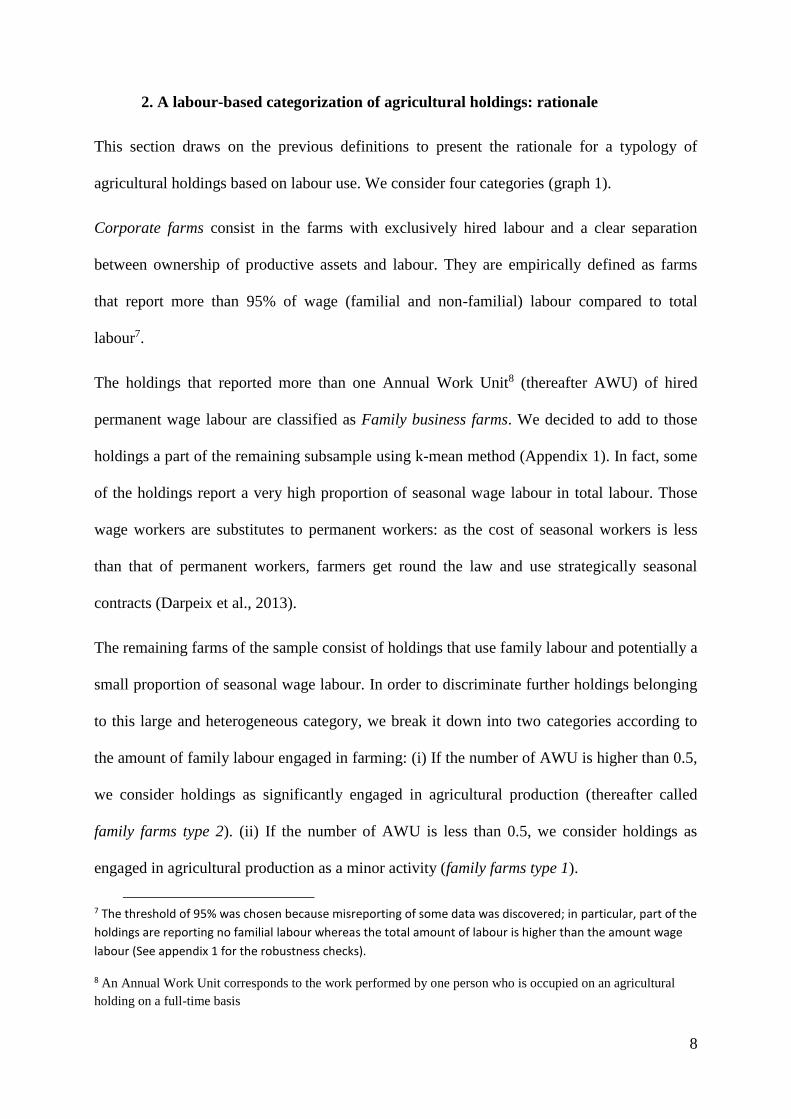
This section draws on the previous definitions to present the rationale for a typology of
agricultural holdings based on labour use. We consider four categories (graph 1).
Corporate farms consist in the farms with exclusively hired labour and a clear separation
between ownership of productive assets and labour. They are empirically defined as farms
that report more than 95% of wage (familial and non-familial) labour compared to total
labour7.
The holdings that reported more than one Annual Work Unit8 (thereafter AWU) of hired
permanent wage labour are classified as Family business farms. We decided to add to those
holdings a part of the remaining subsample using k-mean method (Appendix 1). In fact, some
of the holdings report a very high proportion of seasonal wage labour in total labour. Those
wage workers are substitutes to permanent workers: as the cost of seasonal workers is less
than that of permanent workers, farmers get round the law and use strategically seasonal
contracts (Darpeix et al., 2013).
The remaining farms of the sample consist of holdings that use family labour and potentially a
small proportion of seasonal wage labour. In order to discriminate further holdings belonging
to this large and heterogeneous category, we break it down into two categories according to
the amount of family labour engaged in farming: (i) If the number of AWU is higher than 0.5,
we consider holdings as significantly engaged in agricultural production (thereafter called
family farms type 2). (ii) If the number of AWU is less than 0.5, we consider holdings as
engaged in agricultural production as a minor activity (family farms type 1).
7 The threshold of 95% was chosen because misreporting of some data was discovered; in particular, part of the
holdings are reporting no familial labour whereas the total amount of labour is higher than the amount wage
labour (See appendix 1 for the robustness checks).
8 An Annual Work Unit corresponds to the work performed by one person who is occupied on an agricultural
holding on a full-time basis
9
Graph 1. The categorization of holdings
3. Results from Census 2000 and 2010: descriptive statistics
The French Agricultural Censuses 2000 and 2010 provide a large range of
characteristics of agricultural holdings. The data set reports for each holding: the amount of
family labour (permanent and seasonal, wage labour or not) in AWU); the amount of hired
wage labour (permanent and seasonal separately) in AWU, including labour provided by
companies and cooperatives for collective use of agricultural equipment (CUMA and ETA).
Even though the data provide a rich set of information about labour issues, some shortages
should be noticed. First, the level above which an entity is considered as an agricultural
holding is rather low so that it does not exclude small entities where the agricultural
production is marginal, for instance in the case leisure farming. Therefore, we try to
discriminate them by isolating the smallest farms defined as those with less than 0.5 AWU
10
and thus gain in homogeneity within groups. Second, the number is AWU is reported9 using a
categorical variable distinguishing between 0 to ¼ of full-time; ¼ to ½; ½ to ¾ and ¾ to full-
time for each of the family members reported in the survey. In order to get the total amount of
family labour in AWU at the farm level, we followed the methodology provided by the
Census and used the average of those intervals. Last, we should acknowledge the fact that the
probability of misreporting, intentional or not, of the amount of labour is high, but both for
family and hired wage labour.
Censuses 2000 and 2010 provide two pictures of the total number of agricultural
holdings. We cannot track the holdings across years so that we are not able to study
transitions at the individual level. We thus turn to an aggregated comparative static approach
using comparable variables for both years.
3.1. Evolution of the categories
Family farms as defined largely predominate in the sample (representing 81.6% of the
total number as a whole in 2000, Table 1) and Family business farms reach 17.2% of the total
sample: an overwhelming share of farms is run by the family and only a small percentage are
considered as corporate farms (1.2% in 2000). Interesting is the weight of family business
farms, far from negligible in the French agricultural landscape.
9 Except or the amount of labour provided by companies and cooperatives for collective use of agricultural
equipment (CUMA and ETA)
11
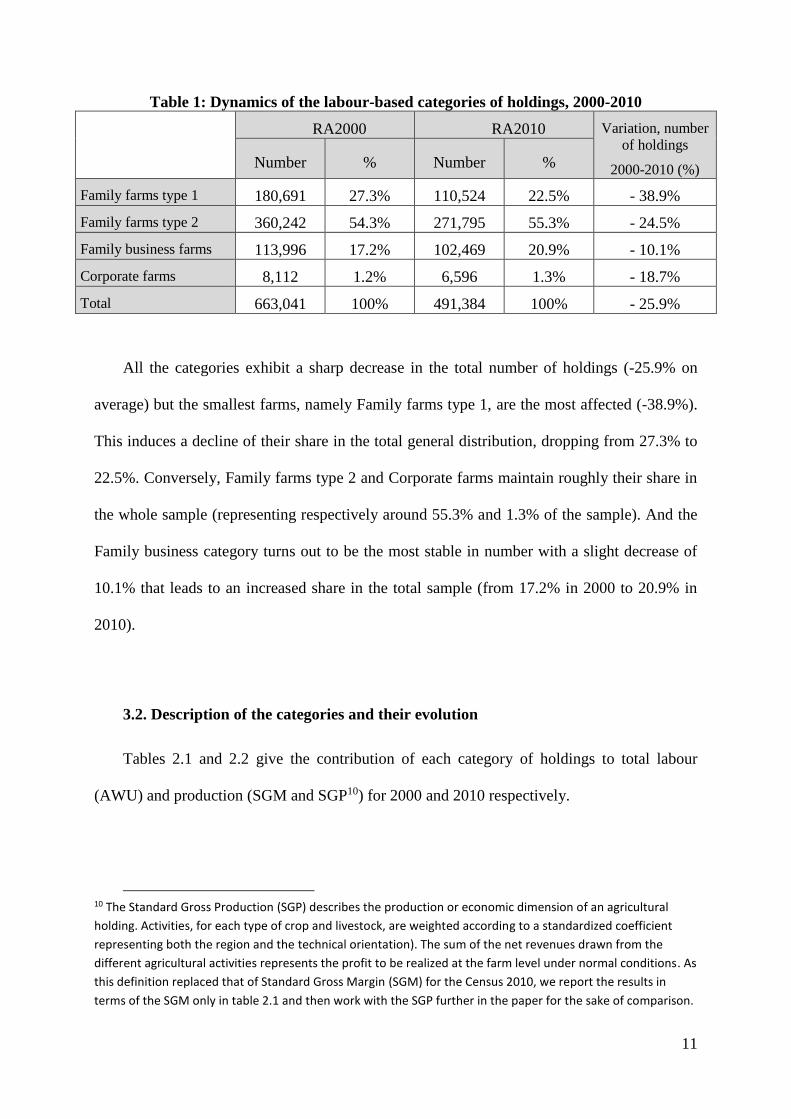
Table 1: Dynamics of the labour-based categories of holdings, 2000-2010
RA2000 RA2010 Variation, number
of holdings
2000-2010 (%) Number % Number %
Family farms type 1 180,691 27.3% 110,524 22.5% - 38.9%
Family farms type 2 360,242 54.3% 271,795 55.3% - 24.5%
Family business farms 113,996 17.2% 102,469 20.9% - 10.1%
Corporate farms 8,112 1.2% 6,596 1.3% - 18.7%
Total 663,041 100% 491,384 100% - 25.9%
All the categories exhibit a sharp decrease in the total number of holdings (-25.9% on
average) but the smallest farms, namely Family farms type 1, are the most affected (-38.9%).
This induces a decline of their share in the total general distribution, dropping from 27.3% to
22.5%. Conversely, Family farms type 2 and Corporate farms maintain roughly their share in
the whole sample (representing respectively around 55.3% and 1.3% of the sample). And the
Family business category turns out to be the most stable in number with a slight decrease of
10.1% that leads to an increased share in the total sample (from 17.2% in 2000 to 20.9% in
2010).
3.2. Description of the categories and their evolution
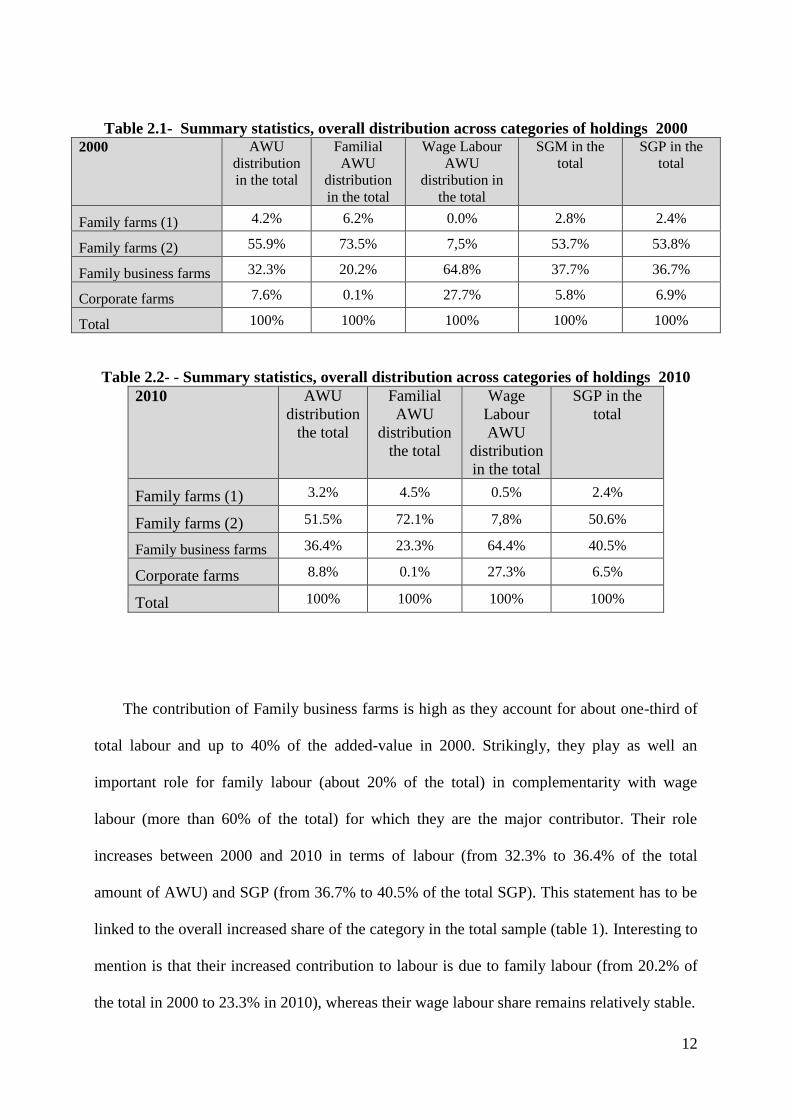
Tables 2.1 and 2.2 give the contribution of each category of holdings to total labour
(AWU) and production (SGM and SGP10) for 2000 and 2010 respectively.
10 The Standard Gross Production (SGP) describes the production or economic dimension of an agricultural
holding. Activities, for each type of crop and livestock, are weighted according to a standardized coefficient
representing both the region and the technical orientation). The sum of the net revenues drawn from the
different agricultural activities represents the profit to be realized at the farm level under normal conditions. As
this definition replaced that of Standard Gross Margin (SGM) for the Census 2010, we report the results in
terms of the SGM only in table 2.1 and then work with the SGP further in the paper for the sake of comparison.
12
Table 2.1- Summary statistics, overall distribution across categories of holdings 2000
2000 AWU
distribution
in the total
Familial
AWU
distribution
in the total
Wage Labour
AWU
distribution in
the total
SGM in the
total
SGP in the
total
Family farms (1) 4.2% 6.2% 0.0% 2.8% 2.4%
Family farms (2) 55.9% 73.5% 7,5% 53.7% 53.8%
Family business farms 32.3% 20.2% 64.8% 37.7% 36.7%
Corporate farms 7.6% 0.1% 27.7% 5.8% 6.9%
Total 100% 100% 100% 100% 100%
Table 2.2- - Summary statistics, overall distribution across categories of holdings 2010
2010 AWU
distribution
the total
Familial
AWU
distribution
the total
Wage
Labour
AWU
distribution
in the total
SGP in the
total
Family farms (1) 3.2% 4.5% 0.5% 2.4%
Family farms (2) 51.5% 72.1% 7,8% 50.6%
Family business farms 36.4% 23.3% 64.4% 40.5%
Corporate farms 8.8% 0.1% 27.3% 6.5%
Total 100% 100% 100% 100%
The contribution of Family business farms is high as they account for about one-third of
total labour and up to 40% of the added-value in 2000. Strikingly, they play as well an
important role for family labour (about 20% of the total) in complementarity with wage
labour (more than 60% of the total) for which they are the major contributor. Their role
increases between 2000 and 2010 in terms of labour (from 32.3% to 36.4% of the total
amount of AWU) and SGP (from 36.7% to 40.5% of the total SGP). This statement has to be
linked to the overall increased share of the category in the total sample (table 1). Interesting to
mention is that their increased contribution to labour is due to family labour (from 20.2% of
the total in 2000 to 23.3% in 2010), whereas their wage labour share remains relatively stable.

13
Parallel to this evolution, the contribution of Family farms decreases in terms of total
AWU. However, the differentiation between both categories of family farms is noticeable:
Family farms type 1 reveal a very low contribution to labour and wealth; whereas the large
group of Family farms type 2 is still at the origin of more than the half of both labour and
SGP.
Last, the contribution of Corporate farms is far from being negligible even though they
are few in number as they generate nearly 9% in 2010 against 7.6% in 2000 of total
employment and more than 6% of the total SGP for both years.
Table 3.1: Further insights on descriptive statistics according to labour-based holding
types, 2000 2000
UAA (ha) * SGM (1000 €)* SGP (1000 €) AWU (total)* AWU per ha
Family farms (1) 5.9 (191%) 4.9 (196%) 7.3 (253%) 0.2 (53%) 0.25 (485%)
Family farms (2) 52.5 (100%) 51.7 (92%) 80.6 (126%) 1.4 (47%) 0.22 (1160%)
Family business farms 64.7 (131%) 114.36 (109%) 174.2 (131%) 2.7 (97%) 0.42 (732%)
Corporate farms 62.1 (125%) 246.91 (253%) 459.3 (366%) 8.9 (201%) 2.04 (512%)
Total sample 42 (177%) 52.1 (195%) 81.3 (286%) 1.4 (180%) 0.28 (922%)
* In parentheses standardized standard deviation (percentage of variation around the mean)
Table 3.2: Further insights on descriptive statistics according to labour-based holding
types, 2010 (Δ=variation 2000-2010)
2010
UAA (ha) * SGP (1000 €)* Nominal prices
SGP (1000 €)* Constant prices
2000
AWU (total)*
AWU per ha*
Family farms (1) 10.8 (650%) (Δ= +83%)
10.9 (280%) (Δ= +49%)
9,2 (Δ= +26%)
0.2 (61%) (Δ= +0%)
0.23 (485%) (Δ= -8%)
Family farms (2) 64.8 (100%) (Δ= +23%)
95.4 (138%) (Δ= +18%)
80,7 (Δ= +0.1%)
1.4 (49%) (Δ= +0%)
0.26 (1184%) (Δ= +18%)
Family business farms
82.1 (155%) (Δ= +27%)
202.7 (148%) (Δ= +16%)
171,5 (Δ= -1.5%)
2.7 (95%) (Δ= +0%)
0.43 (2382%) (Δ= +2%)
Corporate farms 73.5 (325%) (Δ= +18%)
506.4 (509%) (Δ= +10%)
428,4 (Δ= -6.2%)
10 (205%) (Δ= +12%)
2.9 (579%) (Δ= +42%)
Total sample 56.4 (161%) (Δ= +34%)
104.3 (338%) (Δ= +28%)
88,2 (Δ= -8.5%)
1.5 (190%) (Δ= +7%)
0.32 (173%) (Δ= +14%)
* In parentheses standardized standard deviation (percentage of variation around the mean)
14
Tables 3.1 and 3.2 show that Family farms are significantly smaller in terms of labour use
and total cultivated land area than both Family business and Corporate farms. Even though
Family business and Corporate farms do not differ much in terms of UAA, labour intensity is
far higher. Corporate farms are noticeably larger in terms of SGP. However, we can note a
very high dispersion (standardized standard errors) in the latter case. The category of
corporate holdings is highly heterogeneous: it entails large commercial companies as well as
small owners that produce on a recreational basis without being directly involved in the
production process (as in vineyard, in particular).
The size of the holdings (UAA) increased significantly for all the categories (reported in
bracket as differential between 2000 and 2010, Δ). However, Family farms type 1 is the
category which is the most sensitive to this evolution with an increase of the average hectares
used per holding of 83%. This observation combined with that of the decrease in the number
of holdings suggests that the smallest farms disappeared, even though we cannot directly test
for this hypothesis. Moreover, if they would have transited from Family farms type 1 to
Family farms type 2, they would probably have lowered the average size (UAA) of farms
belonging to this latter category, whereas the size is increasing (+23%).
The average SGP increased for the different categories and somehow reflects the increase
in size (hectares) with the most important increase observed for the smallest holdings.
However, we should note that this increase is less important for Family business and
Corporate farms which exhibit even a decrease in SGP in constant prices11.
The total AWU active on the holdings increased, on average, between 2000 and 2010 but
less than the number of hectares used. The increase in AWU is uniquely due to the evolution
11 Aggregate agricultural price levels were taken into account to correct for inflation.
15
of Corporate farms with a stability of the other farm types. The average increase in labour
intensity hides very heterogeneous evolutions across farm types.
3.4. Selected variables
We selected variables we thought to be discriminating in order to characterize the
categories presented in the previous section for 2000 and 2010 and compare the two rounds12
(Appendix 2 for detailed statistics).
The technical and economic orientation (OTEX) classifies the holdings into different
types of production, specialized or mixed based on the economic dimension (SGP). Those
production systems present different levels of labour intensity (Benjamin et al., 1996;
Benjamin and Kimhi, 2006). Accordingly, we distinguish between 5 broad categories of
OTEX: (1) Land-intensive growing systems: horticulture and off-soil livestock systems
(poultry and pigs); (2) Permanent crops: fruit orchards and vineyard; (3) Average
intensive/extensive farming systems: specialised dairy and mixed dairy; (4) Extensive
farming systems, mainly cereals and grains; (5) Extensive livestock systems.
The legal status was shown to be related to the size of the holding and type of
management (e.g. Bathélémy and Dussol, 2002). We consider: (1) Individual farms that are
run by a single manager who is considered as a juridical person; (2) Agricultural Companies
whose status is specific to the agricultural sector (e.g. GAEC13 and EARL14); (3) Generic
Companies (e.g. limited liability companies – LLC - or public liability companies - PLC).
12 Even though the questions slightly changed between Census 2000 and Census 2010, we were able to strictly
comparable variables to allow for parallel analyses for both years.
13 GAEC for Groupement Agricole d’Exploitation en Commun, legal entities that gather individual persons into
collective units dedicated to agricultural production.
14 EARL for Entreprise Agricole à Responsabilité Limitée, limited liabibility agricultural company
16
On-farm diversification strategies may be linked to the farm type: on the one hand,
Family farms may be more diversified (as an option for survival) than Family business or
Corporate ones; on the other hand, Family business and Corporate farms may have an easier
access to the capital needed to diversify farms (Aubert and Perrier-Cornet, 2009). We
identified on-farm diversification as direct sales to consumers, on-farm processing of the
product and agrotourism.
Last, off-farm job opportunities may affect the decision to hire agricultural workers
that substitute for family labour, especially wives15 (Benjamin and Kimhi, 2006). We
summarize the involvement of the family in off-farm wage activities by computing the time
spent working outside the farm relatively to the total potential time available at the family
level, namely for individuals in working age. We end up with an index of the intensity of off-
farm work at the family level.
15 Between 1988 and 2007 the share of women head of holding or co-head raised from 12 to 24% (Gambino et
al., 2012)
17
4. Description of the categories: an econometric assessment
In order to describe16 the joint influence of the variables presented in the preceding
section on the probability to belong to a specific category, we use a multinomial logit
regression with the four categories as endogenous variable (table 4). We perform the analysis
separately for each year. We ran a Hausman test for the assumption of independence of
irrelevant alternatives. We accept the independence, only weakly (10%) in the case of
corporate agriculture for the year 2000 only.
The relative risk ratios (RRR) are reported in table 4 where the category of “Family farms
type 2” is chosen as the reference category. As we consider a logistic regression, the odd of
success is 𝑝𝑟𝑜𝑏(𝑦𝑗=1|𝑥)
𝑝𝑟𝑜𝑏(𝑦𝑗=0|𝑥)= 𝑒𝛽𝑥 = 𝛼, where yj is the jth category, j {1…4}, x an exogenous
variable and β the raw coefficient associated to x in the multinomial logit regression. If the
relative risk ratio α is more than 1 for a category j, then the variable has a positive effect on
the probability to belong to j relatively to the reference category, namely Family farms type 2.
Moreover the odds of belonging to the category j is α times as large as belonging to the
reference category.
16 As some of the dependent variables may be endogenous, we use econometrics as a descriptive tool and not
in terms of causal relationships.
18
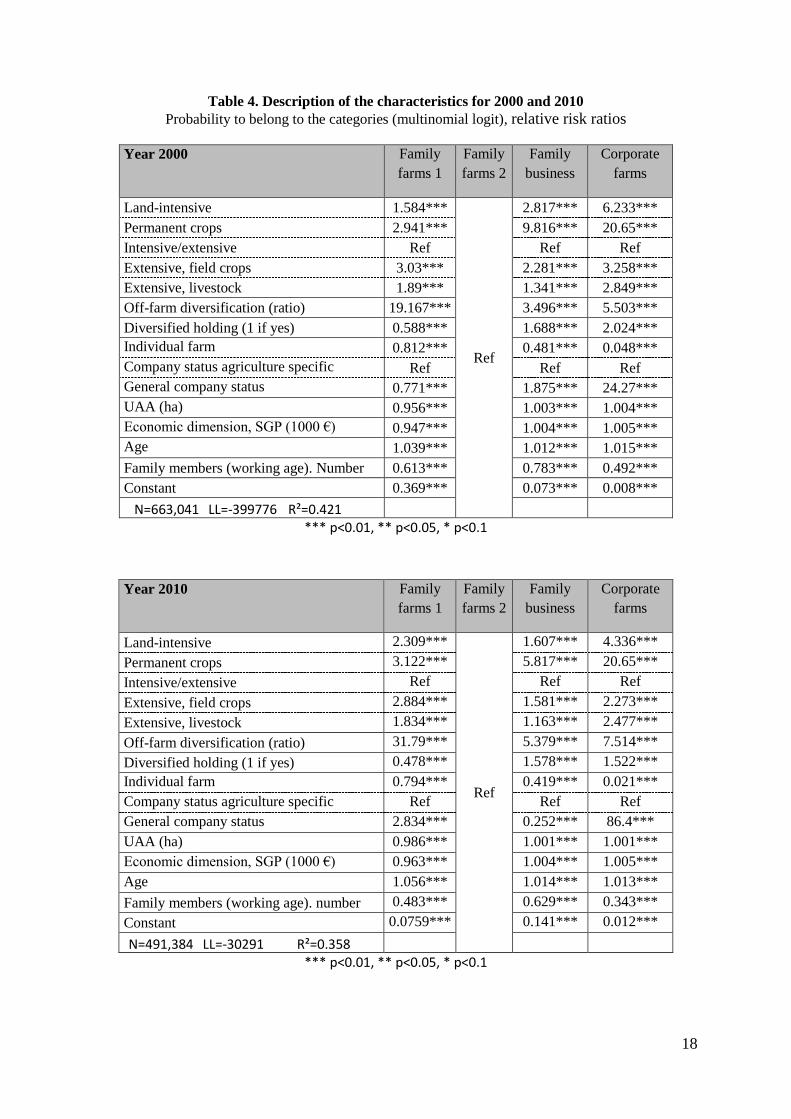
Table 4. Description of the characteristics for 2000 and 2010
Probability to belong to the categories (multinomial logit), relative risk ratios
Year 2000 Family
farms 1
Family
farms 2
Family
business
Corporate
farms
Land-intensive 1.584***
Ref
2.817*** 6.233***
Permanent crops 2.941*** 9.816*** 20.65***
Intensive/extensive Ref Ref Ref
Extensive, field crops 3.03*** 2.281*** 3.258***
Extensive, livestock 1.89*** 1.341*** 2.849***
Off-farm diversification (ratio) 19.167*** 3.496*** 5.503***
Diversified holding (1 if yes) 0.588*** 1.688*** 2.024***
Individual farm 0.812*** 0.481*** 0.048***
Company status agriculture specific Ref Ref Ref
General company status 0.771*** 1.875*** 24.27***
UAA (ha) 0.956*** 1.003*** 1.004***
Economic dimension, SGP (1000 €) 0.947*** 1.004*** 1.005***
Age 1.039*** 1.012*** 1.015***
Family members (working age). Number 0.613*** 0.783*** 0.492***
Constant 0.369*** 0.073*** 0.008***
N=663,041 LL=-399776 R²=0.421
*** p<0.01, ** p<0.05, * p<0.1
Year 2010 Family
farms 1
Family
farms 2
Family
business
Corporate
farms
Land-intensive 2.309***
Ref
1.607*** 4.336***
Permanent crops 3.122*** 5.817*** 20.65***
Intensive/extensive Ref Ref Ref
Extensive, field crops 2.884*** 1.581*** 2.273***
Extensive, livestock 1.834*** 1.163*** 2.477***
Off-farm diversification (ratio) 31.79*** 5.379*** 7.514***
Diversified holding (1 if yes) 0.478*** 1.578*** 1.522***
Individual farm 0.794*** 0.419*** 0.021***
Company status agriculture specific Ref Ref Ref
General company status 2.834*** 0.252*** 86.4***
UAA (ha) 0.986*** 1.001*** 1.001***
Economic dimension, SGP (1000 €) 0.963*** 1.004*** 1.005***
Age 1.056*** 1.014*** 1.013***
Family members (working age). number 0.483*** 0.629*** 0.343***
Constant 0.0759*** 0.141*** 0.012***
N=491,384 LL=-30291 R²=0.358
*** p<0.01, ** p<0.05, * p<0.1
19
The results reported in table 4 show that some general features are present for both years.
The technical and economic orientation strongly influences the probability to belong to a
specific category. In particular, permanent crops and, to a lesser extent, land-intensive
farming systems (horticulture, pigs and poultry) are more likely to positively influence the
probability to belong to the categories of Family business and Corporate farms (relatively to
production systems under mixed intensive/extensive techniques) than they do for the
reference group – namely Family farms 2: this may be due to the high level of up-front
investment and costly inputs which is necessary to engage in those activities (physical assets,
like farm buildings or greenhouses) and to the fact that they are also highly labour-intensive.
Farms with a high family involvement in off-farm wage labour are far more likely to
be found in the category Family farms 1 than Family farms 2. To a lesser extent, the same
observation can apply for Family business and Corporate farms. In fact, several drivers of
farm income diversification have been identified for developed countries: on the one hand, the
behaviour observed in the group Family farms 1 may correspond to a coping strategy aiming
at securing uncertain and low farm incomes (Mishra and Goodwin, 1997; Mishra and
Sandretto, 2002 for the US); on the other hand, the strategies of Family business and
Corporate farms may be the substitution of family labour by hired labour (Benjamin and
Kimhi, 2006): the opportunity cost of family members working on-farm actually differ
according to individual characteristics, skills and education, and market opportunities.
Farms that diversify towards on-farm non-agricultural production are more likely to belong to
the categories of Family business and Corporate farms than to those of family farming (in the
case of 2000, RRR=1.688 and 2.024 respectively whereas RRR=0.588 for Family farms 1).
Even though we may think on-farm diversification of activities could be an option for the
survival of small family farms, Family business and Corporate farms are more likely to access
the working capital needed to develop on-farm non-agricultural activities (especially direct

20
sales and processing): the latter driver turns out to overcome the former (Aubert and Perrier-
Cornet, 2009). Diversification of activities increases the need for labour (Capt and Dussol,
2004) in a context where family labour is limited in number.
The legal status widely differs according to the farm category. Individual farms are more
likely to be observed than companies with a status specific to agriculture (GAEC, EARL…)
for Family farms 2 than for any other category, including Family farms 1 (RRR=0.812).
Commercial companies with a generic legal status (LLC, PLC …) are more likely to be
observed in the categories of Family business or Corporate farms than in Family farms type 2.
However, Corporate farms largely distinguish themselves (with a RRR=22.2 for 2000) and
Family business farms are more proximate to Family farms 2 (RRR=1.875). This may be due
to the fact that statuses specific to the agricultural sector entail corporate organizations
(GAEC) as a company type that encompasses co-workers, though they remain family farms
from the organisational point of view (Vuillaume and Delame, 2009). It should be recalled
here that this variable pictures the way family farms in general adapt to several types of
constraints: financial and fiscal issues, social and labour issues, organization of work and
access to leisure time. Patrimony dimensions remain under family ownership and governance.
Size indicators (UAA and SGP) do not highly influence the probability to belong to a
category (the RRR are very close to 1), even though we can note that, in 2000, Family farms 1
are moderately smaller than Family farms 2 (RRR=0.956 and 0.947, respectively for UAA
and SGP).
Regarding the demographic characteristics of the family, the number of family members
registered in the survey, namely individuals working and/or living on the farm, plays a role.
The higher the number of family member in working age, the less probable the fact to belong
to any category relatively to Family farms 2.
21
Comparing the two tables (year 2000 and year 2010) the evolution shows that:
The technical economic orientation tends towards a convergence between Family farms 2 and
Family business farms with all the RRR going down (even though a difference persists,
especially for permanent crops). Conversely, Family farms 1 and 2 tend to get more different
one from the other, with Family farms 1 specializing in land-intensive production and
permanent crops.
The influence of the diversification towards off-farm wage incomes increases with Family
farms 2 tending to concentrate on farm income even more than they do in 2000. In particular,
the coefficient of this variable rises a lot in the case of Family farms 1. This result should be
put in perspective with the overall evolution of the distribution of holdings according to their
types that shows a sharp drop in the weight of the category Family farms 1, but a relative
stability (or even increase, in terms of SGP) of their contribution. It may suggest that, in this
category, the holdings that were diversified off-farm in 2000 maintained their activity.
The conclusions on the legal status of the holding partially hold, especially concerning the
status of individual farms.
Lastly, the small influence of size indicators on the probability to belong to a specific
category observed for the category Family farms 1 in 2000 tightened over the period. Family
farms 1 tend to converge towards family farms type 2 in terms of size (UAA and SGP).
22
Conclusion
We propose a typology of French agricultural holdings based on the type of agricultural
labour. We distinguish thereby between family labour and permanent and seasonal hired
labour in order to split the sample into four categories: family holdings with limited labour
implication, family holdings with a larger labour implication, family business farms and
corporate farms.
We then characterize the four categories. We find that (i) the technical and economic
orientation is essential to understand the insertion of the farm in each of the category. In
particular, seasonal labour intensive sectors (vineyards, horticulture, orchards) are more
probably found in Family business and Corporate farms. Year-long labour-intensive sectors
(dairy farms and other livestock based farming systems) are found in family based types of
farms; (ii) the on-farm diversification towards non-agricultural activities is mostly observed in
Family business and Corporate farms; whereas small family farm tend to diversify their
activities outside the farm (iii) farm size – physical (ha) and economic (SGP) – does not seem
to be a determinant of belonging to any of the categories we propose, when controlling for
others factors. The fact that either the sole physical (land) or economic size is not a key
variable to classify farms between our broad categories challenges the current vision of the
transformation of agricultural holdings through modernizing.
Looking at the evolution of the farm types between 2000 and 2010, the results suggest a
convergence between the family farms that are heavily engaged in agriculture (Family farms
2) and the Family business farms. The evolution regarding Family farms that are less engaged
in agriculture (Family farms 1) is less obvious as they tend, to some extent, to diverge from
the other types of family farms: in particular, they seem to rely more and more on off-farm
23
wage activities, to reduce their reliance on on-farm diversification, even though they form an
heterogeneous category with an increasing presence of holdings under a generic company
status in this category. Interestingly, when broken down into categories related to labour use,
holdings do not differ much in terms of traditional measures of size (UAA, SGP) everything
else equal. Therefore, the proposal to use labour as a measure of farm size to characterize the
evolution of French agricultural landscape gives some insight into the evolution of farm
structures. In particular, this leads us to pay a particular attention to small family farms whose
path seems to diverge from the rest of the sector, but which contributes to rural development,
biodiversity and landscape management.
References
Allen D. and Lueck D. (1998) The nature of the farm, The Journal of Law and
Economics, 41, 343-386.
Aubert M., and Perrier-Cornet P. (2009) Is there a future for small farms in developed
countries? Evidence from the French case, Agricultural Economics, 40 (s1), 773-787.
Barrett C., Bellemare M. and Hou J. (2010) Reconsidering conventional explanations of
the inverse productivity–size relationship, World Development, 38(1), 88-97.
Barthélémy D. and Dussol AM. (2002) Sociétés agricoles : entre modernité et tradition,
AGRESTE Cahiers 2 (French Ministry of Agriculture: Paris)
Bélières, J.-F., Bonnal, P., Bosc, P.-M., Losch, B. Marzin J. and Sourisseau, J.-M. (2014)
Les agricultures familiales du monde: Définitions, contributions et politiques publiques, AFD
Research Report No. 28. Available at
http://www.afd.fr/webdav/site/afd/shared/PUBLICATIONS/RECHERCHE/Scientifiques/
A-savoir/28-A-Savoir.pdf (last accessed 20/02/2016)
24
Benjamin C., Corsi A. and Guyomard H. (1996) Modelling labour decisions of French
agricultural households, Applied Economics, 28, 1577-1589.
Benjamin C. and Kimhi A. (2006) Farm work, off-farm work, and hired farm labour:
estimating a discrete-choice model of French farm couples' labour decisions, European
Review of Agricultural Economics, 33, 149-171.
Bignebat, C., Bosc, P.M. and Perrier-Cornet, P. (2015) A labour-based approach to the
analysis of structural transformation: Application to French agricultural holdings 2000,
Working Paper No. 201501 (MOISA: Montpellier).
Brookfield H. and Parsons H. (2007) Family farms: survival and prospects. A world-wide
analysis, Routledge Studies in Human Geography, New-York, USA.
Brookfield H. (2008) Family farms are still around: time to invert the old agrarian
question, Geography Compass, 2 (1), 108-126.
Butault JP. and Delame N. (2005) Concentration de la production agricole et croissance
des exploitations, Economie et Statistiques, 390, 47–64.
Capt D. and Dussol AM (2004) Exploitations diversifiées : un contenu en emploi plus
élevé. AGRESTE Cahiers No. 2 (French Ministry of Agriculture: Paris).
Chayanov A.V. (1923 [1990 ed]) L’Organisation de l’économie paysanne, Librairie du
Regard, Paris, France.
Coase, R. (1947) The nature of the firm, Economica, 4, 386-405.
Darpeix A., Bignebat C. and Perrier-Cornet P. (2014) Demand for seasonal wage labour
in agriculture: what does family farming hide? Journal of Agricultural Economics, 65(1),
257-272.
25
Deere, C. D. and de Janvry, A. (1979) A Conceptual Framework for the Empirical
Analysis of Peasants, American Journal of Agricultural Economics, 61(4), 601-611.
Djurfeldt G. (1996) Defining and Operationalizing Family Farming from a Sociological
Perspective, Sociologia Ruralis, 36(3), 340-351.
Eastwood, R., Lipton M., and Newell, A. (2000) Farm size, In: Pingali, P. and Evenson,
R. Handbook of Agricultural Economics, Vol. 4, 3323-3397.
Eswaran, M. and Kotwal, A. (1986) Access to Capital and Agrarian Production
Organization, Economic Journal, 96, 482-498.
FAO (2012), Monitoring Structural Changes in Agriculture – Informing policy dialogue -
Methodological Framework, FAO, Rome, Italy.
Findeis, J. (2002) The dynamics of hired farm labour: Constraints and community
responses, CABI Publishing, New York, USA.
Findeis, J. and Lass, D. (1994) Labour decisions by agricultural households:
Interrelationships between off-farm labour supply and hired labour demand, Working Paper
Population Research Institute: The Pennsylvania State University.
Frisvold, G. (1994) Does supervision matter? Some hypothesis tests using Indian farm-
level data, Journal of Development Economics, 43(2), 217–238.
Gambino, M., Laisney C. and Vert J. (2012) Le monde agricole en tendances. Un portait
social prospectif des agriculteurs, La documentation française, Paris, France.
Hill, B. (1993) The ‘myth’ of the family farm: Defining the family farm and assessing its
importance in the European community, Journal of Rural Studies, 9(4), 359-370.
Lamarche, H. (1994) L’agriculture familiale : du mythe à la réalité, Tome 2,
L’Harmattan, Paris, France.
26
Latruffe, L. and Dupraz, P. (2015) Trends in family labour, hired labour and contract
work on French field crop farms: The role of the Common Agricultural Policy, Food Policy,
51(4), 104-118.
Marx, K. (1987 ed.) Peasantry as a class, In Shanin, T. (Ed) Peasant and peasant
societies, Penguin Books, London, UK, 331-337.
Mendras, H. (1976) Sociétés paysannes. Eléments pour une théorie de la paysannerie,
Armand Colin Coll. U, Paris, France.
Mishra, A., and Goodwin, B. (1997) Farm Income Variability and the Supply of Off-farm
Labour, American Journal of Agricultural Economics, 79(4), 880-887.
Mishra, A.K. and Sandretto, C.L. (2002) Stability of Farm Income and the Role of
Nonfarm Income in U.S. Agriculture, Review of Agricultural Economics, 24(1), 208-221.
Mundlak, Y. (2001) Production and supply, In: Pingali, P. and Evenson, R. (Eds),
Handbook of Agricultural Economics, Vol. 1A, Elsevier, Amsterdam, Netherland.
Otsuka, K. (2008) Peasants, in Durlauf, S.N. and Blume L.E. (Eds.), The New Palgrave
Dictionary of Economics, Palgrave Macmillan, Basingstoke, UK.
Roumasset, J. (1995) The nature of the agricultural firm, Journal of Economic Behavior
and Organization, 26, 161-177.
Shanin, T. (1987) Introduction: peasantry as a concept, in Shanin T. (Ed) Peasant and
Peasant Societies, Penguin Books, London, UK, 1-11.
Thorner, D. (1987 ed) Peasant economy as a category in history, in Shanin T. (Ed)
Peasant and peasant societies, Penguin Books, London, UK, 62-68.
Villaume, S. and Delame, N. (2009) Essor des sociétés agricoles : un recours accru au
salariat et aux prestataires de services, Insee Première, 1243, 4 p.

27
Wolf, E. (1966) Peasants, Prentice-Hall, Foundations of Modern Anthropology Series,
Englewood Cliffs, USA.
28
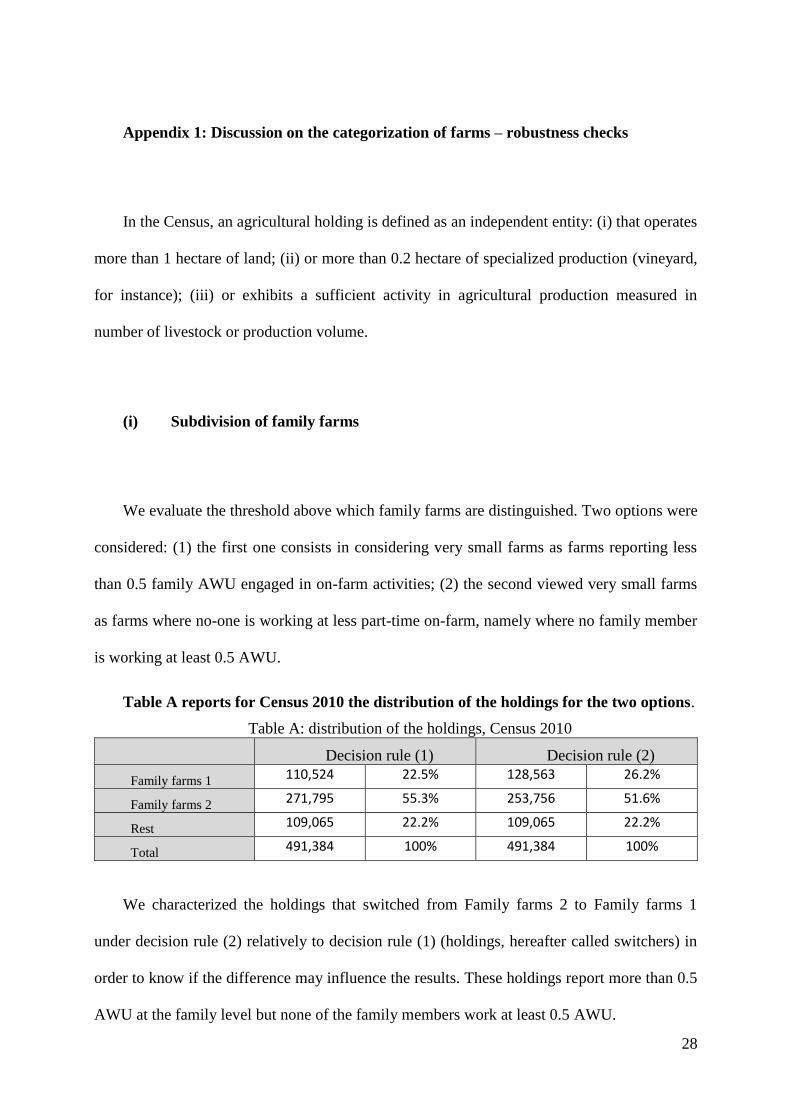
Appendix 1: Discussion on the categorization of farms – robustness checks
In the Census, an agricultural holding is defined as an independent entity: (i) that operates
more than 1 hectare of land; (ii) or more than 0.2 hectare of specialized production (vineyard,
for instance); (iii) or exhibits a sufficient activity in agricultural production measured in
number of livestock or production volume.
(i) Subdivision of family farms
We evaluate the threshold above which family farms are distinguished. Two options were
considered: (1) the first one consists in considering very small farms as farms reporting less
than 0.5 family AWU engaged in on-farm activities; (2) the second viewed very small farms
as farms where no-one is working at less part-time on-farm, namely where no family member
is working at least 0.5 AWU.
Table A reports for Census 2010 the distribution of the holdings for the two options.
Table A: distribution of the holdings, Census 2010
Decision rule (1) Decision rule (2)
Family farms 1 110,524 22.5% 128,563 26.2%
Family farms 2 271,795 55.3% 253,756 51.6%
Rest 109,065 22.2% 109,065 22.2%
Total 491,384 100% 491,384 100%
We characterized the holdings that switched from Family farms 2 to Family farms 1
under decision rule (2) relatively to decision rule (1) (holdings, hereafter called switchers) in
order to know if the difference may influence the results. These holdings report more than 0.5
AWU at the family level but none of the family members work at least 0.5 AWU.
29
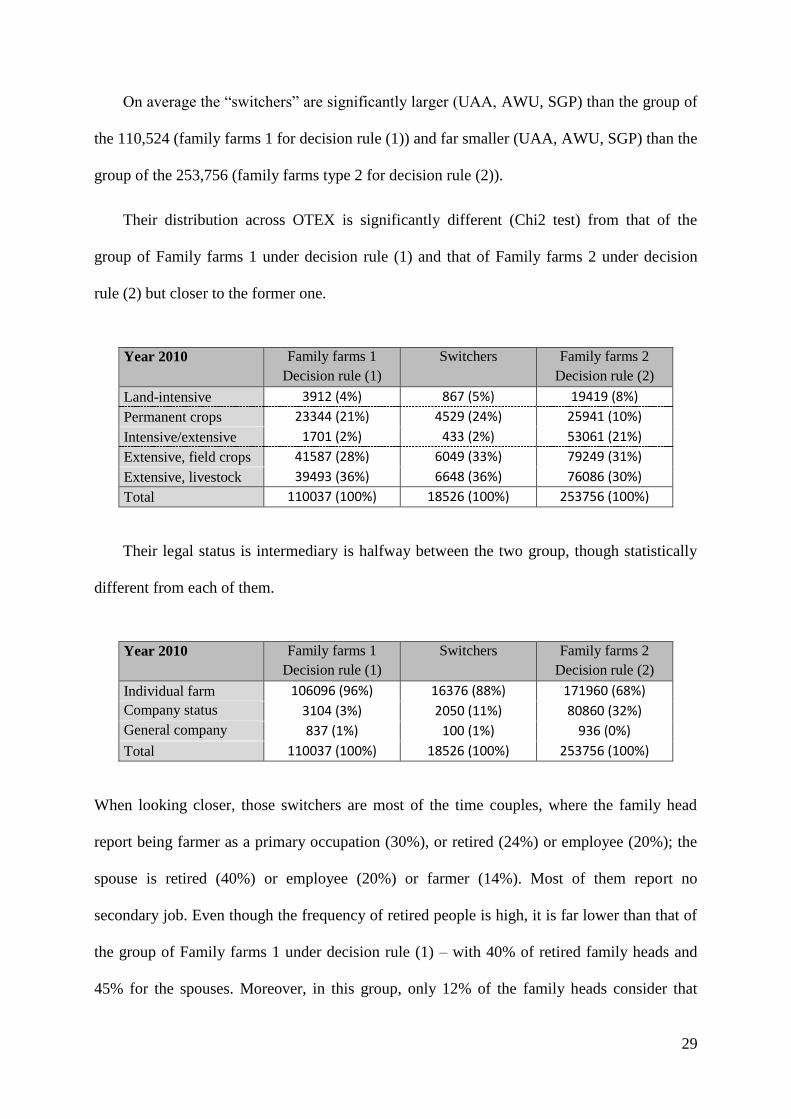
On average the “switchers” are significantly larger (UAA, AWU, SGP) than the group of
the 110,524 (family farms 1 for decision rule (1)) and far smaller (UAA, AWU, SGP) than the
group of the 253,756 (family farms type 2 for decision rule (2)).
Their distribution across OTEX is significantly different (Chi2 test) from that of the
group of Family farms 1 under decision rule (1) and that of Family farms 2 under decision
rule (2) but closer to the former one.
Year 2010 Family farms 1
Decision rule (1)
Switchers Family farms 2
Decision rule (2)
Land-intensive 3912 (4%) 867 (5%) 19419 (8%)
Permanent crops 23344 (21%) 4529 (24%) 25941 (10%)
Intensive/extensive 1701 (2%) 433 (2%) 53061 (21%)
Extensive, field crops 41587 (28%) 6049 (33%) 79249 (31%)
Extensive, livestock 39493 (36%) 6648 (36%) 76086 (30%)
Total 110037 (100%) 18526 (100%) 253756 (100%)
Their legal status is intermediary is halfway between the two group, though statistically
different from each of them.
Year 2010 Family farms 1
Decision rule (1)
Switchers Family farms 2
Decision rule (2)
Individual farm 106096 (96%) 16376 (88%) 171960 (68%)
Company status
agriculture specific 3104 (3%) 2050 (11%) 80860 (32%)
General company
status 837 (1%) 100 (1%) 936 (0%)
Total 110037 (100%) 18526 (100%) 253756 (100%)
When looking closer, those switchers are most of the time couples, where the family head
report being farmer as a primary occupation (30%), or retired (24%) or employee (20%); the
spouse is retired (40%) or employee (20%) or farmer (14%). Most of them report no
secondary job. Even though the frequency of retired people is high, it is far lower than that of
the group of Family farms 1 under decision rule (1) – with 40% of retired family heads and
45% for the spouses. Moreover, in this group, only 12% of the family heads consider that
30
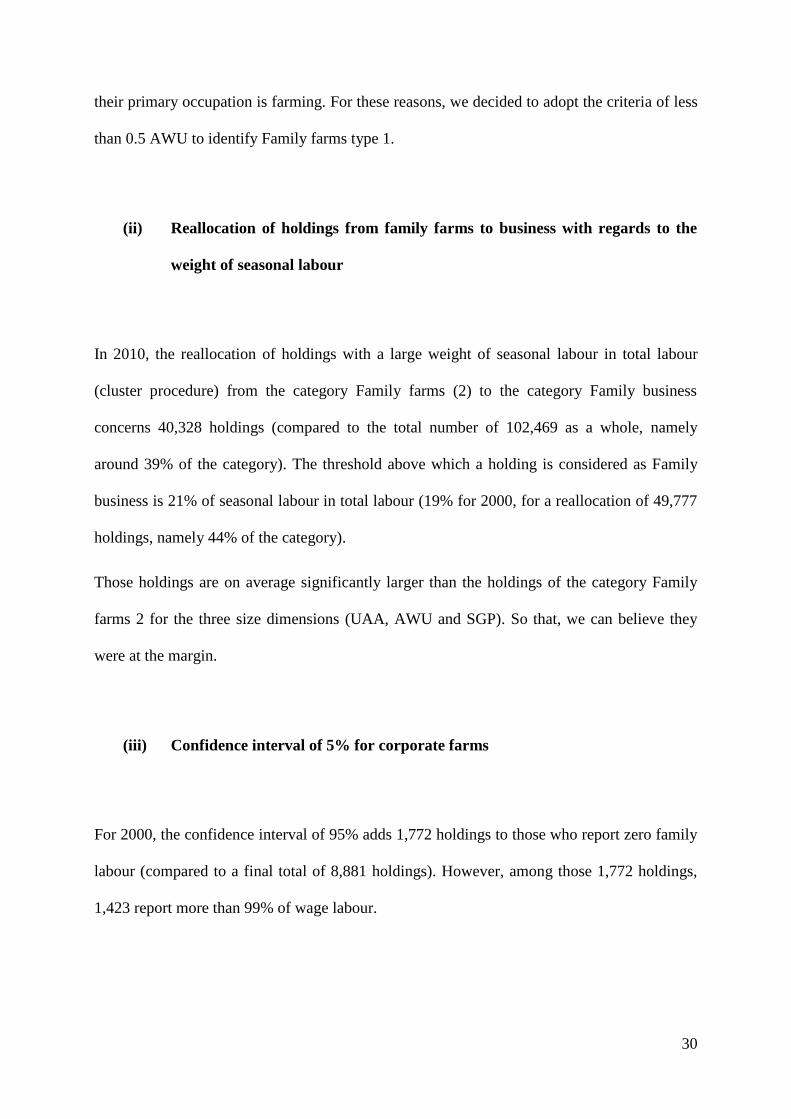
their primary occupation is farming. For these reasons, we decided to adopt the criteria of less
than 0.5 AWU to identify Family farms type 1.
(ii) Reallocation of holdings from family farms to business with regards to the
weight of seasonal labour
In 2010, the reallocation of holdings with a large weight of seasonal labour in total labour
(cluster procedure) from the category Family farms (2) to the category Family business
concerns 40,328 holdings (compared to the total number of 102,469 as a whole, namely
around 39% of the category). The threshold above which a holding is considered as Family
business is 21% of seasonal labour in total labour (19% for 2000, for a reallocation of 49,777
holdings, namely 44% of the category).
Those holdings are on average significantly larger than the holdings of the category Family
farms 2 for the three size dimensions (UAA, AWU and SGP). So that, we can believe they
were at the margin.
(iii) Confidence interval of 5% for corporate farms
For 2000, the confidence interval of 95% adds 1,772 holdings to those who report zero family
labour (compared to a final total of 8,881 holdings). However, among those 1,772 holdings,
1,423 report more than 99% of wage labour.
31
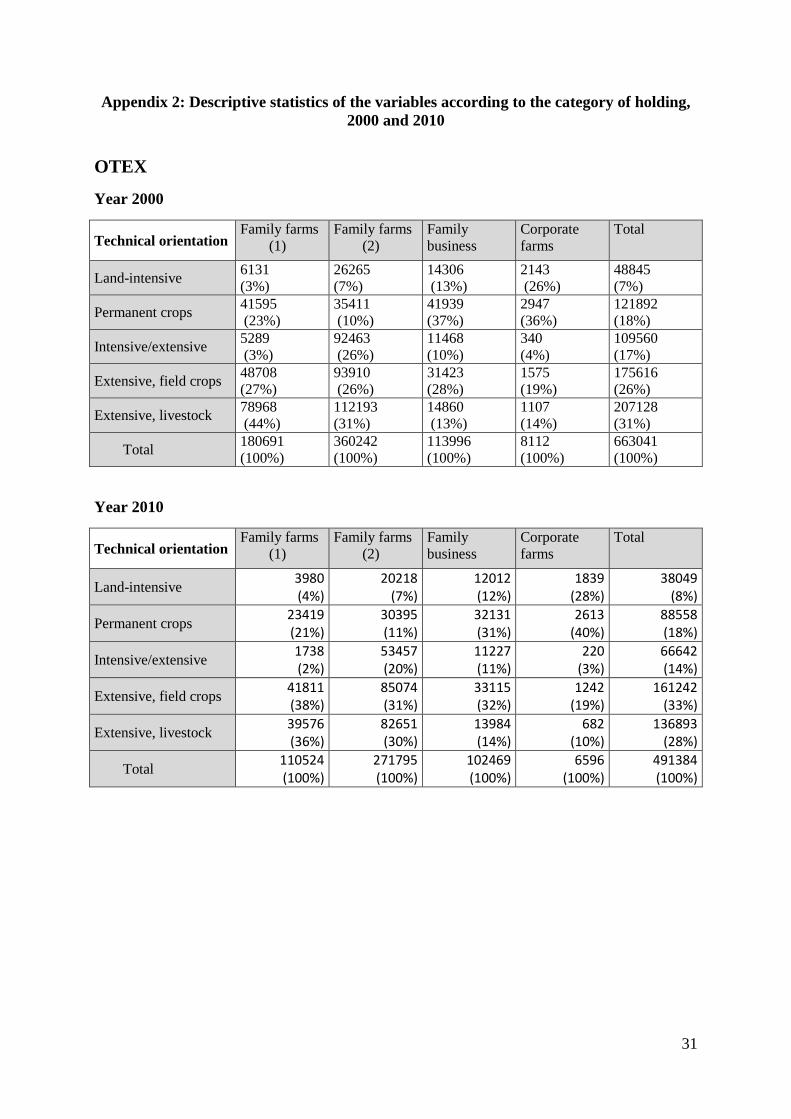
Appendix 2: Descriptive statistics of the variables according to the category of holding,
2000 and 2010
OTEX
Year 2000
Technical orientation Family farms
(1)
Family farms
(2)
Family
business
Corporate
farms
Total
Land-intensive 6131
(3%)
26265
(7%)
14306
(13%)
2143
(26%)
48845
(7%)
Permanent crops 41595
(23%)
35411
(10%)
41939
(37%)
2947
(36%)
121892
(18%)
Intensive/extensive 5289
(3%)
92463
(26%)
11468
(10%)
340
(4%)
109560
(17%)
Extensive, field crops 48708
(27%)
93910
(26%)
31423
(28%)
1575
(19%)
175616
(26%)
Extensive, livestock 78968
(44%)
112193
(31%)
14860
(13%)
1107
(14%)
207128
(31%)
Total 180691
(100%)
360242
(100%)
113996
(100%)
8112
(100%)
663041
(100%)
Year 2010
Technical orientation Family farms
(1)
Family farms
(2)
Family
business
Corporate
farms
Total
Land-intensive 3980 (4%)
20218 (7%)
12012 (12%)
1839 (28%)
38049 (8%)
Permanent crops 23419 (21%)
30395 (11%)
32131 (31%)
2613 (40%)
88558 (18%)
Intensive/extensive 1738 (2%)
53457 (20%)
11227 (11%)
220 (3%)
66642 (14%)
Extensive, field crops 41811 (38%)
85074 (31%)
33115 (32%)
1242 (19%)
161242 (33%)
Extensive, livestock 39576 (36%)
82651 (30%)
13984 (14%)
682 (10%)
136893 (28%)
Total 110524 (100%)
271795 (100%)
102469 (100%)
6596 (100%)
491384 (100%)
32
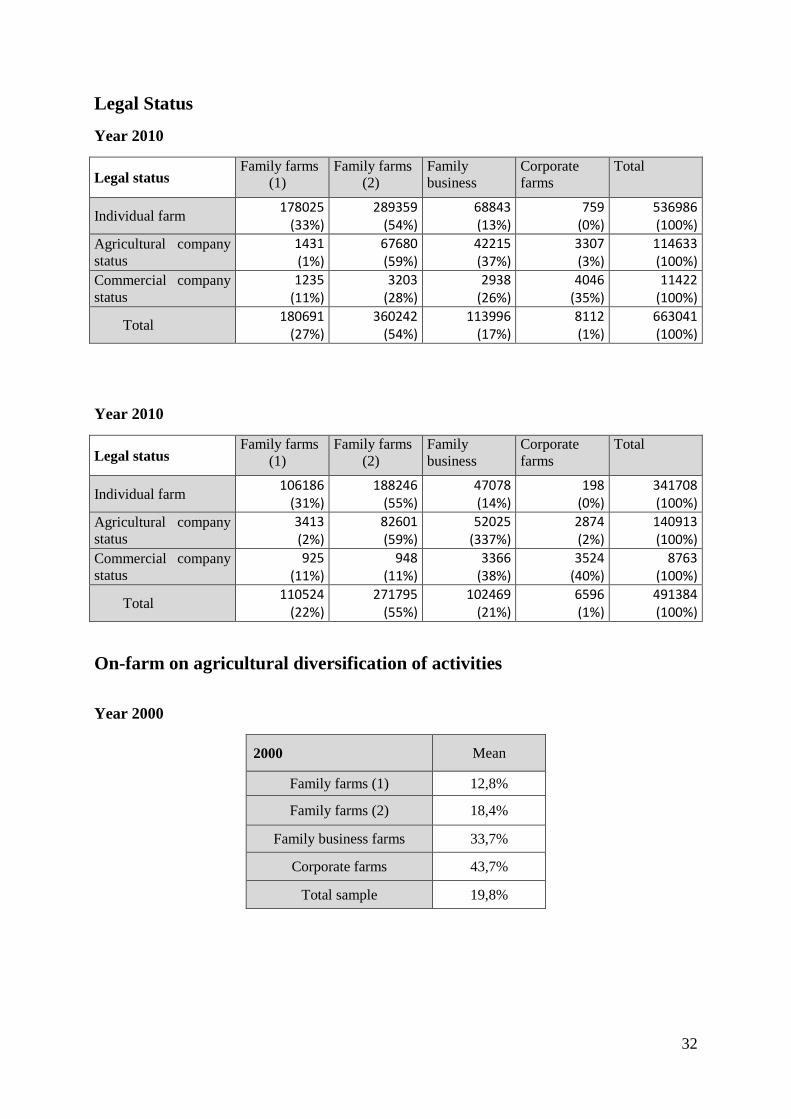
Legal Status
Year 2010
Legal status Family farms
(1)
Family farms
(2)
Family
business
Corporate
farms
Total
Individual farm 178025
(33%) 289359
(54%) 68843 (13%)
759 (0%)
536986 (100%)
Agricultural company
status
1431 (1%)
67680 (59%)
42215 (37%)
3307 (3%)
114633 (100%)
Commercial company
status
1235 (11%)
3203 (28%)
2938 (26%)
4046 (35%)
11422 (100%)
Total 180691
(27%) 360242
(54%) 113996
(17%) 8112 (1%)
663041 (100%)
Year 2010
Legal status Family farms
(1)
Family farms
(2)
Family
business
Corporate
farms
Total
Individual farm 106186
(31%) 188246
(55%) 47078 (14%)
198 (0%)
341708 (100%)
Agricultural company
status
3413 (2%)
82601 (59%)
52025 (337%)
2874 (2%)
140913 (100%)
Commercial company
status
925 (11%)
948 (11%)
3366 (38%)
3524 (40%)
8763 (100%)
Total 110524
(22%) 271795
(55%) 102469
(21%) 6596 (1%)
491384 (100%)
On-farm on agricultural diversification of activities
Year 2000
2000 Mean
Family farms (1) 12,8%
Family farms (2) 18,4%
Family business farms 33,7%
Corporate farms 43,7%
Total sample 19,8%
33
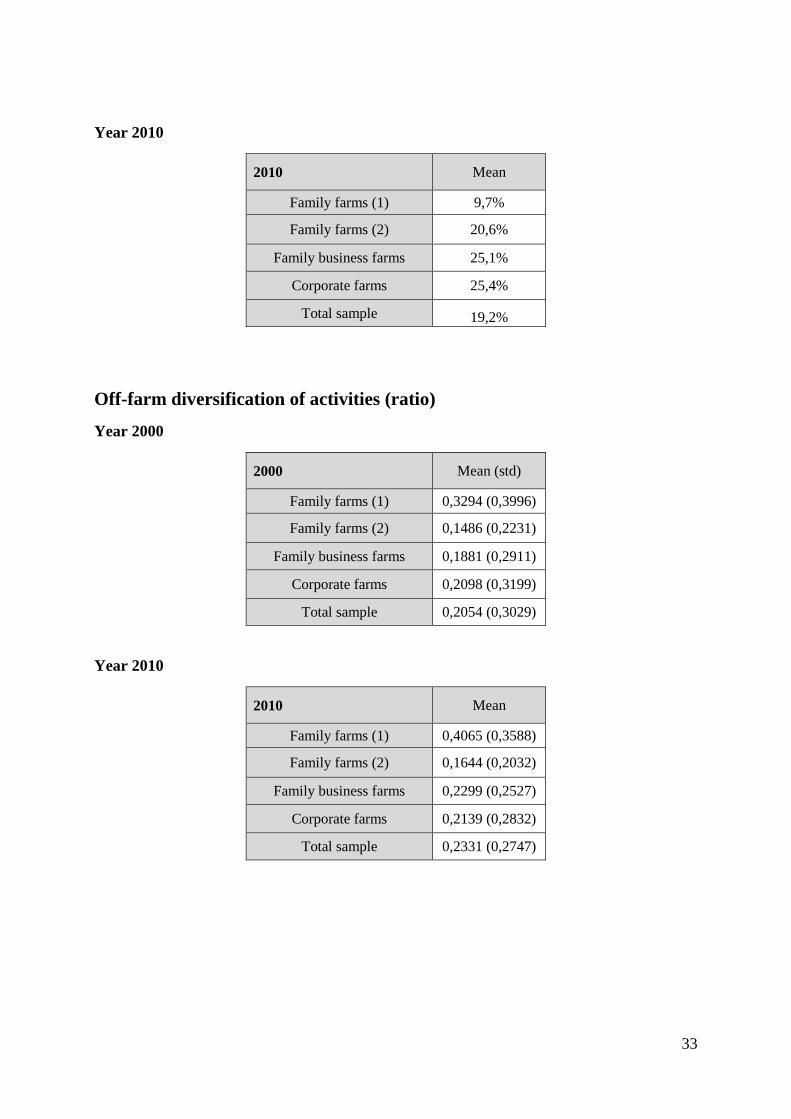
Year 2010
2010 Mean
Family farms (1) 9,7%
Family farms (2) 20,6%
Family business farms 25,1%
Corporate farms 25,4%
Total sample 19,2%
Off-farm diversification of activities (ratio)
Year 2000
2000 Mean (std)
Family farms (1) 0,3294 (0,3996)
Family farms (2) 0,1486 (0,2231)
Family business farms 0,1881 (0,2911)
Corporate farms 0,2098 (0,3199)
Total sample 0,2054 (0,3029)
Year 2010
2010 Mean
Family farms (1) 0,4065 (0,3588)
Family farms (2) 0,1644 (0,2032)
Family business farms 0,2299 (0,2527)
Corporate farms 0,2139 (0,2832)
Total sample 0,2331 (0,2747)
34
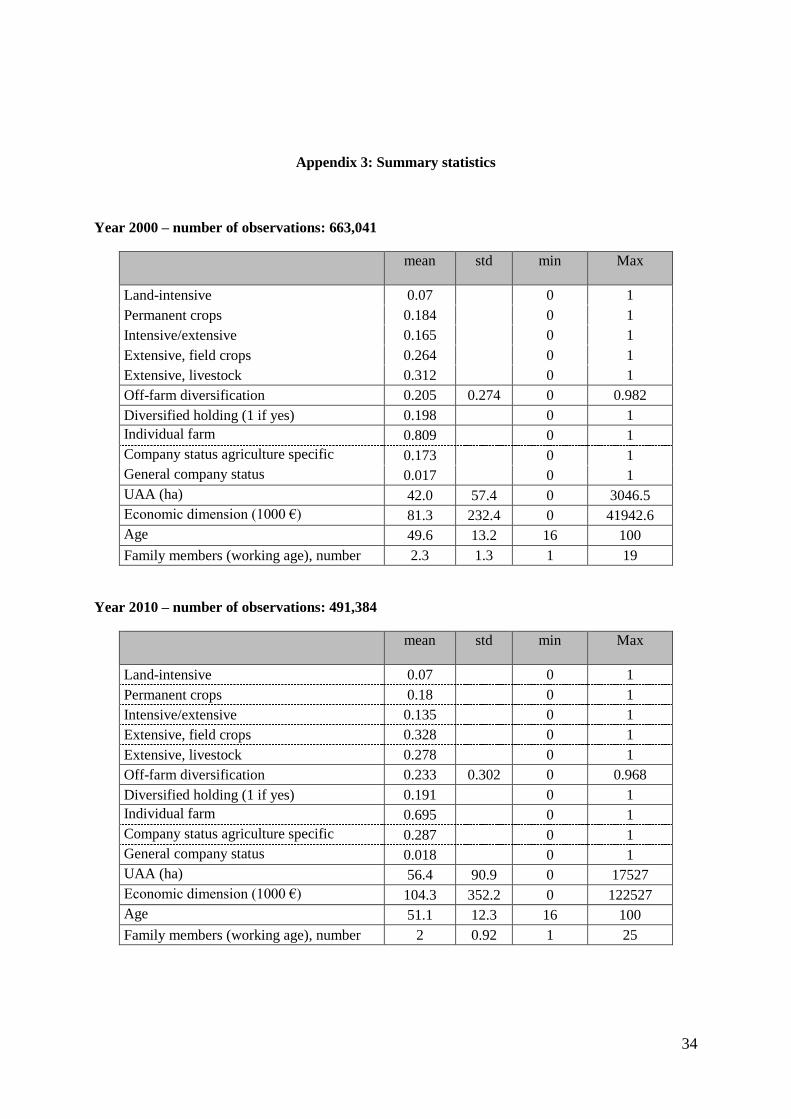
Appendix 3: Summary statistics
Year 2000 – number of observations: 663,041
mean std min Max
Land-intensive 0.07 0 1
Permanent crops 0.184 0 1
Intensive/extensive 0.165 0 1
Extensive, field crops 0.264 0 1
Extensive, livestock 0.312 0 1
Off-farm diversification 0.205 0.274 0 0.982
Diversified holding (1 if yes) 0.198 0 1
Individual farm 0.809 0 1
Company status agriculture specific 0.173 0 1
General company status 0.017 0 1
UAA (ha) 42.0 57.4 0 3046.5
Economic dimension (1000 €) 81.3 232.4 0 41942.6
Age 49.6 13.2 16 100
Family members (working age), number 2.3 1.3 1 19
Year 2010 – number of observations: 491,384
mean std min Max
Land-intensive 0.07 0 1
Permanent crops 0.18 0 1
Intensive/extensive 0.135 0 1
Extensive, field crops 0.328 0 1
Extensive, livestock 0.278 0 1
Off-farm diversification 0.233 0.302 0 0.968
Diversified holding (1 if yes) 0.191 0 1
Individual farm 0.695 0 1
Company status agriculture specific 0.287 0 1
General company status 0.018 0 1
UAA (ha) 56.4 90.9 0 17527
Economic dimension (1000 €) 104.3 352.2 0 122527
Age 51.1 12.3 16 100
Family members (working age), number 2 0.92 1 25


