Exploring Hemodynamics by Raycasting 4D MRI Flow · Exploring Hemodynamics by Raycasting 4D MRI...
8
Exploring Hemodynamics by Raycasting 4D MRI Flow R. van Pelt 1 , J. Oliván Bescós 2 , M. Breeuwer 2 , M. E. Gröller 3 , B. ter Haar Romeny 1 and A. Vilanova 1 1 Department of Biomedical Engineering, Eindhoven University of Technology, The Netherlands 2 Department of Clinical Sciences and Advanced Development, Philips Healthcare, The Netherlands 3 Department of Computer Graphics and Algorithms, Vienna University of Technology, Austria Keywords: Volume Visualization, Flow Visualization, Raycasting, Magnetic Resonance Angiography. Abstract Flow sensitive phase-contrast magnetic resonance imaging sequences produce three-dimensional veloc- ity fields in time, providing quantitative information of blood flow dynamics. Thorough understanding of the hemodynamic behavior will support physicians to di- agnose and assess risk of various cardiovascular dis- eases. However, inspection of the complex cine flow data, encompassing both morphology and function, is generally a troublesome and tedious task. Over the last few decades, the field of scientific flow visu- alization has introduced a multitude of techniques to explore unsteady velocity fields, in order to capture and depict flow characteristics. Inspired by concepts from ultrasound imaging, we have investigated ray- casting as a means to explore and visualize direction and magnitude of blood velocities, striving to reveal the blood flow behavior. In particular, we aim to de- pict flow patterns that deviate from the expected blood flow. For that purpose, several interaction techniques have been incorporated into the presented framework. Angles between a user-defined direction, set by an in- teraction widget, and the velocity field are mapped to different visual cues using a transfer function. Fur- thermore, we define the prevalent flow as approximate of the expected blood flow, generated based on the vessel centerline. We visualize a projection of the an- gles between the prevalent flow and the velocity field. 1 Introduction Magnetic Resonance Imaging (MRI) techniques are known to acquire accurate anatomic depictions of the heart and vessels. In addition, the MRI acquisi- tion process is intrinsically sensitive to flow. Phase- Contrast (PC) MRI sequences exploit this character- istic to obtain quantitative information of the blood flow within a predefined velocity range. Typical PC protocols provide a two-dimensional slab, compris- ing the through-plane flow directions. Best results are achieved when the slab is acquired orthogonal to the vessel structure of interest, requiring careful planning by a skilled operator. Three-dimensional, isotropic PC-MRI imaging se- quences overcome the operator dependency, and rule out repeated acquisitions when the resulting quality does not meet expectations. The desired slab can be determined offline, by a planar reformat of the volu- metric data. Generally, the data is inspected based on the reformatted slab, using both qualitative and quan- titative techniques similar to the ones applied for two- dimensional PC imaging. Current research concerning cardiac and vascular flow behavior focusses on understanding flow pat- terns. Various publications describe strong indica- tions that atypical flow patterns can be related to med- ical conditions [1, 4, 5, 11]. Therefore, insight into the hemodynamics is necessary to reveal these relations. In the future, knowledge of the hemodynamics might support diagnosis and risk assessment of various car- diovascular diseases. Important application areas can be found in congenital diseases, valvular diseases and aortic anomalies. There is strong interest in quantitative information derived from the blood flow velocity field. This in- formation enables objective assessment of the blood flow, based on a wide range of parameters. By means of these derived parameters, interpatient and intrapa- tient comparisons can be performed to analyze varia- tions of the hemodynamics. Furthermore, blood flow information potentially reveals characteristics of anatomical structures that are hardly visible on typical morphologic acquisi- tions. Small structures, such as the valves or the sep- tum, are too small to image with most acquisition pro- tocols. However, the surrounding velocity field can provide valuable information about the condition of the structure of interest. Insight into the complex behavior of unsteady blood flow can be obtained by means of expressive visualization and intuitive interaction. However, vi- sualization of three-dimensional unsteady flow fields 1
Transcript of Exploring Hemodynamics by Raycasting 4D MRI Flow · Exploring Hemodynamics by Raycasting 4D MRI...
Exploring Hemodynamics by Raycasting 4D MRI Flow
R. van Pelt 1, J. Oliván Bescós 2, M. Breeuwer 2, M. E. Gröller 3, B. ter Haar Romeny 1 and A. Vilanova 1
1Department of Biomedical Engineering, Eindhoven University of Technology, The Netherlands2Department of Clinical Sciences and Advanced Development, Philips Healthcare, The Netherlands
3Department of Computer Graphics and Algorithms, Vienna University of Technology, Austria
Keywords: Volume Visualization, Flow Visualization, Raycasting, Magnetic Resonance Angiography.
Abstract
Flow sensitive phase-contrast magnetic resonanceimaging sequences produce three-dimensional veloc-ity fields in time, providing quantitative information ofblood flow dynamics. Thorough understanding of thehemodynamic behavior will support physicians to di-agnose and assess risk of various cardiovascular dis-eases. However, inspection of the complex cine flowdata, encompassing both morphology and function,is generally a troublesome and tedious task. Overthe last few decades, the field of scientific flow visu-alization has introduced a multitude of techniques toexplore unsteady velocity fields, in order to captureand depict flow characteristics. Inspired by conceptsfrom ultrasound imaging, we have investigated ray-casting as a means to explore and visualize directionand magnitude of blood velocities, striving to revealthe blood flow behavior. In particular, we aim to de-pict flow patterns that deviate from the expected bloodflow. For that purpose, several interaction techniqueshave been incorporated into the presented framework.Angles between a user-defined direction, set by an in-teraction widget, and the velocity field are mappedto different visual cues using a transfer function. Fur-thermore, we define the prevalent flow as approximateof the expected blood flow, generated based on thevessel centerline. We visualize a projection of the an-gles between the prevalent flow and the velocity field.
1 Introduction
Magnetic Resonance Imaging (MRI) techniquesare known to acquire accurate anatomic depictions ofthe heart and vessels. In addition, the MRI acquisi-tion process is intrinsically sensitive to flow. Phase-Contrast (PC) MRI sequences exploit this character-istic to obtain quantitative information of the bloodflow within a predefined velocity range. Typical PCprotocols provide a two-dimensional slab, compris-ing the through-plane flow directions. Best results are
achieved when the slab is acquired orthogonal to thevessel structure of interest, requiring careful planningby a skilled operator.
Three-dimensional, isotropic PC-MRI imaging se-quences overcome the operator dependency, and ruleout repeated acquisitions when the resulting qualitydoes not meet expectations. The desired slab can bedetermined offline, by a planar reformat of the volu-metric data. Generally, the data is inspected based onthe reformatted slab, using both qualitative and quan-titative techniques similar to the ones applied for two-dimensional PC imaging.
Current research concerning cardiac and vascularflow behavior focusses on understanding flow pat-terns. Various publications describe strong indica-tions that atypical flow patterns can be related to med-ical conditions [1,4,5,11]. Therefore, insight into thehemodynamics is necessary to reveal these relations.In the future, knowledge of the hemodynamics mightsupport diagnosis and risk assessment of various car-diovascular diseases. Important application areas canbe found in congenital diseases, valvular diseases andaortic anomalies.
There is strong interest in quantitative informationderived from the blood flow velocity field. This in-formation enables objective assessment of the bloodflow, based on a wide range of parameters. By meansof these derived parameters, interpatient and intrapa-tient comparisons can be performed to analyze varia-tions of the hemodynamics.
Furthermore, blood flow information potentiallyreveals characteristics of anatomical structures thatare hardly visible on typical morphologic acquisi-tions. Small structures, such as the valves or the sep-tum, are too small to image with most acquisition pro-tocols. However, the surrounding velocity field canprovide valuable information about the condition ofthe structure of interest.
Insight into the complex behavior of unsteadyblood flow can be obtained by means of expressivevisualization and intuitive interaction. However, vi-sualization of three-dimensional unsteady flow fields
1
Transfer Function Interaction Widget
Prev
alen
t Flo
wSe
lect
ion
Volu
me
Velo
city
Dat
a
\\ View vector angles
alpha = dot(eyeNormal, velocityNormal);
src = texture1D(tf, (alpha+1.0)/2.0);
...
\\ Widget vector angles
beta = dot(widgetNormal, velocityNormal);
src = texture1D(tf, (beta+1.0)/2.0);
...
Vector Field Raycasting Shader Program
\\ Prevalent flow angles
gamma = dot(prevNormal, velocityNormal);
src = texture1D(tf, (gamma+1.0)/2.0);
...
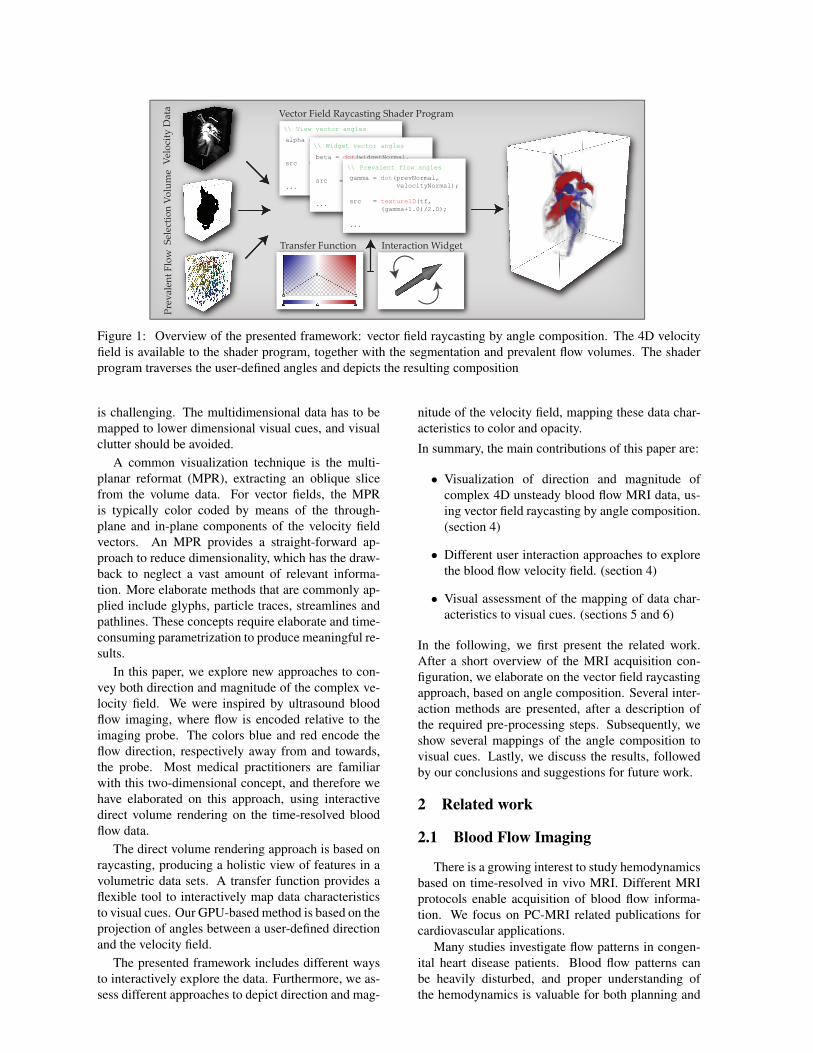
Figure 1: Overview of the presented framework: vector field raycasting by angle composition. The 4D velocityfield is available to the shader program, together with the segmentation and prevalent flow volumes. The shaderprogram traverses the user-defined angles and depicts the resulting composition
is challenging. The multidimensional data has to bemapped to lower dimensional visual cues, and visualclutter should be avoided.
A common visualization technique is the multi-planar reformat (MPR), extracting an oblique slicefrom the volume data. For vector fields, the MPRis typically color coded by means of the through-plane and in-plane components of the velocity fieldvectors. An MPR provides a straight-forward ap-proach to reduce dimensionality, which has the draw-back to neglect a vast amount of relevant informa-tion. More elaborate methods that are commonly ap-plied include glyphs, particle traces, streamlines andpathlines. These concepts require elaborate and time-consuming parametrization to produce meaningful re-sults.
In this paper, we explore new approaches to con-vey both direction and magnitude of the complex ve-locity field. We were inspired by ultrasound bloodflow imaging, where flow is encoded relative to theimaging probe. The colors blue and red encode theflow direction, respectively away from and towards,the probe. Most medical practitioners are familiarwith this two-dimensional concept, and therefore wehave elaborated on this approach, using interactivedirect volume rendering on the time-resolved bloodflow data.
The direct volume rendering approach is based onraycasting, producing a holistic view of features in avolumetric data sets. A transfer function provides aflexible tool to interactively map data characteristicsto visual cues. Our GPU-based method is based on theprojection of angles between a user-defined directionand the velocity field.
The presented framework includes different waysto interactively explore the data. Furthermore, we as-sess different approaches to depict direction and mag-
nitude of the velocity field, mapping these data char-acteristics to color and opacity.
In summary, the main contributions of this paper are:
• Visualization of direction and magnitude ofcomplex 4D unsteady blood flow MRI data, us-ing vector field raycasting by angle composition.(section 4)
• Different user interaction approaches to explorethe blood flow velocity field. (section 4)
• Visual assessment of the mapping of data char-acteristics to visual cues. (sections 5 and 6)
In the following, we first present the related work.After a short overview of the MRI acquisition con-figuration, we elaborate on the vector field raycastingapproach, based on angle composition. Several inter-action methods are presented, after a description ofthe required pre-processing steps. Subsequently, weshow several mappings of the angle composition tovisual cues. Lastly, we discuss the results, followedby our conclusions and suggestions for future work.
2 Related work
2.1 Blood Flow Imaging
There is a growing interest to study hemodynamicsbased on time-resolved in vivo MRI. Different MRIprotocols enable acquisition of blood flow informa-tion. We focus on PC-MRI related publications forcardiovascular applications.
Many studies investigate flow patterns in congen-ital heart disease patients. Blood flow patterns canbe heavily disturbed, and proper understanding ofthe hemodynamics is valuable for both planning and
v
eα
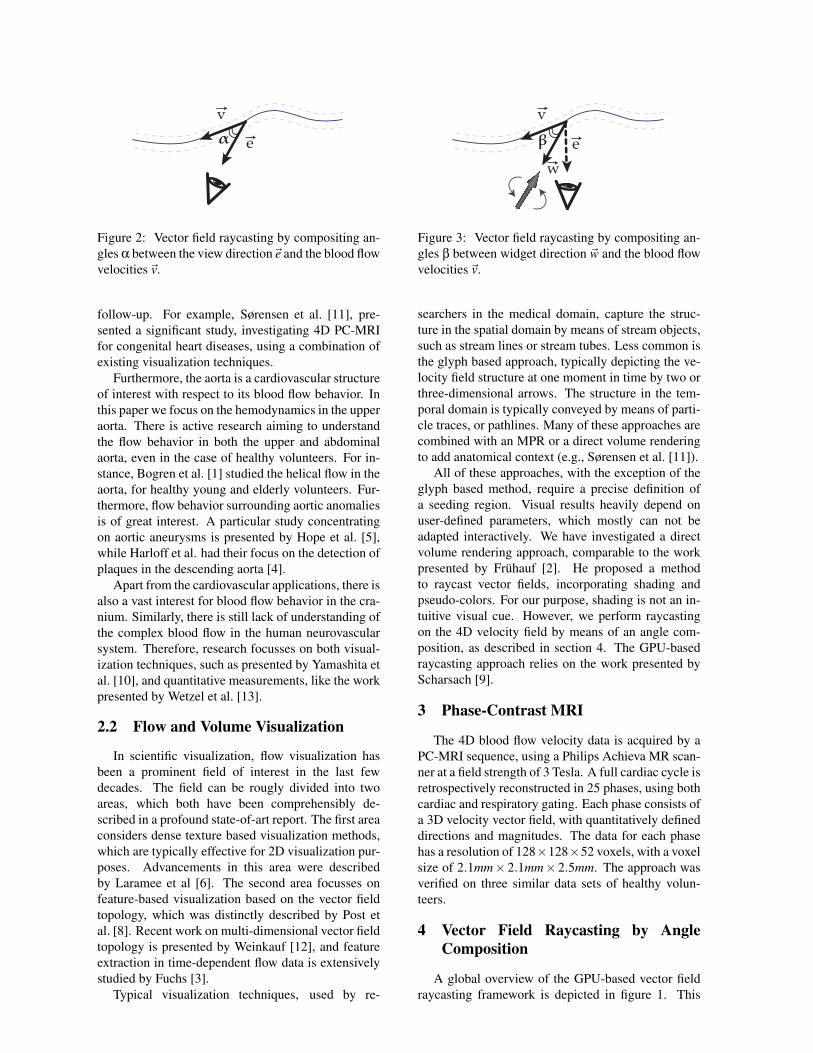
Figure 2: Vector field raycasting by compositing an-gles α between the view direction~e and the blood flowvelocities~v.
follow-up. For example, Sørensen et al. [11], pre-sented a significant study, investigating 4D PC-MRIfor congenital heart diseases, using a combination ofexisting visualization techniques.
Furthermore, the aorta is a cardiovascular structureof interest with respect to its blood flow behavior. Inthis paper we focus on the hemodynamics in the upperaorta. There is active research aiming to understandthe flow behavior in both the upper and abdominalaorta, even in the case of healthy volunteers. For in-stance, Bogren et al. [1] studied the helical flow in theaorta, for healthy young and elderly volunteers. Fur-thermore, flow behavior surrounding aortic anomaliesis of great interest. A particular study concentratingon aortic aneurysms is presented by Hope et al. [5],while Harloff et al. had their focus on the detection ofplaques in the descending aorta [4].
Apart from the cardiovascular applications, there isalso a vast interest for blood flow behavior in the cra-nium. Similarly, there is still lack of understanding ofthe complex blood flow in the human neurovascularsystem. Therefore, research focusses on both visual-ization techniques, such as presented by Yamashita etal. [10], and quantitative measurements, like the workpresented by Wetzel et al. [13].
2.2 Flow and Volume Visualization
In scientific visualization, flow visualization hasbeen a prominent field of interest in the last fewdecades. The field can be rougly divided into twoareas, which both have been comprehensibly de-scribed in a profound state-of-art report. The first areaconsiders dense texture based visualization methods,which are typically effective for 2D visualization pur-poses. Advancements in this area were describedby Laramee et al [6]. The second area focusses onfeature-based visualization based on the vector fieldtopology, which was distinctly described by Post etal. [8]. Recent work on multi-dimensional vector fieldtopology is presented by Weinkauf [12], and featureextraction in time-dependent flow data is extensivelystudied by Fuchs [3].
Typical visualization techniques, used by re-
β
v
ew
Figure 3: Vector field raycasting by compositing an-gles β between widget direction ~w and the blood flowvelocities~v.
searchers in the medical domain, capture the struc-ture in the spatial domain by means of stream objects,such as stream lines or stream tubes. Less common isthe glyph based approach, typically depicting the ve-locity field structure at one moment in time by two orthree-dimensional arrows. The structure in the tem-poral domain is typically conveyed by means of parti-cle traces, or pathlines. Many of these approaches arecombined with an MPR or a direct volume renderingto add anatomical context (e.g., Sørensen et al. [11]).
All of these approaches, with the exception of theglyph based method, require a precise definition ofa seeding region. Visual results heavily depend onuser-defined parameters, which mostly can not beadapted interactively. We have investigated a directvolume rendering approach, comparable to the workpresented by Frühauf [2]. He proposed a methodto raycast vector fields, incorporating shading andpseudo-colors. For our purpose, shading is not an in-tuitive visual cue. However, we perform raycastingon the 4D velocity field by means of an angle com-position, as described in section 4. The GPU-basedraycasting approach relies on the work presented byScharsach [9].
3 Phase-Contrast MRI
The 4D blood flow velocity data is acquired by aPC-MRI sequence, using a Philips Achieva MR scan-ner at a field strength of 3 Tesla. A full cardiac cycle isretrospectively reconstructed in 25 phases, using bothcardiac and respiratory gating. Each phase consists ofa 3D velocity vector field, with quantitatively defineddirections and magnitudes. The data for each phasehas a resolution of 128×128×52 voxels, with a voxelsize of 2.1mm× 2.1mm× 2.5mm. The approach wasverified on three similar data sets of healthy volun-teers.
4 Vector Field Raycasting by AngleComposition
A global overview of the GPU-based vector fieldraycasting framework is depicted in figure 1. This
section describes the framework, comprising differentapproaches to raycast the blood flow velocity field.
4.1 Pre-processing
The velocity-encoded data typically contains aconsiderable amount of acquisition artefacts, in par-ticular in the stationary areas. Incorrect high intensityvalues in these areas lead to erroneous velocity vec-tors. For that reason, the structures of interest need tobe segmented, removing these erroneous vectors. Inthe past, extensive automated segmentation methodshave been presented, such as the level set approachby Persson et al. [7]. We focus on the visualizationaspects, and take a manual approach to segment thestructures. This allows us to define, select and visual-ize the desired structures.
Manual segmentation of all cardiac phases for eachof the data sets is a tedious task, while an exactsegmentation of the structures for each phase in notstrictly required. Instead, a static segmentation of theareas where flow can occur suffices to suppress theerroneous velocity vectors in regions without bloodflow. This oversized segmentation can be applied toall phases of the cardiac cycles, and by definition en-compasses the blood flow volume-of-interest.
For this purpose, a new volumetric data set is de-rived from the full cine velocity data (vti(~x)). For eachvoxel position~x of the new volume, the maximum ve-locity magnitude is projected along the time axis t.This process, called a Temporal Maximum IntensityProjection (T-MIP), is defined as follows for T car-diac phases:
T-MIP(~x) = maxti
(‖vti(~x)‖) for i = 0, ...,T −1
The T-MIP volume encodes all areas where flow oc-curs in one of the cadiac phases by high intensities,taking the pulsating movement of the aorta into ac-count. Note that also the erroneous velocity vectorsmay be projected into the new volume. Thereforea manual segmentation is required, for which the T-MIP volume provides a proper basis. This reduces themanual workload to only a single volume, as opposedto a volume for each of the cardiac phases.
The resulting segmentation is stored as a binary se-lection volume, and is provided to the shader program(see figure 1). In this paper, we focus on the upperaorta. In all figures throughout the paper, the seg-mented area is depicted by a semi-transparent surface,providing context to the blood flow features. Keep inmind that this surface represents the largest volumein which flow can occur over time, as opposed to themorphological boundary of the vessel structure.
4.2 Angles: User-Defined Vector and Ve-locity Field
Using the vector field raycasting approach, westrive to reveal both directions and magnitudes of theunsteady flow field. Straightforward color-mappingsdo not suffice, since vectors of the velocity field havea sign. We propose an approach to raycast the multi-dimensional vector field, compositing angles betweena user-defined vector and the velocity field vectors.This allows directions and magnitudes to be conveyedusing limited visual cues, while interactively explor-ing the data.
In the first approach, schematically depicted in fig-ure 2, the raycasting is based on the angles betweenthe view direction~e and the velocity field vectors~v(~x).The solid blue line depicts the direction of the velocityfield, where only vector~v is highlighted. The dashedlines illustrate the continuation of velocity field, out-side the scope of the considered vector. In the remain-der of this chapter, all operations take place in the spa-tial domain, and therefore time will be discarded inthe formulations. For each position ~x in the volume,the angle is determined by the dot product as follows:
α(~x) = arccos(~e ·~v(~x))
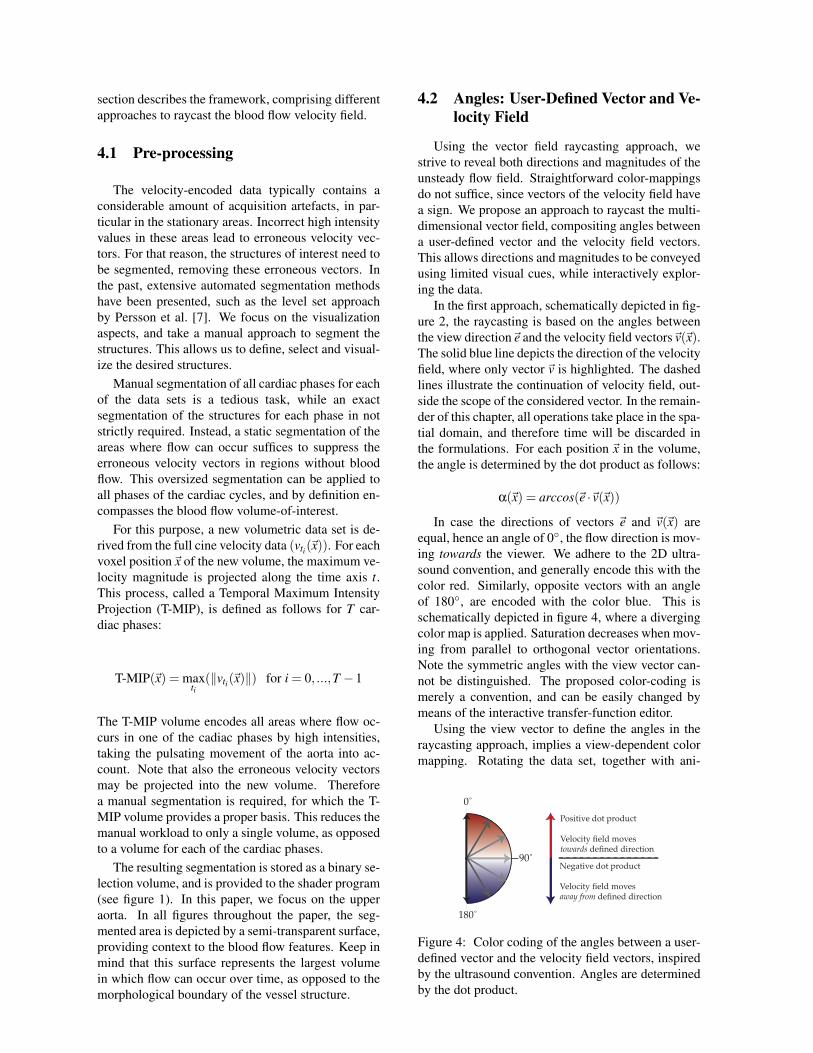
In case the directions of vectors ~e and ~v(~x) areequal, hence an angle of 0◦, the flow direction is mov-ing towards the viewer. We adhere to the 2D ultra-sound convention, and generally encode this with thecolor red. Similarly, opposite vectors with an angleof 180◦, are encoded with the color blue. This isschematically depicted in figure 4, where a divergingcolor map is applied. Saturation decreases when mov-ing from parallel to orthogonal vector orientations.Note the symmetric angles with the view vector can-not be distinguished. The proposed color-coding ismerely a convention, and can be easily changed bymeans of the interactive transfer-function editor.
Using the view vector to define the angles in theraycasting approach, implies a view-dependent colormapping. Rotating the data set, together with ani-
180˚
0˚
90˚
Positive dot product
Velocity field movestowards defined direction
Negative dot product
Velocity field movesaway from defined direction
Figure 4: Color coding of the angles between a user-defined vector and the velocity field vectors, inspiredby the ultrasound convention. Angles are determinedby the dot product.
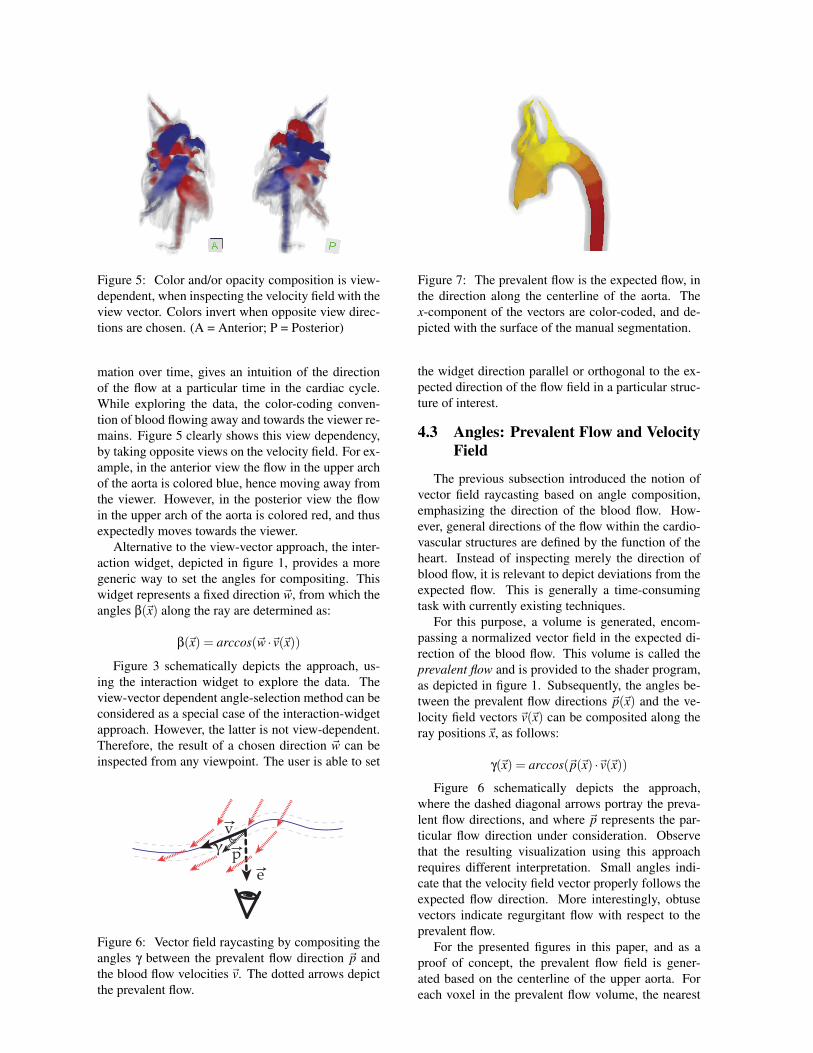
Figure 5: Color and/or opacity composition is view-dependent, when inspecting the velocity field with theview vector. Colors invert when opposite view direc-tions are chosen. (A = Anterior; P = Posterior)
mation over time, gives an intuition of the directionof the flow at a particular time in the cardiac cycle.While exploring the data, the color-coding conven-tion of blood flowing away and towards the viewer re-mains. Figure 5 clearly shows this view dependency,by taking opposite views on the velocity field. For ex-ample, in the anterior view the flow in the upper archof the aorta is colored blue, hence moving away fromthe viewer. However, in the posterior view the flowin the upper arch of the aorta is colored red, and thusexpectedly moves towards the viewer.
Alternative to the view-vector approach, the inter-action widget, depicted in figure 1, provides a moregeneric way to set the angles for compositing. Thiswidget represents a fixed direction ~w, from which theangles β(~x) along the ray are determined as:
β(~x) = arccos(~w ·~v(~x))
Figure 3 schematically depicts the approach, us-ing the interaction widget to explore the data. Theview-vector dependent angle-selection method can beconsidered as a special case of the interaction-widgetapproach. However, the latter is not view-dependent.Therefore, the result of a chosen direction ~w can beinspected from any viewpoint. The user is able to set
γv
ep
Figure 6: Vector field raycasting by compositing theangles γ between the prevalent flow direction ~p andthe blood flow velocities ~v. The dotted arrows depictthe prevalent flow.
Figure 7: The prevalent flow is the expected flow, inthe direction along the centerline of the aorta. Thex-component of the vectors are color-coded, and de-picted with the surface of the manual segmentation.
the widget direction parallel or orthogonal to the ex-pected direction of the flow field in a particular struc-ture of interest.
4.3 Angles: Prevalent Flow and VelocityField
The previous subsection introduced the notion ofvector field raycasting based on angle composition,emphasizing the direction of the blood flow. How-ever, general directions of the flow within the cardio-vascular structures are defined by the function of theheart. Instead of inspecting merely the direction ofblood flow, it is relevant to depict deviations from theexpected flow. This is generally a time-consumingtask with currently existing techniques.
For this purpose, a volume is generated, encom-passing a normalized vector field in the expected di-rection of the blood flow. This volume is called theprevalent flow and is provided to the shader program,as depicted in figure 1. Subsequently, the angles be-tween the prevalent flow directions ~p(~x) and the ve-locity field vectors ~v(~x) can be composited along theray positions~x, as follows:
γ(~x) = arccos(~p(~x) ·~v(~x))
Figure 6 schematically depicts the approach,where the dashed diagonal arrows portray the preva-lent flow directions, and where ~p represents the par-ticular flow direction under consideration. Observethat the resulting visualization using this approachrequires different interpretation. Small angles indi-cate that the velocity field vector properly follows theexpected flow direction. More interestingly, obtusevectors indicate regurgitant flow with respect to theprevalent flow.
For the presented figures in this paper, and as aproof of concept, the prevalent flow field is gener-ated based on the centerline of the upper aorta. Foreach voxel in the prevalent flow volume, the nearest
Mapping 1
Color: AnglesOpacity: Magnitudes
Mapping 2
Color: AnglesOpacity: Angles
Mapping 3
Color: MagnitudesOpacity: Angles
Transfer FunctionWidget Vector Prevalent FlowView Vector 1
0
1
0
1
0
0
-1
200 cm/s
200 cm/s
-1 0 1
-1 0 1
0 1
-1 0 1
0
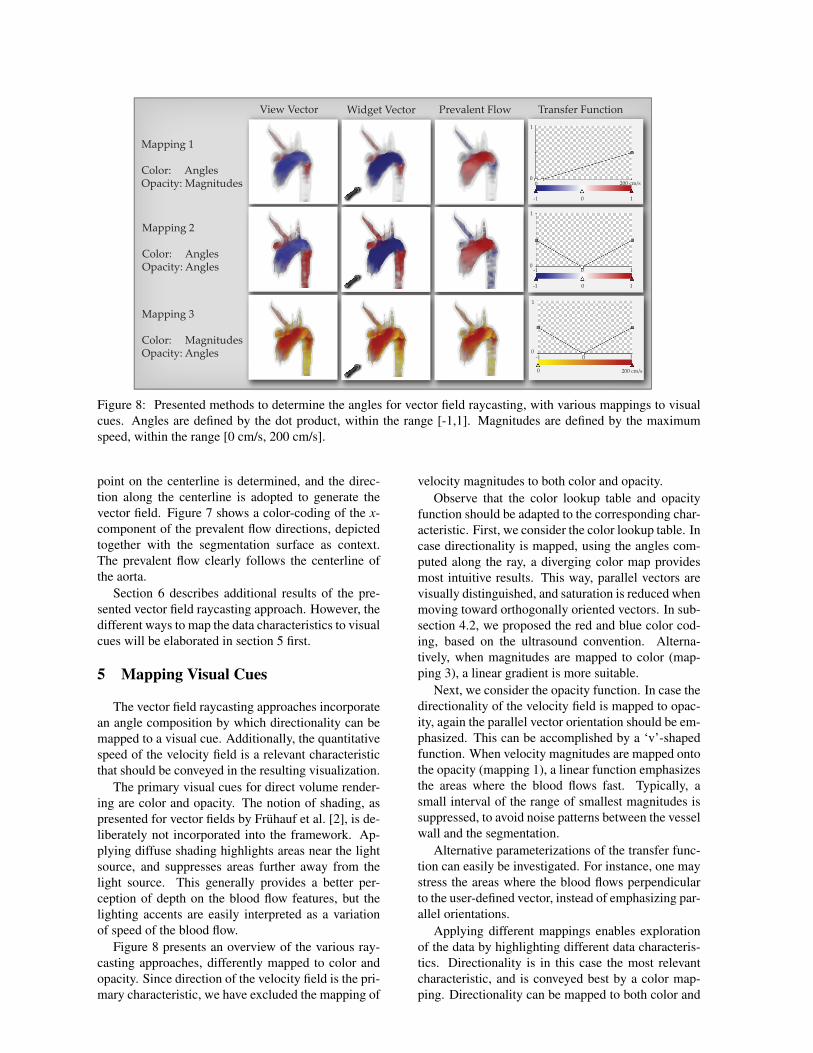
Figure 8: Presented methods to determine the angles for vector field raycasting, with various mappings to visualcues. Angles are defined by the dot product, within the range [-1,1]. Magnitudes are defined by the maximumspeed, within the range [0 cm/s, 200 cm/s].
point on the centerline is determined, and the direc-tion along the centerline is adopted to generate thevector field. Figure 7 shows a color-coding of the x-component of the prevalent flow directions, depictedtogether with the segmentation surface as context.The prevalent flow clearly follows the centerline ofthe aorta.
Section 6 describes additional results of the pre-sented vector field raycasting approach. However, thedifferent ways to map the data characteristics to visualcues will be elaborated in section 5 first.
5 Mapping Visual Cues
The vector field raycasting approaches incorporatean angle composition by which directionality can bemapped to a visual cue. Additionally, the quantitativespeed of the velocity field is a relevant characteristicthat should be conveyed in the resulting visualization.
The primary visual cues for direct volume render-ing are color and opacity. The notion of shading, aspresented for vector fields by Frühauf et al. [2], is de-liberately not incorporated into the framework. Ap-plying diffuse shading highlights areas near the lightsource, and suppresses areas further away from thelight source. This generally provides a better per-ception of depth on the blood flow features, but thelighting accents are easily interpreted as a variationof speed of the blood flow.
Figure 8 presents an overview of the various ray-casting approaches, differently mapped to color andopacity. Since direction of the velocity field is the pri-mary characteristic, we have excluded the mapping of
velocity magnitudes to both color and opacity.Observe that the color lookup table and opacity
function should be adapted to the corresponding char-acteristic. First, we consider the color lookup table. Incase directionality is mapped, using the angles com-puted along the ray, a diverging color map providesmost intuitive results. This way, parallel vectors arevisually distinguished, and saturation is reduced whenmoving toward orthogonally oriented vectors. In sub-section 4.2, we proposed the red and blue color cod-ing, based on the ultrasound convention. Alterna-tively, when magnitudes are mapped to color (map-ping 3), a linear gradient is more suitable.
Next, we consider the opacity function. In case thedirectionality of the velocity field is mapped to opac-ity, again the parallel vector orientation should be em-phasized. This can be accomplished by a ‘v’-shapedfunction. When velocity magnitudes are mapped ontothe opacity (mapping 1), a linear function emphasizesthe areas where the blood flows fast. Typically, asmall interval of the range of smallest magnitudes issuppressed, to avoid noise patterns between the vesselwall and the segmentation.
Alternative parameterizations of the transfer func-tion can easily be investigated. For instance, one maystress the areas where the blood flows perpendicularto the user-defined vector, instead of emphasizing par-allel orientations.
Applying different mappings enables explorationof the data by highlighting different data characteris-tics. Directionality is in this case the most relevantcharacteristic, and is conveyed best by a color map-ping. Directionality can be mapped to both color and
180˚ 0˚ 180˚ 0˚
Wid
get V
ecto
r
Prev
alen
t Flo
w
t = 120ms t = 200ms t = 400ms t = 120ms t = 200ms t = 400ms
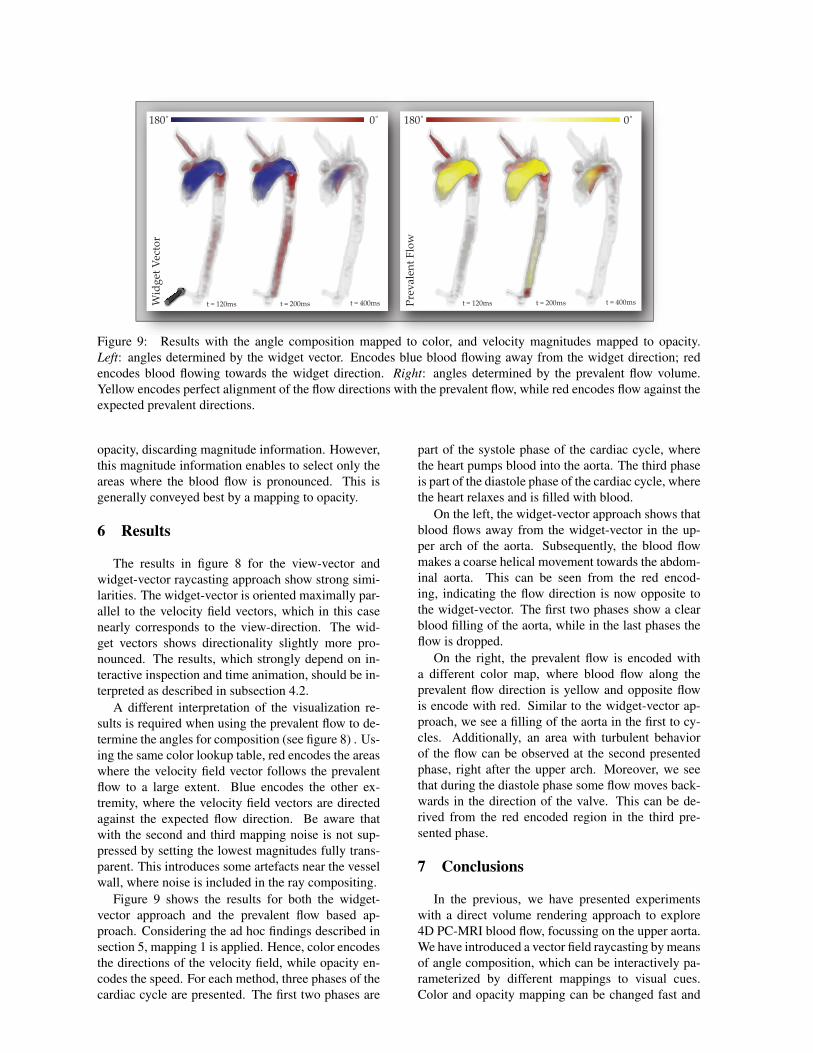
Figure 9: Results with the angle composition mapped to color, and velocity magnitudes mapped to opacity.Left: angles determined by the widget vector. Encodes blue blood flowing away from the widget direction; redencodes blood flowing towards the widget direction. Right: angles determined by the prevalent flow volume.Yellow encodes perfect alignment of the flow directions with the prevalent flow, while red encodes flow against theexpected prevalent directions.
opacity, discarding magnitude information. However,this magnitude information enables to select only theareas where the blood flow is pronounced. This isgenerally conveyed best by a mapping to opacity.
6 Results
The results in figure 8 for the view-vector andwidget-vector raycasting approach show strong simi-larities. The widget-vector is oriented maximally par-allel to the velocity field vectors, which in this casenearly corresponds to the view-direction. The wid-get vectors shows directionality slightly more pro-nounced. The results, which strongly depend on in-teractive inspection and time animation, should be in-terpreted as described in subsection 4.2.
A different interpretation of the visualization re-sults is required when using the prevalent flow to de-termine the angles for composition (see figure 8) . Us-ing the same color lookup table, red encodes the areaswhere the velocity field vector follows the prevalentflow to a large extent. Blue encodes the other ex-tremity, where the velocity field vectors are directedagainst the expected flow direction. Be aware thatwith the second and third mapping noise is not sup-pressed by setting the lowest magnitudes fully trans-parent. This introduces some artefacts near the vesselwall, where noise is included in the ray compositing.
Figure 9 shows the results for both the widget-vector approach and the prevalent flow based ap-proach. Considering the ad hoc findings described insection 5, mapping 1 is applied. Hence, color encodesthe directions of the velocity field, while opacity en-codes the speed. For each method, three phases of thecardiac cycle are presented. The first two phases are
part of the systole phase of the cardiac cycle, wherethe heart pumps blood into the aorta. The third phaseis part of the diastole phase of the cardiac cycle, wherethe heart relaxes and is filled with blood.
On the left, the widget-vector approach shows thatblood flows away from the widget-vector in the up-per arch of the aorta. Subsequently, the blood flowmakes a coarse helical movement towards the abdom-inal aorta. This can be seen from the red encod-ing, indicating the flow direction is now opposite tothe widget-vector. The first two phases show a clearblood filling of the aorta, while in the last phases theflow is dropped.
On the right, the prevalent flow is encoded witha different color map, where blood flow along theprevalent flow direction is yellow and opposite flowis encode with red. Similar to the widget-vector ap-proach, we see a filling of the aorta in the first to cy-cles. Additionally, an area with turbulent behaviorof the flow can be observed at the second presentedphase, right after the upper arch. Moreover, we seethat during the diastole phase some flow moves back-wards in the direction of the valve. This can be de-rived from the red encoded region in the third pre-sented phase.
7 Conclusions
In the previous, we have presented experimentswith a direct volume rendering approach to explore4D PC-MRI blood flow, focussing on the upper aorta.We have introduced a vector field raycasting by meansof angle composition, which can be interactively pa-rameterized by different mappings to visual cues.Color and opacity mapping can be changed fast and
intuitively by means of a transfer function. This incontrast to generally complicated, non real-time pa-rameterization of other customary techniques, such asstreamlines and particle traces. Our framework re-quires only limited pre-processing steps.
The initial results successfully show that directionand magnitude of the complex unsteady blood flowcan be conveyed, while exploring the data by meansof interaction and animation. We rely on MRI ac-quired data, which makes the approach more depend-able than Computational Fluid Dynamics (CFD) sim-ulations, which are based on a considerable amountof model assumptions.
The current framework still imposes some limita-tions. Typically, the angle composition accumulatesquickly to opaque, fully saturated colors. Therefore,subtle details of variation in the flow are lost. Also theprevalent flow approach, which provides a way to vi-sualize flow areas that deviate from the expected flowdirections, can be improved. The prevalent flow fieldcurrently follows the centerline of the aorta, and doesnot take helical flow into account.
8 Future Work
At this point, the framework is capable to depictthe global characteristics of the complex PC-MRIdata. With the prevalent flow approach, we showthat visualization of the deviations of the expectedflow is indeed promosing. Especially in combina-tion with interactive exploration methods, such as theview-vector and widget-vector based approach.
The framework can be improved by introducing amore accurate prevalent flow field, resulting in en-hanced depictions of deviating flow patterns. Onecould think of an artifical flow field, incorporating theexpected helicity of the flow, or even a field gener-ated by CFD simulations. This is a challenging sub-ject, since the direction of the helical flow varies fromperson to person. This direction should therefore beautomatically determined a priori.
The presented vector field raycasting techniqueshould be assessed by experts in the application do-main. We believe that with this method, deviatingpatterns, such as phase wraps, regurgitations and vor-tices, can be easily detected.
In the future, patient data will provide new visu-alization challenges. Specific cases of cardiovascu-lar diseases require different visualization techniques.Also then, proper validation of the results in the med-ical domain is necessary.
References
[1] H. G. Bogren and M. H. Buonocore. 4d mag-netic resonance velocity mapping of blood flowpatterns in the aorta in young vs. elderly nor-
mal subjects. Magnetic Resonance Imaging,10(5):861–869, 1999.
[2] T. Fruhauf. Raycasting vector fields. In Pro-ceedings of IEEE Visualization ’96, pages 115–ff., Los Alamitos, CA, USA, 1996.
[3] R. Fuchs. The Visible Vortex - Interactive Anal-ysis and Extraction of Vortices in Large Time-Dependent Flow Data Sets. PhD thesis, Instituteof Computer Graphics and Algorithms, ViennaUniversity of Technology, Oct. 2008.
[4] A. Harloff, C. Strecker, and A. P. Frydrychow-icz. Plaques in the descending aorta: A new riskfactor for stroke? visualization of potential em-bolization pathways by 4d mri. Magnetic Reso-nance Imaging, 26 6:1651–1655, 2007.
[5] T. A. Hope, M. Markl, L. Wigström, M. T. Alley,D. C. Miller, and R. J. Herfkens. Comparison offlow patterns in ascending aortic aneurysms andvolunteers using four-dimensional magnetic res-onance velocity mapping. Magnetic ResonanceImaging, 26:1417–1479, 2007.
[6] R. S. Laramee, H. Hauser, H. Doleisch,B. Vrolijk, F. H. Post, and D. Weiskopf. Thestate of the art in flow visualization: Dense andtexture-based techniques. Computer GraphicsForum, 23:2004, 2004.
[7] M. Persson, J. E. Solem, K. Markenroth,J. Svensson, and A. Heyden. Phase contrast mrisegmentation using velocity and intensity. ScaleSpace and PDE Methods in Computer Vision,pages 119–130, 2005.
[8] F. H. Post, B. Vrolijk, H. Hauser, R. S. Laramee,and H. Doleisch. The state of the art in flowvisualisation: Feature extraction and tracking.Computer Graphics Forum.
[9] H. Scharsach. Advanced gpu raycasting. In Pro-ceedings of CESCG, 2005.
[10] M. H. Shuhei Yamashita, Haruo Isoda. Visual-ization of hemodynamics in intracranial arteriesusing time-resolved three-dimensional phase-contrast mri. 25 3:473–478, 2007.
[11] T. S. Sørensen, P. Beerbaum, H. Körperich, andE. M. Pedersen. Three-dimensional, isotropicmri: a unified approach to quantification and vi-sualization in congenital heart disease. The In-ternational Journal of Cardiovascular Imaging,21(2):283–292, Apr 2005.
[12] T. Weinkauf. Extraction of Topological Struc-tures in 2D and 3D Vector Fields. PhD thesis,University Magdeburg, 2008.
[13] S. Wetzel, S. Meckel, A. Frydrychowicz,L. Bonati, E.-W. Radü, K. Scheffler, J. Hennig,and M. Markl. In vivo assessment and visualiza-tion of intracranial arterial hemodynamics withflow-sensitized 4d mr imaging at 3t. Neuroradi-ology, 28(3):433–438, 2007.